A Methodology for Determination and Definition of Key Performance Indicators for Smart Grids Development in Island Energy Systems


 ,
,  ,
, 
Abstract
:1. Introduction
1.1. Isolated Energy Systems Overview and Current Trends
1.2. KPI’s Role and Methodological Background
- meaningful: a KPI relates with one or several expected innovation impacts, and therefore makes sense, since it can contribute to reach the program overarching goals;
- understandable: the KPI definition is clearly related to the expected impacts of the studied innovation; and,
- quantifiable: experimental values coming from field testing at an appropriate scale are used to develop ad-hoc simulation tools that are able to estimate the expected innovation impacts.
1.3. Smart Grid Evaluation Frameworks
2. Methodology
2.1. Thematic Pillars
- DR services with the use of predictive algorithms;
- smartening the distribution grid through advanced monitoring and predictive models;
- energy storage provided with the use of Battery Energy Storage Systems (BESS) or heating storage, as well as storage management through models and algorithms;
- smart integration of grid users through the transportation sector, using the flexible capacity of electric vehicles and boats; and,
- domestic heating/cooling systems, using renewable technologies coupled with energy/heat storage options.
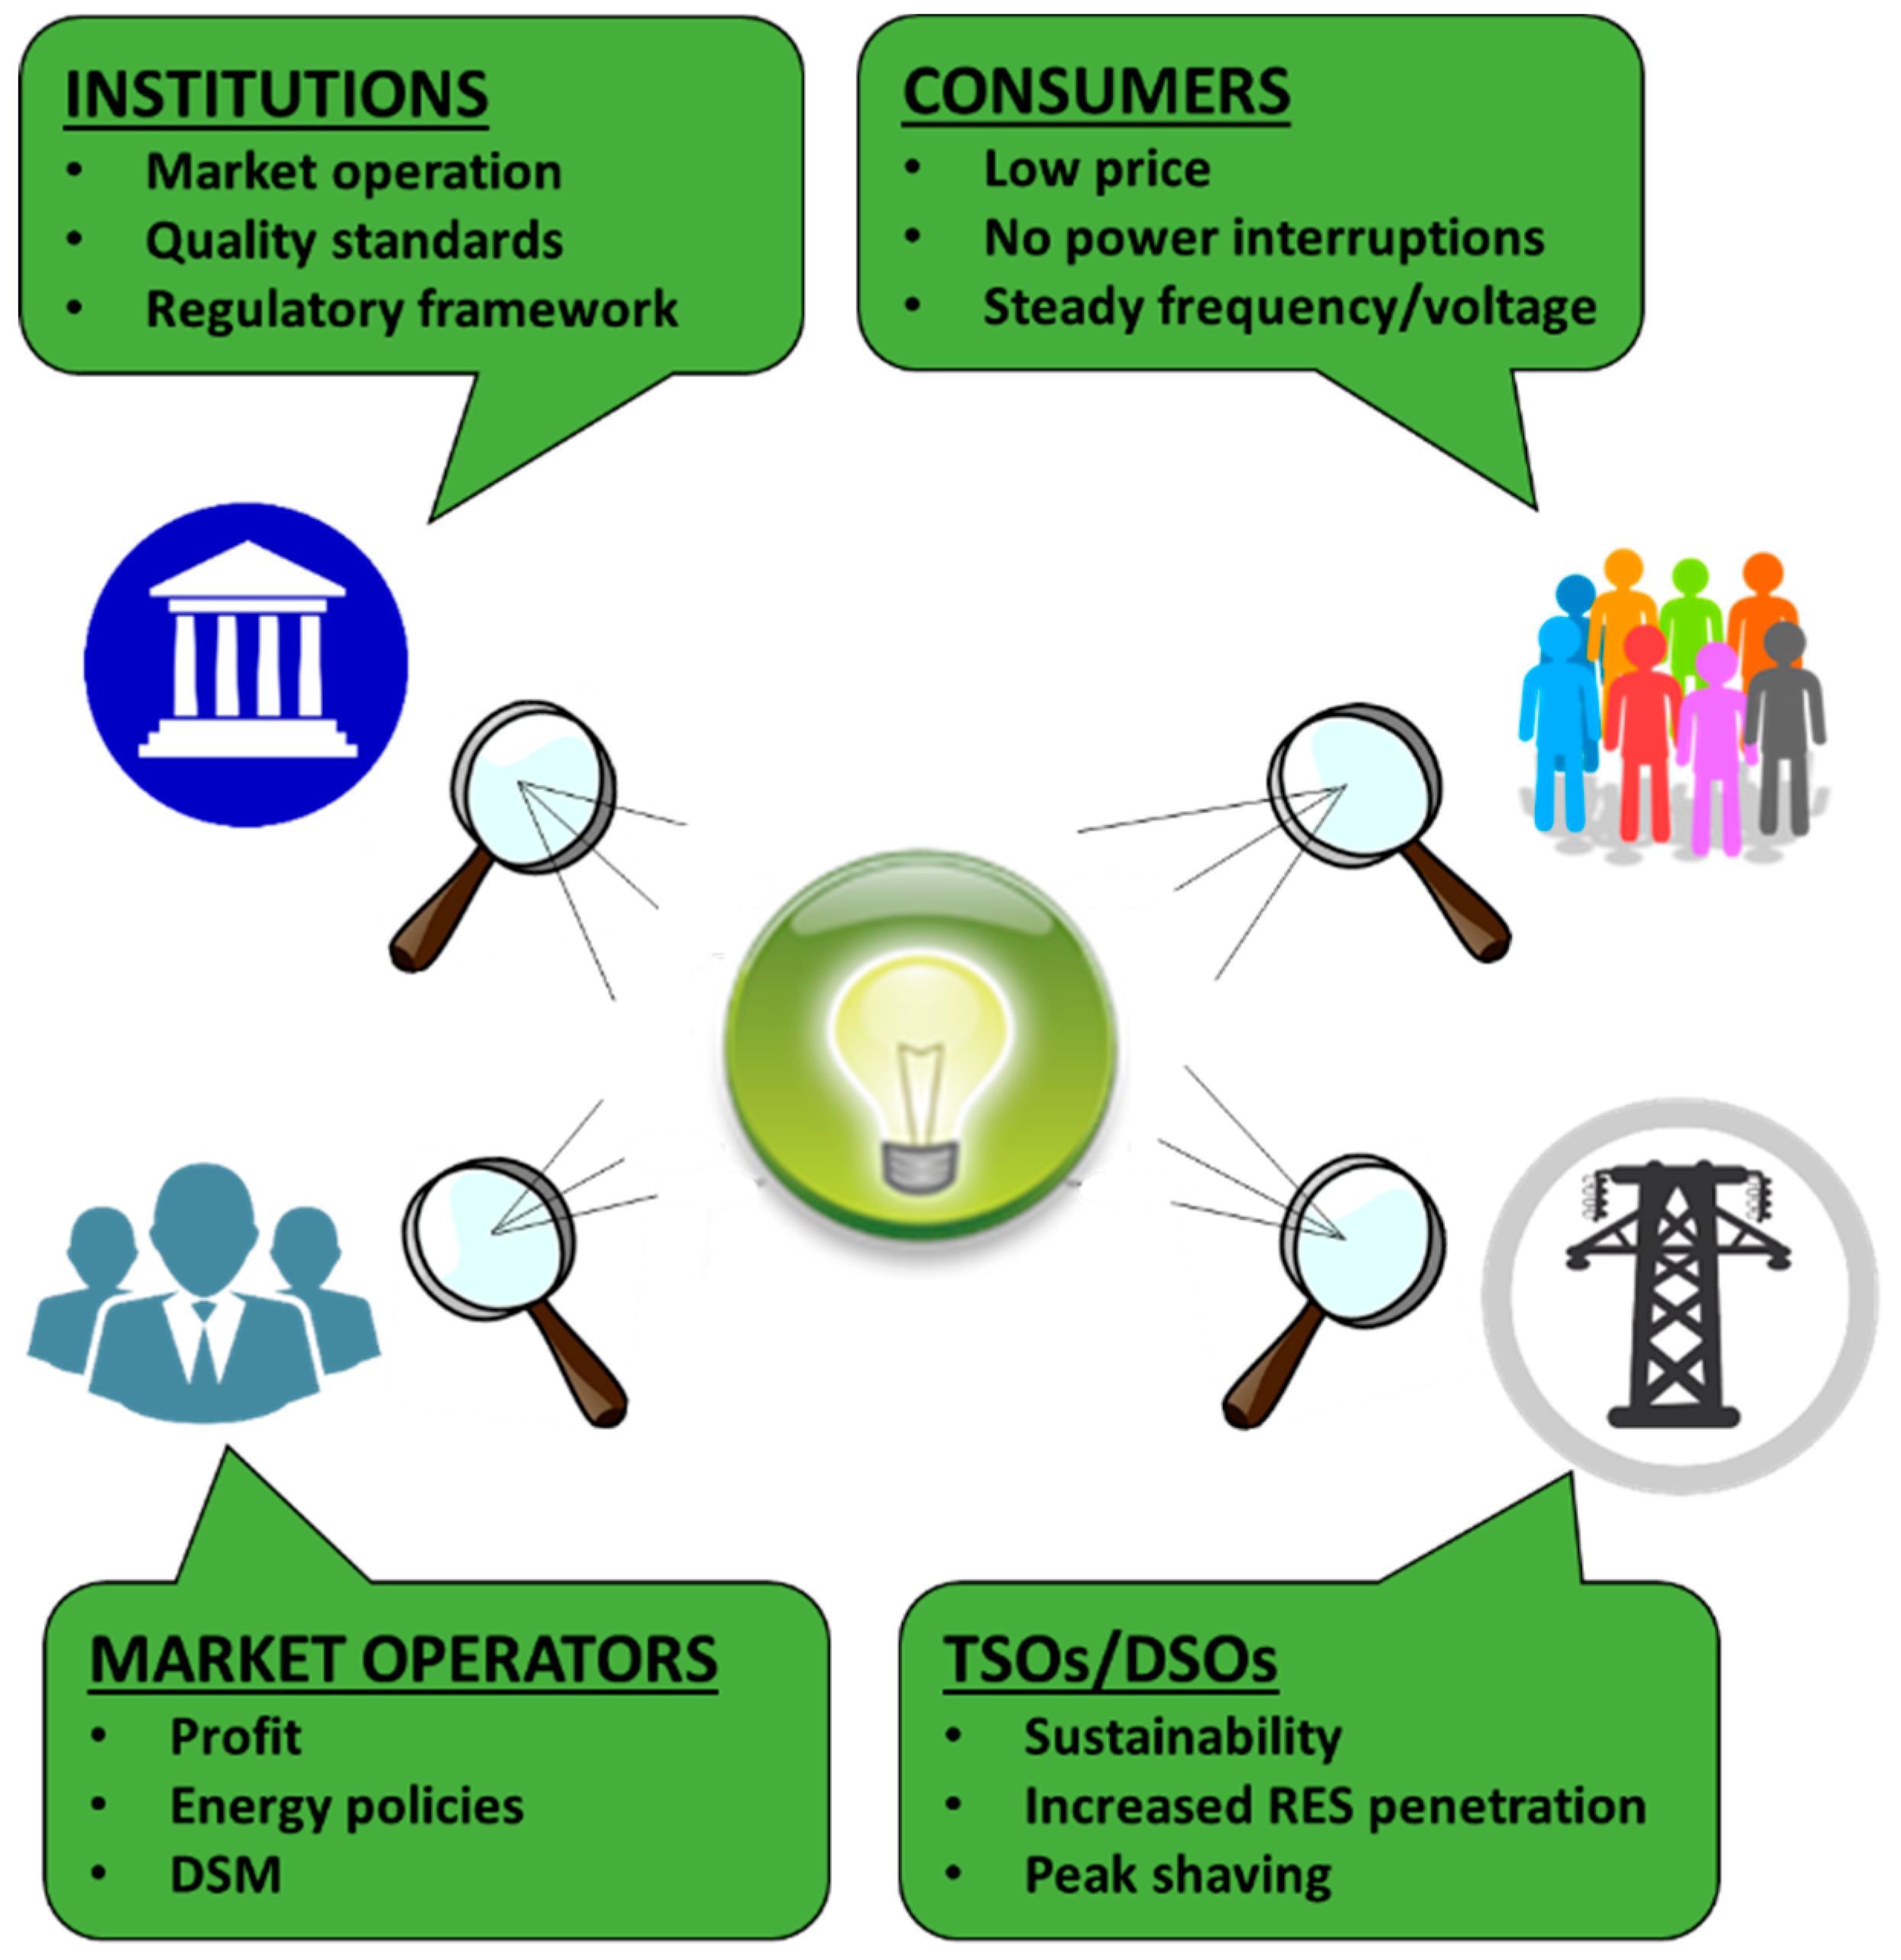
2.2. Stakeholder’s Perspective
2.2.1. Transmission/Distribution System Operator (TSO/DSO)
2.2.2. Consumers (End Users)
- Residential consumers: Their main interest is the low price, with a probable environmental care about the electricity mixture. Questionnaires can be used in order to deal with the acquisition of local residents’ point of view.
- Non-residential consumers: Their main interests are grid security and sustainability, as well as the provision of energy (electric, thermal) for a low price. This category includes facilities, offices, urban lighting, and generally non-residential buildings.
- Industrial consumers: They have multiple roles. On the one hand, they are large-scale end-users who are often connected to the HV grid, so they demand high quality electricity power. Since they play a vital role in the economy of a country, they can put pressure on the decision makers for the provision of low-cost electricity power, with a view to getting an advantage in the transnational competition. On the other hand, they can provide the operators with ancillary services because of their capability to considerably increase/reduce the load.
2.2.3. Market Operator (MO)
2.2.4. Institutions/Policy-, Law-, and Regulation-Making Bodies
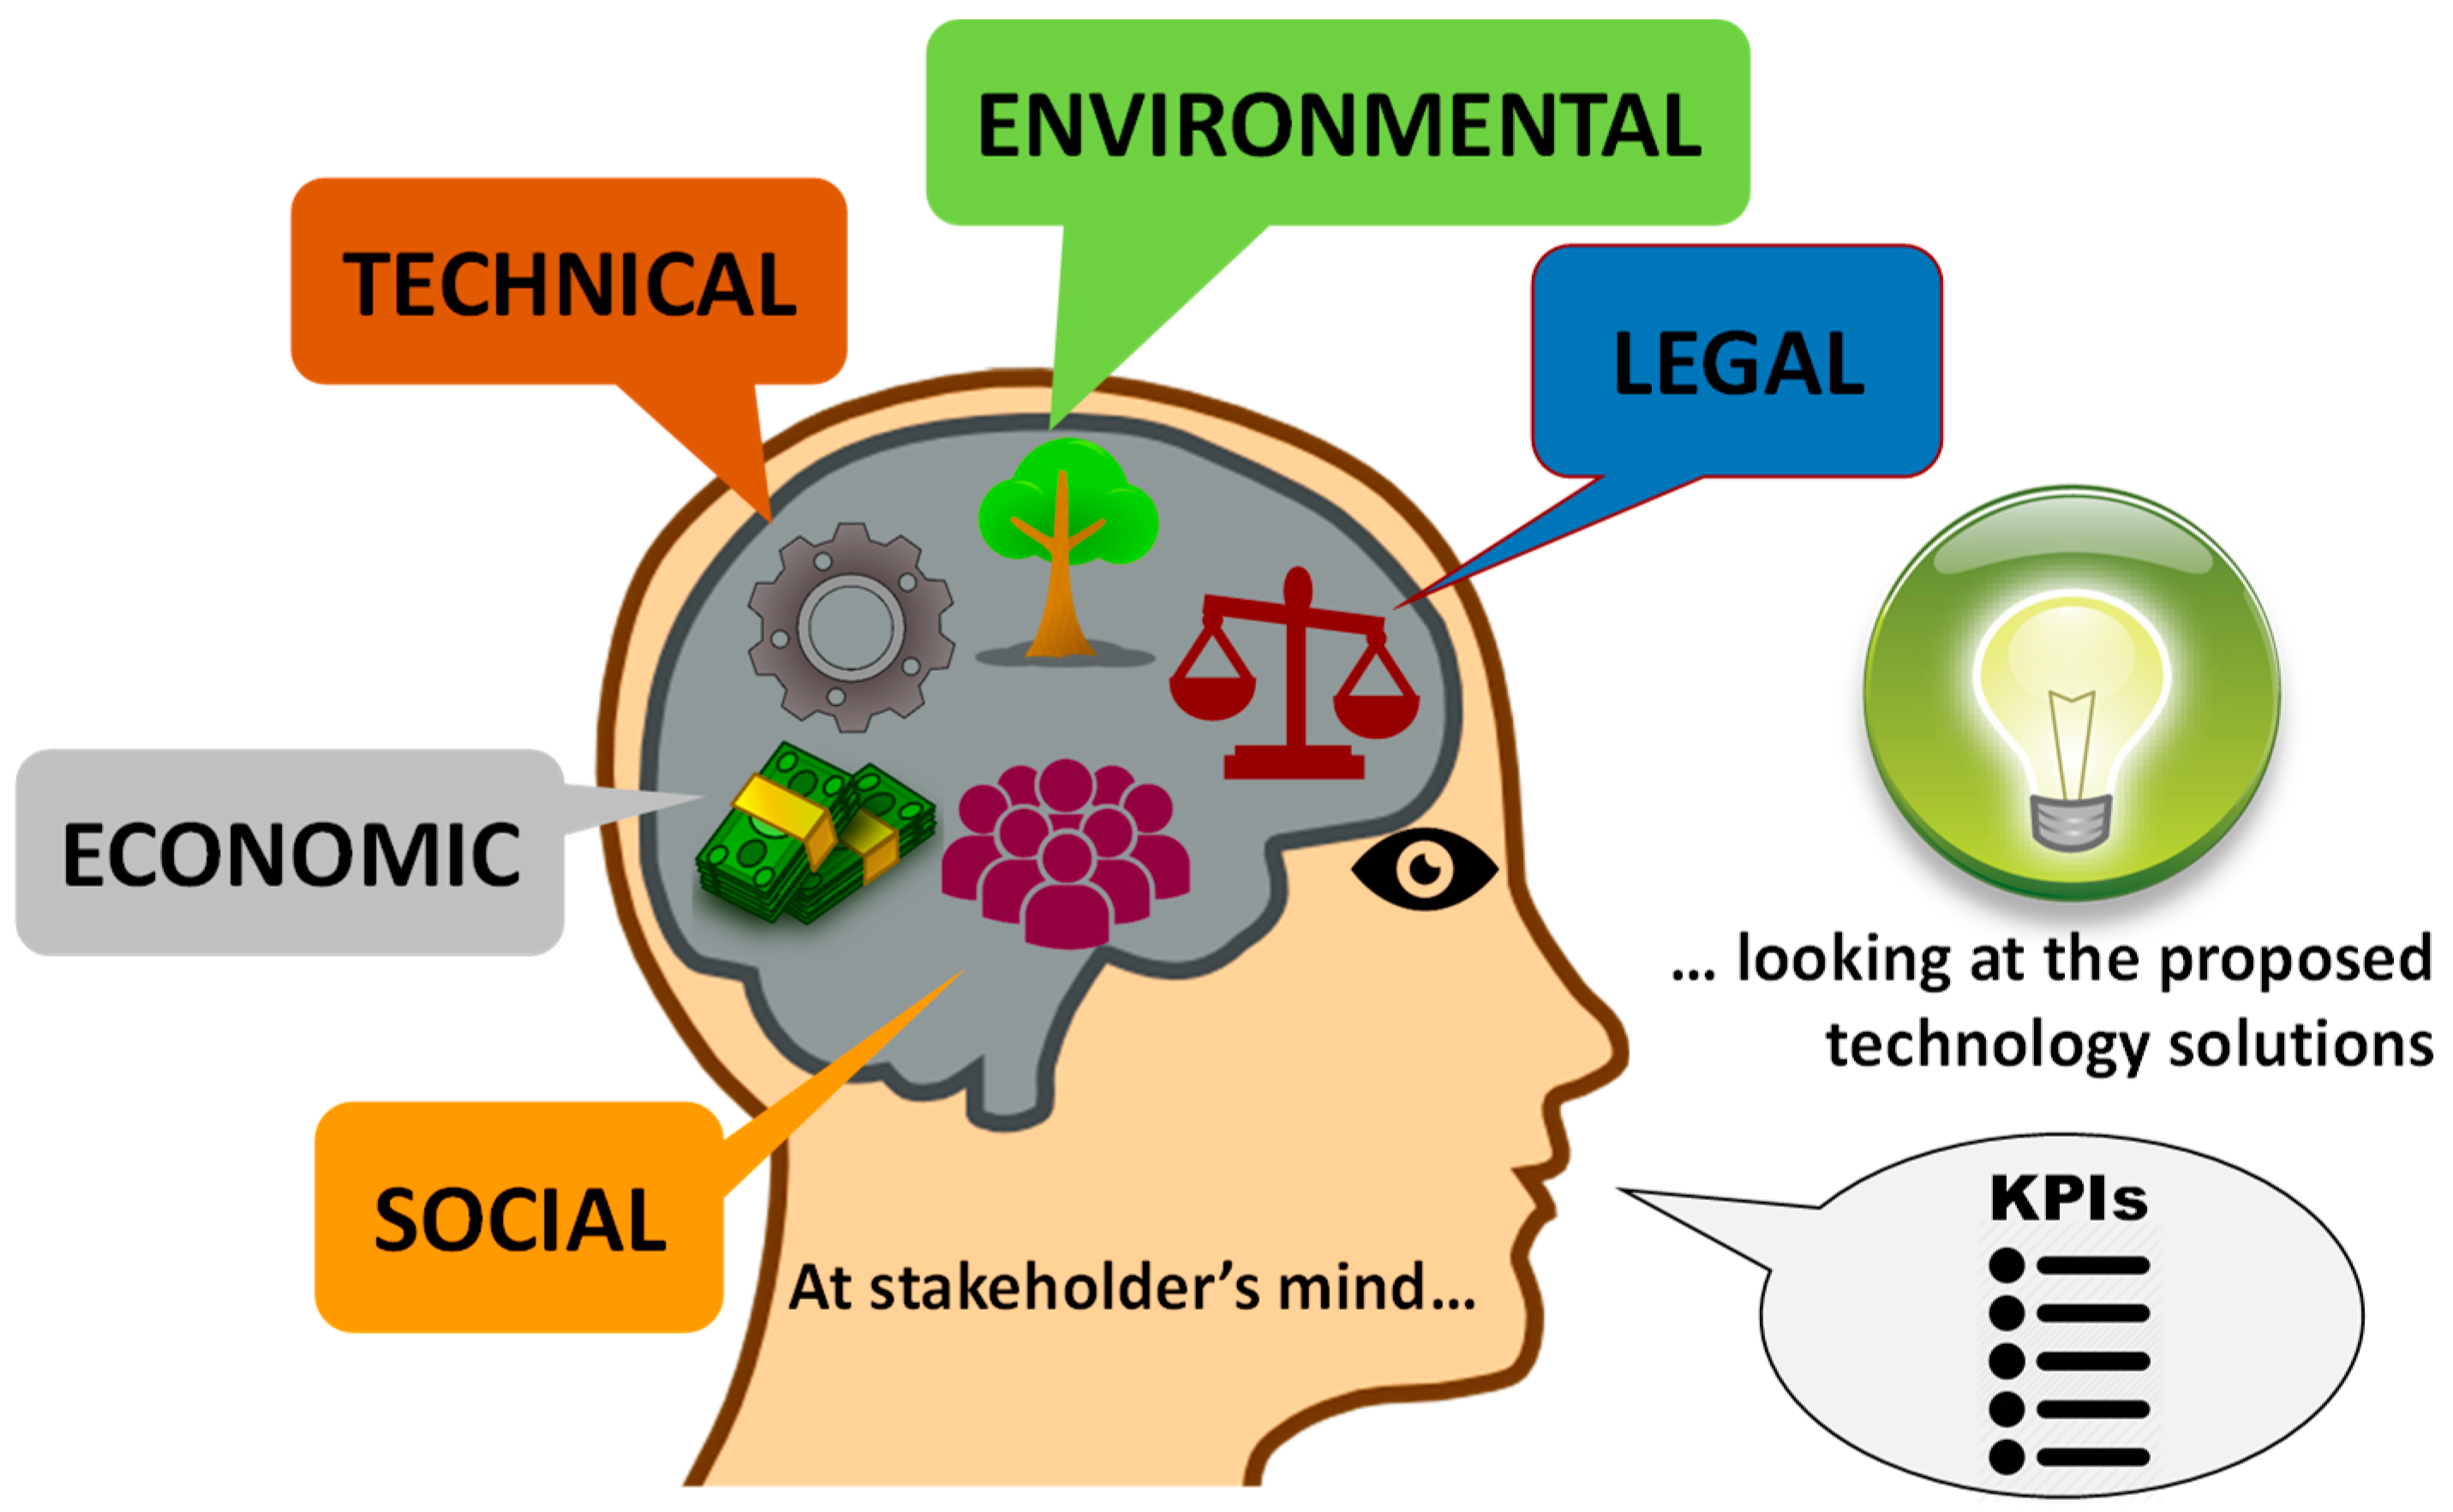
2.3. KPI Domains
- KPIs measuring Technical Performance, such as the energy consumption, the RES generation ratio, the peak load reduction, etc.
- KPIs measuring Economic Performance, such as the average cost of energy consumption, the average estimation of cost savings, etc.
- KPIs of Environmental impact, such as CO2 emissions reduction
- KPIs of Social impact such as the degree of users’ satisfaction from DR services.
- KPIs of Legal infrastructure, such as the level of support for electricity/heat integration in the legal framework in the case that there are specific provisions.
2.3.1. Technical Domain
2.3.2. Economic Domain
2.3.3. Environmental Domain
2.3.4. Social Domain
2.3.5. Legal Domain
2.4. The Interest of Each Stakeholder in the Assessment of Each Domain
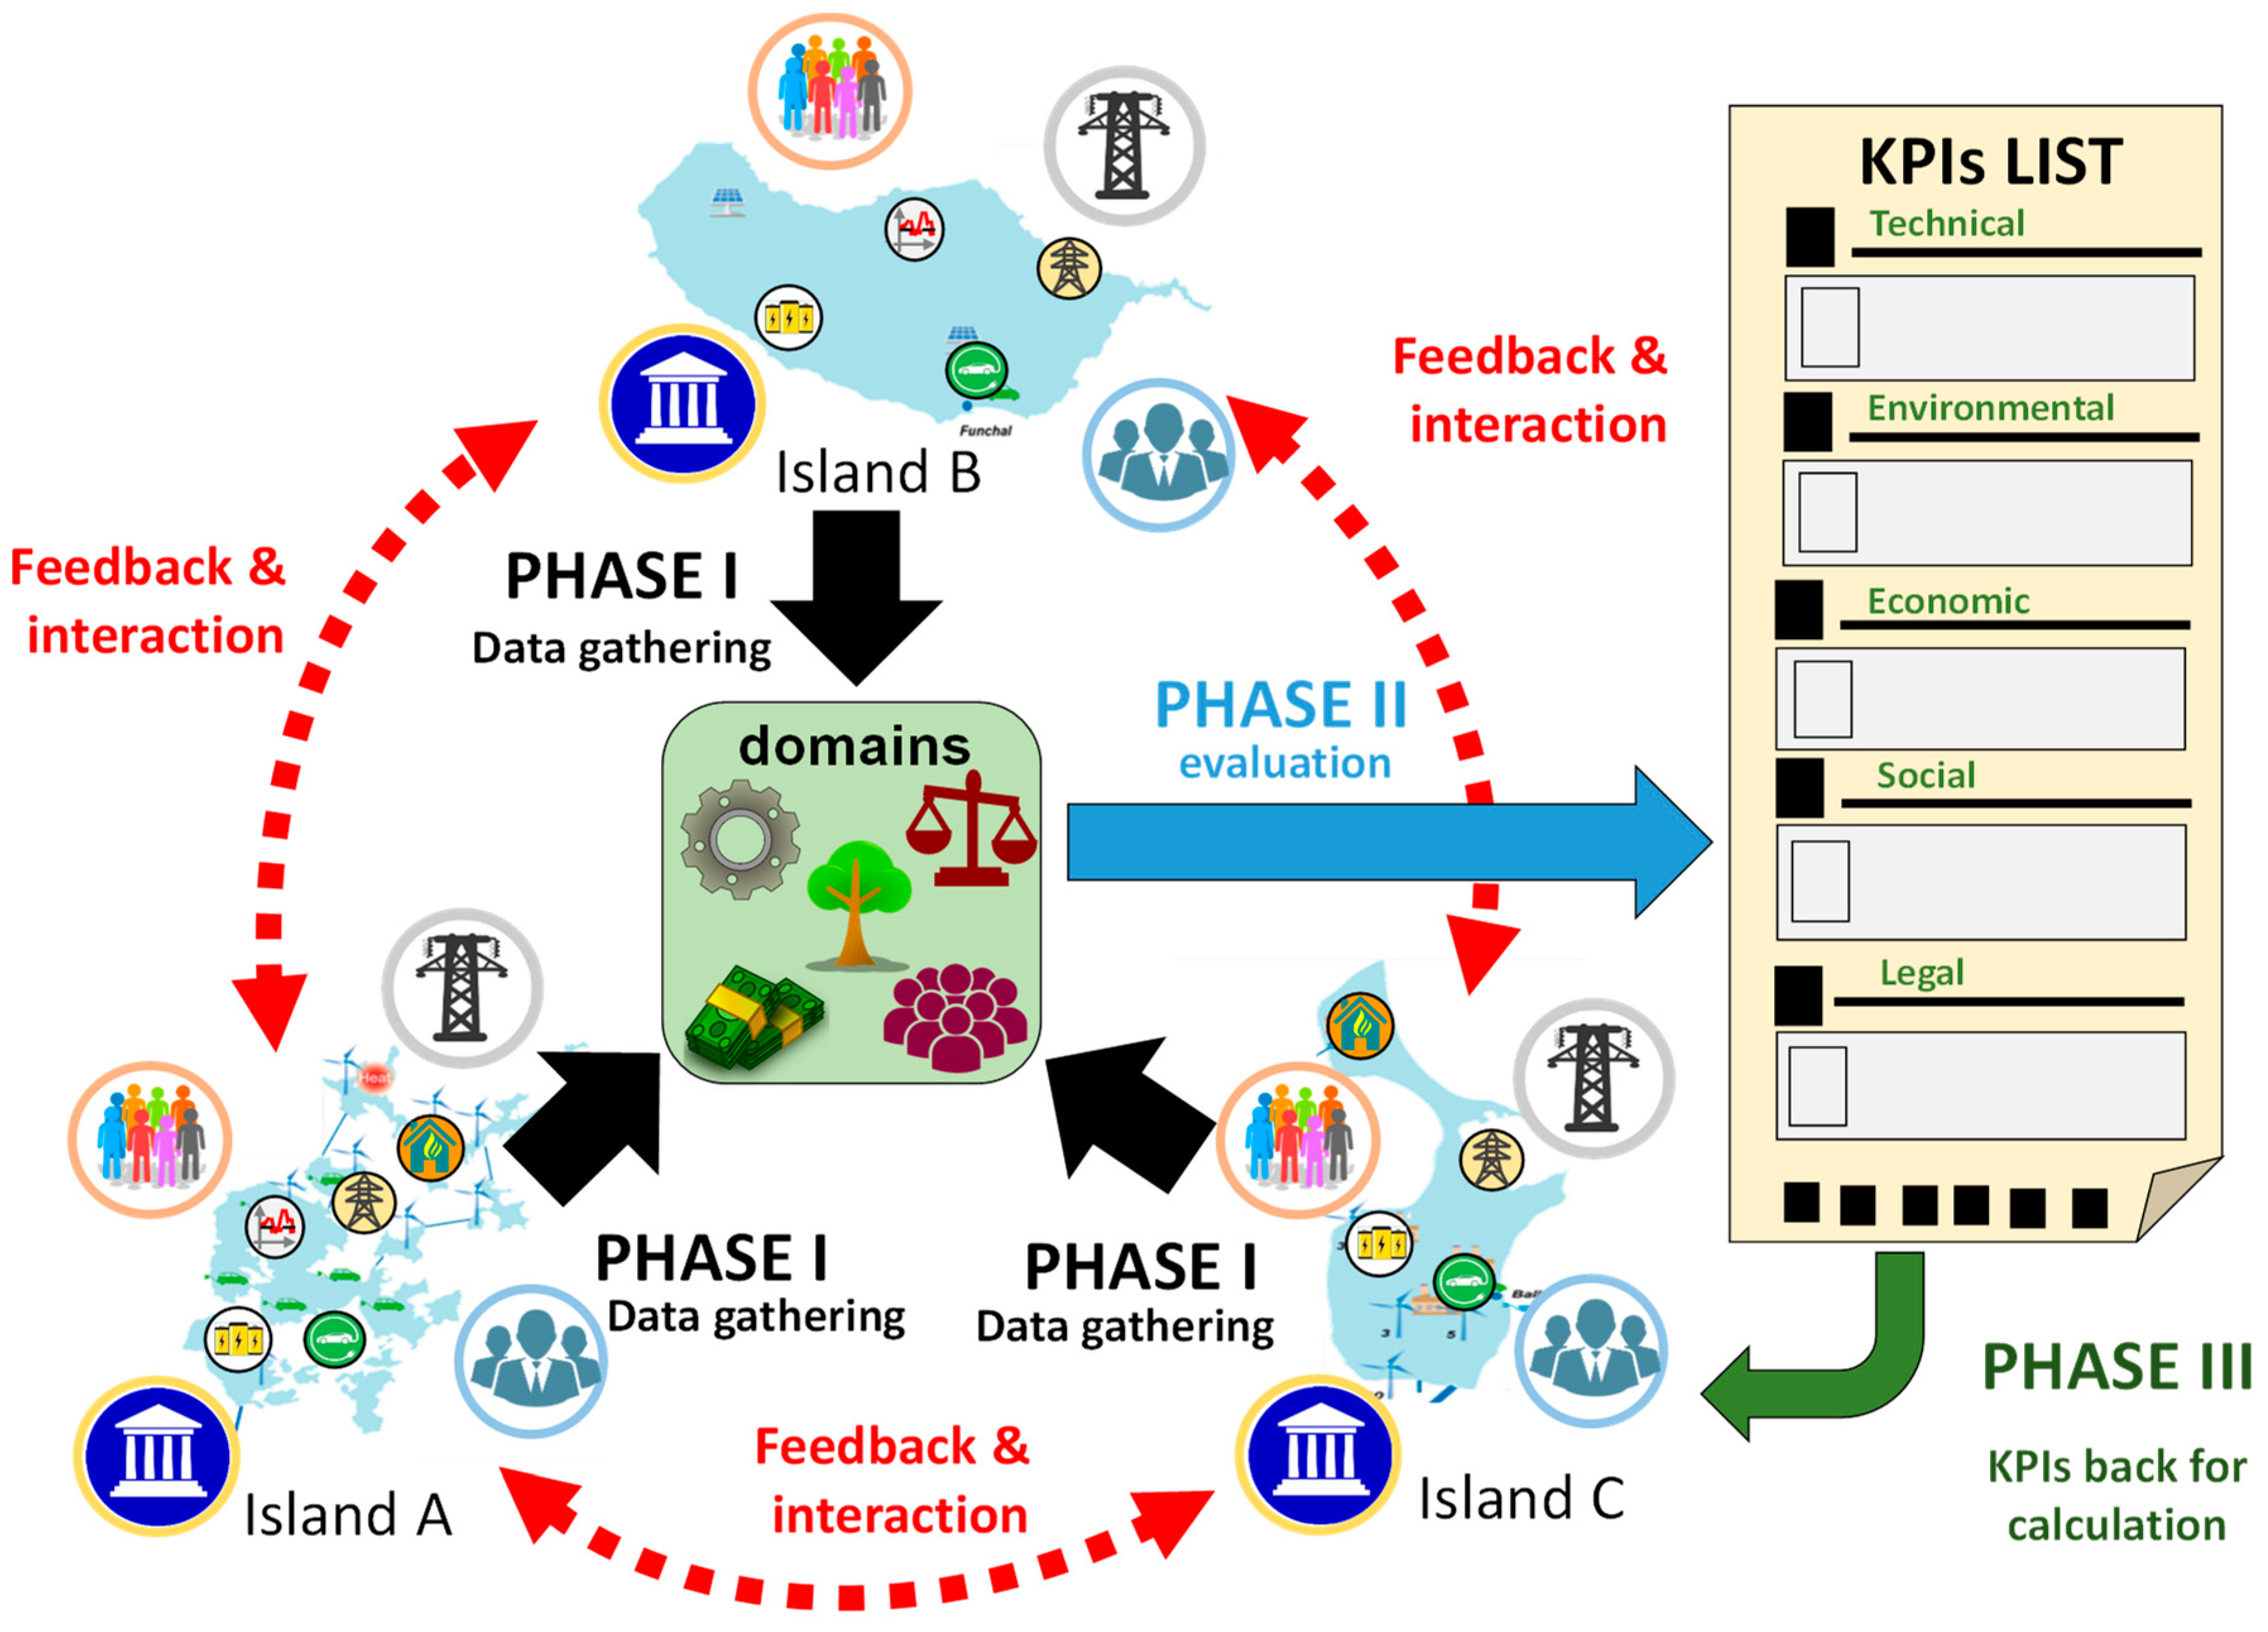
2.5. The Approach of KPI Determination
3. Results—KPI Identification
4. Conclusions and Further Considerations
- What technology solutions are tested?
- What aspects of these solutions should beg under concern and evaluation?
- Who is interested? Who sets the evaluation criteria?
Author Contributions
Funding
Acknowledgments
Conflicts of Interest
Nomenclature
| BESS | Battery Energy Storage System |
| DER | Distributed Energy Resources |
| DR | Demand Response |
| DSM | Demand-Side Management |
| DSO | Distribution System Operator |
| EC | European Commission |
| EEGI | European Electricity Grid Initiative |
| EROI | Energy Return on Investment |
| ESCO | Energy Service Company |
| EV | Electric Vehicles |
| HV-MV-LV | High Voltage - Medium Voltage - Low Voltage |
| ICT | Information and Communications Technology |
| KPI | Key Performance Indicator |
| KRI | Key Result Indicator |
| LCA | Life-Cycle Analysis |
| LSE | Large Scale Enterprise |
| PI | Performance Indicator |
| PV | Photovoltaic |
| R&D | Research and Development |
| R&I | Research and Innovation |
| RES | Renewable Energy Sources |
| SAIDI | System Average Interruption Duration Index |
| SAIFI | System Average Interruption Frequency Index |
| SCIS | Smart Cities Information System |
| TRL | Technology Readiness Level |
| TSO | Transmission System Operator |
References
- Kaldellis, J.K.; Gkikaki, A.; Kaldelli, E.; Kapsali, M. Investigating the energy autonomy of very small non-interconnected islands: A case study: Agathonisi, Greece. Energy Sustain. Dev. 2012, 16, 476–485. [Google Scholar] [CrossRef]
- Georgiou, P.N.; Mavrotas, G.; Diakoulaki, D. The effect of islands’ interconnection to the mainland system on the development of renewable energy sources in the Greek power sector. Renew. Sustain. Energy Rev. 2011, 15, 2607–2620. [Google Scholar] [CrossRef]
- Bueno, C.; Carta, J.A. Technical–economic analysis of wind-powered pumped hydrostorage systems. Part II: Model application to the island of El Hierro. Sol. Energy 2005, 78, 396–405. [Google Scholar] [CrossRef]
- Kaldellis, J.K.; Zafirakis, D.; Kondili, E. Optimum sizing of photovoltaic-energy storage systems for autonomous small islands. Int. J. Electr. Power Energy Syst. 2010, 32, 24–36. [Google Scholar] [CrossRef]
- Kaldellis, J.K.; Zafirakis, D.; Kavadias, K. Techno-economic comparison of energy storage systems for island autonomous electrical networks. Renew. Sustain. Energy Rev. 2009, 13, 378–392. [Google Scholar] [CrossRef]
- Cross, S.; Padfield, D.; Ant-Wuorinen, R.; King, P.; Syri, S. Benchmarking island power systems: Results, challenges, and solutions for long term sustainability. Renew. Sustain. Energy Rev. 2017, 80, 1269–1291. [Google Scholar] [CrossRef]
- Al Mamun, K.; Amanullah, M.T.O. Smart Energy Grid Design for Island Countries. Available online: https://link.springer.com/content/pdf/10.1007%2F978-3-319-50197-0.pdf (accessed on 2 November 2018).
- Hamilton, J.; Negnevitsky, M.; Wang, X.; Tavakoli, A.; Mueller-Stoffels, M. Utilization and Optimization of Diesel Generation for Maximum Renewable Energy Integration. In Smart Energy Grid Design for Island Countries; Springer: Cham, Switzerland, 2017; pp. 21–70. [Google Scholar]
- Wolfs, P.; Haque, M.M.; Ali, S. Power Quality Impacts and Mitigation Measures for High Penetrations of Photovoltaics in Distribution Networks. In Smart Energy Grid Design for Island Countries; Springer: Cham, Switzerland, 2017; pp. 97–124. [Google Scholar]
- Karthikeyan, V.; Rajasekar, S.; Das, V.; Karuppanan, P.; Singh, A.K. Grid-Connected and Off-Grid Solar Photovoltaic System. In Smart Energy Grid Design for Island Countries; Springer: Cham, Switzerland, 2017; pp. 125–157. [Google Scholar]
- Aitchison, D.; Cirrincione, M.; Cirrincione, G.; Mohammadi, A.; Pucci, M. Feasibility Study and Design of a Flywheel Energy System in a Microgrid for Small Village in Pacific Island State Countries. In Smart Energy Grid Design for Island Countries; Springer: Cham, Switzerland, 2017; pp. 159–187. [Google Scholar]
- Awasthi, A.; Karthikeyan, V.; Das, V.; Rajasekar, S.; Singh, A.K. Energy Storage Systems in Solar-Wind Hybrid Renewable Systems. In Smart Energy Grid Design for Island Countries; Springer: Cham, Switzerland, 2017; pp. 189–222. [Google Scholar]
- Vitale, G. Frequency Stability Improvement in Weak Grids by Storage Systems. In Smart Energy Grid Design for Island Countries; Springer: Cham, Switzerland, 2017; pp. 223–258. [Google Scholar]
- Urtasun, A.; Sanchis, P.; Marroyo, L. Energy Management of AC-Isolated Microgrids Based on Distributed Storage Systems and Renewable Energy Sources. In Smart Energy Grid Design for Island Countries; Springer: Cham, Switzerland, 2017; pp. 327–379. [Google Scholar]
- Madiba, T.; Bansal, R.; Justo, J.; Kusakana, K. Optimal Control System of Under Frequency Load Shedding in Microgrid System with Renewable Energy Resources. In Smart Energy Grid Design for Island Countries; Springer: Cham, Switzerland, 2017; pp. 71–96. [Google Scholar]
- Das, V.; Karuppanan, P.; Karthikeyan, V.; Rajasekar, S.; Singh, A.K. Energy Grid Management, Optimization and Economic Analysis of Microgrid. In Smart Energy Grid Design for Island Countries; Springer: Cham, Switzerland, 2017; pp. 289–325. [Google Scholar]
- Ghiani, E.; Serpi, A.; Pilloni, V.; Sias, G.; Simone, M.; Marcialis, G.; Armano, G.; Pegoraro, P.A. A Multidisciplinary Approach for the Development of Smart Distribution Networks. Energies 2018, 11, 2530. [Google Scholar] [CrossRef]
- Brown, N. Faroe Islands Demonstrate The “World’s First” Smart Grid; Clean Technica. Available online: https://cleantechnica.com/2012/11/23/faroe-islands-demonstrate-the-worlds-first-smart-grid/ (accessed on 3 November 2018).
- Chand, S.S.; Iqbal, A.; Cirrincione, M.; Islam, F.; Mamun, K.; Kumar, A. Identifying Energy Trends in Fiji Islands. In Smart Energy Grid Design for Island Countries; Springer: Cham, Switzerland, 2017; pp. 259–287. [Google Scholar]
- Mohammed, O.; Amirat, Y.; Benbouzid, M.; Feld, G. Optimal Design and Energy Management of a Hybrid Power Generation System Based on Wind/Tidal/PV Sources: Case Study for the Ouessant French Island. In Smart Energy Grid Design for Island Countries; Springer: Cham, Switzerland, 2017; pp. 381–413. [Google Scholar]
- Zhou, Z.; Benbouzid, M.; Charpentier, J.; Scuiller, F. Hybrid Diesel/MCT/Battery Electricity Power Supply System for Power Management in Small Islanded Sites: Case Study for the Ouessant French Island. In Smart Energy Grid Design for Island Countries; Springer: Cham, Switzerland, 2017; pp. 415–445. [Google Scholar]
- Kusakana, K. Optimal Power Flow of a Battery/Wind/PV/Grid Hybrid System: Case of South Africa. In Smart Energy Grid Design for Island Countries; Springer: Cham, Switzerland, 2017; pp. 447–465. [Google Scholar]
- Majumder, D.; Tazdik, J.; Uddin, K.A.; Al Matin, M.A. KPI for Solar PV-diesel hybrid mini grids in remote islands of Bangladesh. Energy Procedia 2016, 103, 262–267. [Google Scholar] [CrossRef]
- European Commission. Energy 2020: A Strategy for Competitive, Sustainable and Secure Energy; Publications Office of the European Union: Brussels, Belgium, 2011. [Google Scholar]
- European Commission. Regulation of the European Parliament and of the Council on Guidelines for Trans-European Energy Infrastructure and Repealing Decision No 1364/2006/EC; European Union: Brussels, Belgium, 2011. [Google Scholar]
- Smart Islands Initiative. Smart Island Initiative Declaration. Available online: http://www.smartislandsinitiative.eu/en/declaration.php (accessed on 4 December 2018).
- Garrotes, J.; Barenfanger, R. DREAM KPIs Overview; DREAM Project: Brussels, Belgium, 2016. [Google Scholar]
- Sun Electronics, Photovoltaic Systems as an Investment—Payback Period. Available online: https://sunelec.com/cms/rebates-incentives/photovoltaic-systems-as-an-investment-payback-period/ (accessed on 4 December 2018).
- Birch, A.; Itschert, L.; Spanka, K. Definition and Calculation Methodology of Project KPIs—The DISCERN Approach. 2015. Available online: https://www.discern.eu/project_output/publications.html (accessed on 5 November 2018).
- Functionalities of Smart Grid and Smart Meters. Task Force Smart Grids Experts. 2010. Available online: http://www.ieadsm.org/wp/files/Tasks/Task%2017%20-%20Integration%20of%20Demand%20Side%20Management,%20Energy%20Efficiency,%20Distributed%20Generation%20and%20Renewable%20Energy%20Sources/Background%20material/Eg1%20document%20v_24sep2010%20conf.pdf (accessed on 2 November 2018).
- Gaudó, M.; González, R.; Borroy, S.; de Urtasun, L.G.; Martín, S.; GarcíaGracia, M. Smart grid technologies evaluation through KPIs. In Proceedings of the CIRED Conference, Vrnjačka Banja, Serbia, 22–26 September 2014. [Google Scholar]
- CERTH. INERTIA Integrating Active, Flexible and Responsive Tertiary Prosumers into a Smart Distribution Grid. 2013. Available online: http://www.inertia-project.eu/inertia/index.html (accessed on 5 November 2018).
- D’Appolonia SpA. EPIC-HUB—Energy Positive Neighbourhoods Infrastructure. Available online: https://ses.jrc.ec.europa.eu/epic-hub (accessed on 4 November 2018).
- Drakopoulos, D.; Papapolyzos, N.; Alexandrakis, I.; Wilson, H.; Crosbie, T. D1.4.—inteGRIDy Global Evaluation Metrics and KPIs. Integrated Smart GRID Cross-Functional Solutions for Optimized Synergetic Energy Distribution; Utilization & Storage Technologies. Available online: http://www.integridy.eu/sites/default/files/integridy/public/content-files/deliverables/inteGRIDy_D1.4_Evaluation_Metrics_KPIs_v1.0.pdf (accessed on 4 November 2018).
- Ala-Juusela, M.; Crosbie, T.; Hukkalainen, M. Defining and operationalising the concept of an energy positive neighbourhood. Energy Convers. Manag. 2016, 125, 133–140. [Google Scholar] [CrossRef] [Green Version]
- Thanos, G.A.; Minou, M.; Ganu, T.; Arya, V.; Chakraborty, D.; Deventer, J.V.; Stamoulis, G.D. Evaluating demand response programs by means of key performance indicators. In Proceedings of the 2013 Fifth International Conference on Communication Systems and Networks (COMSNETS), Bangalore, India, 7–10 January 2013; pp. 1–6. [Google Scholar]
- Van Nes, D.H. Key Performance Indicators and Key Exception Indicators, Finance and Control. 2014. Available online: https://executivefinance.nl/wp-content/uploads/2015/02/FC201401081.pdf (accessed on 2 November 2018).
- Faias, S.; Castro, R.; Esteves, J. An Overview on the Portuguese Quality of Electricity Supply Code Revision 2013: The Continuity of Supply and Power Quality Perspective. In Proceedings of the International Conference on Renewable Energies and Power Quality (ICREPQ’14), Cordoba, Spain, 8–10 April 2014. [Google Scholar]
- Markiewicz, H.; Klajn, A. Voltage disturbances standard en 50160-voltage characteristics in public distribution systems. Wroclaw Univ. Technol. 2004, 21, 215–224. [Google Scholar]
- CENELEC 50160: Voltage Characteristics of Electricity Supplied by Public Distribution Systems; British Standards Institution. Available online: http://fs.gongkong.com/files/technicalData/201110/2011100922385600001.pdf (accessed on 5 November 2018).
- Giordano, V.; Vasiljevska, J.; Vitiello, S.; Filiou, K.; Gras, S.; Mrdeza, M. Definition of an Assessment Framework for Projects of Common Interest in the Field of Smart Grids; Evaluation of Smart Grids Projects within the Smart Grid Task Force Expert Group 4: Brussels, Belgium, 2013. [Google Scholar]
- Roadmap 2010–18 and Detailed Implementation Plan 2010–12; European Energy Grid Initiative. Available online: https://www.entsoe.eu/fileadmin/user_upload/_library/news/EEGI_Implementation_plan_May_2010.pdf (accessed on 5 November 2018).
- Bosch, P.; Jongeneel, S.; Rovers, V.; Neumann, H.M.; Airaksinen, M.; Huovila, A. CITYkeys List of Project Indicators; European Commission: Brussels, Belgium, 2017. [Google Scholar]
- Marijuan, A.G.; Moller, S. Smart Cities Information System: Key Performance Indicator Guide v.2.0; EU Smart Cities Information System. Available online: https://www.smartcities-infosystem.eu/sites/default/files/document/scis_kpi_guide.pdf (accessed on 5 November 2018).
- Available online: https://www.h2020smile.eu/ (accessed on 5 November 2018).
- Borlase, S. Smart Grids: Infrastructure, Technology, and Solutions; CRC Press: Boca Raton, FL, USA, 2013. [Google Scholar]
- Bosch, P.; Jongeneel, S.; Ait, H.-M.N.; Airaksinen, M. CITYkeys Indicators for Smart City Projects and Smart Cities. Available online: http://nws.eurocities.eu/MediaShell/media/CITYkeysD14Indicatorsforsmartcityprojectsandsmartcities.pdf (accessed on 6 November 2018).
- Kylili, A.; Fokaides, P.; Jimenez, P. Key Performance Indicators (KPIs) approach in buildings renovation for the sustainability of the built environment: A review. Renew. Sustain. Energy Rev. 2016, 56, 906–915. [Google Scholar] [CrossRef]
- Bernstein, I.H. Likert Scale Analysis, Encyclopedia of Social Measurement; Elsevier: Amsterdam, The Netherlands, 2005; pp. 497–504. [Google Scholar]
- Communication from the Commission to the European Parliament, the Council, the European Economic and Social Committee and the Committee of the Regions: An EU Strategy on Heating and Cooling; European Commission: Brussels, Belgium, 2016.
- Pacific Gas and Electric Company, Voltage Tolerance Company. Available online: https://www.pge.com/includes/docs/pdfs/mybusiness/customerservice/energystatus/powerquality/voltage_tolerance.pdf (accessed on 6 November 2018).
- Eto, J.H. Reliability Metrics and Reliability Value-Based Planning. Distribution Systems and Planning Training for New England Conference of Public Utility Commissioners. Available online: https://emp.lbl.gov/sites/default/files/6._170928_necpuc_training_reliability_metrics_and_rvbp.pdf (accessed on 7 November 2018).
- Kourkoumpas, D.S.; Benekos, G.; Nikolopoulos, N.; Karellas, S.; Grammelis, P.; Kakaras, E. A review of key environmental and energy performance indicators for the case of renewable energy systems when integrated with storage solutions. Appl. Energy 2018, 231, 380–398. [Google Scholar] [CrossRef]
- Applied Solar Energy, Internal Rate of Return (IRR) of a Photovoltaic Solar System. Available online: http://www.appliedsolarenergy.com/Solar_Economic_Return.html (accessed on 6 December 2018).
- Sinetech. What Is So Great about Solar? Let’s Take a Look. Available online: http://www.sinetech.co.za/news-pv-solar-offers-best-return-on-your-investment.html (accessed on 6 December 2018).
- Statista, Gasoline Prices in Selected Countries Worldwide as of April 16, 2018 (in U.S. Dollars per Gallon). Available online: https://www.statista.com/statistics/221368/gas-prices-around-the-world/ (accessed on 6 December 2018).


| Economic Parameters | 10 kW Grid Tied System, Florida | 5 kW Grid Tied System in Kaui, Hawaii | 5 kW Grid Tied System, Arizona | 8 kW off Grid System, Jamaica | 8 kW off Grid System, Roatan Honduras |
|---|---|---|---|---|---|
| Cost of Electricity ($/kWh) | 0.117 | 0.55 | 0.111 | 0.39 | 0.52 |
| System Size (Watts) | 10,000 | 5000 | 5000 | 8000 | 8000 |
| Peak Sun Hours (hours) | 5 | 5 | 6.5 | 5 | 5 |
| System Efficiency | 83% | 83% | 83% | 75% | 75% |
| Installed Cost Per Watt ($/Watt) | 1.375 | 2.75 | 2.75 | 4 | 4 |
| Rebate and Incentive | 30% | 30% | 30% | 0% | 0% |
| Initial Investment ($) | 13,750 | 13,750 | 13,750 | 20,000 | 20,000 |
| Rebates and Incentives ($) | −4125 | −4125 | −4125 | 0 | 0 |
| Actual System Cost ($) | 9625 | 9625 | 9625 | 20,000 | 20,000 |
| Estimated Annual Electricity Savings ($) | 1772 | 4166 | 1093 | 4271 | 5694 |
| Payback Period (years) | 5.43 | 2.31 | 8.81 | 4.68 | 3.51 |
| Project Acronym/Name | Project Description | Methodology of Evaluation | Ref |
|---|---|---|---|
| DREAM: Distributed Renewable resources exploitation in electric grids through advanced hierarchical management | Demonstrates an industry—quality reference solution for Distributed Energy Resources (DER) aggregation—level control and coordination, based on commonly available Information and Communication Technology (ICT) components, standards, and platforms for all actors of the Smart Grids. | Two possible approaches for the KPI development: (1) a procedure for the KPI selection and definition starting from the use case goals and then moving to the trial sites/demo site goals or (2) starting from the pilot goals, developing KPIs and use case solutions accordingly. A combination of the two approaches was finally adopted. | [27] |
| DISCERN: Distributed intelligence for cost-effective and reliable solutions | Examined cost-effective network solutions for future network development. The starting point for DISCERN [29,30,31] was the EEGI framework which was adopted for practical purposes and operational use by the Distribution System Operators (DSOs). | Organized structured and detailed workshops purposed to define the list of KPIs from EEGI, developing the KPI framework and their detailed definitions. The participation of the maximum possible number of DSOs in these workshops aimed at the presentation of a consolidated partners’ point of view within the respective countries and regulatory frameworks represented in the project. | [29,31] |
| INERTIA: Integrating active, flexible and responsive tertiary prosumers into a smart distribution grid | Provided an overlay network for coordination and active grid control, running on top of the existing grid and consisting of distributed and autonomous intelligent Commercial Prosumer Hubs. | The project established an Integrated Energy Performance Model that extended the existing ones, by incorporating and integrating multiple dimensions, i.e., the physical sub-system, the human sub-system, the Enterprise sub-system and the general surrounding environment. Through direct incorporation of the Enterprise as a specific actor, this performance model was better adjusted to specific business domains and provided the basis for the optimal balance between DSM, Energy Performance and Enterprise Performance. | [32] |
| EPIC-HUB: Energy positive neighborhoods infrastructure middleware based on energy—hub concept | Focused on efficient Management, Control and Decision-Support Energy Policies at neighborhood-level, defining an interoperable Middleware solution and a structured vision for the communities to use and share renewable energy sources, energy storage, and micro-generation, in order to consistently realize energy savings, reduce CO2 emissions and optimize energy usage. | The performance measures are distinguished: Key Results Indicators (KRI), Performance Indicators (PI) and Key Performance Indicators (KPI) and the concomitant use of them according to different aspects and dimensions of the project, such as time. The specific distinction provides a useful and functional taxonomy that can be used in the establishment of a complete and multi-dimensional performance framework. | [33] |
| inteGRIDy: Integrated smart Grid cross—functional solutions for optimized synergetic energy distribution, utilization storage technologies | Aims at integrating cutting-edge technologies, solutions and mechanisms in a scalable Cross-Functional Platform (CFP) of replicable solutions, towards connecting existing energy networks with a diverse group of stakeholders consisting of both generation and consumption profiles. | The KPI determination in inteGRIDy was based in a 4-axis principle:
| [34] |
| Domains of KPIs | TSOs/DSOs | Market Operators | Consumers | Institutions |
|---|---|---|---|---|
| Technical domain | TSOs and DSOs are mostly interested in ensuring an adequate level of quality of supply to the grid-connected customers, taking into consideration each of the specific grid characteristics. Critical peaks of demand should be avoided, constantly monitoring users’ consumption to avoid grid breakdowns and efficiently addressing fraud challenges. In other words, Operators are interested in the operational impact of any scenario to the grid conditions. | With reference to the technical domain, Market Operators (MOs) are interested in the various technologies available for power generation and storage, as well as to the proposed DR strategies. Technology performance is crucial for any investment decision. Moreover, a better exploitation of assets devoted to improving the regulating capabilities of Virtual Power Plant (e.g., energy storage systems) would reduce the required investment costs and increase the incomes. | The quality of the power delivered is a matter of interest mainly to non-residential consumers. Especially factories and large workplaces can withstand neither power interruptions, nor large voltage variations or harmonics. Residential consumers are not as dependent to quality of service as the non-residential ones, but certainly demand it. | Policy Bodies are interested in monitoring the contribution of the projects (pilots) to the smart grid functions, which are directly related to Smart Grid policy objectives. Among others, these include the Security and quality of supply, the connectivity and access to all categories of network users, the capacity of transmission and distribution grids to connect and transfer electricity from and to users. |
| Economic domain | The aforementioned concerns of the TSOs and DSOs in the technical domain are also having an economic aspect, as any potential inefficiencies in the quality of supply to the grid customers, may cause significant charges from the side of the regulation authorities. Moreover, DSOs are responsible for proposing an energy strategy, giving directions about the future of the energy mixture, bearing in mind the overall cost. | Main goal of the Market operators is to maximize the profit from their investment. This means that they care for all the economic aspects of any possible technology in which they could invest. They compete to sell DR services to the utility operator and provide compensation to consumers, in order to modify their preferable consumption pattern. In this respect, they will make use of economic indicators to identify operational needs, market opportunities or critical situations and deploy appropriate DSM strategies. Any available RES promotion paying policies (feed-in tariff, etc.) are under close observation as they play a decisive role in the overall feasibility of an investment. Real-time views for revenue protection, unexpected EV and solar loads identification are some of the metrics that would make sense for utilities in such case. | The main expectation of the residential consumers is a direct economic benefit either in the form of cost reduction or in terms of at hand compensation, depending on the DR schema category they participate. Non-residential consumers also demand the lowest possible final cost, as the energy cost is one of the main factors that are included in the final cost of any kind of business, and thus is very important to the international competition. | From the perspective of policy makers, economic domain indicators should reflect the efficiency and quality of service achieved in electricity supply and grid operation. Measures of interest indicatively include: Demand side participation in electricity markets and in energy efficiency measures, societal CBA, which go beyond the costs and the benefits incurred by the project promoter, as well as the monetary value of reduced CO2 emissions based on the amount of CO2 reduction and the current CO2 allowances price. |
| Environmental domain | TSOs and DSOs are highly interested the effect of the new smart technologies on the environment, either when applied or when they replace conventional systems, since their electric grid, under supervision, influences significantly the cities and citizens’ quality of life. Moreover, they need to confront with the current EU legislation policies promoting the low CO2 technologies. | Market Operators are expected to apply schemes contributing in making grid distribution smarter and more efficient (e.g., DR programs by Large Scale Enterprises (LSEs) or third-party energy aggregators). Environmental KPIs related to demand determine the quality of response from the customers. Moreover, the environmental indicators are necessary for the Market Operators in order to provide the environmental profile asked by both government and end-users (market). | Both residential and commercial end-users are highly interested in knowing more about the environmental impact of any technology solution proposed. Environmental parameters are linked to and to a certain extent reflect the, demographical, physical and contextual characteristics such as types of premises and profile of users, weather conditions, national/local characteristics, idiosyncrasies and legislation etc. | Governing Bodies are interested in the levels of sustainability and would like to monitor it in a quantified manner (including the reduction of greenhouse emissions and the environmental impact of electricity grid infrastructure). International agreements are directing the local energy policies which include the increase in RES penetration and the reduction of the CO2 emissions. |
| Social domain | The social approach is necessary for the definition of the quality standards of the delivered services, as comfort and satisfaction are seriously taken into consideration. | Even more than the social approach of the DSOs, Market Operators (especially the utility-scale) depend on the social comfort and satisfaction by the delivered services, as it plays a crucial role in the determination of the marketing strategy to prevail over the competition. | All kinds of consumers can be motivated to change their energy behaviour through different social approach techniques, especially if there is direct monetary benefit. It further allows them to understand and feel comfortable with the energy infrastructures at home (RES, batteries, smart-meters, etc.) and improve their energy attitude. | Governing Bodies are interested in the social approach via the filter of the general evaluation of their general policy that has to be acceptable to the highest possible population percentage. |
| Legal domain | Being responsible for the operation of the grid, TSOs and DSOs are tempted to apply the most suitable mix of technologies according to their needs. The legislative framework sets the drivers and barriers to network operators’ freedom to optimize the grid operation, as long as they do not engage in the energy market. | Market operators are affected by the legal framework. They purchase technologies that have to cope with specific official standards. Yet, the permission to use a technology and the rules under which the market operates are set by the legal and regulatory framework. A very serious point here is the profitability of an investment. Generally, in a global market, the sooner an innovative technology is applied, the bigger market share it will acquire. This is why legislators or the executive are often pressed by companies to adjust the legal or regulatory framework according to the technology progress as soon as possible, if needed. | Consumers historically are the least involved in the legal domain. They seldom have to alter their position according to the changes in the legal framework, at least not as much as other actors. However, the recent drivers towards more active consumers (sometimes labelled prosumers) might entail an increasing interest from these actors in the changes brought to the legal and regulatory framework. The winter package intensifies this process [50]. | Institutions are at the source of the legal and regulatory framework. They are responsible for the development of a legal infrastructure that takes into consideration all the allying/opposing interests in order to define the barriers among which these interests can be expressed. It could be said that the legal KPIs evaluate the efficiency of the institutions, and specifically their ability to set up adapted market rules for the integration of new technologies to the energy market. |
| Name of KPI | Description | Unit | Stakeholders in Charge |
|---|---|---|---|
| Share of RES: (a) electricity, (b) heating/cooling and domestic hot water (DHW) | RES penetration for covering a) electrical and b) thermal needs | % |  |
| Share of DER (decentralized/distributed energy resources) | Share of DER in the energy mix | % | |
| Peak shaving from the side of consumption | Reduction of the power peaks | % of peak power reduction |  |
| Generation Forecasting Accuracy | Confidence or fuzziness (risk) in RES generation forecasting | RMSE (root mean square error) |  |
| Energy Losses | Yearly amount of energy lost on grid’s conductors, transformers, etc. | kWh/year | |
| Voltage variations | Difference between the actual voltage supplied to MV/LV users and the nominal value (indicatively would better be between −5% and 5% [51]) | % |  |
| On-site Energy Ratio | Relation between the annual energy supply from local renewable sources and the annual energy demand | % |  |
| Maximun Hourly Surplus-Deficit (MHS-Dx) | The maximum value of how much bigger the hourly local renewable supply is than the demand during that hour (per year) | KWh | |
| Reduced Energy Curtailment of RES/DES | The difference between the energy curtailments before and after the integration of a/all the proposed solutions. | % | |
| Grid Congestion | Grid sustainability to peaks | % |  |
| Battery degradation rate | The rate at which the battery performance is deteriorating over a year/cycle | % | |
| System Average Interruption Frequency Index (SAIFI). | Measures the average frequency of power-supply interruptions in the system (indicatively would better be <1.5 interruptions per customers and year [52]) |  | |
| System Average Interruption Duration Index (SAIDI). | Measures the average cumulative duration of power-supply interruptions in the system (indicatively would better be <150 min per customer and year [52]) | | |
| Unbalance of the three-phase voltage system | Difference in the voltage of the three phases | % | |
| Harmonic distortion | The Total Harmonic Distortion unit (THDu) indicates the distortion of the voltage wave. There are other THD factors that give relative information about the power, the current etc. (indicatively, would better be ≤5%) | % | |
| Storage Energy Losses | Losses because of energy storage solutions | % | |
| Degree of self-supply | Measures the percentage of PV generation which is used for self-supply, and not injected to the grid. | % |  |
| Frequency Control | Calculates the percentage of times that the average value of the fundamental frequency measured over periods of 10 s goes out of the stated ranges. | % | |
| Name of KPI | Description | Unit | Stakeholders in Charge |
|---|---|---|---|
| EROI | Energy Return on (Energy) Investment taking into consideration the component’s whole life time (indicatively for PVs it is usually >6 [53]) | MWh (usable energy)/MWh (energy used to obtain that energy resource) |  |
| CO2 tonnes saved | Tonnes saved per annum as compared with gas and grid electricity | tonnes CO2 | |
| Noise Pollution Exposure | Noise pollution in residential areas, compared to previous condition. | % |  |
| Reduced Fossil Fuel Consumption | Reduction in the fossil fuels consumption for heating, transportation and power generation | TOE/year | |
| Carbon Footprint of Heating House | Examines the carbon footprint for heating a house with(out) the project’s proposed solutions | Kg CO2/year |  |
| Name of KPI | Description | Unit | Stakeholders in Charge |
|---|---|---|---|
| Life-cycle cost of energy generation (€/ΜWhel or €/ΜWhth) | The sum of all the costs throughout the lifetime of the energy investment, normalized to the energy generated. | (€/ΜWhel or €/ΜWhth) | |
| Internal Rate of Return (IRR) | Profitability of an investment (indicatively a wide value range lies between 5 and 30% for PV investments [54]) | % |  |
| ROI | Return on investment (indicatively can rise above 20% for PVs [55]) | % | |
| Payback Period | The period of time needed for the cumulative gains from an investment to equal the cumulative cost (indicatively could vary between 5 and 20 years for PVs [28]). | Years | |
| Annuity Gain | Measures the annual profits of an investment throughout its lifetime. | €/y | |
| Total capital cost per kW installed | Examines the initial cost of an investment depending on the size of the capacity being installed | €/kW | |
| Feed in Tariff | Energy policy which provides guaranteed price to RES energy investors | € |  |
| Heating Prices | The current price heating energy. | €/kWh |  |
| Load purchasing from mainland | The amount of money for the power that has to be purchased from the mainland | € | |
| Fossil Fuel purchasing from mainland | The amount of money for the fossil fuels that have to be purchased from the mainland for heating, transportation and power generation | € | |
| Transportation Cost | Calculation of the fuel cost for electric transportation (indicatively ranges around 12 €/100 km for a typical family car depending on the cost of gas and whether it is in urban or rural environment [56]) | €/100 km | |
| Name of KPI | Description | Unit | Stakeholders in Charge |
|---|---|---|---|
| Improved access to online services | The extent to which access to online services was improved | Likert scale |  |
| Increased environmental/sustainability education | The extent to which the project has used opportunities for increasing environmental awareness and educating about sustainability and the environment | Likert scale |  |
| City’s unemployment rate | Residents unemployed as a share of all economically active residents | % | |
| DR scheme sensibility | Are consumers satisfied with the DR policy? | Likert scale | |
| EV scheme sensibility | Are consumers going to be using EVs within the next 15 years | Likert scale | |
| Thermal Comfort | Evaluation of the performance of the heating solutions proposed | Likert scale |  |
| Degree of Landscape Impact | Refers to the possible opposition from citizens. A wind turbine or battery may look ugly or obstruct the view to the horizon. An aesthetical measure. | Likert scale | |
| Name of KPI | Description | Unit | Stakeholders in Charge |
|---|---|---|---|
| Local grid balancing legal framework development | The extent to which local grid balancing technologies’ regulation is suitable at EU level and at the partners’ islands level | % |  |
| Micro-grids legal framework | The extent to which micro-grids regulation is suitable at EU level and at the partners’ islands level | % | |
| Suitable Energy Storage Regulation | The extent to which energy storage regulation is suitable at EU level and at the partners’ islands level | % | |
| Monitoring and Evaluation | The extent to which the progress of policies/strategies/projects is evaluated and is adapted according to the findings | Likert scale | |
© 2019 by the authors. Licensee MDPI, Basel, Switzerland. This article is an open access article distributed under the terms and conditions of the Creative Commons Attribution (CC BY) license (http://creativecommons.org/licenses/by/4.0/).
Share and Cite
Pramangioulis, D.; Atsonios, K.; Nikolopoulos, N.; Rakopoulos, D.; Grammelis, P.; Kakaras, E. A Methodology for Determination and Definition of Key Performance Indicators for Smart Grids Development in Island Energy Systems. Energies 2019, 12, 242. https://doi.org/10.3390/en12020242
Pramangioulis D, Atsonios K, Nikolopoulos N, Rakopoulos D, Grammelis P, Kakaras E. A Methodology for Determination and Definition of Key Performance Indicators for Smart Grids Development in Island Energy Systems. Energies. 2019; 12(2):242. https://doi.org/10.3390/en12020242
Chicago/Turabian StylePramangioulis, Dionysios, Konstantinos Atsonios, Nikos Nikolopoulos, Dimitrios Rakopoulos, Panagiotis Grammelis, and Emmanuel Kakaras. 2019. "A Methodology for Determination and Definition of Key Performance Indicators for Smart Grids Development in Island Energy Systems" Energies 12, no. 2: 242. https://doi.org/10.3390/en12020242