1. Introduction
Modern society depends on increasingly complex and interdependent energy systems, such as electric power and gas networks. These systems could be at risk from various threats and faults. A disturbance or failure in one network may not be critical if the two systems are considered separately but, as these networks are coupled, any analysis must include both systems so that the potential propagation or amplification of the individual disturbance effects can be captured. Therefore, the problem of interdependence between critical infrastructure systems must be addressed [
1].
Natural gas and electric power transmission networks are highly interdependent for two reasons: Natural gas is increasingly being used for the production of electricity in combined-cycle power plants, and compressors in gas networks often require electric power. These networks can fail, not only because of their technical complexity, but also because of their interdependence.
The disruption of one infrastructure could cause failures in the other infrastructure, as a result of the interdependent effects that bind these systems together, which can lead to severe economic problems and the loss of human lives [
2]. For this reason, our research takes into account the effects of interdependence when conducting studies in the two joint systems. The above is a situation whose application is generally unconsidered in the scientific literature.
The literature review on natural gas and electricity infrastructures has been traditionally focused on the study of N-1 contingency events, the planning of both integrated systems, the quantification of reliability, and the evaluation of hardening strategies. For example, the references [
3,
4] model a stand-alone system that includes gas network restrictions on the whole energy system. The reference [
5] explores the effect of the gas system on the overall efficiency of the power system, while [
6] analyzes the future of electric power generation as a result of improvements in the natural gas infrastructure.
On the other hand, references [
7,
8] examine the reliability of the electrical system as a function of the natural gas system, while [
9] studies the optimal operation of the integrated energy system via robustness studies. The works in [
10,
11] evaluate strategies in system hardening and smart technologies aimed at increasing resilience. The reference [
12] explores the planning model of the gas-electricity network using coupled cooling heating and power systems.
Although the previous works are related to the study of the gas and electricity networks in a coupled manner, none of them quantifies the consequences of high-impact events that may interfere in the daily operation of these infrastructures. All energy networks are exposed to different types of failures or attacks, and operators must implement risk management methodologies to evaluate the degree of weakness of the system under these severe threats, assessing the vulnerability of the infrastructure.
Therefore, the current research only focuses on load flows in terms of the security of the whole integrated system. Nevertheless, flows within and between infrastructures play a significant role in the operation of both systems. On the other hand, few studies have addressed the concept of vulnerability in coupled energy networks but, in most cases, the large amount of technical information makes it difficult to carry out studies, as evidenced in [
13]. In this sense, complex network theory is an emerging method that can be useful for studying and assessing the vulnerability of critical energy infrastructures [
14].
The vulnerability of the integrated natural gas and power system can be defined as a lack of robustness and resilience against high impact events. Robustness indicates that the joint network continues to operate under attack or disturbance, and resilience indicates that the interdependent system can adapt and achieve a new stable condition after a contingency.
When analyzing the interdependence between natural gas and power systems, two types of vulnerability can be distinguished: Functional and structural vulnerability [
14]. On one hand, functional vulnerability implies a detailed analysis of the operating conditions of the infrastructures [
15]. Although the interconnection of the two systems increases the energy transfer capacity, it also implies that local disturbances spread throughout the networks. The failure of a power line can lead to the inability of distribution substations, which may cause electrical energy not to be delivered to electric compressors in the gas network. The failure of a gas pipeline, as a consequence of a deficient operation, can cause the loss of fuel for the coupled electric generators [
16]. In both cases, a disturbance can spread to the other system and, ultimately, to the end users. On the other hand, structural vulnerability is related to a decrease in performance and efficiency of the integrated network after an attack [
17,
18].
Therefore, this article proposes the use of graph theory to assess the vulnerability of integrated gas and electricity networks and to study the performance of both systems against cascading failures. This technique allows us to overcome the problems derived from obtaining technical data in the infrastructure systems under study. Thus, this article provides an original contribution by developing a more effective proposal, in order to achieve the same results as the well-known technique of coupled load flows, but without the need to use the electrical and mechanical parameters of the infrastructures. We believe that this research will help to better investigate the performance of electricity- and natural gas-critical infrastructures.
The main contributions of this article can be summarized as follows:
A novel methodology, using graph theory, is proposed to assess the structural vulnerability of interdependent electricity and natural gas infrastructures.
The effectiveness of the graph statistical indexes is validated, versus the traditional technique of coupled natural gas and power flows.
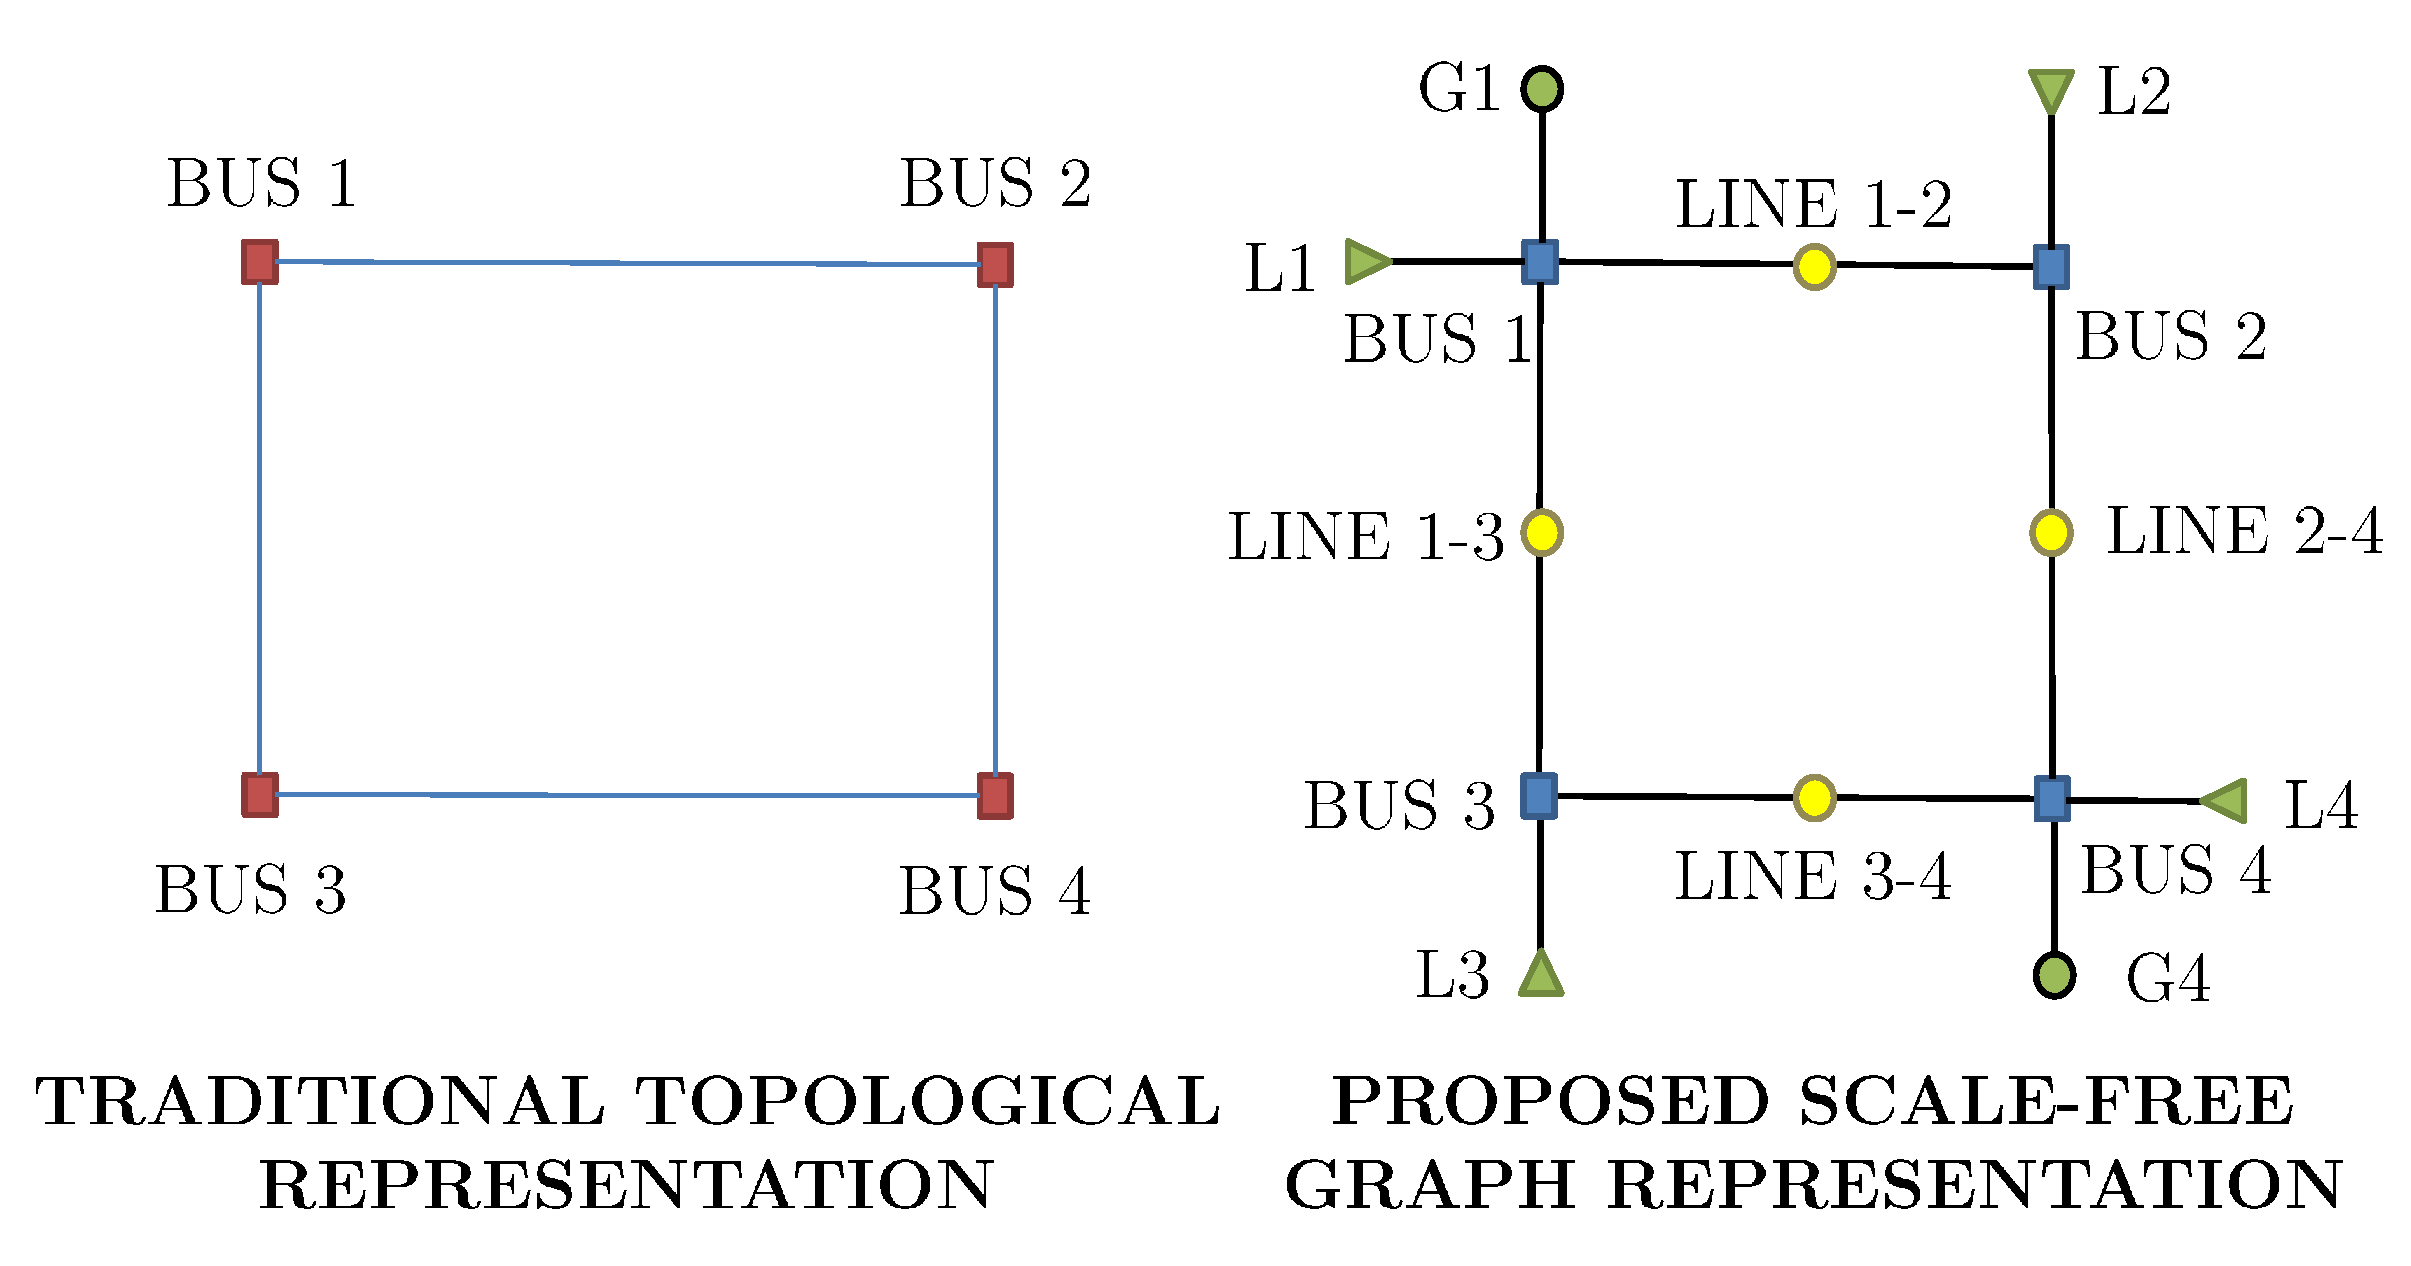
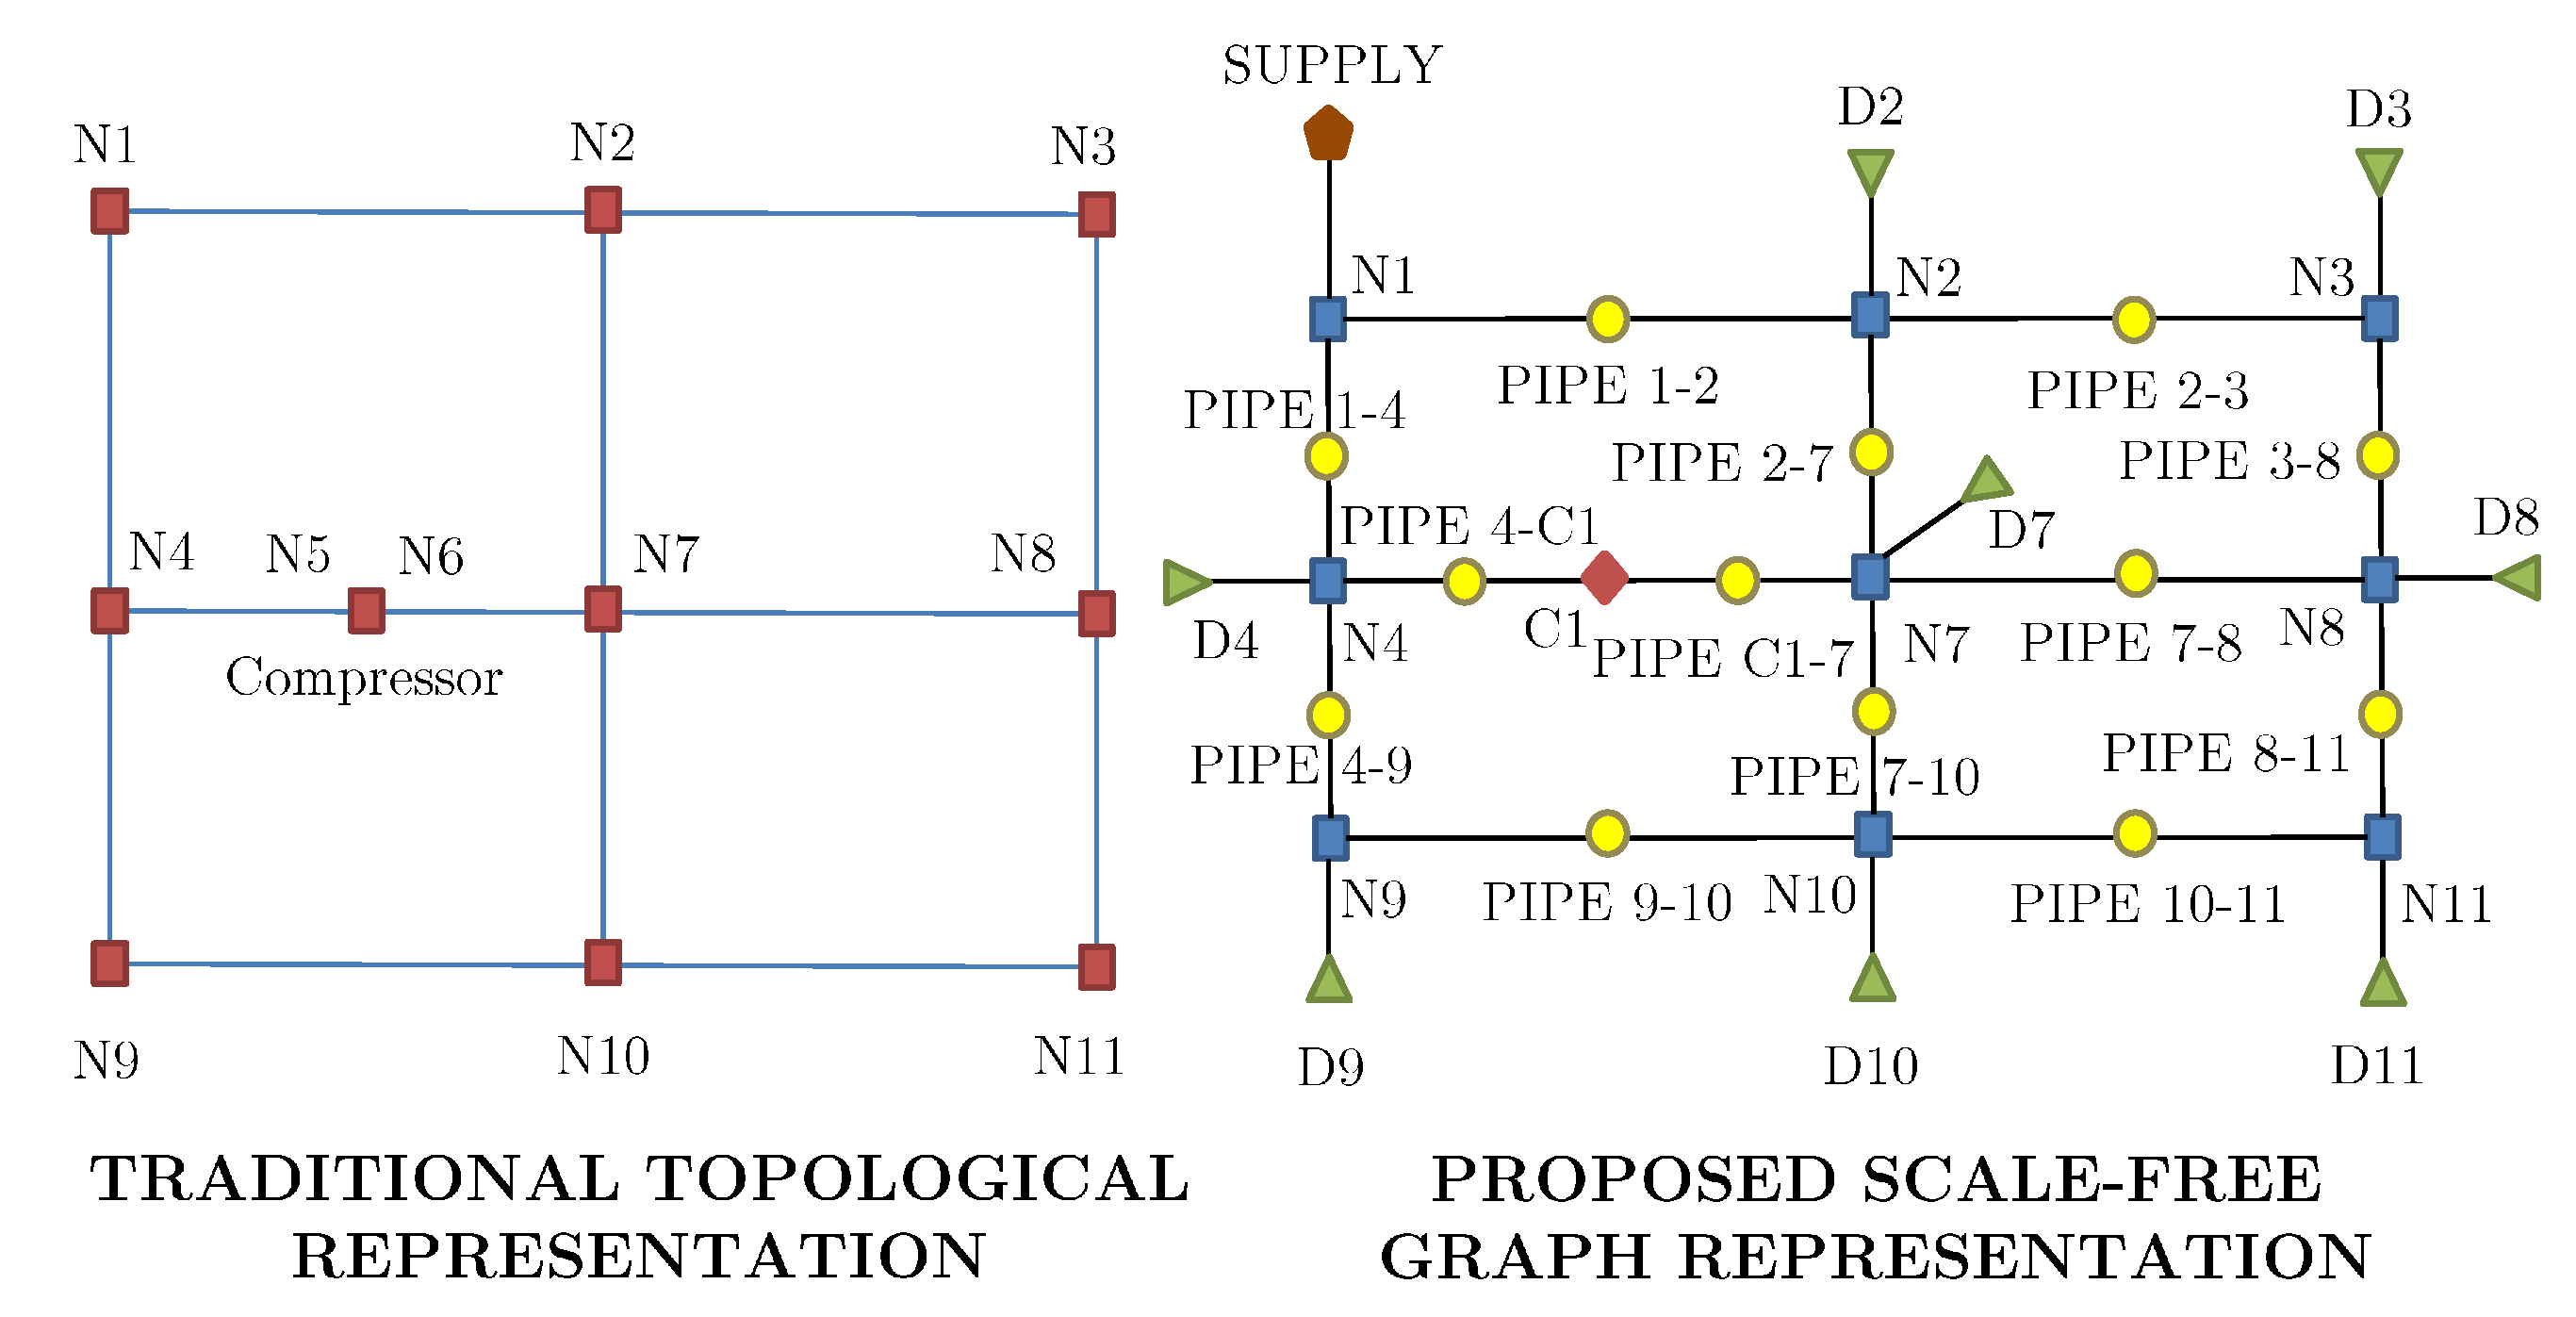
New original topological representations of the natural gas and electricity systems are employed.
The paper is structured as follows.
Section 2 describes the use of scale-free graphs to model electric power and gas networks.
Section 3 presents the vulnerability indexes for networks.
Section 4 describes the cascading failure algorithm for assessing the vulnerability of interdependent electric power and natural gas networks.
Section 5 discusses the numerical results from two case studies of integrated systems represented by electrical and natural gas test networks.
Section 6 summarizes the main conclusions of this paper.
3. Measures of Vulnerability in Networks
We use the geodesic vulnerability index (
) and impact on connectivity (
S) to measure the functionality of the combined electric power and gas network, with respect to the stable condition, when the functionality of a node is compromised. These indexes have been applied to both IEEE test networks and actual electrical networks [
26,
27]. Although the potential of these indexes has been shown in electrical networks, they have not been applied in coupled networks, which is the goal of this work. The geodesic vulnerability index (
) normalizes the geodesic efficiency and balances the process of node elimination, as indicated in Equation (
1):
where:
is the geodesic distance between pairs of nodes of the scale-free graph, following the elimination of a node; and
is the geodesic distance between pairs of nodes of the scale-free graph, for the base case.
The geodesic distance is defined as the shortest distance between two nodes, which is obtained by counting the minimum number of nodes that must be crossed to join them [
28]. The value of
varies between zero and one. The greater the value is, the greater the effect on the supply disruption in the coupled network.
On the other hand, the connectivity index
S, which quantifies the number of nodes that remain connected to the larger network following the elimination of a node, is defined as
where:
is the number of nodes that remain connected in the scale-free graph, following the elimination of a node; and
N is the total number of nodes in the scale-free graph for the base case.
The value of S varies between zero and one. The greater the value is, the greater the number of isolated nodes in the coupled electric power and gas network.
The performance of the coupled electric power and gas network is quantified by the geodesic vulnerability index in Equation (
1) and the connectivity index in Equation (
2), which are determined as a function of the fraction of removed nodes (
f).
Although the performance analysis of cascading failures in a coupled electric power and gas network can be conducted using the evolution of the aforementioned indexes, a comparison of the effectiveness of graph theory measures with that of traditional power flow indexes, which incorporate the electrical and mechanical parameters of the network, must be demonstrated. Therefore, we propose adapting the load shedding index (
LS) to measure the effect of cascading failures by running power flows [
29]. The load shedding index quantifies the loads that remain connected in the coupled network, following successive interruption events.
For an electrical subnetwork, the load shedding index is defined as
where:
is the total active power that remains connected in the electrical network, following the removal of a node;
is the total reactive power that remains connected in the electrical network, following the removal of a node;
is the total active power in the base case; and
is the total reactive power in the base case.
For a gas subnetwork, the load shedding index is defined as
where:
is the total gas demand remaining connected in the gas network, following the removal of a node; and
is the total gas demand in the base case.
Note that, in Equation (
4), the gas demand is normalized to the electrical equivalent, which is calculated from the calorific value and the operating pressure and temperature at each node. In this work, we assumed that 1 m
of natural gas is equivalent to 11.63 kWh for all the nodes of the network, as indicated in the data provided in [
30].
In both the gas and electrical networks, the value of
LS varies between zero and one. As the value increases, the effect on the loads connected in the coupled network also increases, where the effect is measured as a function of the fraction of removed nodes (
f). The solutions obtained with this index are compared with the results obtained through the graph theory indexes given in Equations (
1) and (
2).
4. Algorithm to Evaluate Structural Vulnerability in Coupled Electric Power and Gas Networks
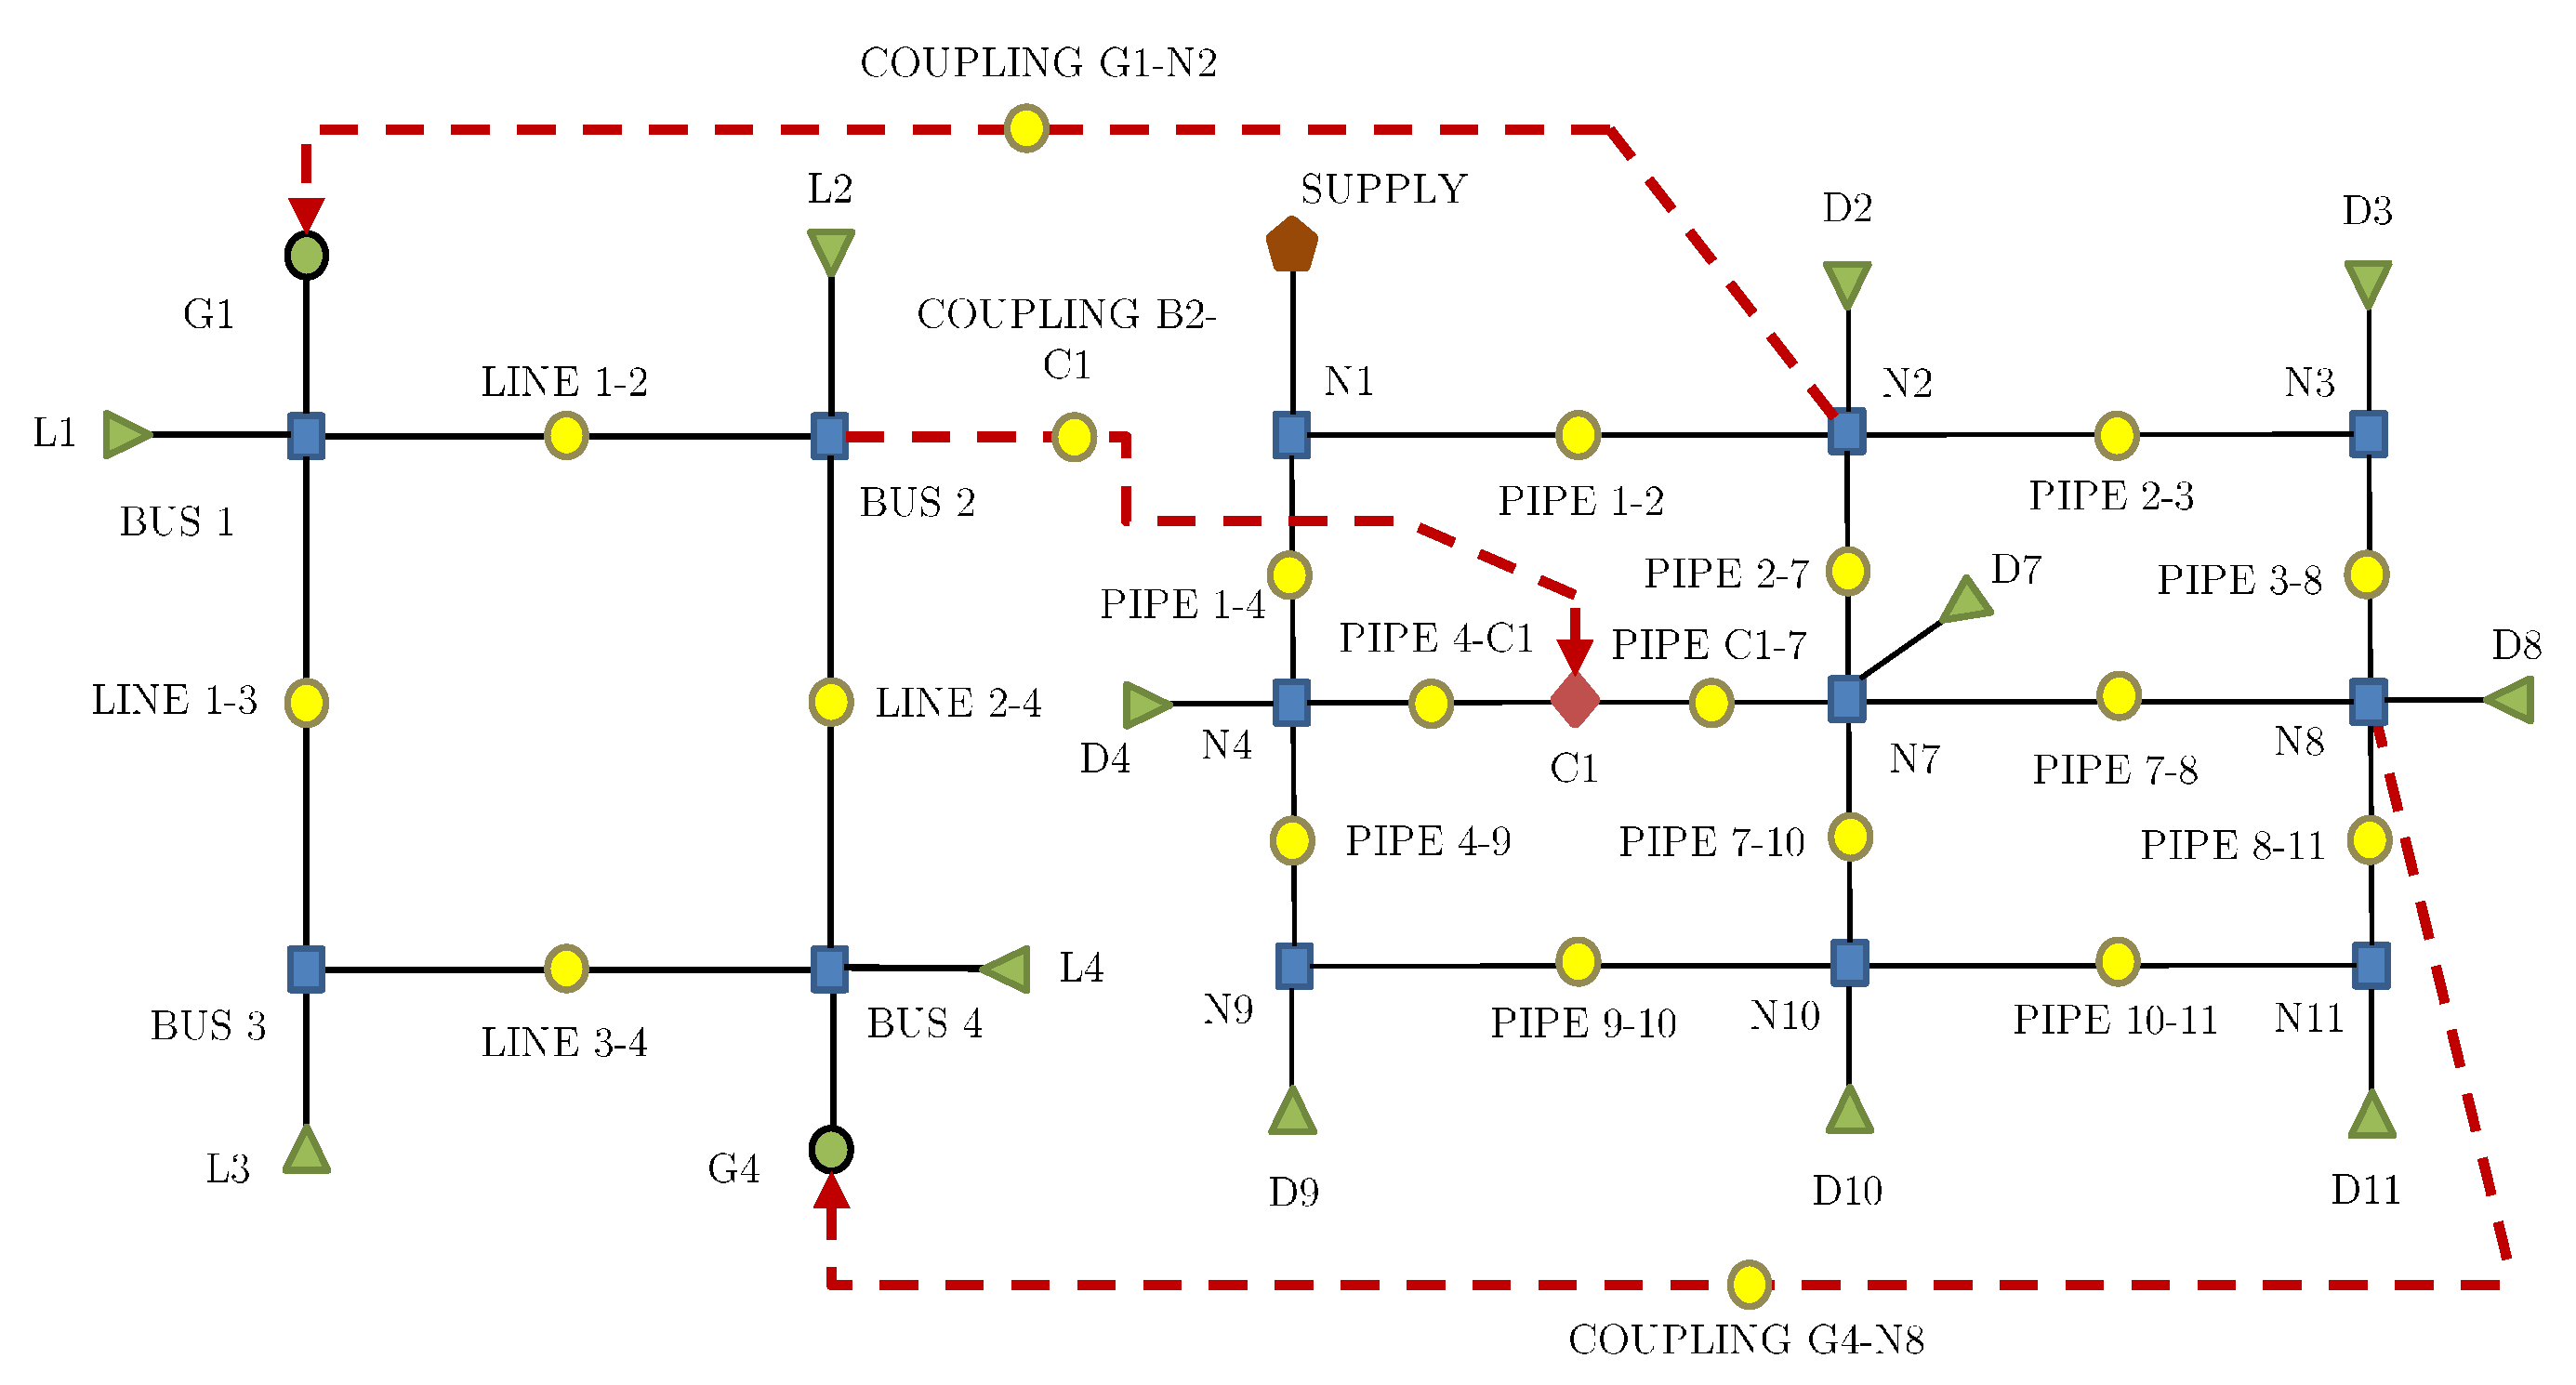
In this paper, we assess the structural vulnerability of coupled electric power and gas networks in a cascading failure event. For simplicity, IEEE test networks and natural gas test networks are used. The two networks are coupled by interdependent links that represent the bidirectional dependencies, as indicated in
Figure 3. It is assumed that the electrical network has
m combined-cycle natural gas power plants, which are fed from
n nodes of the gas network. Identically, the gas network has
p compressors that operate through an external power supply, provided by
q nodes of the electrical network.
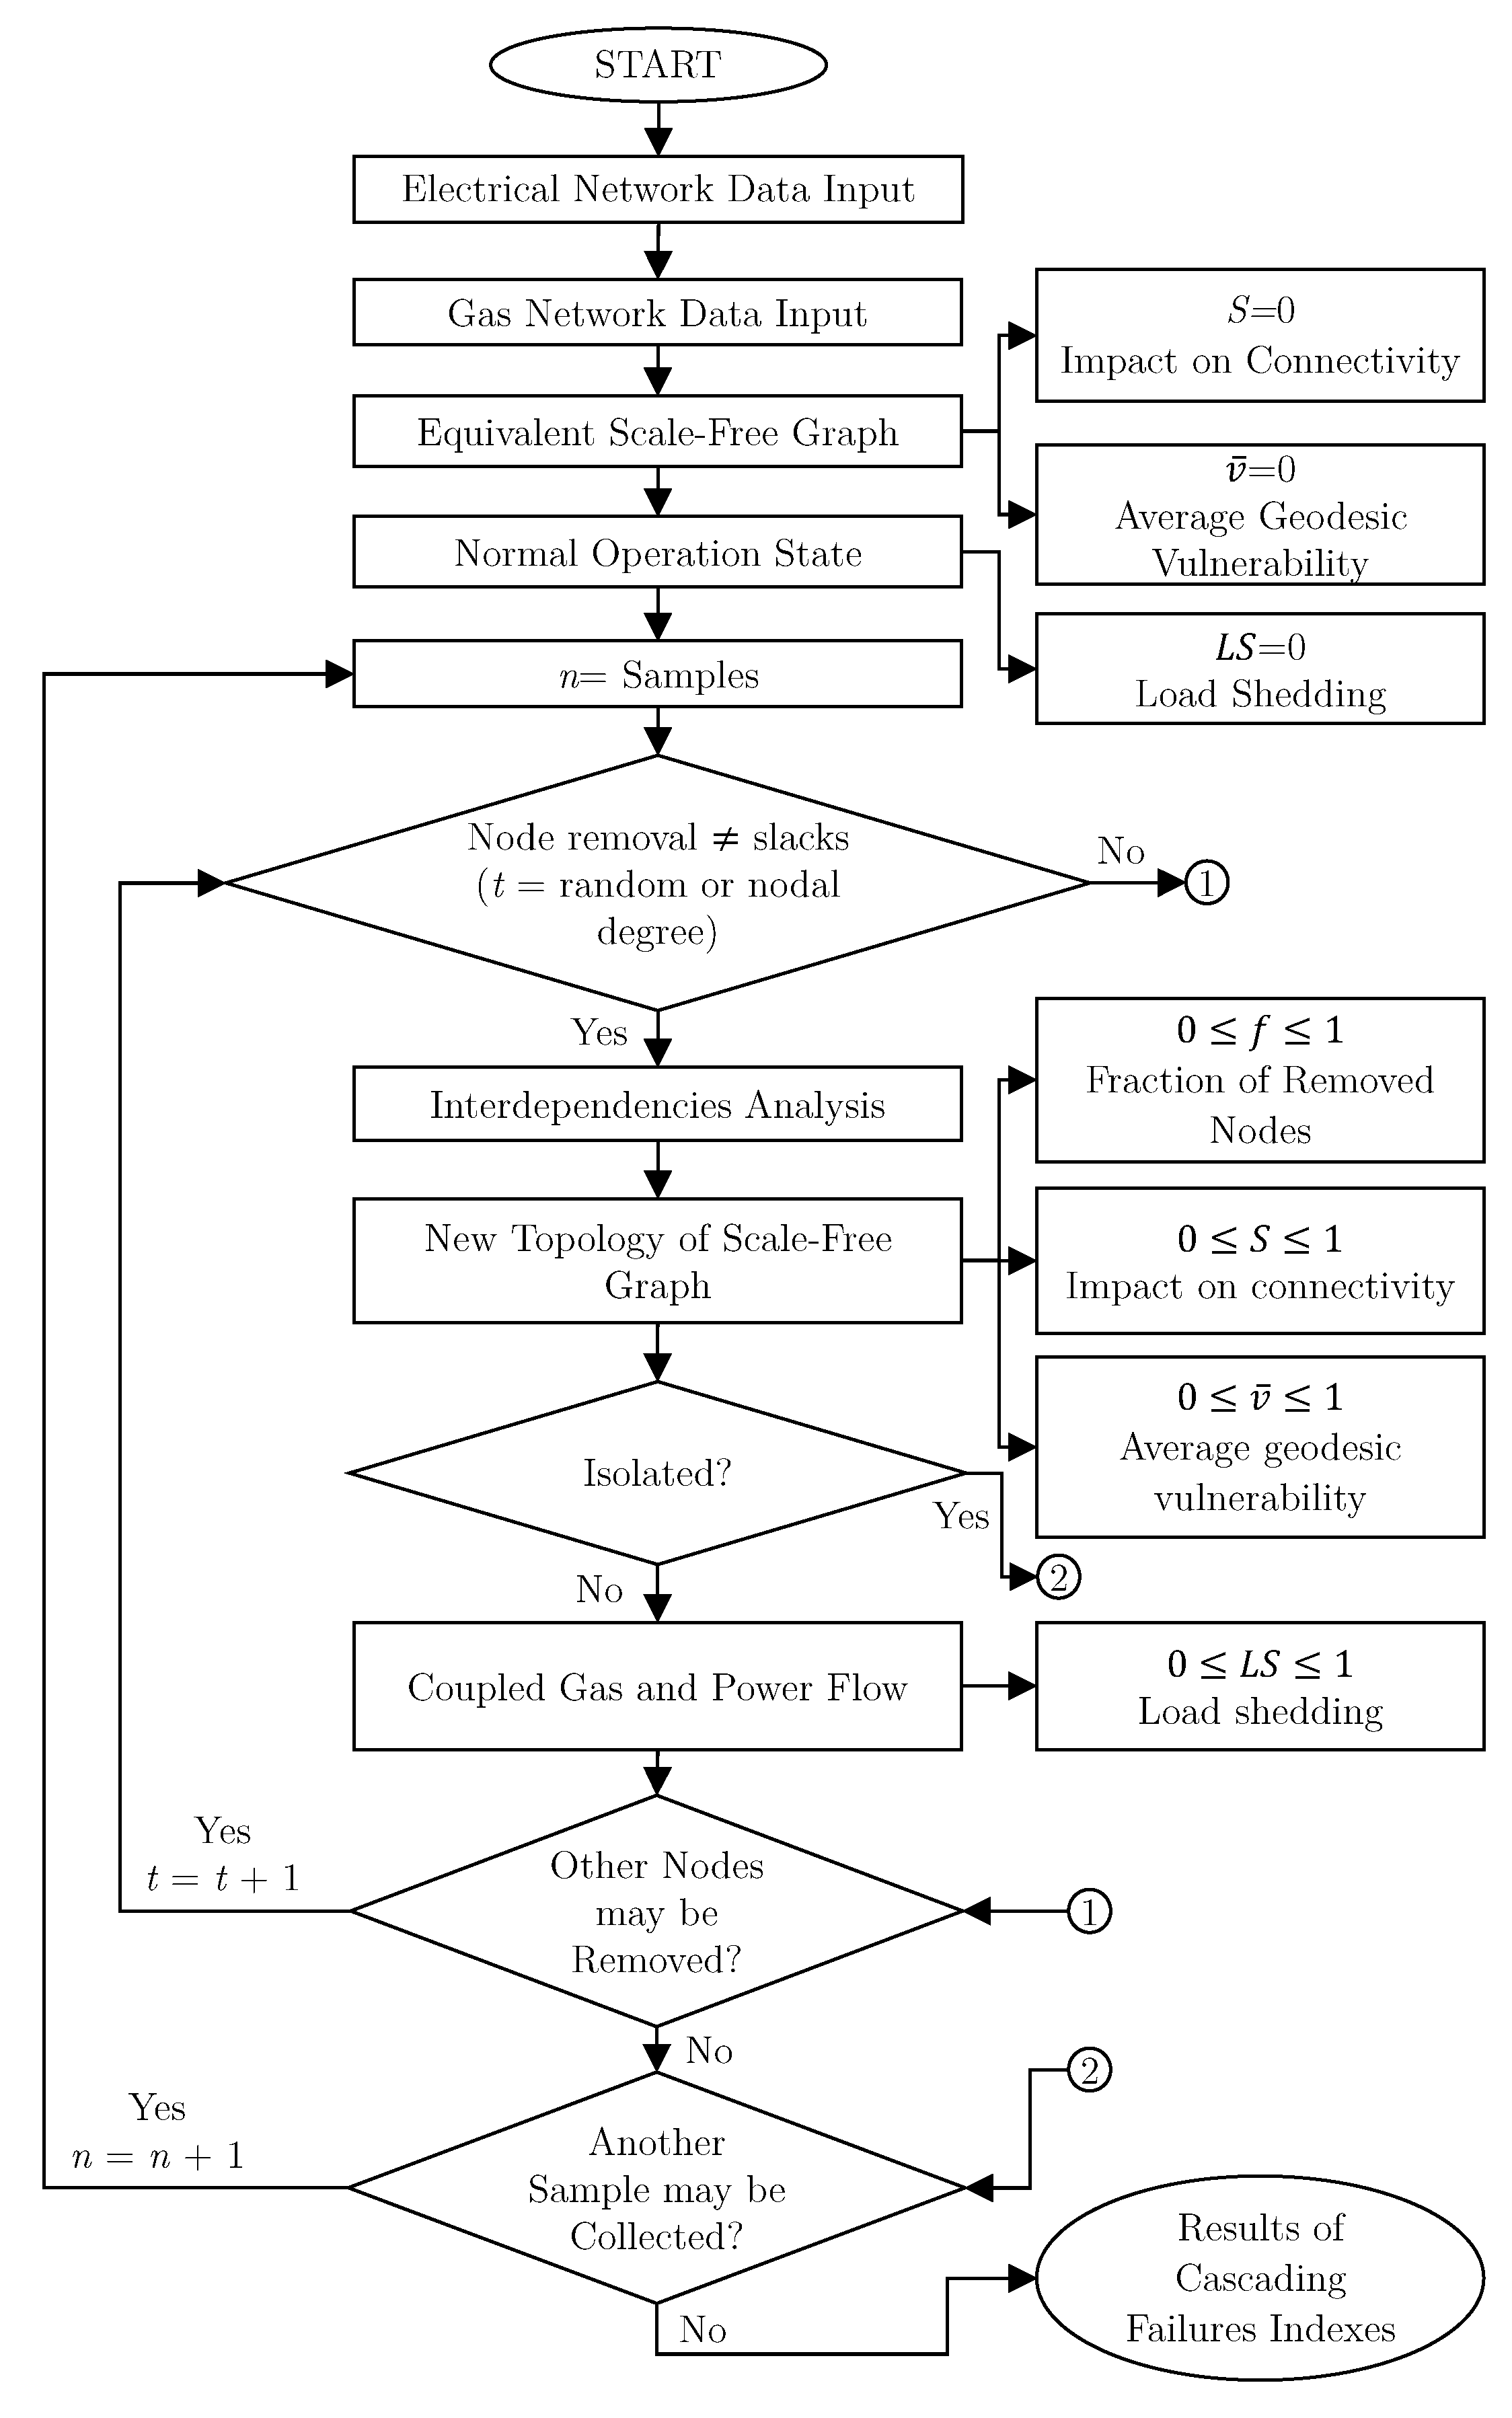
Figure 4 shows the flow chart of the proposed algorithm to evaluate the structural vulnerability against cascading failures in coupled electric power and gas networks, where the geodesic vulnerability index (
), the connectivity index (
S), and the load shedding index (
LS), measured for each fraction of removed nodes (
f), are used to assess the vulnerability.
Cascading failures are simulated by removing nodes to represent two types of disruptions:
Successive iterations of N-
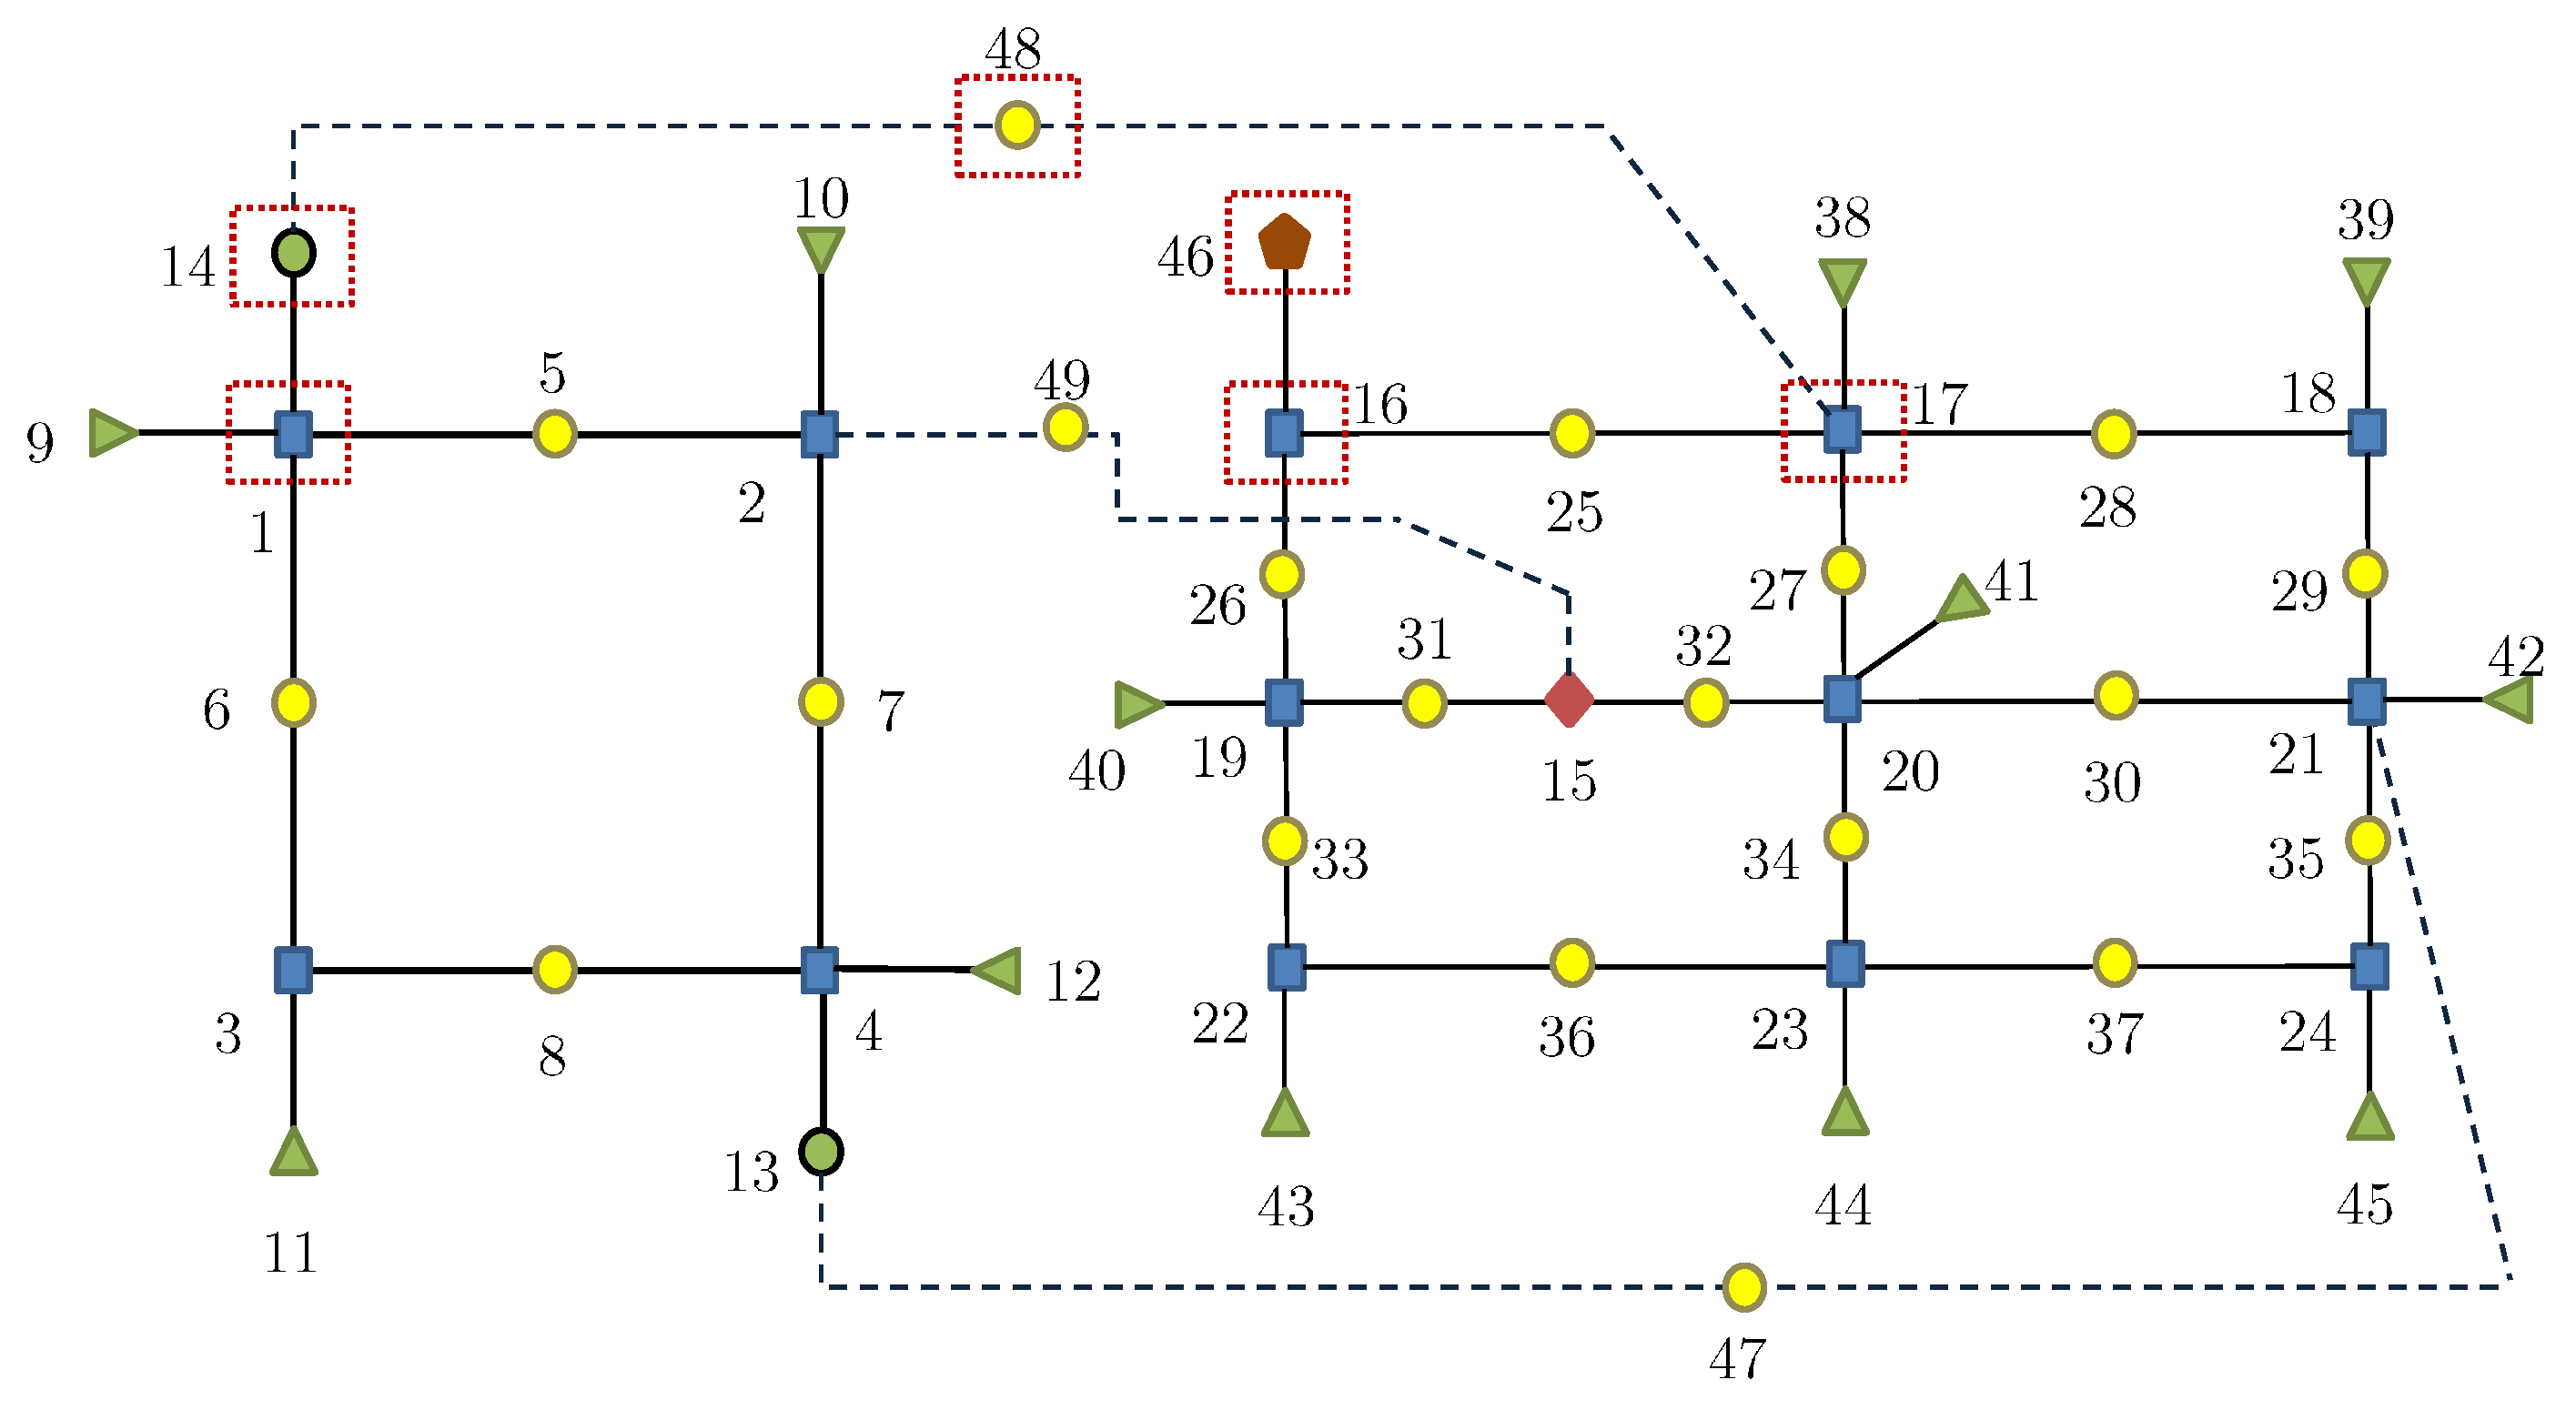
k contingencies are performed on a coupled network, where the structure of the network changes as each node is removed. As it is not possible to run power flows without the existence of a slack electric generator, a gas supply injection node, and a coupling link between the slack generator and the gas network, these nodes are excluded from removal in the simulations (red boxes in
Figure 5). This is because the slack generator provides the balance in the power flow equations, the gas injection node represents the gas delivery point for the coupled generator, and the coupling link represents the asset that transports natural gas between the two infrastructure systems. Thus, in order to obtain the solution to the flow equations of both networks and to give a realistic representation, the proposed algorithm in
Figure 4 always keeps these nodes linked. Besides, this allows the calculation of the LS and
indexes to be unified during the decomposition process of interdependent networks.
In
Figure 5, electric generator 14 and bus 1 are fixed references for the electrical network, node 48 represents the pipeline that transports natural gas from node 17 of the gas network to generator 14, and node 46 represents the gas supply injected into the network from node 16. It would not be possible to run power flows if these nodes were removed.
The successive removal of nodes can generate interdependent effects in the coupled network, especially if the nodes involve the natural gas supply to the generators, the electrical substations that provide electric power to the compressor units, the supply pipelines to the compressors, or the coupling links between the gas and electrical networks.
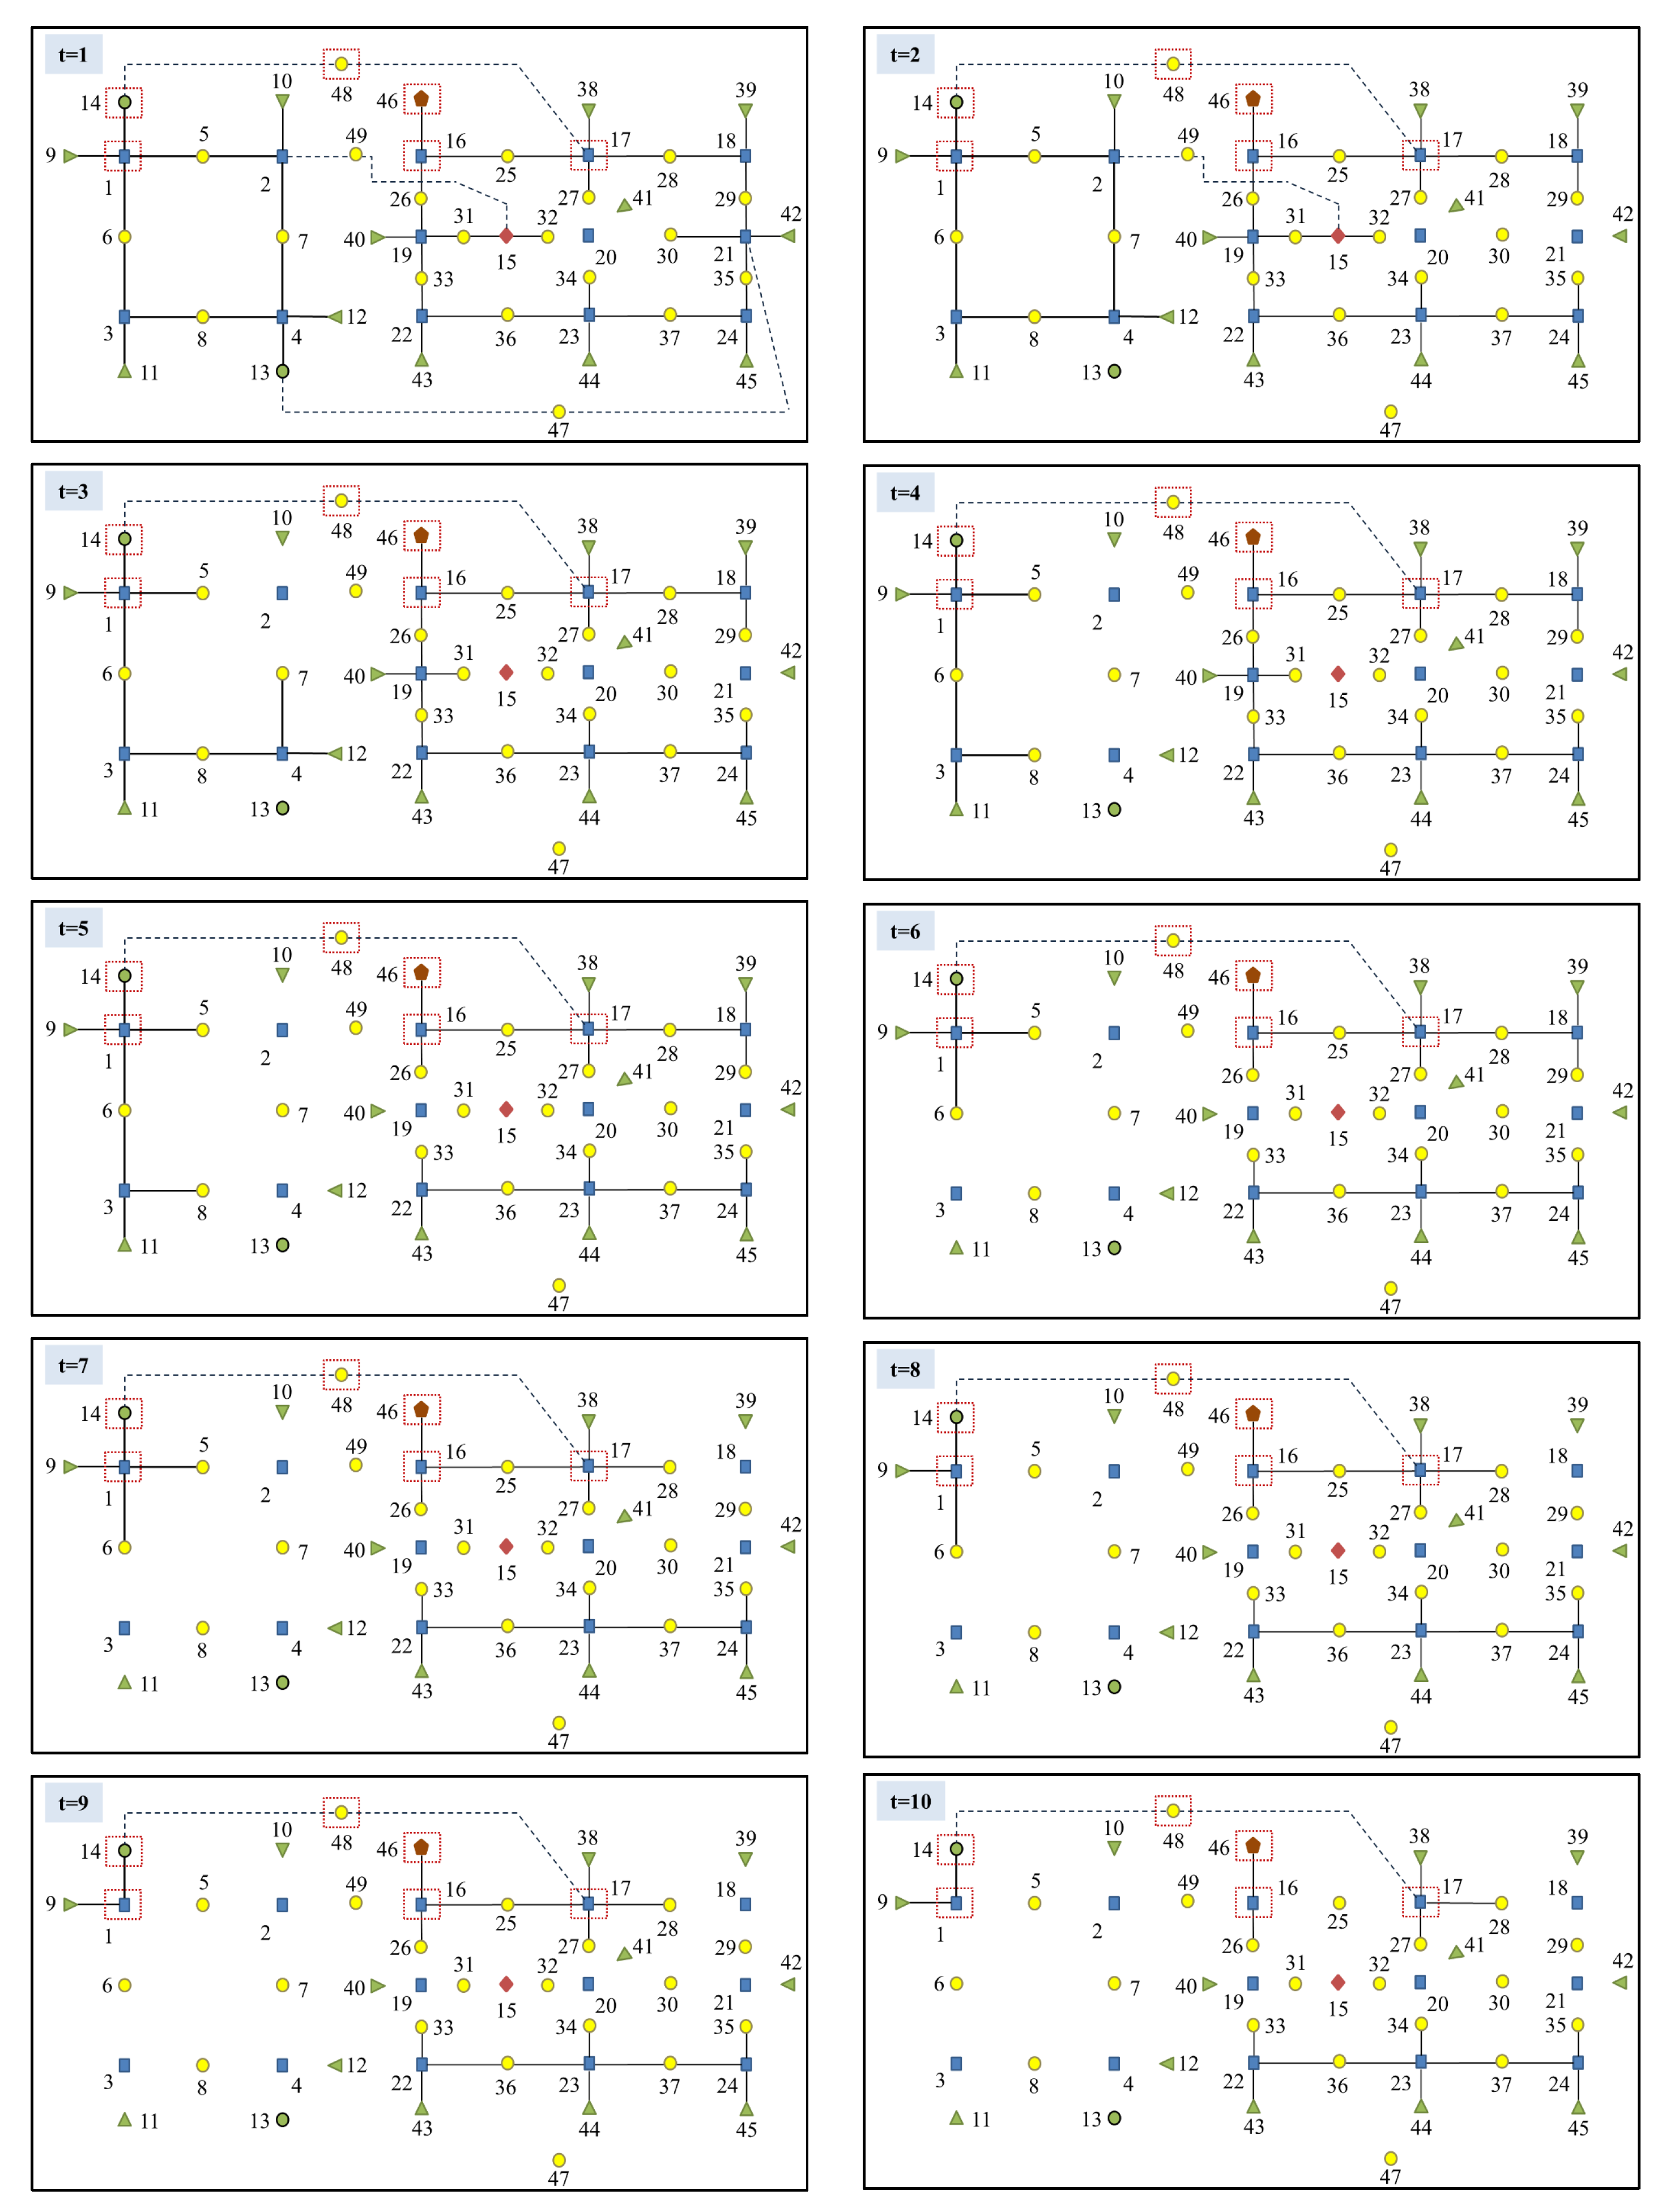
The iterative process, detailed below in
Figure 6, shows steps in the execution of the flow chart of
Figure 4, applying a deliberate attack scenario to the graph shown in
Figure 5. Starting with the node with the highest number of incident links and proceeding in descending order of nodal degree, in each iteration step (
t) a node with a large number of links is eliminated. The geodesic vulnerability index (
), the impact on connectivity index (
S), and the load shedding index (
LS) are then calculated. The calculations are performed only for the largest set containing the nodes that cannot be eliminated (i.e., those indicated by the red boxes in
Figure 5). This is done with the purpose of obtaining a unified computation of load shedding and geodesic vulnerability indexes. Otherwise, it could cause divergences in the results of the graph statistical index.
In
Figure 6, the evolution process of the coupled natural gas and electric power network of
Figure 5 is illustrated. Note that, when node 20 is initially removed at
t = 1, the network is divided into three independent subnetworks, for which two nodes do not have links.
In the next time step (t = 2), the node with the next highest order, node 21, is removed from the larger subnetwork. Note that, when this node is eliminated, an interdependency effect appears in the electrical network because this node supplies natural gas to the generator represented by node 13. The interdependence in our model emerges when the coupled generator (node 13) and its connection (link 47, which represents the natural gas supply) are removed from the graph.
At t = 3, the attack on node 2 of the electrical network causes a new interdependence effect, now on the gas network. The loss of this asset prevents electricity from flowing to the compressor at node 15. The interdependent effect is simulated by disconnecting the affected assets (nodes 2, 49, and 15) of the coupled graph. In some cases, the node that is attacked corresponds to the input pipeline of a compressor; in those cases, it is necessary to determine whether the compressor unit is powered by electricity or by natural gas. In either case, a disruption to an inlet pipeline is equivalent to the loss of the compressor, and also of the link to the electrical network, if the unit relies on an external power supply. Similarly, the elimination of couplings causes interdependent effects on both networks. For example, the loss of node 47, which represents a natural gas transmission pipeline, causes the loss of the coupled generators. In turn, the loss of node 49, which represents the electrical transmission lines, causes the loss of the coupled gas compressors. The neighboring nodes that are affected as a result of the elimination of the links between the two networks must be eliminated from the graph.
In many cases, there are multiple nodes with the same number of connecting links. In these cases (at t = 4, for example), a node is chosen at random from among those with the same nodal degree.
At
t = 5, several islands are formed when node 19 is disrupted. One of the islands contains nodes that cannot be eliminated. Therefore, in the next iteration the node to be eliminated is required to be on the same island, as can be observed in
Figure 6 from
t = 6 to
t = 9. The algorithm ends when there are no more nodes to remove, or there are no more networks for which power flows could be obtained, in this case at
t = 10.
The algorithm in
Figure 4 was implemented in the Matlab® programming environment. The coupled natural gas and electricity flows have been calculated, using the modeling framework explained in detail in [
32]. The program developed here includes graph theory algorithms, such as using the shortest path algorithm of Bellman-Ford [
33] to calculate the geodesic distances in Equation (
1).
In this way, it is possible to evaluate the structural vulnerability of coupled electric power and gas networks to cascading failures for both deliberately induced and randomly occurring faults.
5. Case Studies
Given the novelty of the problem posed here, it was necessary to define coupled test networks of electrical and natural gas infrastructures. The systems used here are the IEEE-57 and IEEE-118 test networks, and the Osiadacz test networks of 22 and 25 nodes. The IEEE-57 and IEEE-118 Bus Test Cases represent a portion of the American Electric Power System (in the Midwestern US) [
34], and the Osiadacz test networks of 22 and 25 nodes represent a gas infrastructure similar to that of Belgium [
35,
36]. Thus, we constructed two case studies:
A combined system consisting of the IEEE-57 bus network and a 22 node gas network, and
a combined system consisting of the IEEE-118 bus network and a 25 node gas network with 3 compressors.
The details of the networks are as follows.
Case study (1):
The 22 node gas network consists of 19 non-electric loads, one supply, and 36 pipelines. Node 21 is assumed to be a supply. The gas system is analyzed using Weymouth’s generalized gas flow equation. An average gas temperature of 495
R is considered, and an average compressibility factor of 0.90 is assumed for illustration purposes. In this case study, the gas has a specific gravity of 0.69, and all pipelines are assumed to be horizontal with an efficiency of 1.0. The physical characteristics of gas pipelines and loads can be found in [
35].
The IEEE-57 bus network consists of 42 loads, 17 transformers, 80 lines, 3 capacitors, and 7 generators [
34].
It is assumed that generators 1, 2, 3, 6, 8, and 9 are natural gas combined-cycle power plants fed by gas network nodes 22, 14, 15, 9, 5, and 1, respectively. The operation characteristics of the coupled generators are presented in
Table A1.
Case study (2):
The 25 node gas network consists of 18 non-electric loads, 3 compressor units, 1 supply, and 35 pipelines. Node 1 is assumed to be a supply. The gas infrastructure is analyzed using the Weymouth’s gas flow equation. The average fluid temperature is 520
R with an average compressibility factor of 0.90. The gas has a specific gravity of 0.69, and all pipelines are horizontal with an efficiency of 1.0. The physical characteristics of gas pipelines and loads can be found in [
35].
The IEEE-118 bus network consist of 99 loads, 9 electrical transformers, 186 transmission lines, 14 capacitors, and 54 generators [
34].
Generators 10, 12, 18, 19, 46, 49, and 69 are assumed to be natural gas combined-cycle power stations fed by gas network nodes 20, 7, 18, 8, 9, 10, and 4, respectively. The operation characteristics of the coupled generators are presented in
Table A2.
The electrically powered compressors are supplied with power by the substations of the electrical network at nodes 26, 60, and 58. The compression units operate with consumption factors of 199.92 SCFD/HP, a suction temperature of 520 R, average compressibility of 0.90 and a polytropic exponent of 0.90. Moreover, the compressors operate in one stage with compression ratios of 1.8.
In
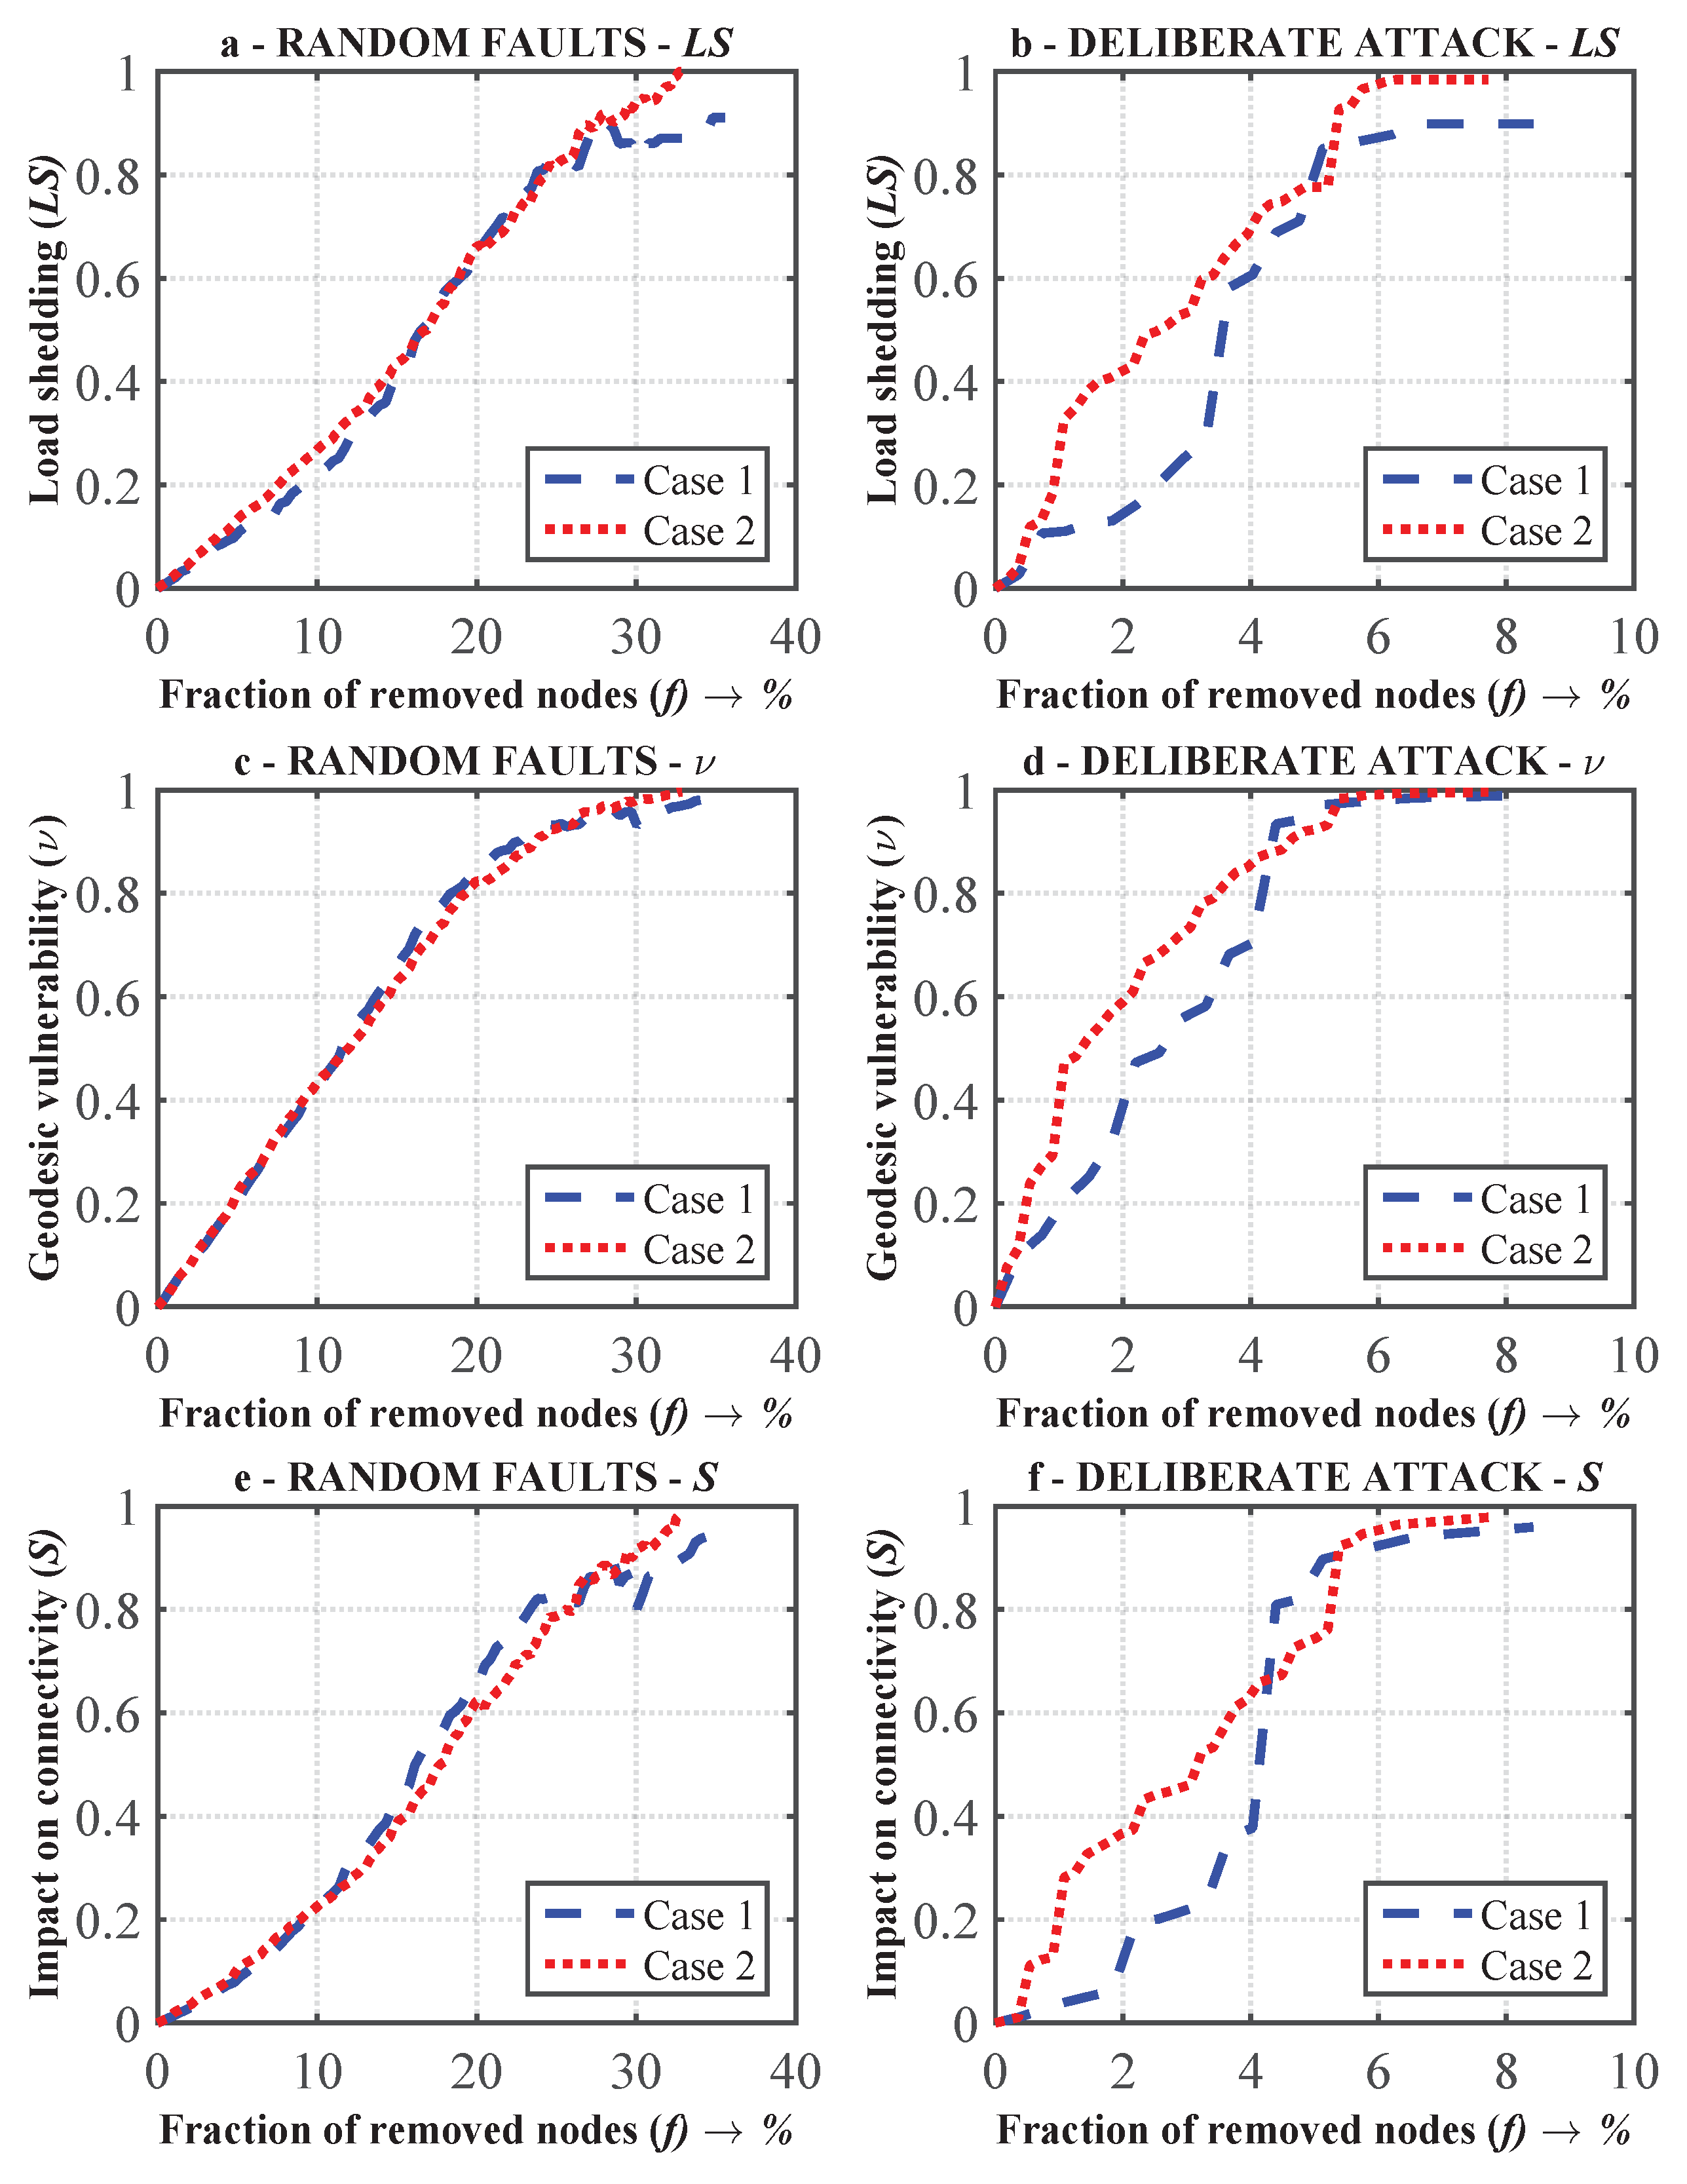
Figure 7, the simulation results for the two case studies are shown.
Figure 7a,c,e show the results for randomly occurring faults, and
Figure 7b,d,f show the results for deliberately induced faults. In the following, the results obtained with the load shedding index (
LS) are compared with the results obtained with the two graph theory indexes, the geodesic vulnerability index (
) and connectivity index (
S). These indexes are dimensionless and are calculated for the eliminated nodes fraction (
f), as shown in the flow chart in
Figure 4.
5.1. Load Shedding Index (LS)
From the power flow method, it can be observed in
Figure 7a that, with randomly occurring faults, the total collapse of the coupled networks occurred following the elimination of more than 30% of the nodes, which indicates that complete failure occurred gradually. The evolution of
LS for case study 2 shows that this coupled network was more vulnerable, because there was greater load shedding for the same eliminated node fraction. In addition, the results show that the system in case study 1 collapsed at a greater eliminated node fraction.
Figure 7 shows that, under deliberate attacks, the networks collapsed with the elimination of only 7% of the nodes. The results for deliberate attacks again showed that the system in case study 2 was more vulnerable. This system has compressors powered by electricity, which results in greater dependencies between the electrical and gas networks.
Case study 2 reflects what would happen in an actual network if the nodes with strong connectivity were attacked, where the interdependent effects would cause significant economic and social disruption.
Additionally, note that the evolution in the system topology generates a slight load recovery when about 30% of the nodes are removed (
Figure 7a). This can be explained by the fact that, in different samples, a circuit is connected around the largest connected component that allows the circulation of power flows, but a new iteration of these cascading failures causes a new collapse in the network.
5.2. Graph Theory Indexes
Figure 7c–f show the results obtained with the graph theory indexes
and
S to randomly occurring and deliberately induced faults. These indexes can be compared with
LS.
For the randomly occurring faults, the indexes
and
S were consistent with the results obtained with
LS: The networks collapsed, following the elimination of more than 30% of the nodes. Comparing
Figure 7a,c, it can be observed that the system in case study 2 was more vulnerable. Moreover, the trend in
was very similar to that of
LS. However, comparing
Figure 7a,e, it can be observed that
S, despite producing acceptable results, was not highly consistent with
LS. These differences are evident in the deliberate attack scenarios, shown in
Figure 7b,f. This difference is more evident in case study 1.
The network decomposed more rapidly with deliberate attacks than with random faults. The results, shown in
Figure 7d,f, indicate that the networks became isolated when more than 7% of the nodes were eliminated.
It should be noted that, in all cases, when the value of was nearly one, there was a greater fragmentation of the network. Similarly, the value of S was nearly one as the network was almost completely disintegrated.
Comparing the results of
Figure 7a–d, it can be concluded that, when compared with
LS,
more accurately represents the disintegration of the coupled networks than
S.
5.3. Correlation between Indexes
The curves plotted in
Figure 7 allow graphical comparisons between the different sets of results, obtained using coupled load flow techniques and the statistical indices of graph theory. However, visual representation is not desirable in most cases, and a quantitative index is needed to determine the degree of correlation of the results more accurately. The Pearson correlation coefficient
is a practical measure to calculate the dependence between LS and
and between LS and S. This index is obtained by dividing the covariance of each pair of variables by the product of their standard deviations
[
31].
The correlation coefficient
between
LS and
is given by
and the correlation coefficient
between
LS and
S is given by
Table 1 shows the values for the correlation coefficients
and
for the various cases. Note that, in the degradation of the coupled networks with random faults, the value of
is closer to +1 for the two case studies, which implies a positive linear relation between
LS and
. This analysis shows that the statistical graph measure
is useful for determining which loads are disconnected in cascading failures.
The values of also indicate a correlation in both case studies, although the value, again, shows that S evolved slightly differently from , with respect to LS.
Similar results for
were obtained for the cases with deliberate attacks. Therefore, the geodesic vulnerability index
is useful for comparing different topologies of coupled networks, to determine which is more vulnerable. The results obtained are consistent with the qualitative relations observed in
Figure 7a,c for random faults, and in
Figure 7b,d for deliberate attacks.
Table 2 shows the execution times of the algorithm of
Figure 4 in the two case studies and for both node removal strategies, either running coupled load flow and, alternatively, using graph indexes. It is observed that the centrality measures of graphs are more computationally efficient than the coupled load flow on the gas and electricity networks, since the computation times were reduced by more than 80%. Therefore, the geodesic vulnerability index is a measure that can very well characterize the structural vulnerability of different interdependent electricity and natural gas infrastructure topologies.
The importance of the proposed geodesic vulnerability index is that it can be used for analyzing coupled electric power and gas networks without detailed knowledge of the system’s electrical and mechanical parameters. Moreover, this method can provide the operators of electric power and gas systems a new tool for analyzing the interdependencies in these networks. Also, in broader terms, the methodology developed here may be useful for studying network expansion plans, from the viewpoint of structural vulnerability and robustness. In other words, thanks to the proposed statistical measure, each of the different investments in the network could be evaluated. The results obtained would provide an overview of how different assets could improve or worsen the response behavior of the coupled infrastructure in the face of undesirable events.
6. Conclusions
In this paper, a methodology, based on graph theory, has been proposed to analyze the structural vulnerability of coupled natural gas and electricity networks. New topological representations of both infrastructures, as scale-free graphs, have been defined to consider the interdependence effects of four assets: The gas network facilities that supply fuel to the combined cycle plants, the electrical substations that provide power to the compressors, the compressor inlet lines, and the coupling links between both networks. Vulnerability has been quantified, using the results obtained from the traditional indices of coupled load flow (LS) and, alternatively, from two statistical indices from graph theory, and S, applied to two case studies. In the latter, a statistical analysis has shown a strong correlation between the load shedding (LS) index and the geodesic vulnerability index. Thus, for the first time, a statistical measure of geodesic vulnerability has been validated, surpassing the traditional indices which require a detailed knowledge of the electrical and hydraulic parameters of the systems. The results have clearly shown that the graph index is more efficient from a computational standpoint than the load flow measurement, because the computation time needed to perform the studies was reduced by more than 80%. As a result, a new method has been established to estimate the structural vulnerability of joint electricity and gas systems, using the proposed geodesic vulnerability index.
Our future research will apply this methodology to identify critical assets more susceptible to cascading failures, and to study optimal strategies for network recovery.


