Application of Response Surface Analysis to Evaluate the Effect of Concentrations of Ammonia and Propionic Acid on Acetate-Utilizing Methanogenesis


Abstract
:
1. Introduction
2. Material and Methods
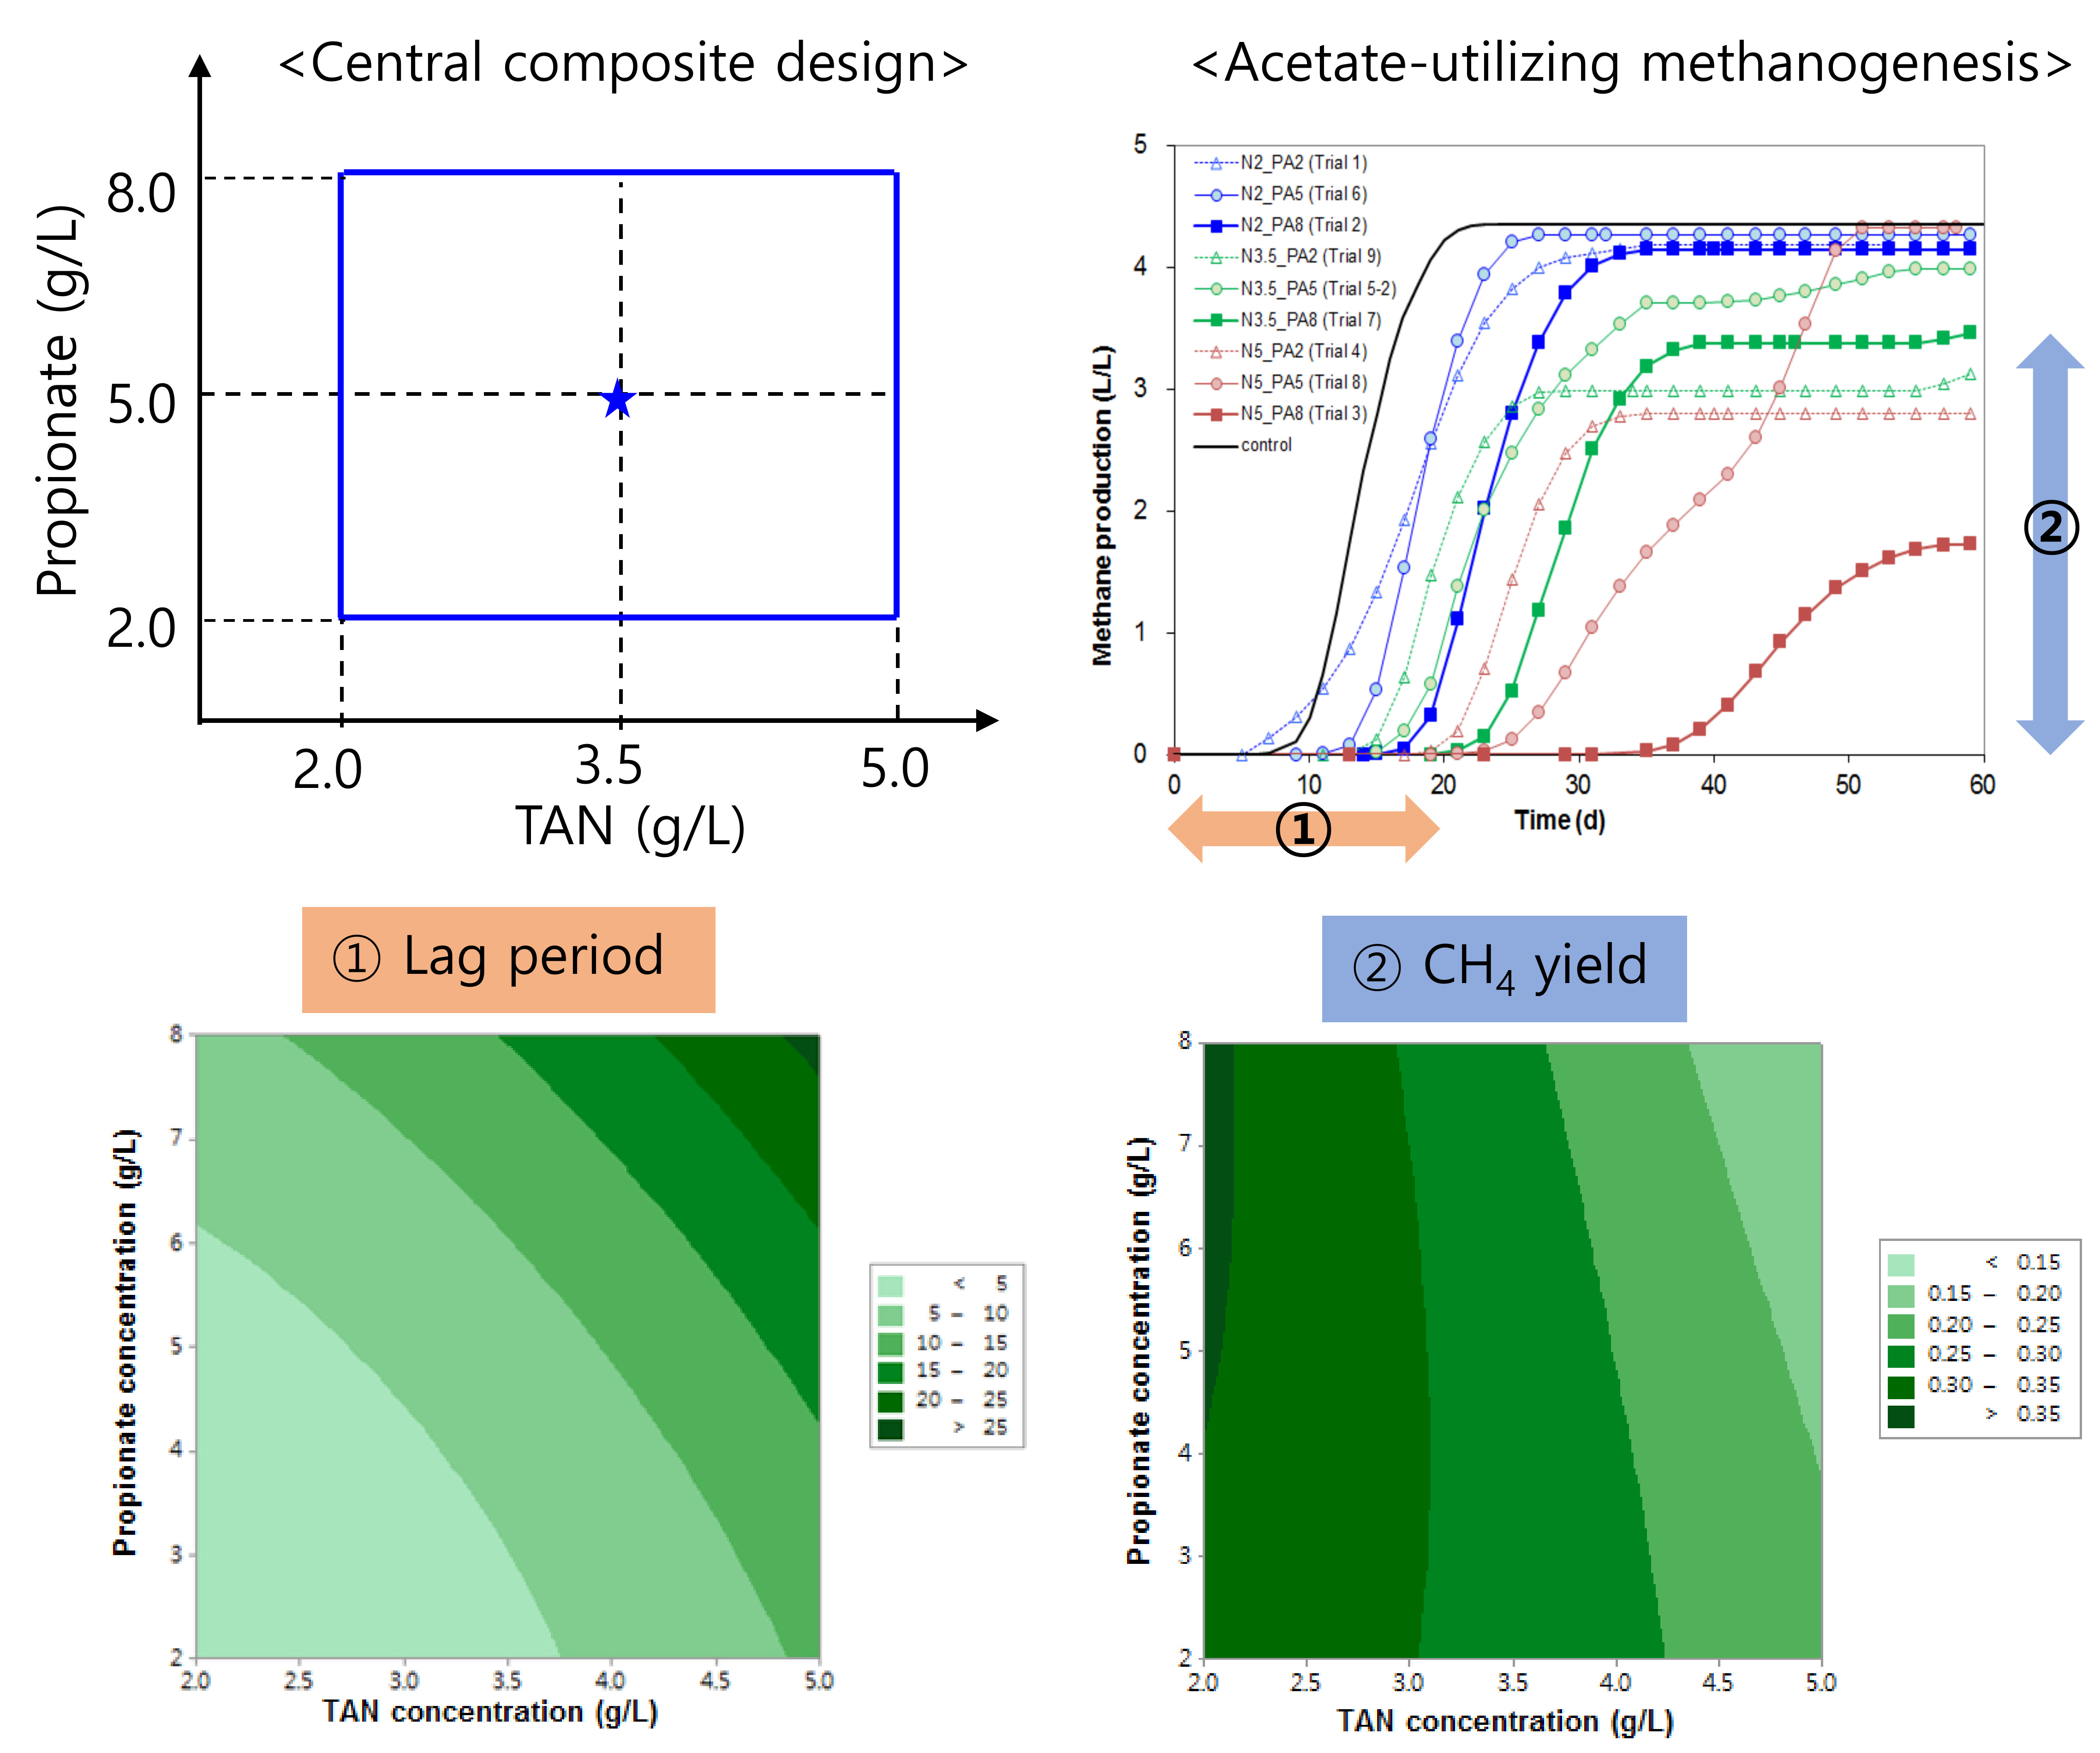
2.1. Design of Experiment and Variables
2.2. Inoculum and Inhibition Test
2.3. Analytical Methods
2.4. Real-Time PCR
3. Results
3.1. RSA Experiment
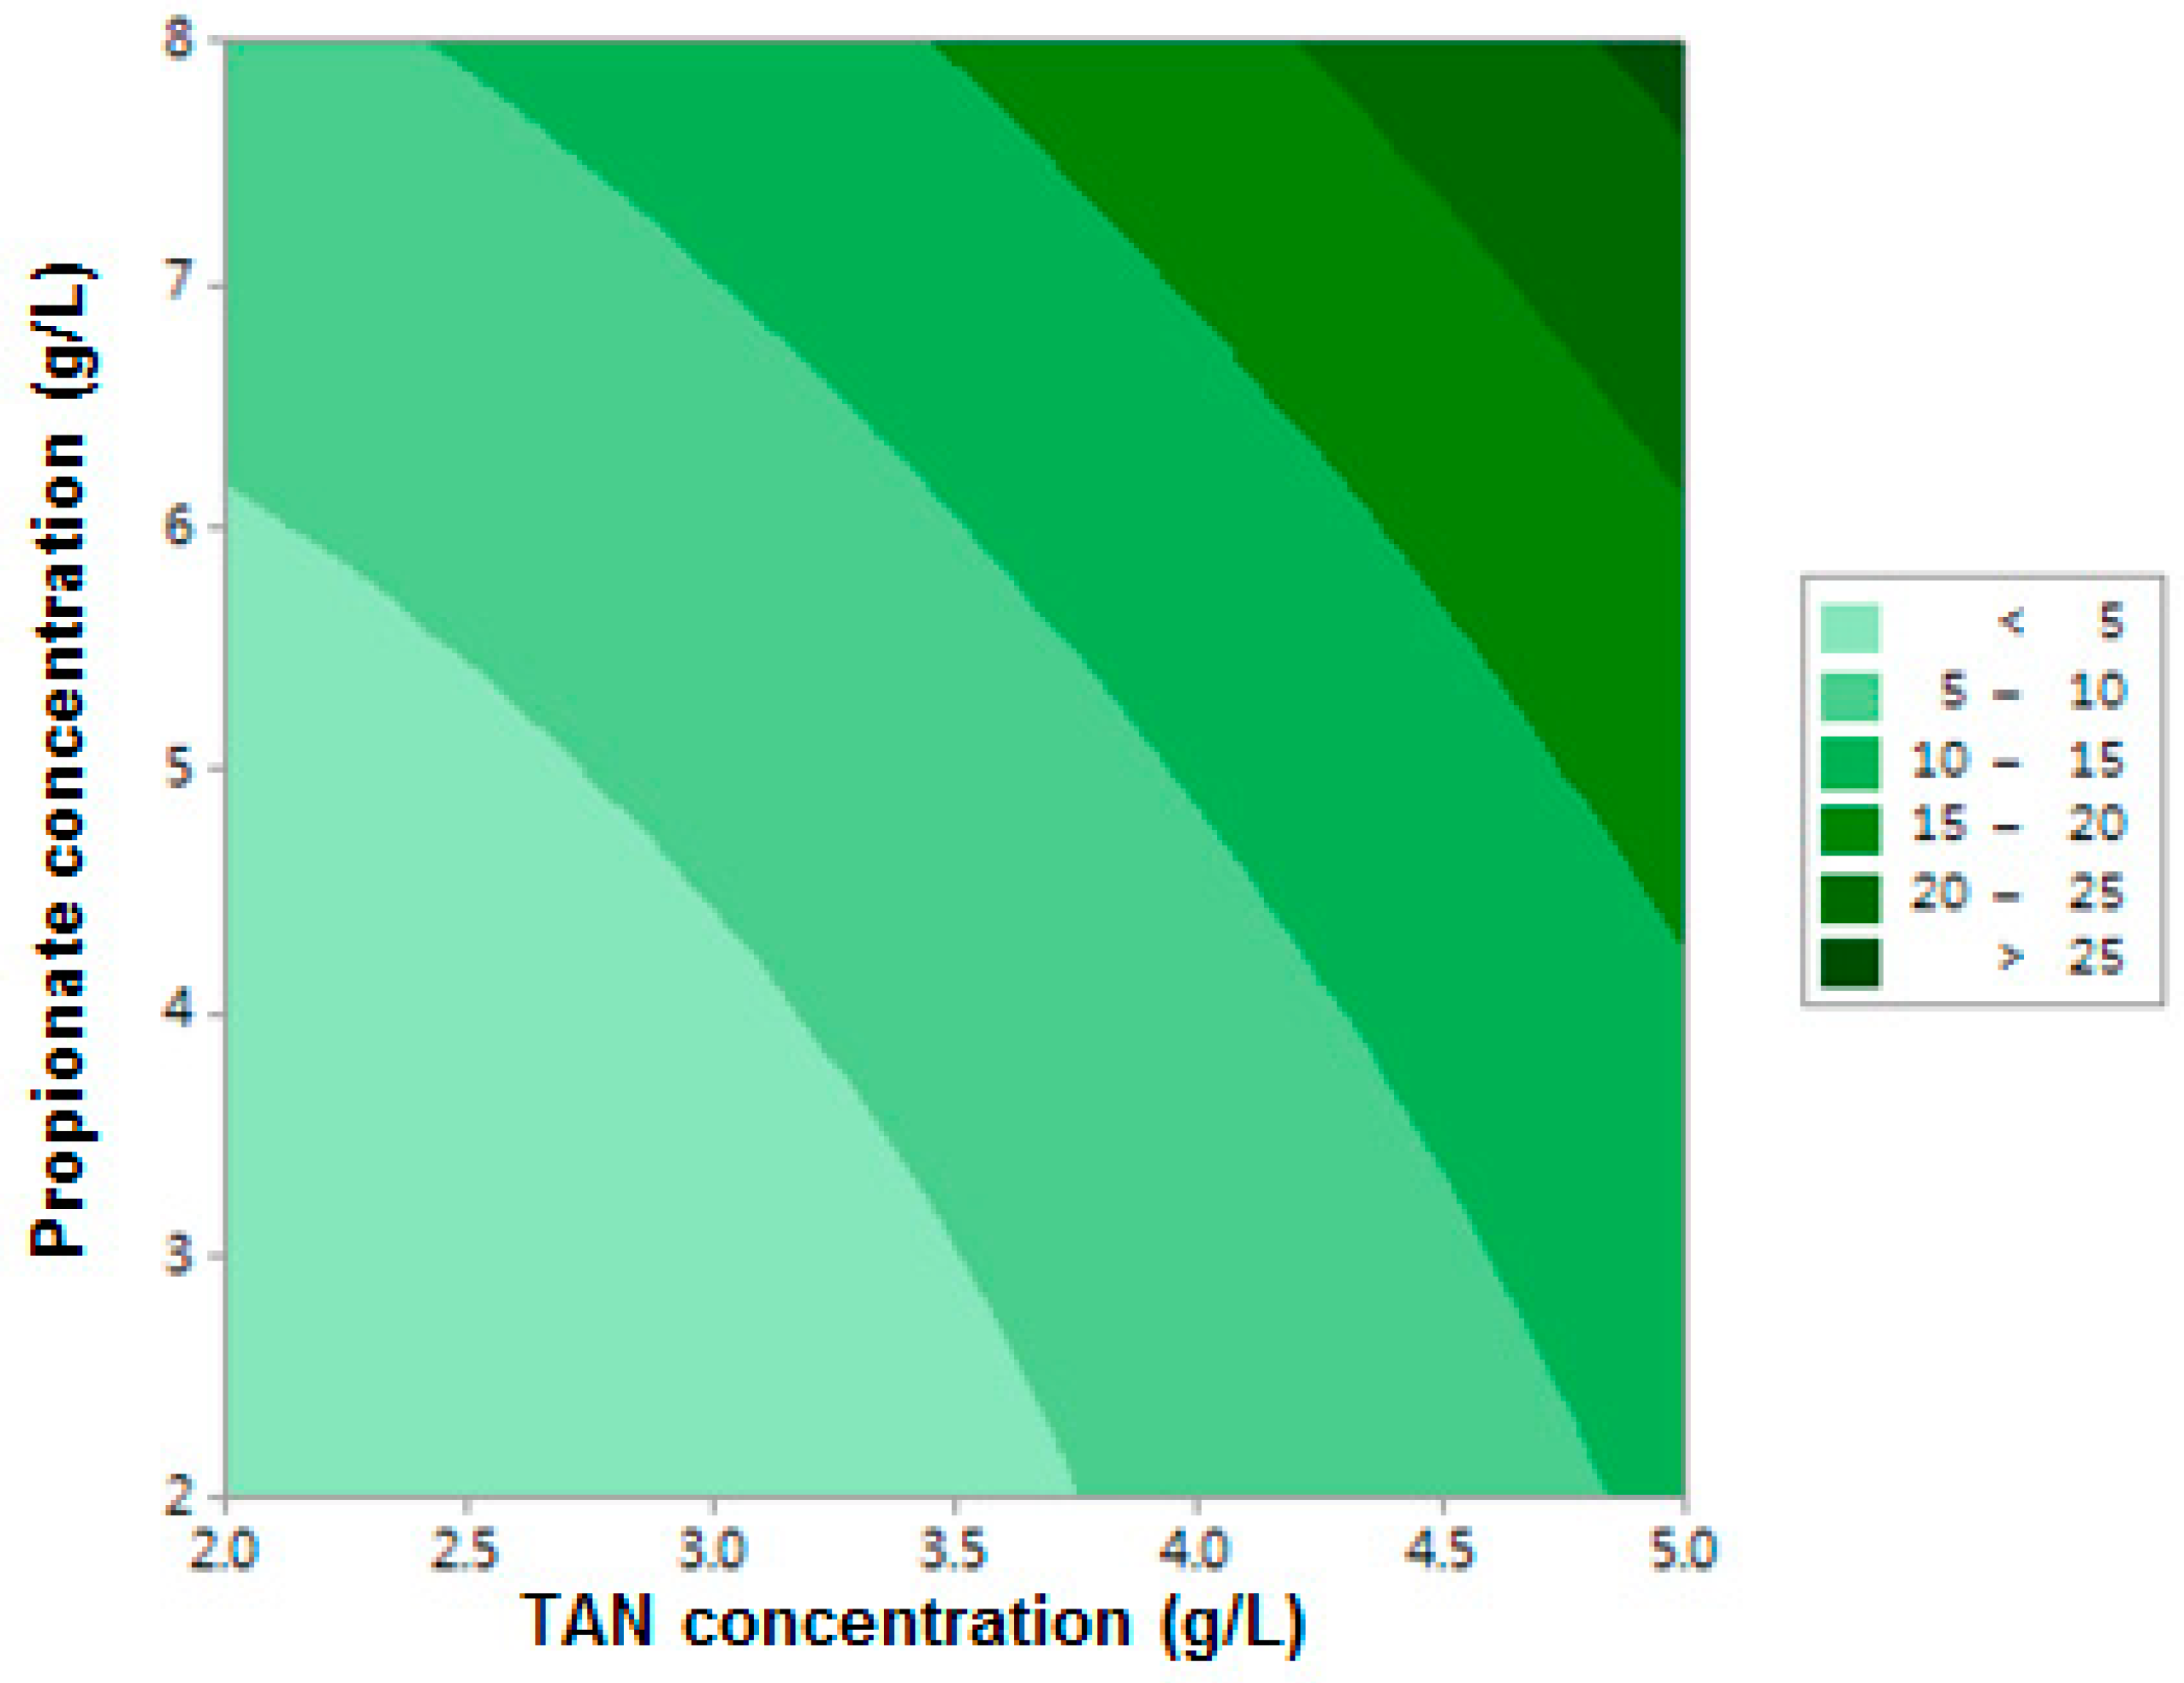
3.1.1. Lag Period
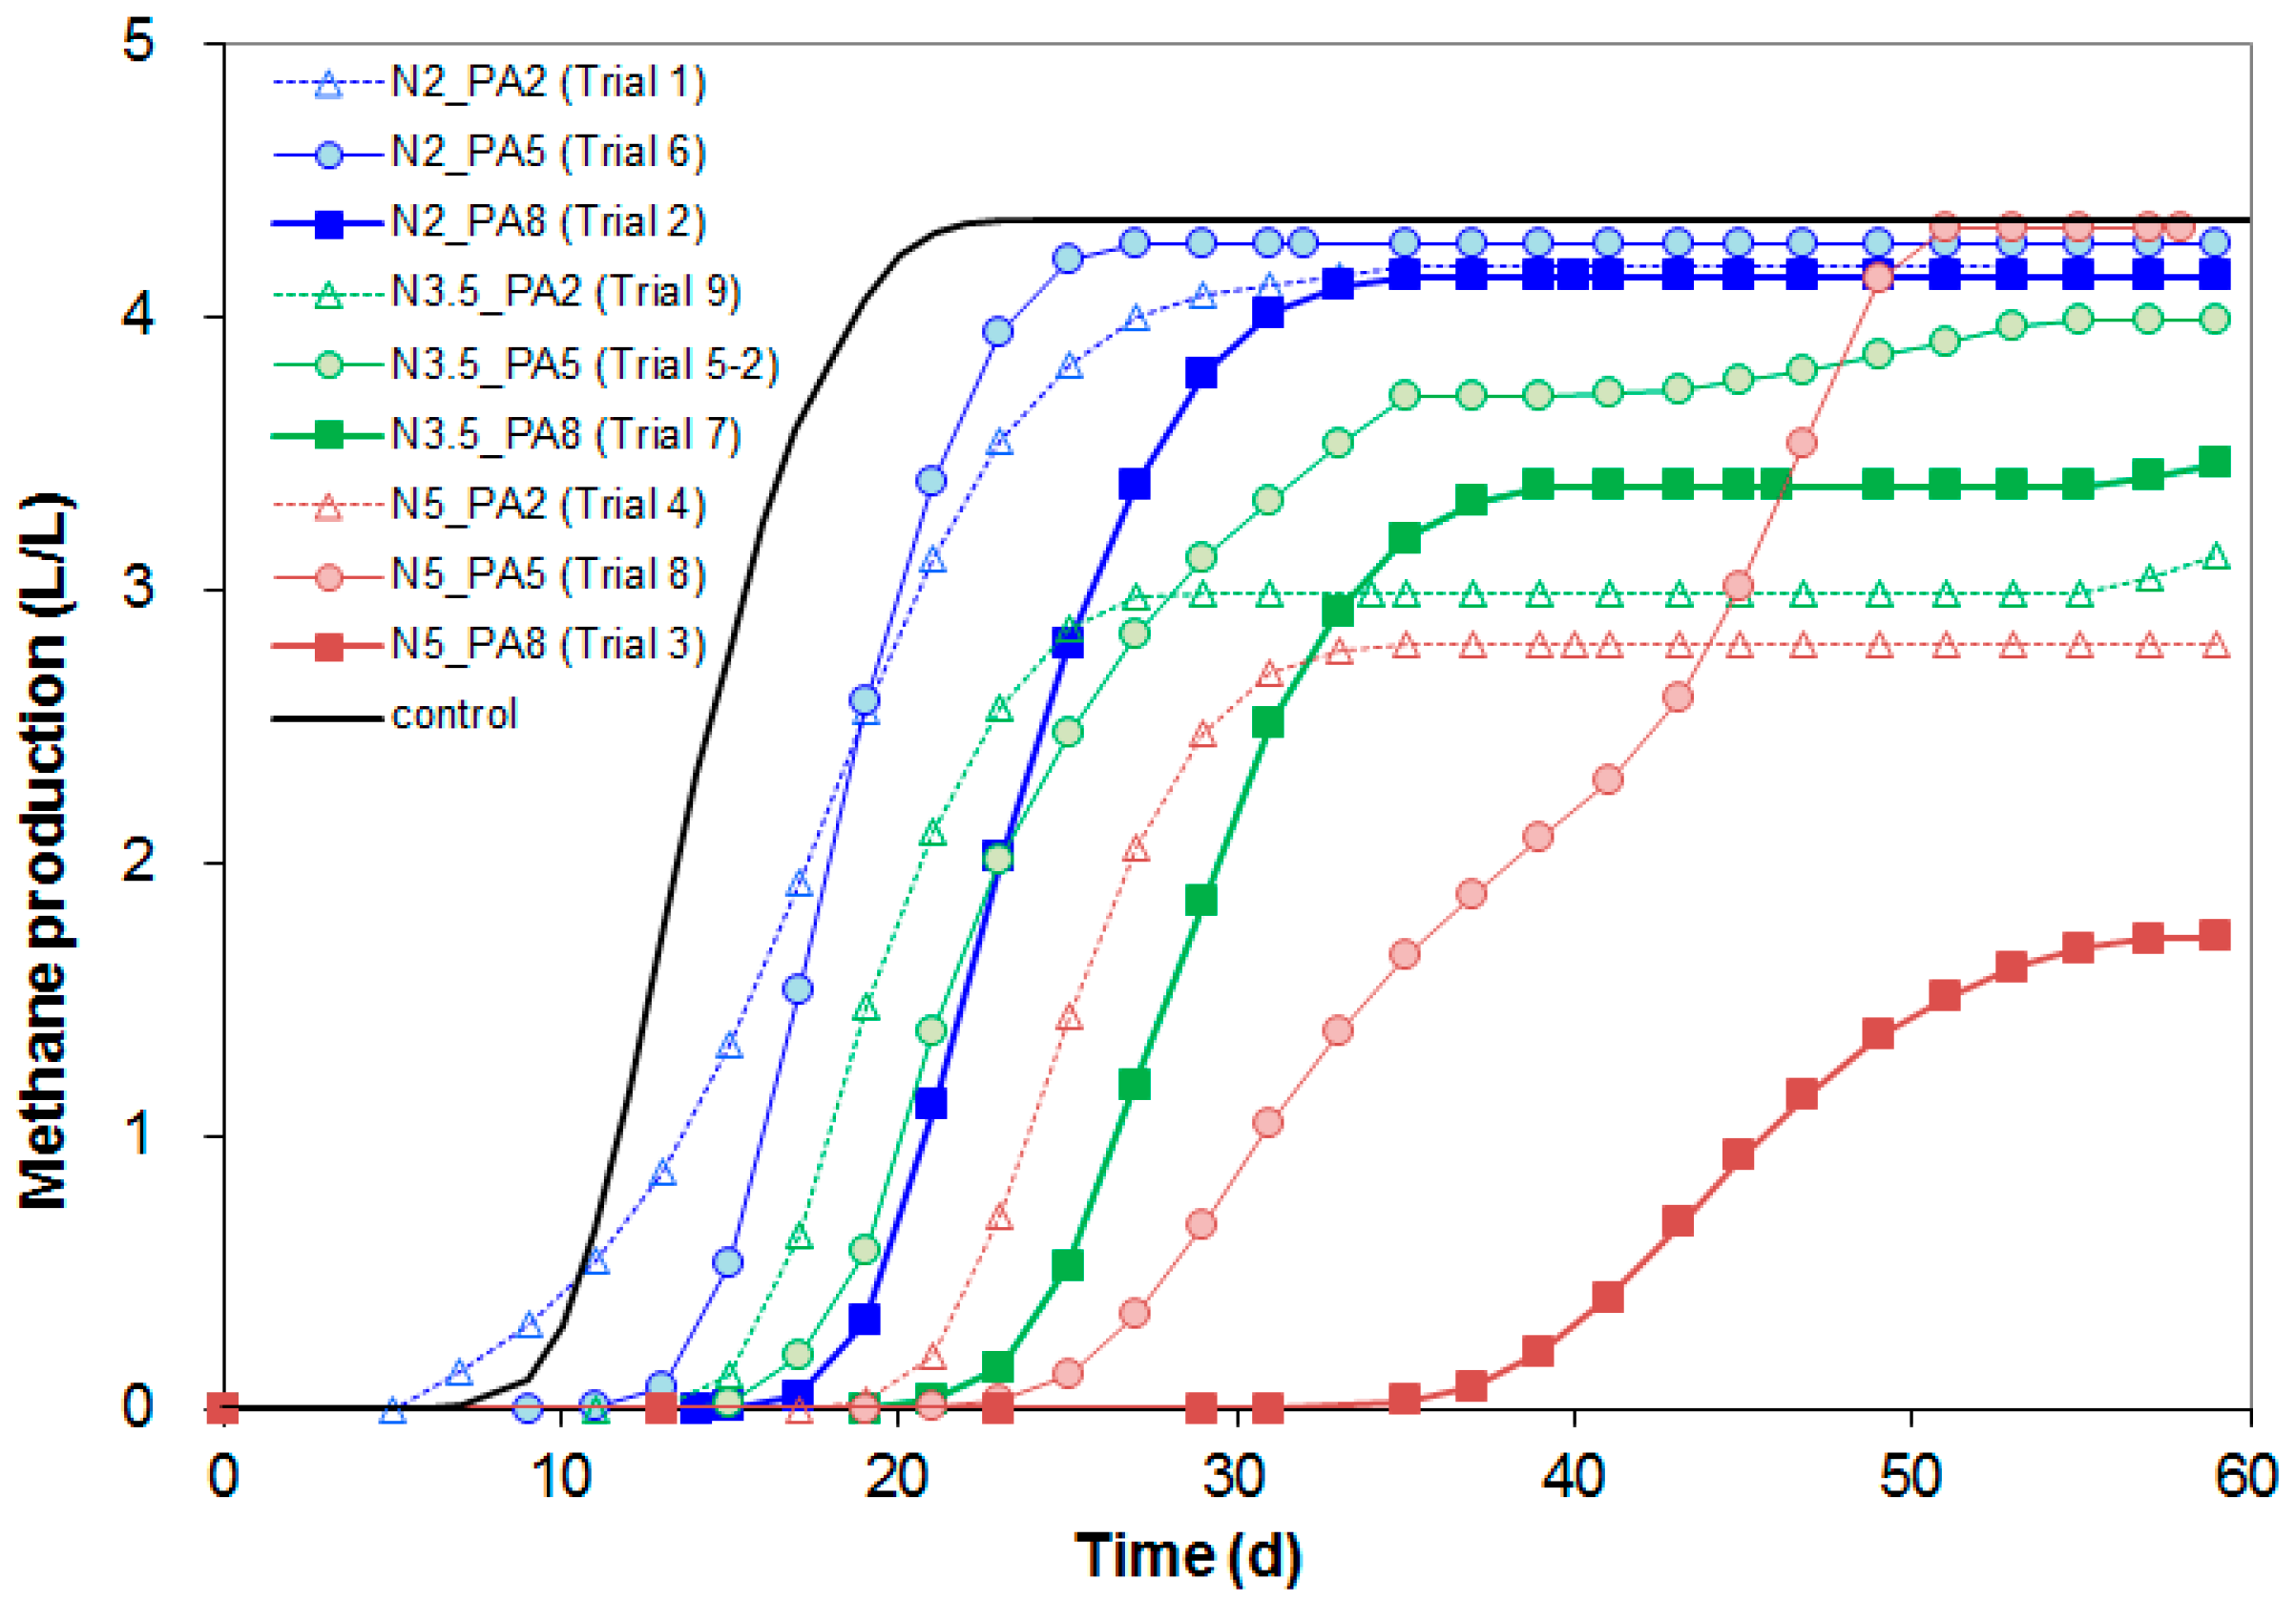
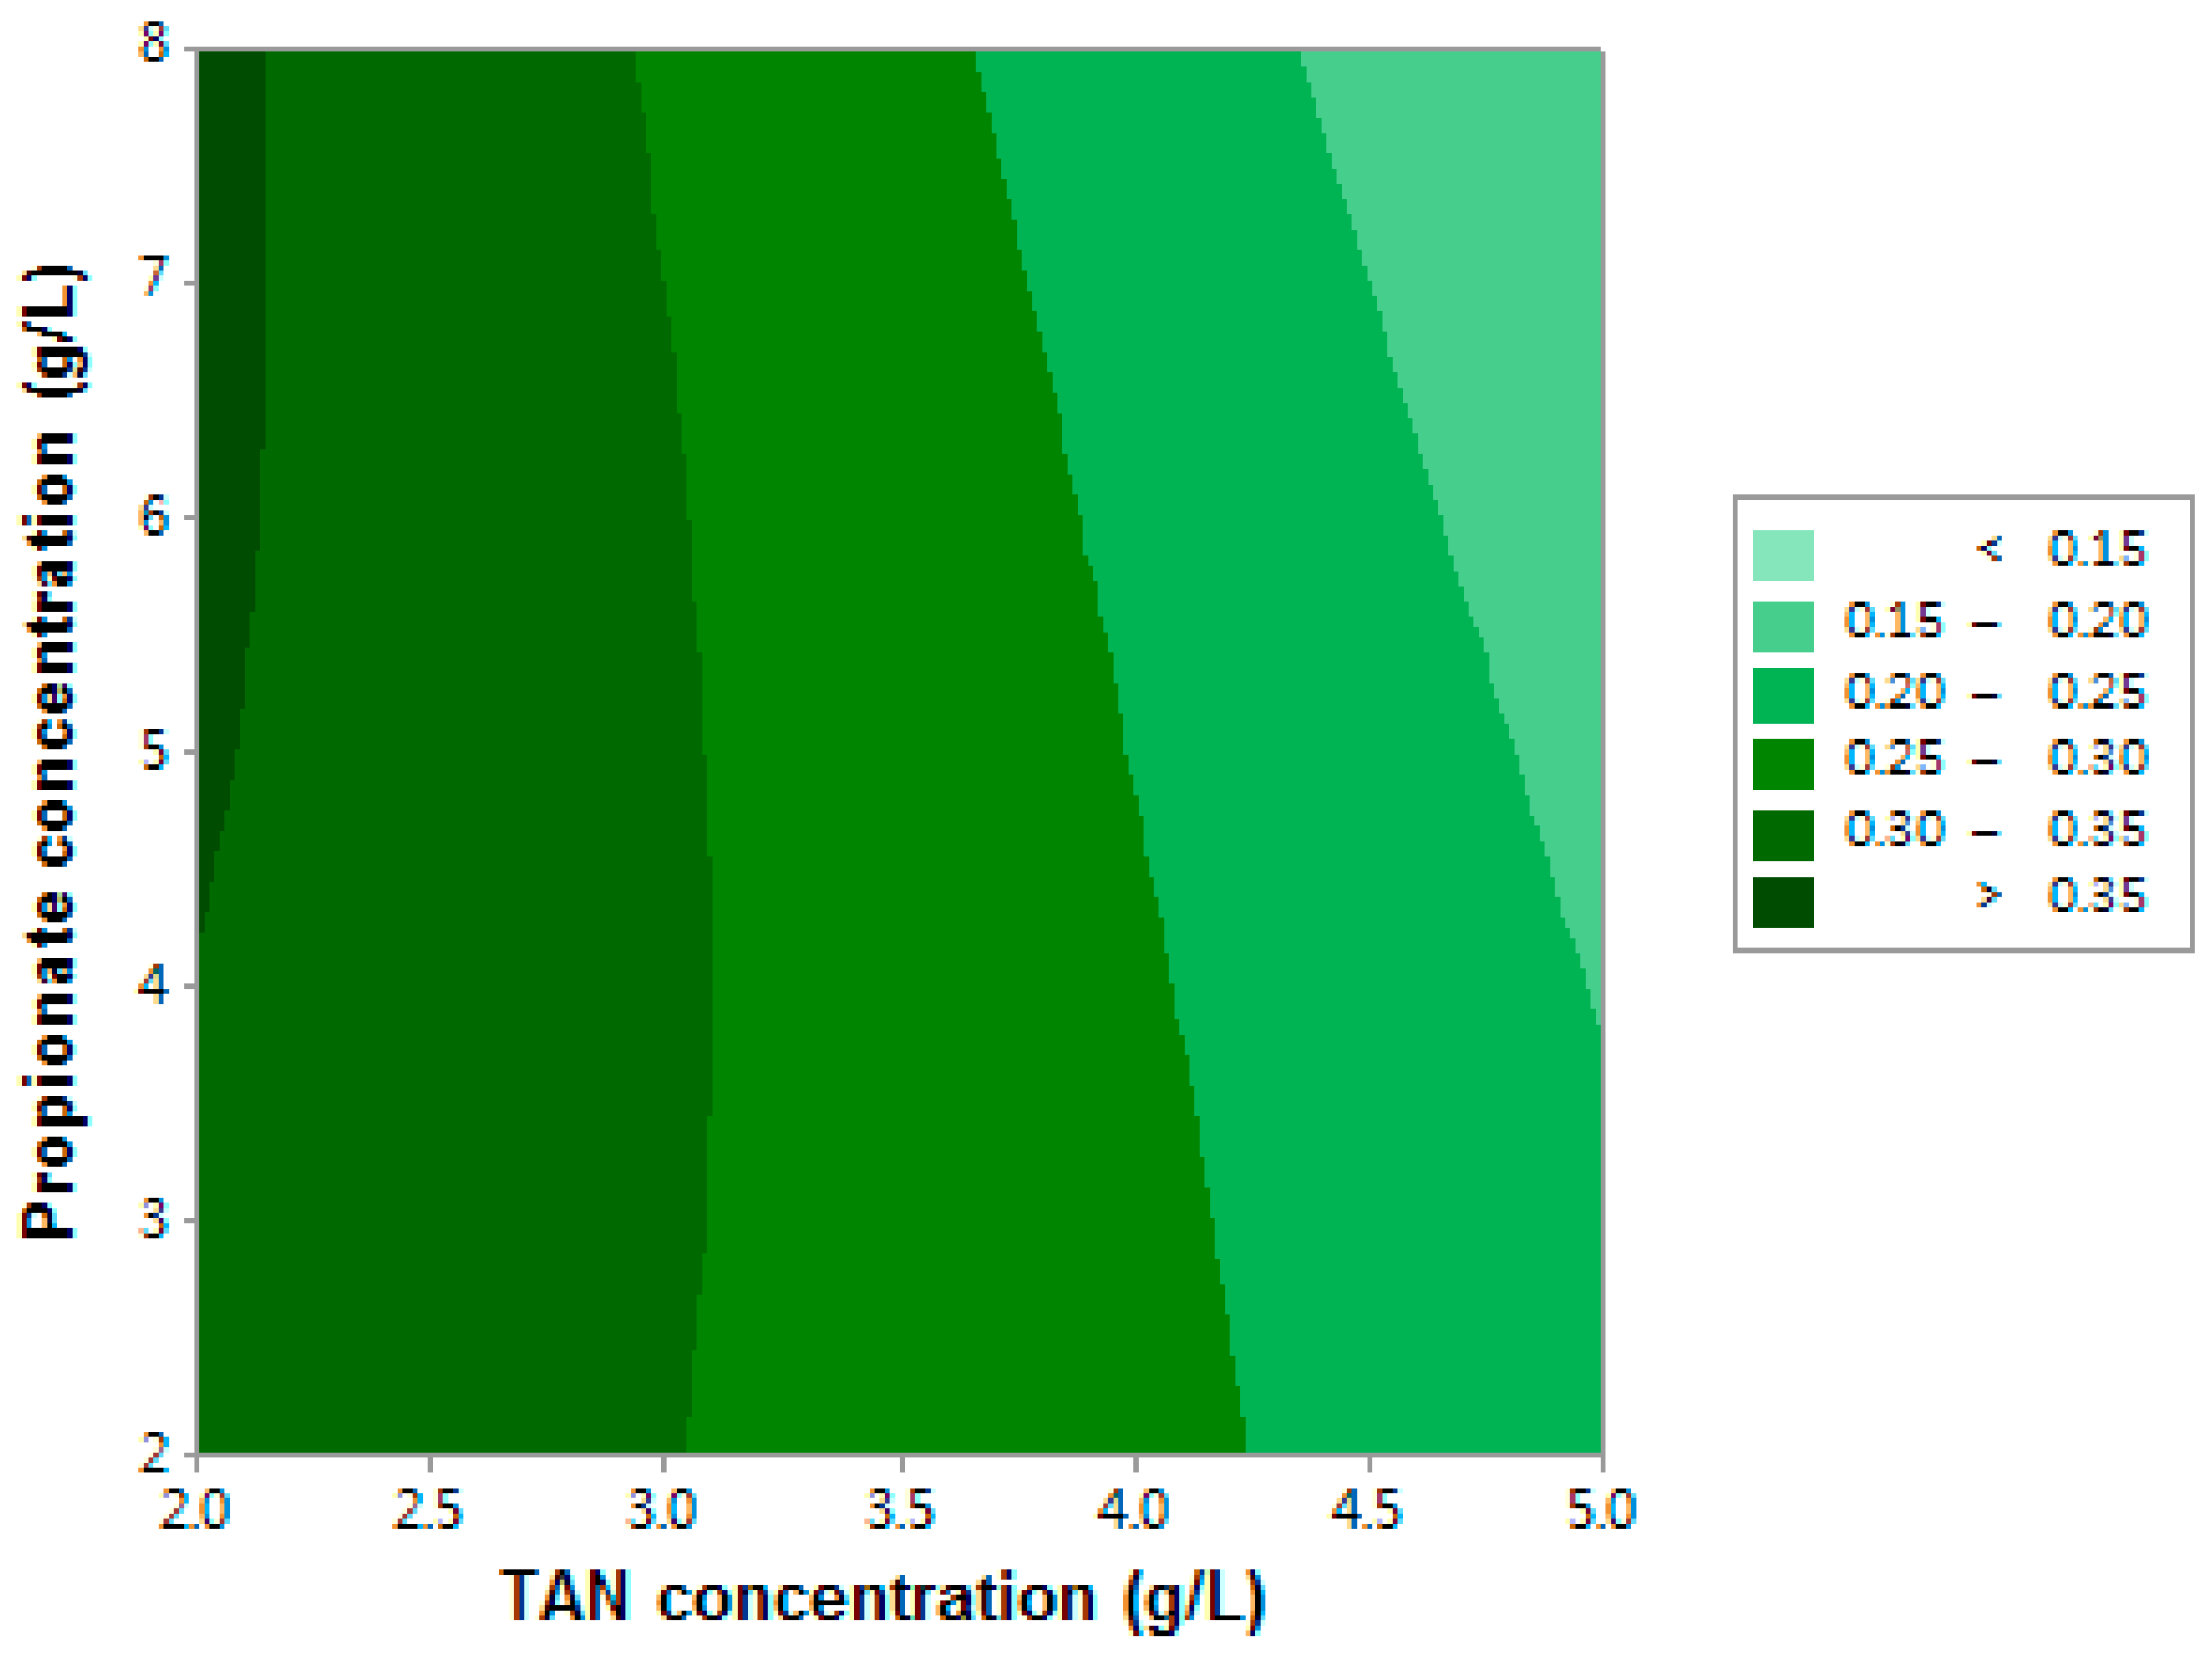
3.1.2. Methane Yield
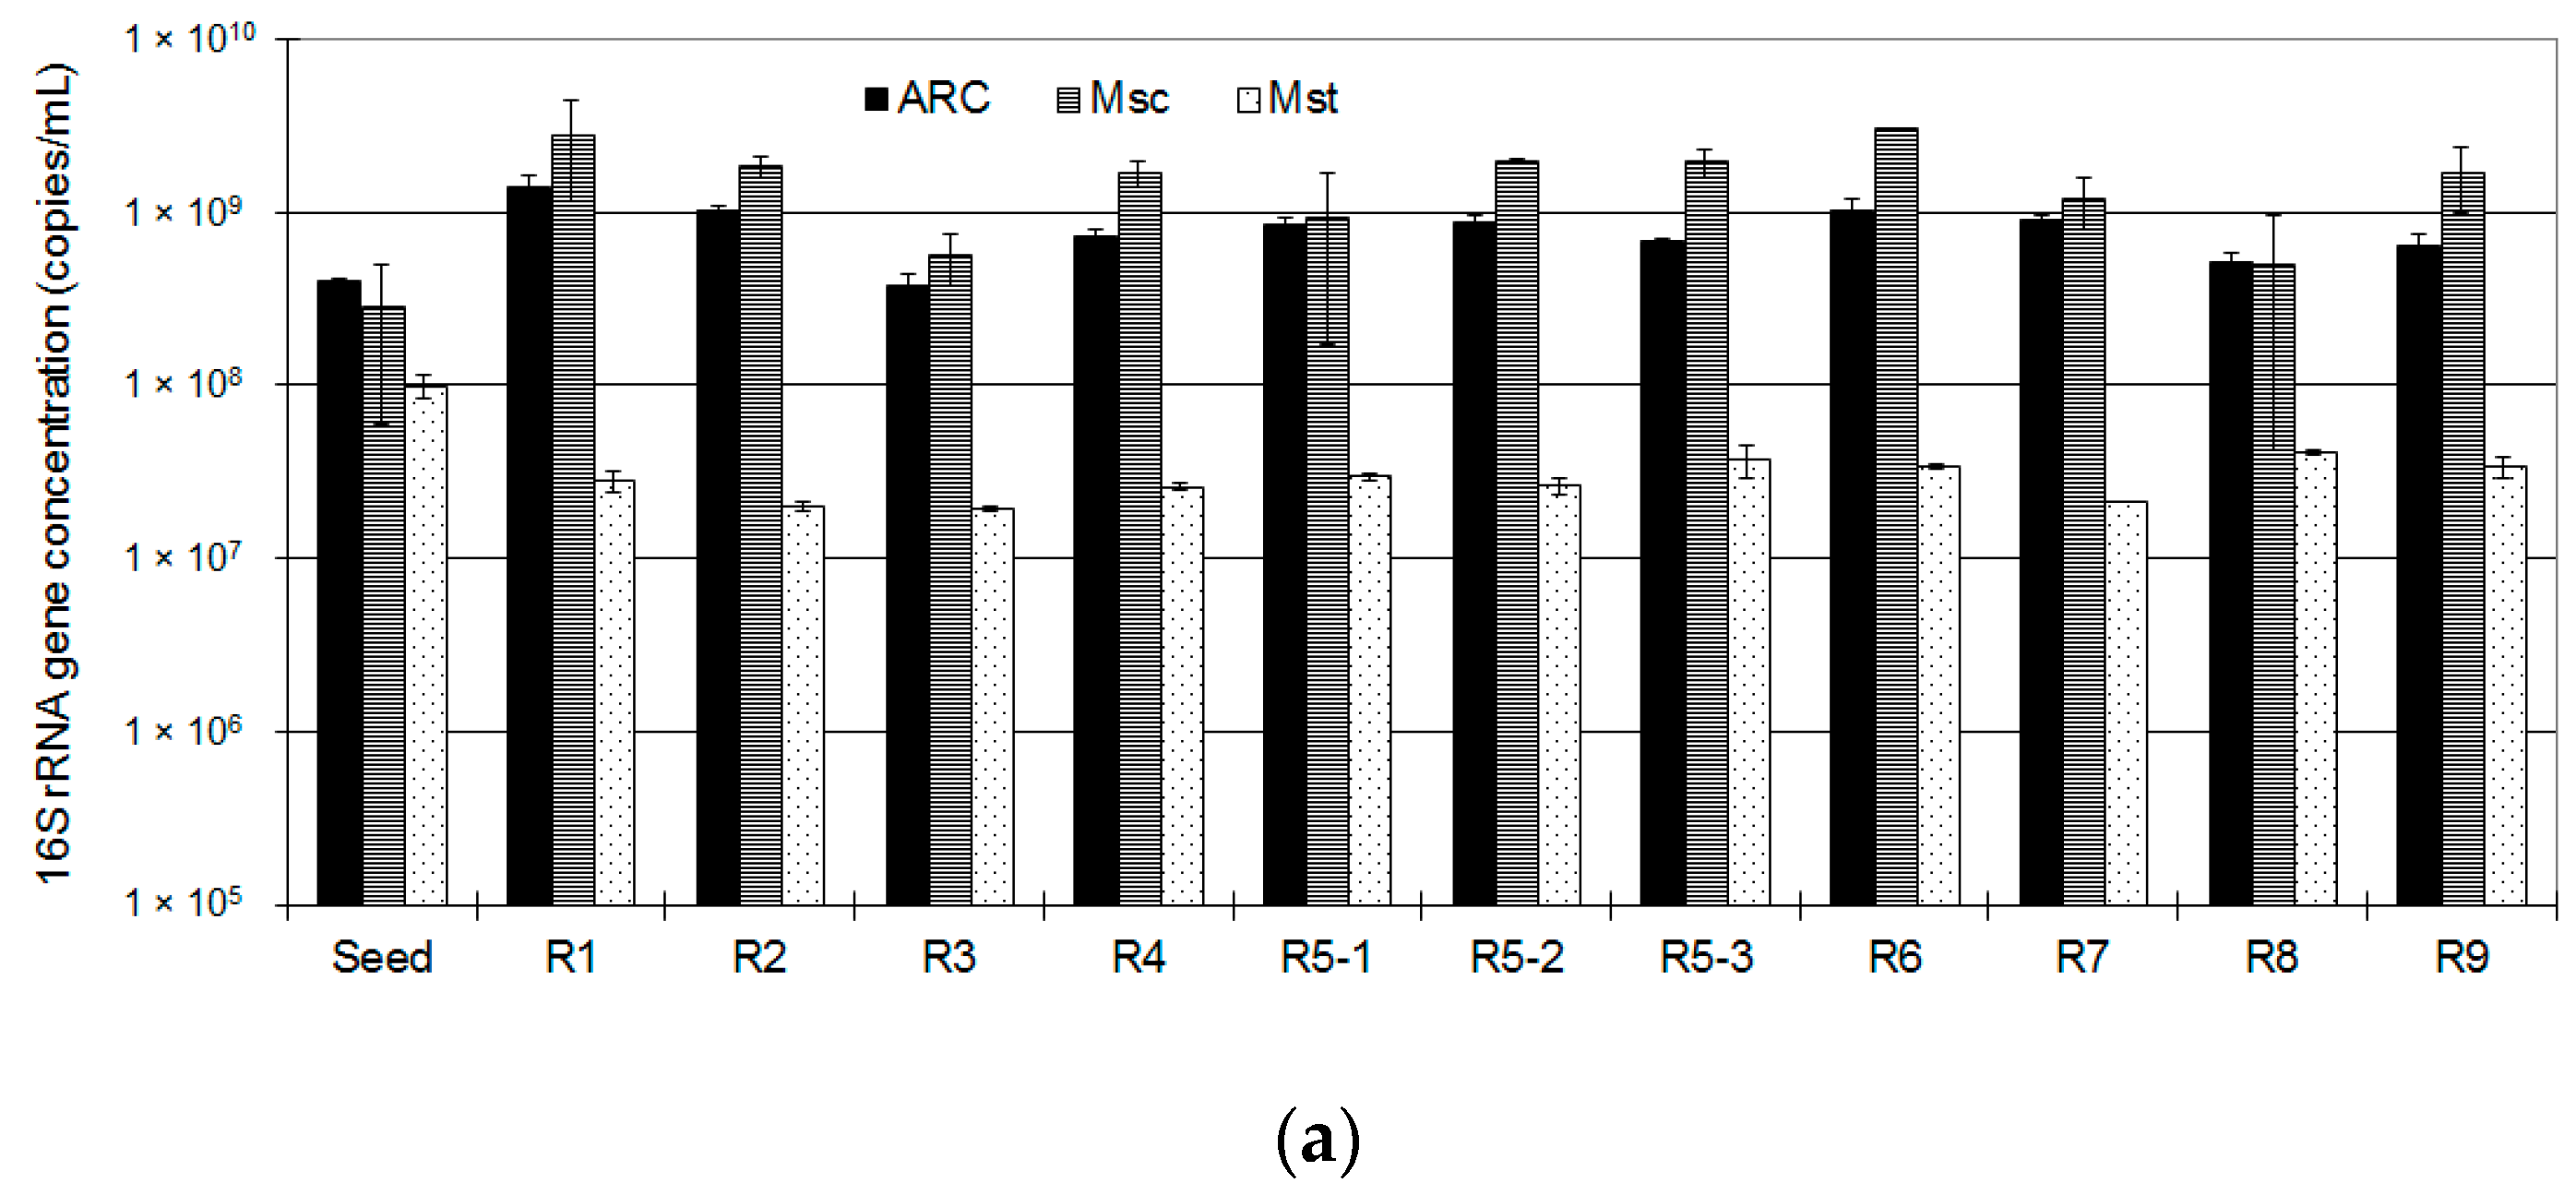
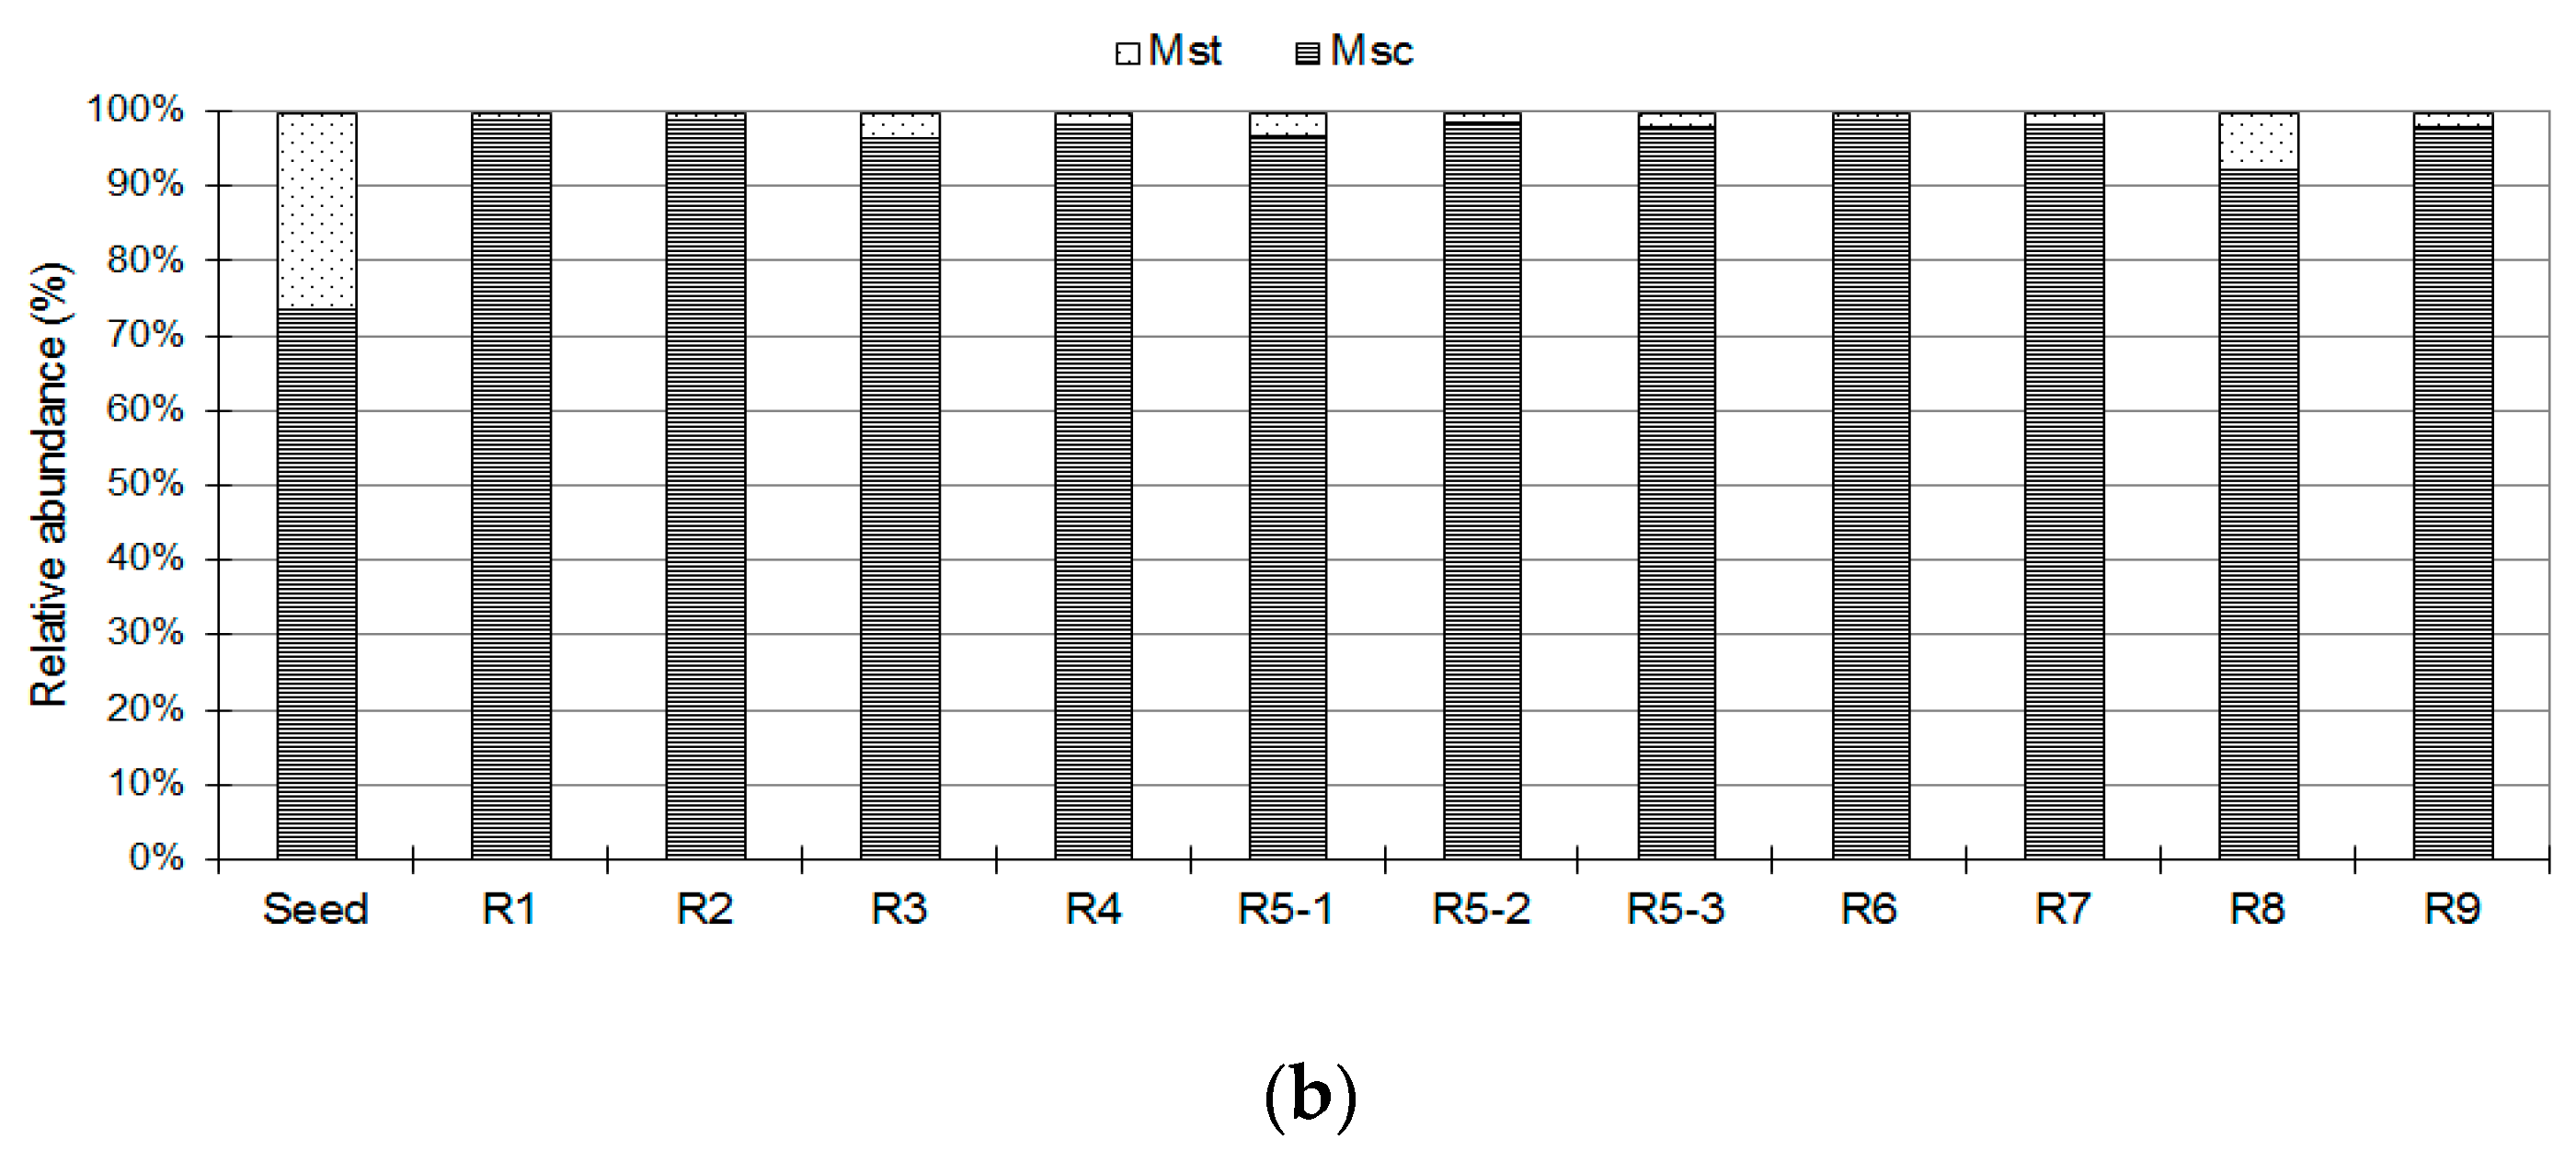
3.2. Methanogen Populations
4. Discussion
Author Contributions
Funding
Conflicts of Interest
References
- Yenigün, O.; Demirel, B. Ammonia inhibition in anaerobic digestion: A review. Process Biochem. 2013, 48, 901–911. [Google Scholar] [CrossRef]
- Westerholm, M.; Moestedt, J.; Schnürer, A. Biogas production through syntrophic acetate oxidation and deliberate operating strategies for improved digester performance. Appl. Energy 2016, 179, 124–135. [Google Scholar] [CrossRef] [Green Version]
- Chen, Y.; Cheng, J.J.; Creamer, K.S. Inhibition of anaerobic digestion process: A review. Bioresour. Technol. 2008, 99, 4044–4064. [Google Scholar] [CrossRef] [PubMed]
- Dong, X.; Plugge, C.M.; Stams, A.J.M. Anaerobic degradation of propionate by a mesophilic acetogenic bacterium in coculture and triculture with different methanogens. Appl. Environ. Microbiol. 1994, 60, 2834–2838. [Google Scholar] [PubMed]
- Dogan, T.; Ince, O.; Oz, N.A.; Ince, B.K. Inhibition of volatile fatty acid production in granular sludge from a UASB reactor. J. Environ. Sci. Health 2005, 40, 633–644. [Google Scholar] [CrossRef]
- Batstone, D.J. Anaerobic Digestion Model No. 1, 1st ed.; IWA Publishing: London, UK, 2002; ISBN 978-19-0022-278-5. [Google Scholar]
- Dhaked, R.K.; Waghmare, C.K.; Alam, S.I.; Kamboj, D.V.; Singh, L. Effect of propionate toxicity on methanogenesis of night soil at phychrophilic temperature. Bioresour. Technol. 2003, 87, 299–303. [Google Scholar] [CrossRef]
- Speece, R.E. Anaerobic Biotechnology for Industrial Wastewaters, 1st ed.; Archae Press: Nashville, TN, USA, 1996; ISBN 978-09-6502-260-6. [Google Scholar]
- Westerholm, M.; Levén, L.; Schnürer, A. Bioaugmentation of syntrophic acetate-oxidizing culture in biogas reactors exposed to increasing levels of ammonia. Appl. Environ. Microbiol. 2012, 78, 7619–7625. [Google Scholar] [CrossRef]
- Ho, L.; Ho, G. Mitigating ammonia inhibition of thermophilic anaerobic treatment of digested piggery wastewater: Use of pH reduction, zeolite, biomass and humic acid. Water Res. 2012, 46, 4339–4350. [Google Scholar] [CrossRef] [Green Version]
- Chowdhury, P.; Viraraghavan, T.; Srinivasan, A. Biological treatment processes for fish processing wastewater–A review. Bioresour. Technol. 2010, 101, 439–449. [Google Scholar] [CrossRef]
- Stams, A.J.M.; Plugge, C.M. Electron transfer in syntrophic communities of anaerobic bacteria and archaea. Nat. Rev. Microbiol. 2009, 7, 568–577. [Google Scholar] [CrossRef]
- Barredo, M.S.; Evison, L.M. Effect of propionate toxicity on methanogen-enriched sludge, Methanobrevibacter smithii, and Methanospirillum hungatii at different pH values. Appl. Environ. Microbiol. 1991, 57, 1764–1769. [Google Scholar] [PubMed]
- Mösche, M.; Jördening, H.-J. Comparison of different models of substrate and product inhibition in anaerobic digestion. Water Res. 1999, 33, 2545–2554. [Google Scholar] [CrossRef]
- Aguilar, A.; Casas, C.; Lema, J.M. Degradation of volatile fatty acids by differently enriched methanogenic cultures: Kinetics and inhibition. Water Res. 1995, 29, 505–509. [Google Scholar] [CrossRef]
- Li, Y.; Zhang, Y.; Sun, Y.; Wu, S.; Kong, X.; Yuan, Z.; Dong, R. The performance efficiency of bioaugmentation to prevent anaerobic digestion failure from ammonia and propionate inhibition. Bioresour. Technol. 2017, 231, 94–100. [Google Scholar] [CrossRef] [PubMed] [Green Version]
- Zhang, C.; Yuan, Q.; Lu, Y. Inhibitory effects of ammonia on syntrophic propionate oxidation in anaerobic digester sludge. Water Res. 2018, 146, 275–287. [Google Scholar] [CrossRef] [PubMed]
- Myers, R.H.; Montgomery, D.C.; Anderson-Cook, C.M. Response Surface Methodology: Process and Product Optimization Using Designed Experiments, 1st ed.; John Wiley & Sons: Hoboken, NJ, USA, 2016; ISBN 978-11-1891-601-8. [Google Scholar]
- Gallert, C.; Bauer, S.; Winter, J. Effect of ammonia on the anaerobic degradation of protein by a mesophilic and thermophilic biowaste population. Appl. Microbiol. Biotechnol. 1998, 50, 495–501. [Google Scholar] [CrossRef] [PubMed]
- Gallert, C.; Winter, J. Mesophilic and thermophilic anaerobic digestion of source-sorted organic wastes: Effect of ammonia on glucose degradation and methane production. Appl. Microbiol. Biotechnol. 1997, 48, 405–410. [Google Scholar] [CrossRef]
- Han, G.; Shin, S.G.; Lee, J.; Lee, C.; Jo, M.; Hwang, S. Mesophilic acidogenesis of food waste-recycling wastewater: Effects of hydraulic retention time, pH, and temperature. Appl. Biochem. Biotech. 2016, 180, 980–999. [Google Scholar] [CrossRef]
- Minitab_LLC. Minitab-Data Analysis, Statistical & Process Imporvement Tools. Available online: https://www.minitab.com (accessed on 29 July 2019).
- Zoetemeyer, R.J.; Arnoldy, P.; Cohen, A.; Boelhouwer, C. Influence of temperature on the anaerobic acidification of glucose in a mixed culture forming part of a two-stage digestion process. Water Res. 1982, 16. [Google Scholar] [CrossRef]
- Atlas, R.M. Handbook of Microbiological Media, 2nd ed.; CRC Press: Boca Raton, FL, USA, 2006; ISBN 978-08-4933-561-7. [Google Scholar]
- Clarens, M.; Molleta, R. Kinetic studies of acetate fermentation by Methanosarcina sp. MSTA-1. Appl. Microbiol. Biotechnol. 1990, 33, 239–244. [Google Scholar] [CrossRef]
- Shin, S.G.; Lee, C.; Hwang, K.; Ahn, J.-H.; Hwang, S. Use of order-specific primers to investigate the methanogenic diversity in acetate enrichment system. J. Ind. Microbiol. Biotechnol. 2008, 35, 1345–1352. [Google Scholar] [CrossRef] [PubMed]
- Yu, Y.; Lee, C.; Kim, J.; Hwang, S. Group-specific primer and probe sets to detect methanogenic communities using quantitative real-time polymerase chain reaction. Biotechnol. Bioeng. 2005, 89, 670–679. [Google Scholar] [CrossRef] [PubMed]
- Song, M.; Shin, S.G.; Hwang, S. Methanogenic population dynamics assessed by real-time quantitative PCR in sludge granule in upflow anaerobic sludge blanket treating swine wastewater. Bioresour. Technol. 2010, 101, S23–S28. [Google Scholar] [CrossRef] [PubMed]
- Niu, Q.; Kobayashi, T.; Takemura, Y.; Kubota, K.; Li, Y.-Y. Evaluation of functional microbial community’s difference in full-scale and lab-scale anaerobic digesters feeding with different organic solid waste: Effects of substrate and operation factors. Bioresour. Technol. 2015, 193, 110–118. [Google Scholar] [CrossRef]
- Do, H.; Lim, J.; Shin, S.G.; Wu, Y.-J.; Ahn, J.-H.; Hwang, S. Simultaneous effect of temperature, cyanide and ammonia-oxidizing bacteria concentrations on ammonia oxidation. J. Ind. Microbiol. Biotechnol. 2008, 35, 1331–1338. [Google Scholar] [CrossRef] [PubMed]
- Xie, S.; Lawlor, P.G.; Frost, J.P.; Hu, Z.; Zhan, X. Effect of pig manure to grass silage ratio on methane production in batch anaerobic co-digestion of concentrated pig manure and grass silage. Bioresour. Technol. 2011, 102, 5728–5733. [Google Scholar] [CrossRef]
- Shuler, M.L.; Kargi, F. Bioprocess Engineering: Basic Concepts, 2nd ed.; Prentice Hall: Upper Saddle River, NJ, USA, 2001; ISBN 978-01-3081-908-6. [Google Scholar]
- Fukuzaki, S.; Nishio, N.; Nagai, S. Kinetics of the methanogenic fermentation of acetate. Appl. Environ. Microbiol. 1990, 56, 3158–3163. [Google Scholar]
- Farghaly, A.; Tawfik, A. Simultaneous hydrogen and methane production through multi-phase anaerobic digestion of paperboard mill wastewater under different operating conditions. Appl. Biochem. Biotech. 2017, 181, 142–156. [Google Scholar] [CrossRef] [PubMed]
- Gonçalves, L.M.D.; Ramos, A.; Almeida, J.S.; Xavier, A.M.R.B.; Carrondo, M.J.T. Elucidation of the mechanism of lactic acid growth inhibition and production in batch cultures of Lactobacillus rhamnosus. Appl. Microbiol. Biotechnol. 1997, 48, 346–350. [Google Scholar] [CrossRef]
- Rajagopal, R.; Massé, D.I.; Singh, G. A critical review on inhibition of anaerobic digestion process by excess ammonia. Bioresour. Technol. 2013, 143, 632–641. [Google Scholar] [CrossRef]
- Ma, J.; Carballa, M.; Van De Caveye, P.; Verstraete, W. Enhanced propionic acid degradation (EPAD) system: Proof of principle and feasibility. Water Res. 2009, 43, 3239–3248. [Google Scholar] [CrossRef] [PubMed]
- Wang, Y.; Zhang, Y.; Wang, J.; Meng, L. Effects of volatile fatty acid concentrations on methane yield and methanogenic bacteria. Biomass Bioenerg. 2009, 33, 848–853. [Google Scholar] [CrossRef]
- Tale, V.P.; Maki, J.S.; Struble, C.A.; Zitomer, D.H. Methanogen community structure-activity relationship and bioaugmentation of overloaded anaerobic digesters. Water Res. 2011, 45, 5249–5256. [Google Scholar] [CrossRef] [PubMed]
- Yu, Y.; Lee, C.; Hwang, S. Analysis of community structures in anaerobic processes using a quantitative real-time PCR method. Water Sci. Technol. 2005, 52, 85–91. [Google Scholar] [CrossRef] [PubMed]
- Regueiro, L.; Lema, J.M.; Carballa, M. Key microbial communities steering the functioning of anaerobic digesters during hydraulic and organic overloading shocks. Bioresour. Technol. 2015, 197, 208–216. [Google Scholar] [CrossRef] [PubMed]


| Trial Number | Initial NH4+-N Concentration (g/L) | Initial Propionate Concentration (g/L) | Estimated Lag Period (d) * | Methane Yield (L CH4/g acetate) | Maximum Methane Production rate (L/L/d) | Residual Acetate Concentration (g/L) | End pH | ||
|---|---|---|---|---|---|---|---|---|---|
| Observed | Predicted | Observed | Predicted | ||||||
| 1 | 2.0 | 2.0 | 0.8 | 2.0 | 0.35 | 0.34 | 0.28 | 0.73 | 8.4 |
| 2 | 2.0 | 8.0 | 8.7 | 8.6 | 0.35 | 0.36 | 0.39 | 0.58 | 8.4 |
| 3 | 5.0 | 8.0 | 28.0 | 26.5 | 0.14 | 0.15 | 0.12 | 6.48 | 8.1 |
| 4 | 5.0 | 2.0 | 11.0 | 10.9 | 0.23 | 0.21 | 0.29 | 4.11 | 8.2 |
| 5 ** | 3.5 | 5.0 | 8.0 (0.5) | 7.8 | 0.28 (0.2) | 0.28 | 0.33 (0.02) | 2.17 (0.95) | 8.4 (0.1) |
| 6 | 2.0 | 5.0 | 4.5 | 3.6 | 0.36 | 0.35 | 0.48 | 0.63 | 8.5 |
| 7 | 3.5 | 8.0 | 13.5 | 15.2 | 0.28 | 0.26 | 0.30 | 2.71 | 8.3 |
| 8 | 5.0 | 5.0 | 15.2 | 16.8 | 0.17 | 0.19 | 0.16 | 0.08 | 8.3 |
| 9 | 3.5 | 2.0 | 5.3 | 4.2 | 0.25 | 0.28 | 0.32 | 3.35 | 8.3 |
| control | 0.2 | 0.0 | 0.0 [9.4] | – | 0.36 | – | 0.47 | 0.00 | − |
| Term | Coefficient | df * | F-value | p-Value |
|---|---|---|---|---|
| Constant | 9.55 | – | – | – |
| X1 | −5.20 | 1 | 111.54 | 0.000 |
| X2 | −2.03 | 1 | 81.85 | 0.000 |
| X1X2 | 0.505 | 1 | 8.31 | 0.034 |
| X12 | 1.022 | 1 | 5.39 | 0.068 |
| X22 | 0.211 | 1 | 3.67 | 0.114 |
| Model ** | – | 5 | 40.66 | 0.000 |
| Term | Coefficient | df * | F-value | p-Value |
|---|---|---|---|---|
| Constant | 0.350 | – | – | – |
| X1 | −0.0102 | 1 | 50.32 | 0.001 |
| X2 | 0.0203 | 1 | 1.42 | 0.287 |
| X1X2 | −0.00481 | 1 | 2.56 | 0.171 |
| X12 | −0.00300 | 1 | 0.16 | 0.708 |
| X22 | −0.00068 | 1 | 0.13 | 0.733 |
| Model ** | – | 5 | 12.00 | 0.008 |
© 2019 by the authors. Licensee MDPI, Basel, Switzerland. This article is an open access article distributed under the terms and conditions of the Creative Commons Attribution (CC BY) license (http://creativecommons.org/licenses/by/4.0/).
Share and Cite
Shin, S.G.; Lee, J.; Do, T.H.; Kim, S.I.; Hwang, S. Application of Response Surface Analysis to Evaluate the Effect of Concentrations of Ammonia and Propionic Acid on Acetate-Utilizing Methanogenesis. Energies 2019, 12, 3394. https://doi.org/10.3390/en12173394
Shin SG, Lee J, Do TH, Kim SI, Hwang S. Application of Response Surface Analysis to Evaluate the Effect of Concentrations of Ammonia and Propionic Acid on Acetate-Utilizing Methanogenesis. Energies. 2019; 12(17):3394. https://doi.org/10.3390/en12173394
Chicago/Turabian StyleShin, Seung Gu, Joonyeob Lee, Trong Hoan Do, Su In Kim, and Seokhwan Hwang. 2019. "Application of Response Surface Analysis to Evaluate the Effect of Concentrations of Ammonia and Propionic Acid on Acetate-Utilizing Methanogenesis" Energies 12, no. 17: 3394. https://doi.org/10.3390/en12173394