Article

Resilience-Oriented Optimal Operation Strategy of Active Distribution Network

1
School of Electronic Information and Electrical Engineering, Shanghai Jiao Tong University, Shanghai 200240, China
2
No.708 Institution, China State Shipbuilding Corporation Limited, Shanghai 200011, China
3
Yunnan Power Grid Corporation, Kunming 650000, China
*
Author to whom correspondence should be addressed.
Energies 2019, 12(17), 3380; https://doi.org/10.3390/en12173380
Submission received: 2 August 2019 / Revised: 24 August 2019 / Accepted: 27 August 2019 / Published: 2 September 2019
(This article belongs to the Section F: Electrical Engineering)

Abstract

:
The ability to withstand extreme disasters has a profound impact on the distribution network operation. This paper proposes a novel optimal operation strategy for an active distribution network to enhance system resilience.. The objectives in the proposed optimal strategy include, the resilience, operation cost, and its pollutant emissions. According to the existence of uncontrollable distributed energy resources in the active distribution network, the problem which takes the uncertainty most into account, is this multi-objective optimization problem. Thus, it can be treated as a min-max dual robust optimization problem. Benders decomposition is employed to decouple the problem, then non-dominated sorting genetic algorithm II is applied to search the multi-objective optimal solution which has an extremely low CPU time. The modified standard IEEE 34-node system, with different distributed energy resources types, is employed, as a studied case, to demonstrate the effectiveness of the proposed optimal operation strategy. The simulation results illustrate that, compared to other economic-oriented robust optimal operation models, the proposed strategy can enhance system resilience without a significant increase in the operation cost and pollutant emissions.

1. Introduction

The adverse impacts of extreme weather events and natural disasters on electric grids has attracted worldwide attention, and the way to enhance the distribution network (DN) resilience needs to further studied. In fact, the ability to overcome and recover from incidents, such as power interruption, in an optimal operation mode, is necessary for any power system. The optimal operation mode aims to minimize the total energy supply cut and enable quicker restoration [1,2]. In order to increase the recovery ability under the power interruption of the main grid, multi types of distributed energy resources (DER) consisting of non-dispatchable sources, dispatchable distributed micro-sources, and energy storage units integrate into the DN. The examples of non-dispatchable sources, include but are not limited to, photovoltaic (PV) panels and wind turbines (WT). More specially, photovoltaic power generation is a static power generation, has zero emission, zero radiation, and zero pollution. Moreover, it has low operating and maintenance costs, does not include fuel-free costs, and is unaffected by rising energy prices. The examples of energy storage units include, but are not limited to, energy storage stations (ESS). DERs are able to supply those loads, located in the DN, when the unpredicted incident happens, by utilizing renewable energies or storage systems. According to the definition, the integration of DER will strength the recovery ability. Nevertheless, the gradual integration of DER brings new challenges and requirements to the traditional DN planning and operation strategy [3]. To adapt to this change, it must be transformed into an active distribution network (ADN) with active power flow control and load interaction ability [4]. ADN is a technical solution that can optimize and achieve use efficiency of DER. Moreover, it can achieve power rebalancing and maintain the energy supply for internal and peripheral loads.
The significance of the system resilience research can be briefly presented as follows. Firstly, as for the practical significance, it can provide decision support, formulate corresponding disaster mitigation plans. Then, reduce the load curtailment caused by initial failure and the time of system recovery. The resilience enhancement can improve the ability of the system to recover from damage, and resist and adapt to disasters. Second, in theory, the analysis of the ADN model in this paper can prove the validity of the topological structure model for the system research. The application of multi-objective optimization algorithm to the study of ADN operation strategy can enrich the complex network theory. The research contents and methods can provide enlightenment for the research of complex systems.
When an unpredicted natural incident occurs in the main grid, the ADN with an available operation strategy will switch to supplying local electric loads by its integrated DER units. In this way, the system will recover from the power interruption quickly, and provide the electricity to customers under a normal mode [2,5]. And this recovery ability can be quantified as an index, resilience. By dispatching all controllable distributed sources and storage units in ADN, the resilience, i.e., the ratio of recovery power of local load to the total lost power, should be significantly enhanced.
Thus, the resilience maximization acts as the main optimal objective of the DER integrated ADN operation strategy, whereas the metric of resilience and its quantitative framework should be proposed at first. The amount of existing research can be found in [6,7,8,9,10,11,12,13,14,15,16] for measuring the resilience index. The study in [6] provides two resilience-based measures of the network, which can serve as guides to prioritize resilience improvement activities. The references [7,8] define a general quantitative resilience framework. The economic factor has been accounted in the resilience assessment system in [9]. Reference [10] proposes a new multi-stage framework to analyze infrastructure resilience. Haimes [11] defines the resilience as the ability of a system to maintain a certain function under an incident, and to return to normal operation within a specified time and cost. More definitions of resilience are cited in references [12]. However, the above resilience indicators are all for a given event, without considering the controllability of some events. Reference [13,14] modify the viewpoint, the resilience of power grid can be defined as the ability of the system to resist all kinds of interruptions, and quickly restore to normal operation for a period of time. This paper adopts the definition of resilience proposed in [13].
Further, the actual operation strategy is also influenced by other objectives, such as economy and pollutant emissions [15]. Furthermore, the supply and demand bilateral system of ADN may contain multiple uncertainties, which seriously affect the operation mode. The robust optimization is the most frequent methodology deployed to achieve the above multi-objectives, as well as dealing with uncertainties, which are presented in [16,17].
In order to maximize the resilience, and reduce the total cost and pollutant emissions in DER integrated ADN system, this paper proposes a novel robust optimal operation strategy, based on Benders decomposition (BD) and non-dominated sorting genetic algorithm II (NSGA-II). The DER integrated ADN optimal model will be established. This model includes three objectives, such as, the resilience, the operation cost, and pollutant emissions. Based on above analysis, this optimal operation strategy is a multi-objective problem considering the uncertainty, since some uncontrollable sources and loads exist in the model. By using historical data and typical probabilistic distribution of random scenarios, robust optimal model is presented by accounting for the worst situation. BD is employed to decouple the min-max problem into inner maximization and outer minimization problem. The NSGA-II can be employed to solve the proposed multi-objective problem.
This paper aims to propose an optimal operation strategy to help improve the resilience of the ADN. This optimal problem is to maximize the resilience index, while minimizing both, the total costs and the pollutant emissions. The uncertainties of the demand level, solar, and wind generations are considered by using the robust optimal method. The NSGA-II is applied to solve this introduced multi-objective problem with binary championship selection. Briefly, the main contributions of this paper are:
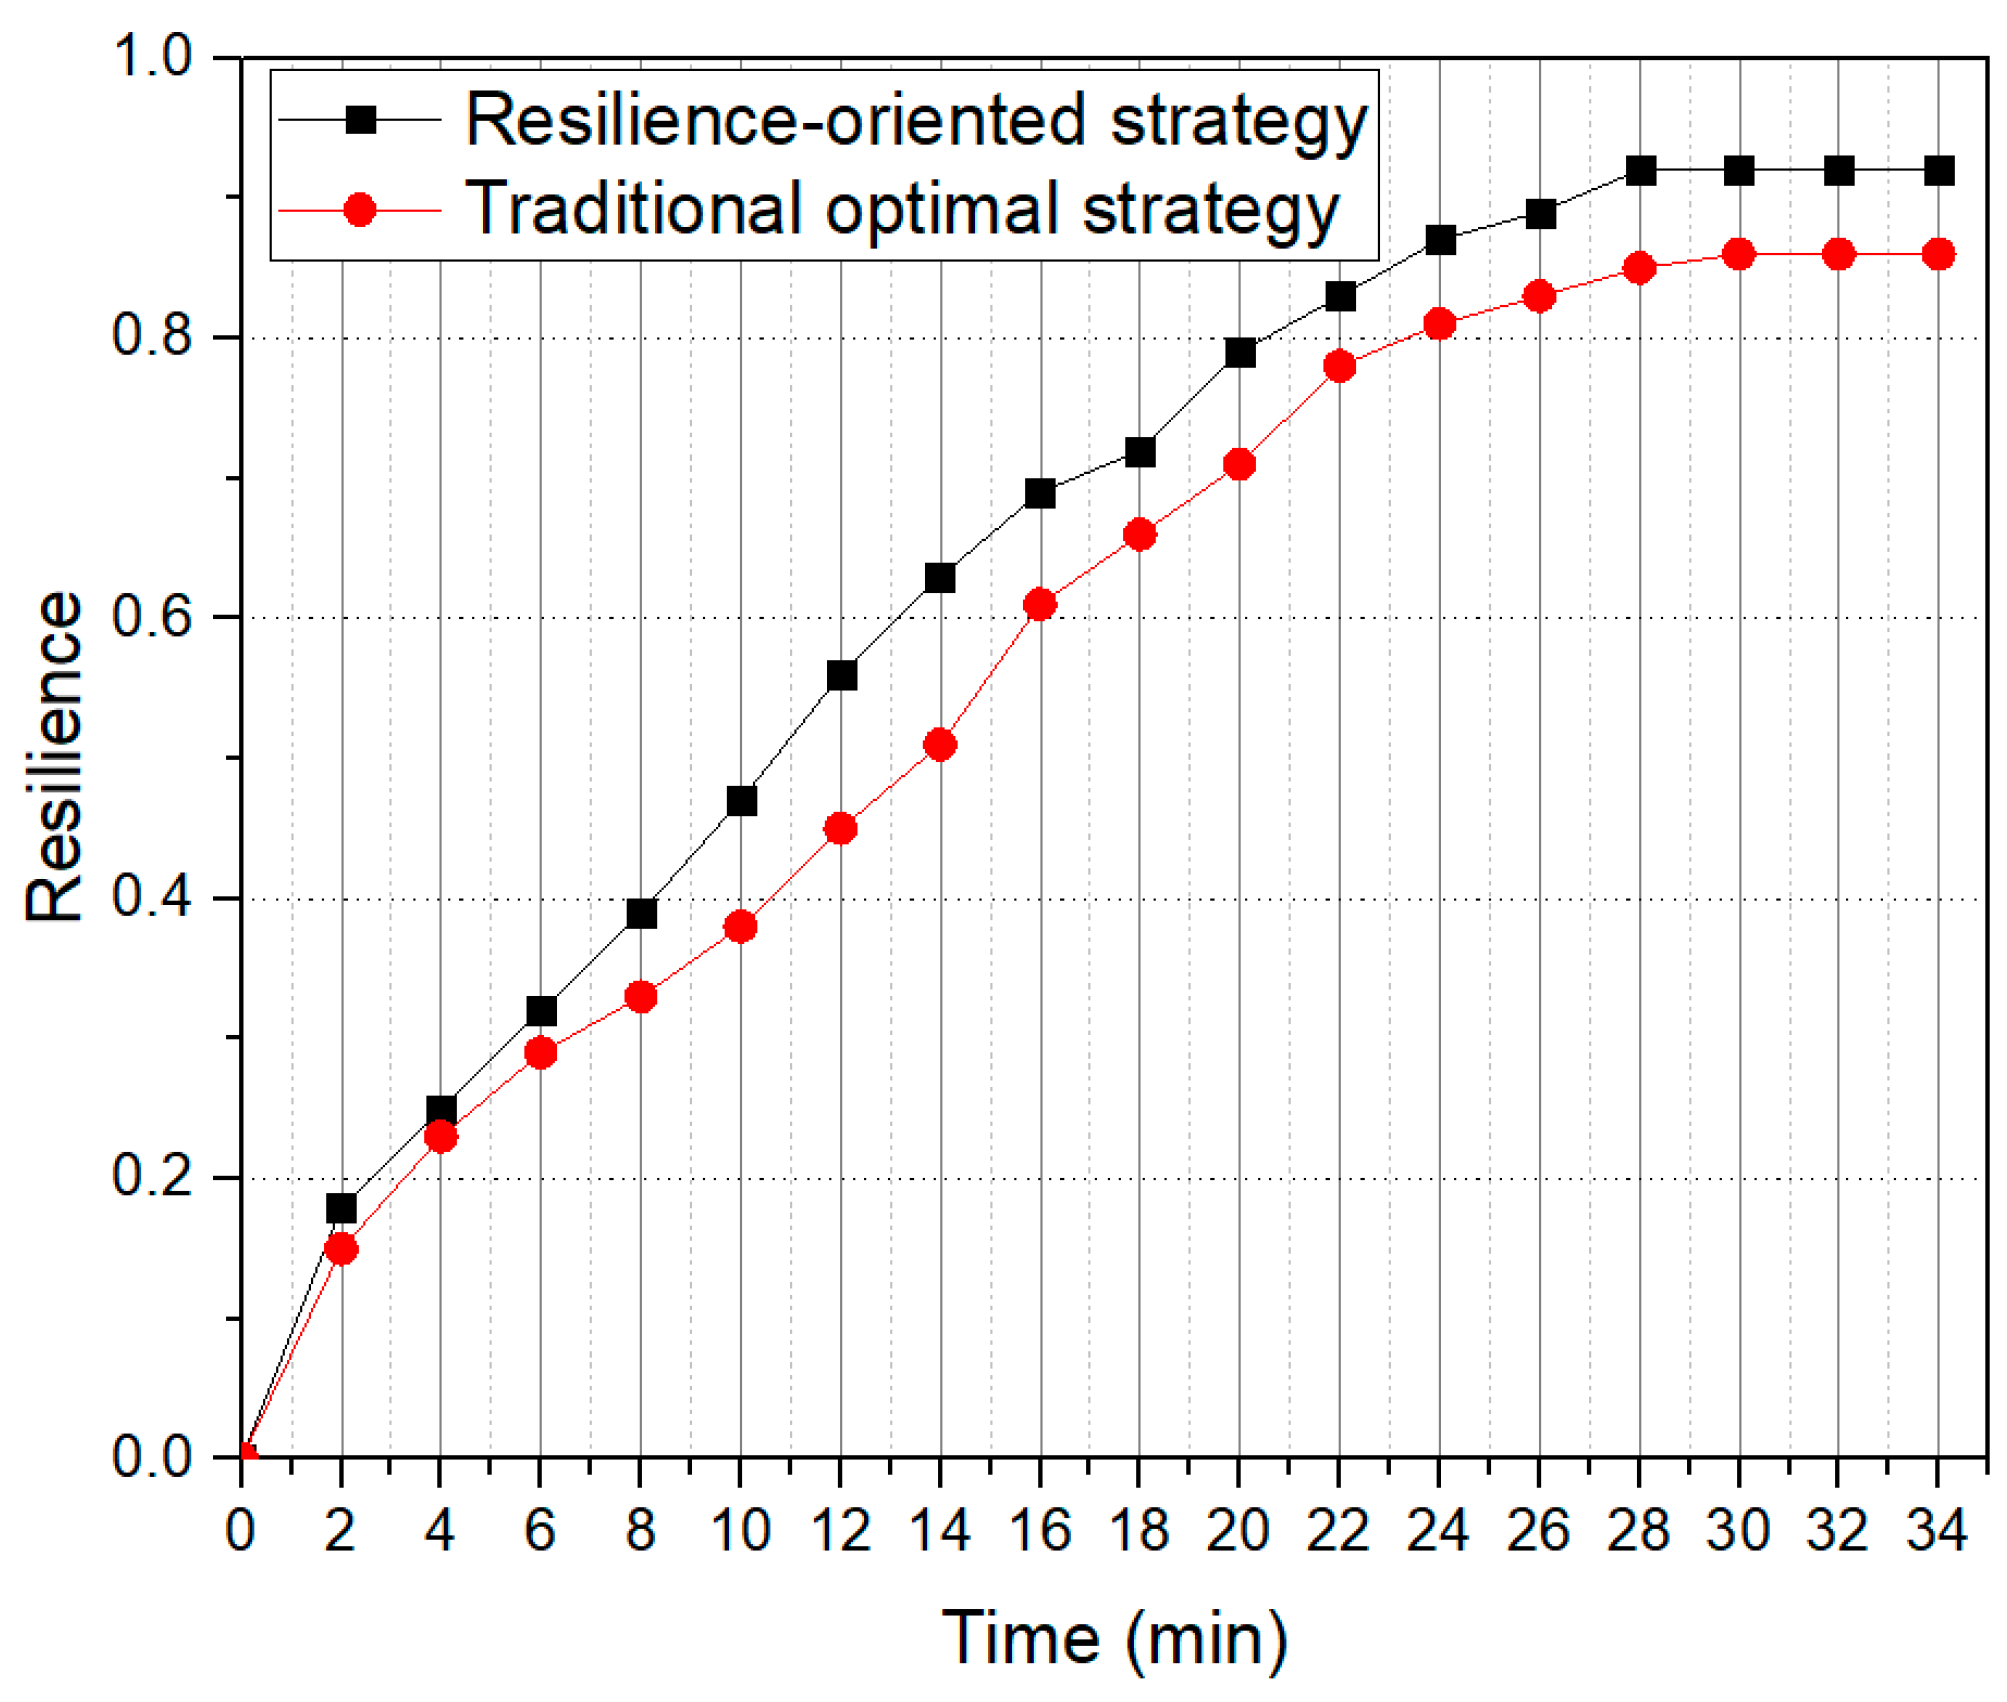
  • Among the existing similar research, there is no optimal operational strategy applied in power systems that takes resilience, economy, and environmental protection all into account, and act as objective functions. In particular, the proposed strategy can notably enhance resilience without significantly increasing the operational costs and pollutant emissions.
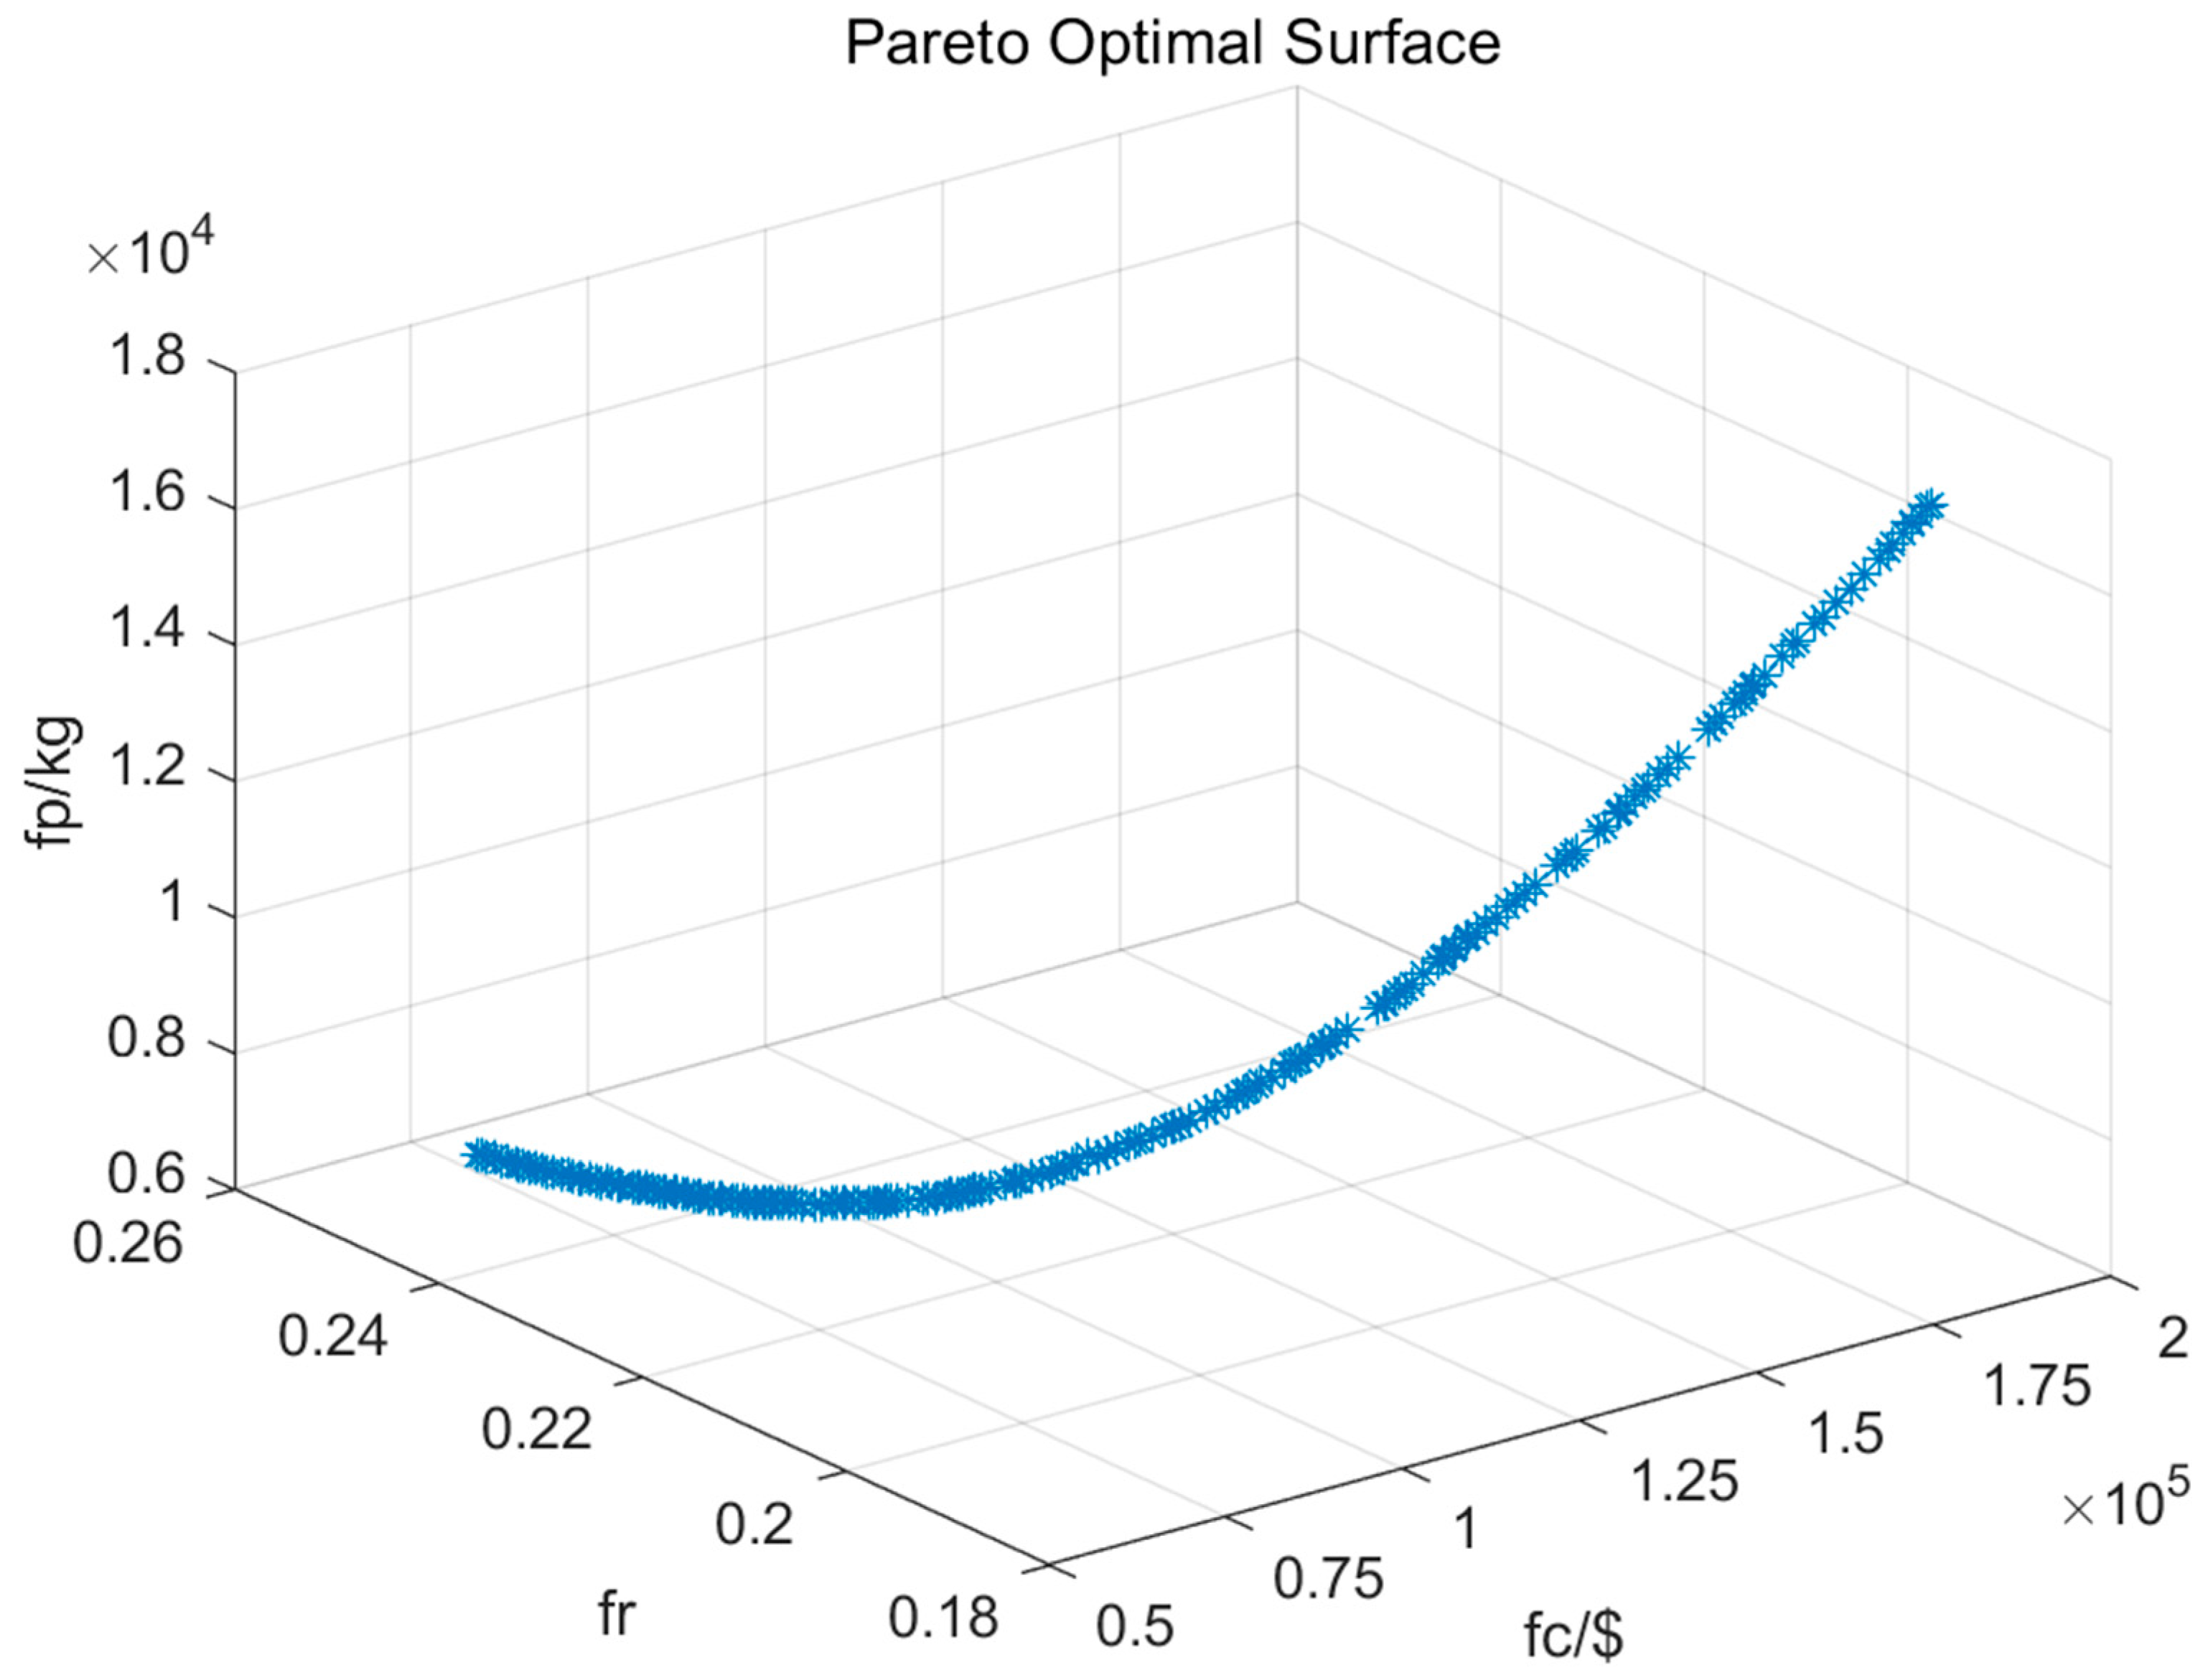
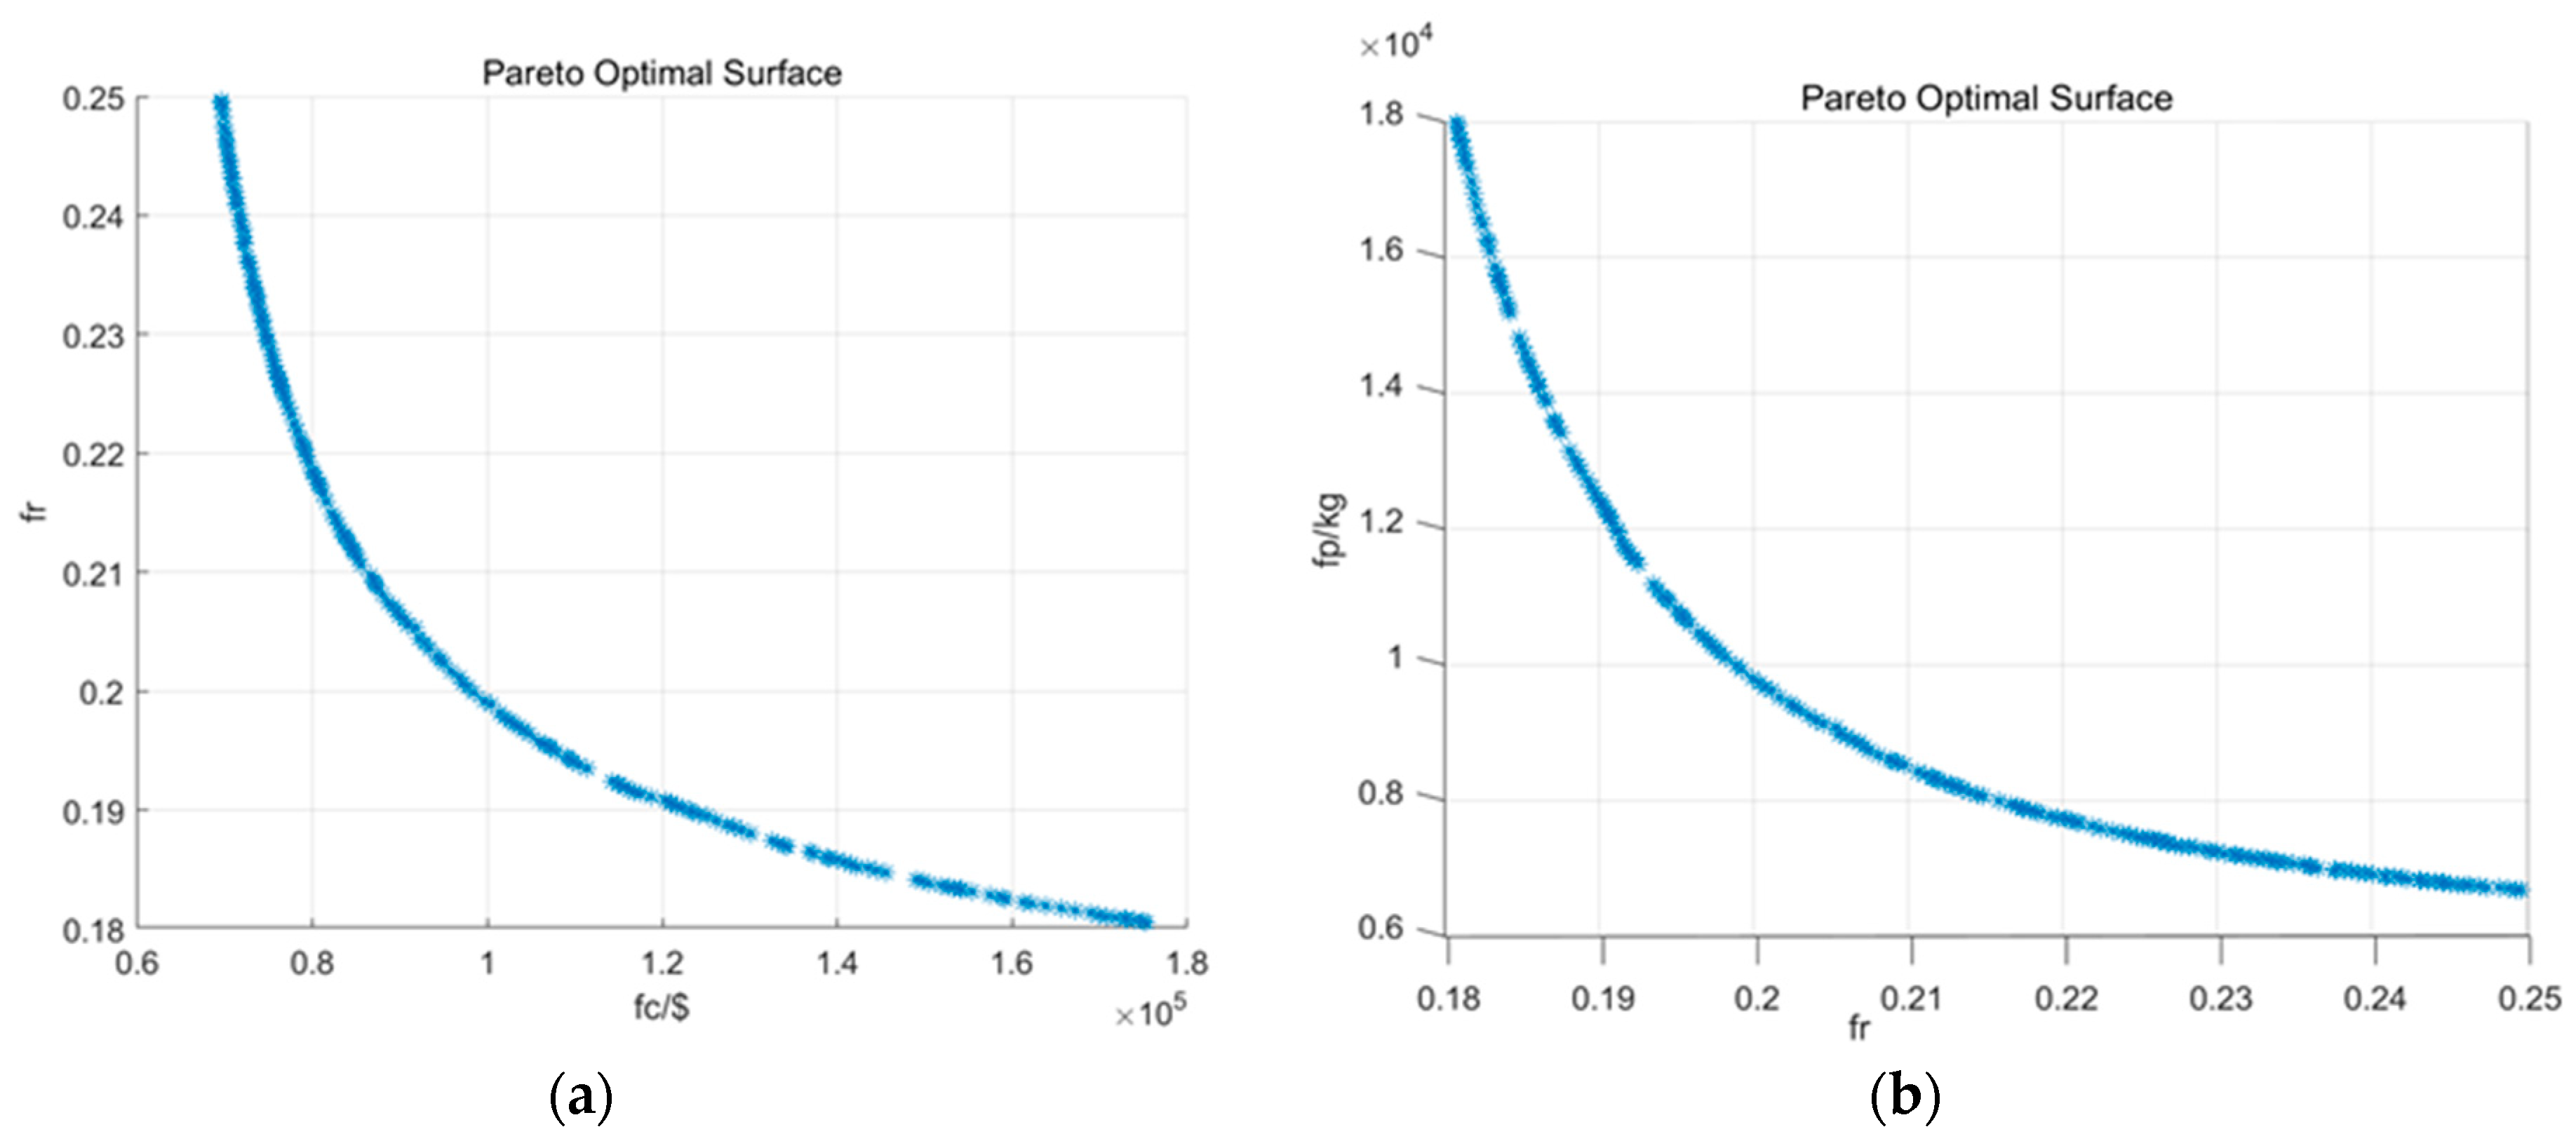
  • In the proposed multi-objective optimal problem, NSGA-II is applied to investigate the solution which has an extremely low CPU time. This paper presents the Pareto optimal fronts to illustrate the optimization results.
  • The optimal strategy proposed in this paper can be widely used in different DER-integrated power systems, such as microgrid, etc.
The rest of paper is organized as follows: Section 2 firstly introduces the DER integrated model, studied in this paper, and the deterministic formulation of the operation mode. Then it transforms the operation problem into a robust optimal formulation, and specifies its multi-objective and constraints. It proposes the BD to decouple the dual min-max problem and NSGA-II to solve this multi-objective problem. The case study and comparison results of the proposed optimal operation strategy are shown in Section 3, and the conclusion is drawn in Section 4.

2. Methods and Model

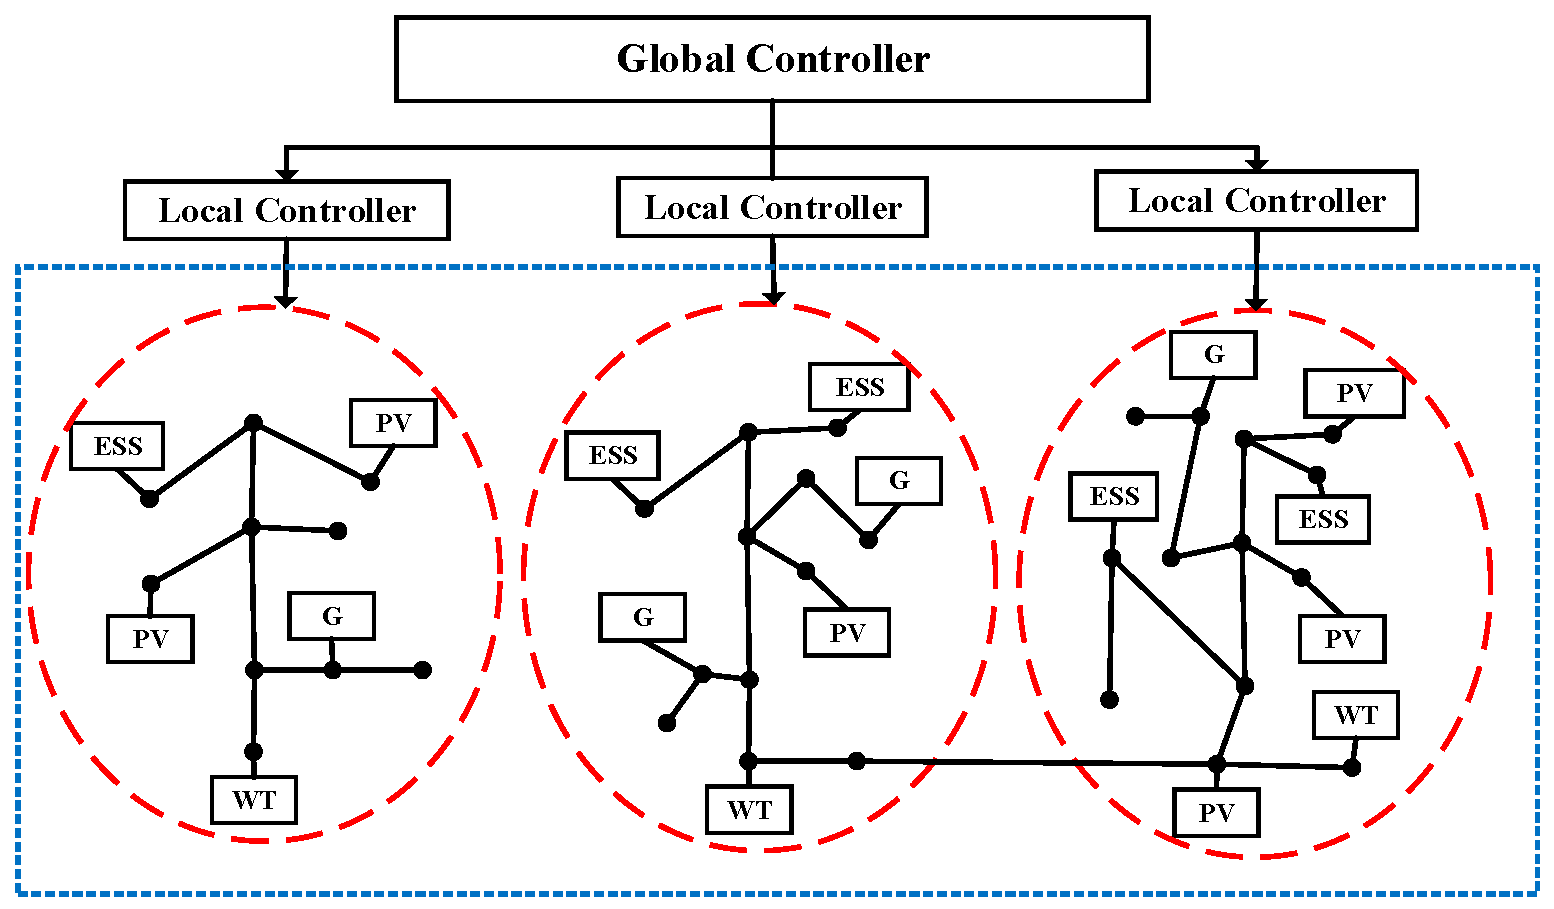
2.1. DER Integrated ADN Operation Model

The ADN mode is a technical solution that can optimize the utilization of DER. and-coordinated operation strategy is a complex problem, involving multiple objectives and many uncertainties, such as the comprehensive utilization of multiple resources (superior network and distributed energy), the coordination of multiple load types, and multiple networks (power network, communication network) [18].
According to the working report of CIGRE C6.11 [19], the DER integrated ADN can be defined as the integrated control of different types of DER, such as PV, WT, ESS, and microgrids. Its flexible network technology can be used to achieve effective power flow management. However, the operation mode of this system is more complex than a traditional DN. The amount of communication data can easily cause information congestion. In order to increase the computing speed and improve the optimal operation ability, the ADN partition scheme is proposed in this paper, which can be optimized locally. There is no need to understand the internal topology among the partitions, and there is only a need to exchange some boundary information to achieve the purpose of coordination and optimization.
The energy controller of DER is an integrated, and is mainly centered on the management of the DC distribution network. It communicates with each unit in the network to obtain the information needed for optimal dispatch and then sends the instructions for optimal dispatch adjustment. The principle of the system energy controller is shown in Figure 1.
DER integrated ADN energy supply system refers to the use of various available and dispersed energy sources, including renewable energy, i.e., solar energy, wind energy, and locally available fossil fuels. Furthermore, it can also flexibly adjust each DER unit, according to the load, in order to increase the recovery rate significantly under the main grid power interruption, as well as enhance the total resilience. DER supply uses a variety of energies, and is generally configurated in the load area, with a short transmission distance and low loss, which have lower costs and pollutant emissions, compared with the traditional distribution network.
When some unpredicted natural incidents occur in the main grid, the link between the main grid and ADN break down. Then it will result in an extreme power interruption for the DER integrated ADN. This scenario is studied in this paper. In this scenario, the imbalance between the power supply and requirement appear, we investigate the optimal operation strategy in ADN to overcome this imbalance and decrease the amount of the total load curtailment. Then, the system is able to realize the energy interaction between DER and the loads, through both global and local controllers, and achieves system optimization and coordinated operation. In consideration of the PV generation with alternating output, it is complementary in terms of time with the WT. The storage and traditional generation units are also used to balance the power shortage under the power interruption. Otherwise, the incident will cause extreme big-scale blackout.

2.2. Resilience-Oriented Robust Optimal Model

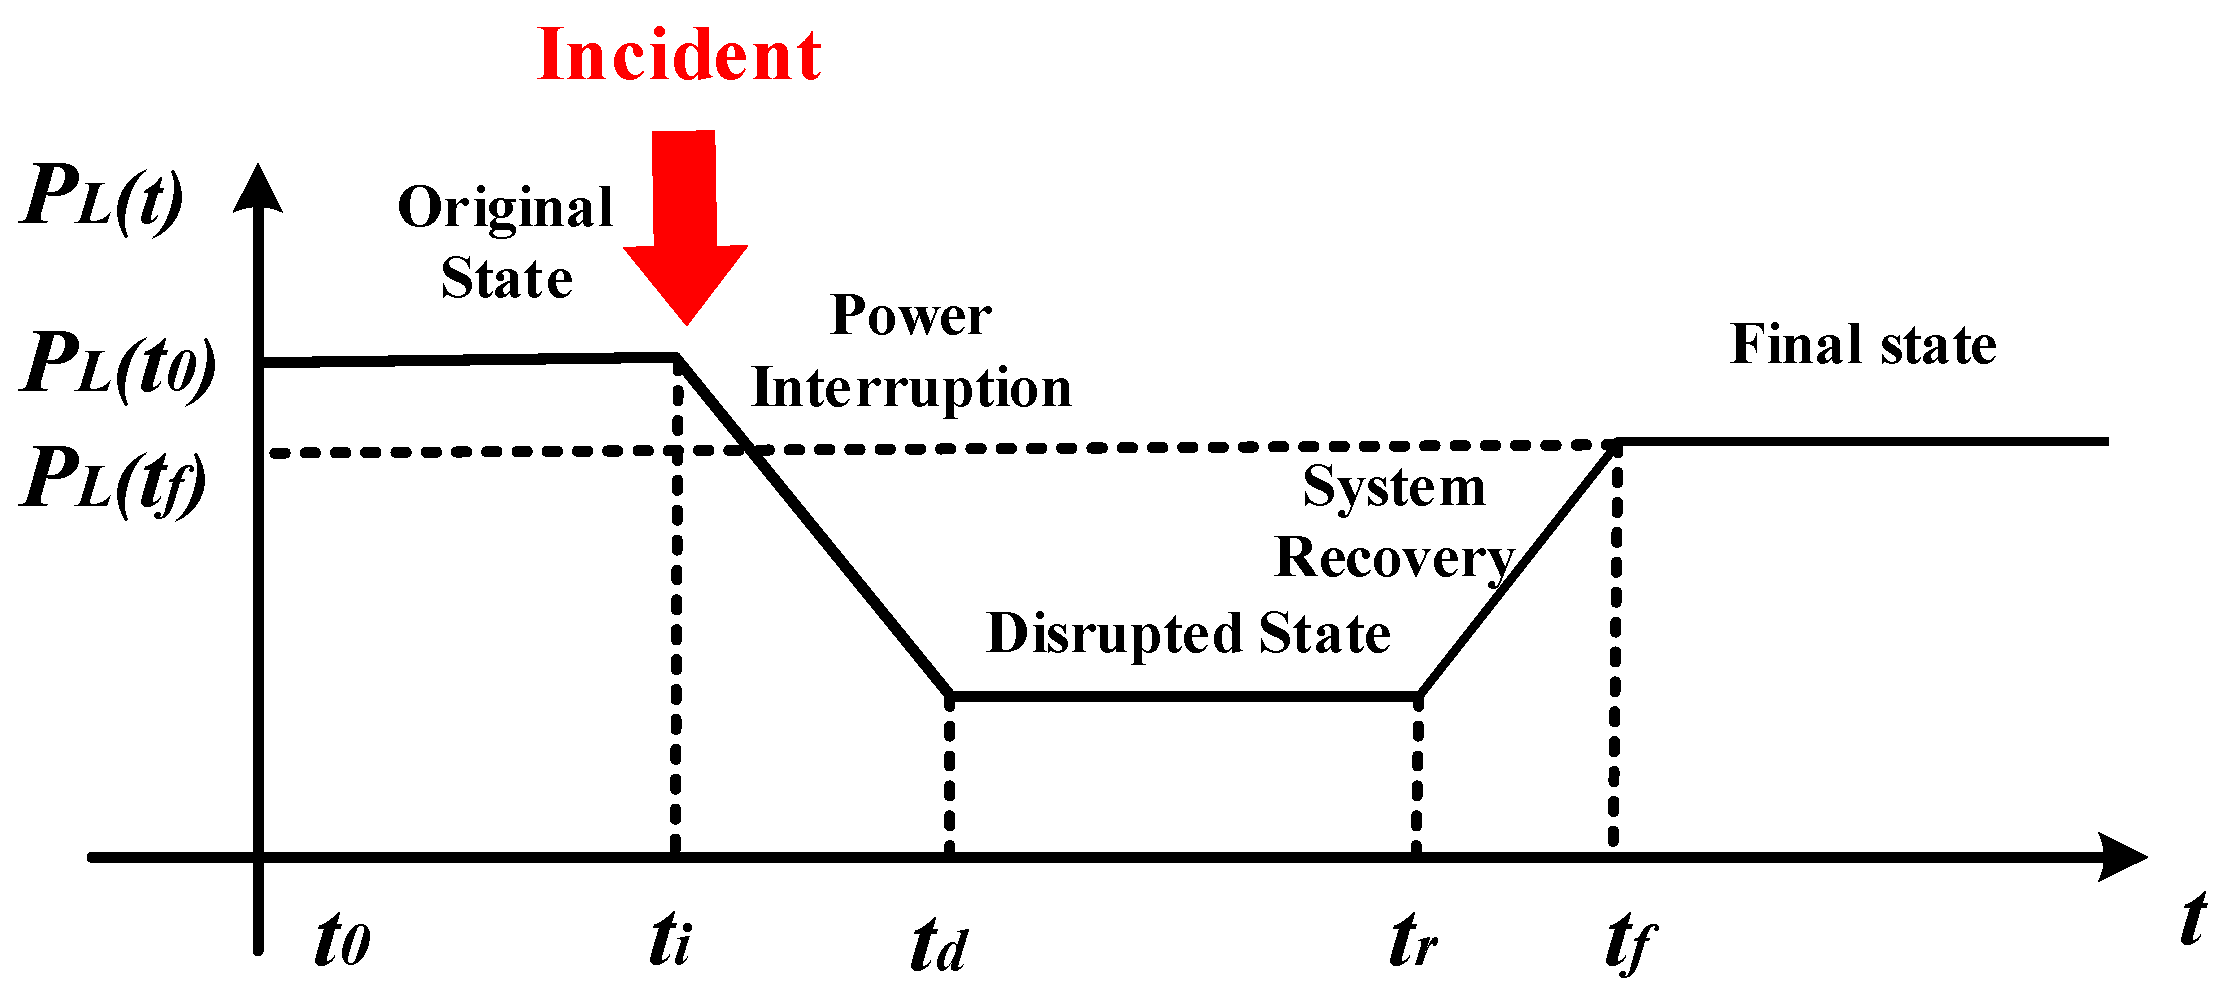
2.2.1. Resilience Definition and Metric

Resilience has different definitions in different scholars’ research. This paper considers that the resilience of ADN is the ability to resist all kinds of hazards, withstand the consequences of initial incident, and quickly restore back to normal operation. Then the power grid can be divided into three stages; original state, disrupted state, and final recovery state. In this part, the definition and metric of the resilience in an ADN are described in detail. The foundation of the system operation states is based on [14] and illustrated in Figure 2.
The PL(t) in Figure 2 represents the power function of the total load remaining in the DG, that has been studied in this paper. The system operates in its original state at time to, then an unpredicted incident occurs at time ti and lasts until time td, when the functionality is considered to be entirely lost. Thus, the system operates in the disrupted state from time te to time td, where the total loads remained reach to the minimum. The recovery/resilient action triggers at time tr. Finally, as a result of the resilient action, the system recovers to the final state with power function value PL(tf) at time tf.
Since the resilience can be quantified as the ability of a system to recover from an incident, as well as maximize the total loads remaining under the power interruption, the quantifiable resilience index can be described as the recovery degree. Here, the recovery degree is defined as the ratio of the actual recovery power to the total lost power, as indicated in (1) [10]. Based on the definition of resilience index, the value of R(t) is between 0 and 1:
R ( t ) = P L ( t ) P L ( t d ) P L ( t 0 ) P L ( t d ) , t t r .

2.2.2. Economical Index

In order to reflect the economic efficiency of the proposed operation strategy, another objective that has been established in this paper was to minimize the total cost of the DER integrated ADN operation. It consists of the generation cost of traditional generation unit and other uncontrollable sources, the charge/discharge cost of the ESS and the startup/shutdown cost, as presented in (2) [13]. Where C p , t S U , C w , t S U and C g , t S U are the starting up costs of PV, WT, and traditional generation unit, respectively. C p , t S D , C w , t S D and C g , t S D are the shunting down costs of PV, WT, and traditional generation unit, respectively. C p , t G , C w , t G and C g , t G are the generation costs of PV, WT, and traditional generation unit, respectively. P ˜ p , t , P ˜ w , t and P g , t are the actual output of PV, WT, and traditional generation unit at time t, respectively. While, C e s , t c h and C e s , t d c h are charging and discharging costs of the battery:
C ( t ) = p PV ( C p , t S U + C p , t S D + C p , t G ( P ˜ p , t ) ) + w WT ( C w , t S U + C w , t S D + C w , t G ( P ˜ w , t ) ) + g G ( C g , t S U + C m , t S D + C g , t G ( P g , t ) ) + e s ESS ( C e s , t c h + C e s , t d c h ) .

2.2.3. Environmental Index

The ADN operates under the main grid power interruption, the total pollutant emission is mostly dependent on fuel consumptions of the traditional generation unit. For simplicity, we assume the CO2 emission can be employed as an example and represent the pollutant degree in this paper. Based on the above analysis, the total CO2 emission can be calculated as (3) [9]. Where F g , t is the amount of fuel consumed by traditional generation units, ω f is the CO2 emission coefficient of fuel consumption.
C O 2 ( t ) = g G ω f F g , t
Based on the above analysis, the optimal model proposed in this paper is a multi-objective optimization problem. The final objective of this model can be presented as (4):
F = { F R , F C , F CO 2 }
where,
F R = max R ( t )
In order to search the optimal solution easily, the resilient objective can be modified as (6).
F R = min ( 1 R ( t ) )
F C = min t = 1 24 C ( t )
F C O 2 = min t = 1 24 CO 2 ( t )

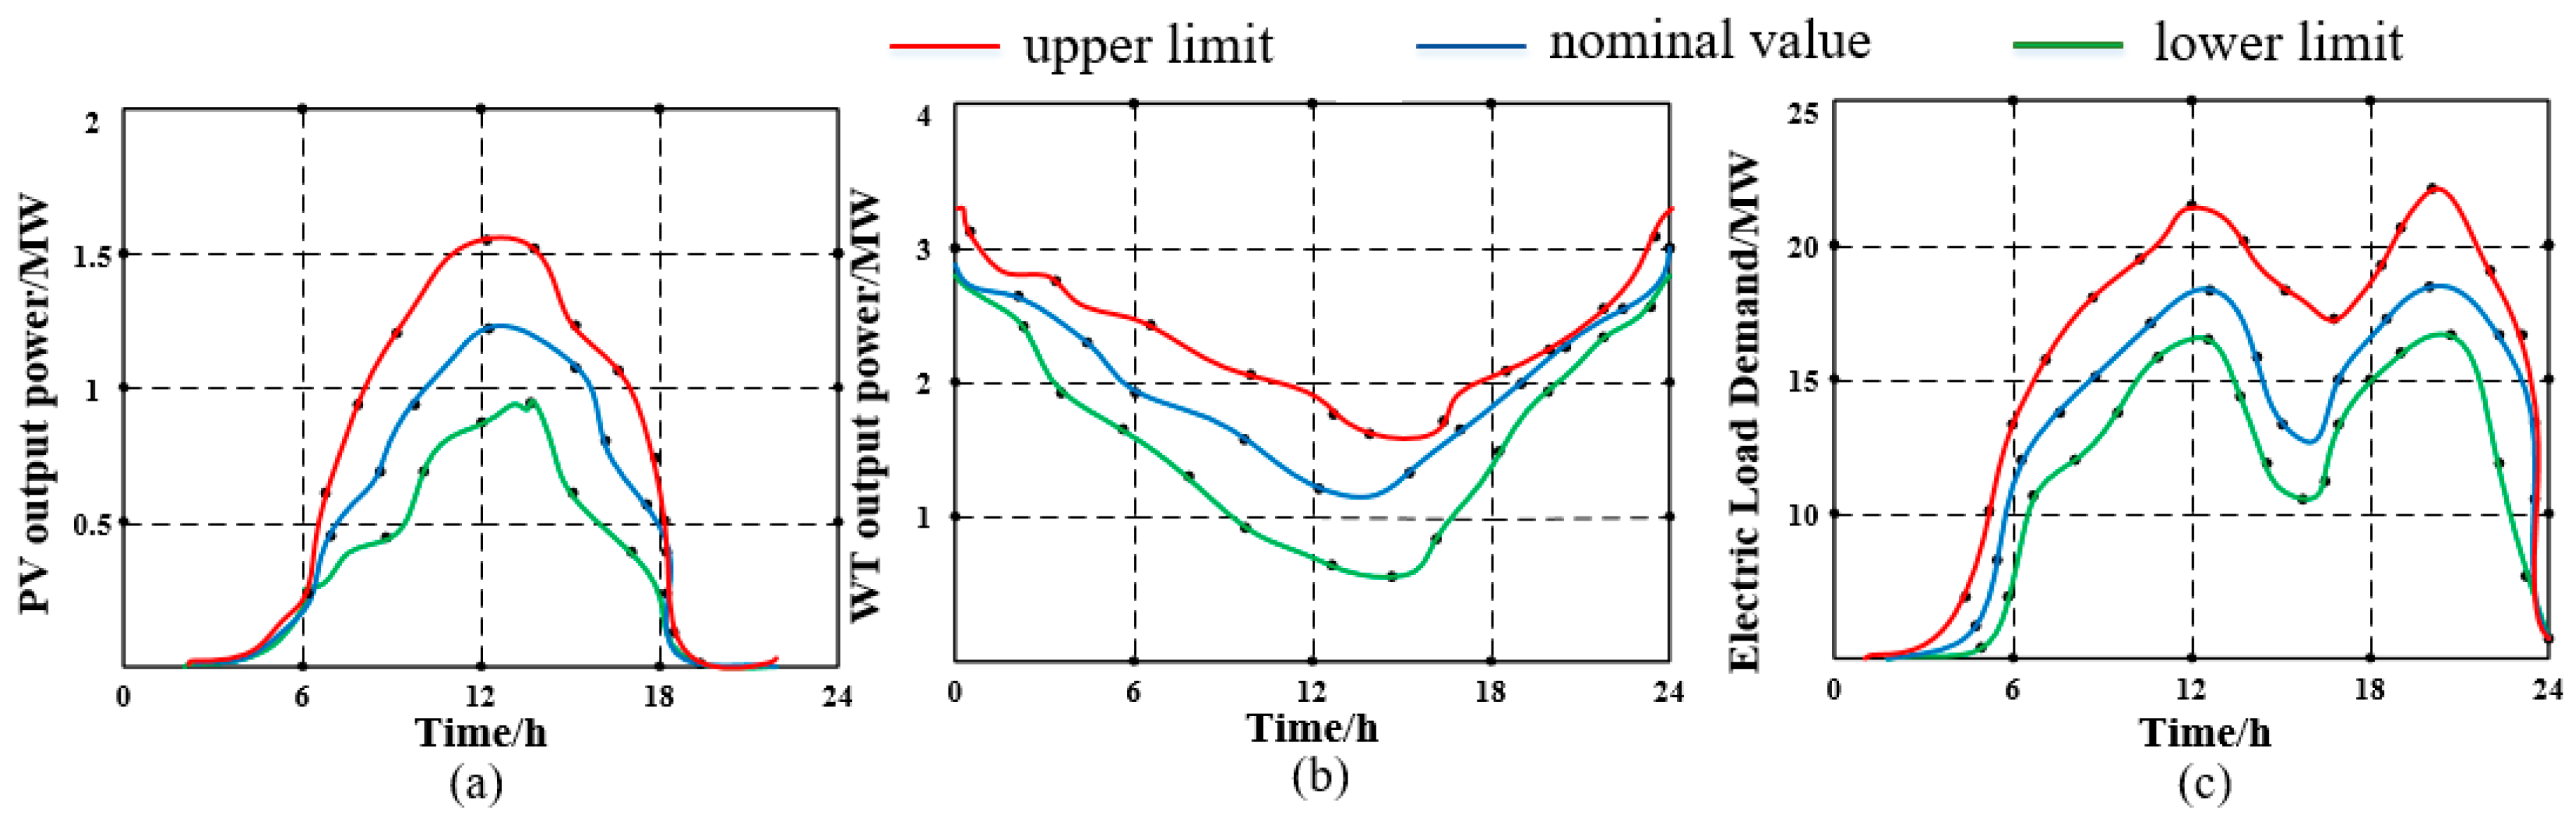
2.2.4. Robust Optimal Objectives Considering the Uncertainty

In order to account for the uncertainty, that exists in both non-dispatchable generation outputs and local load demands, the robust optimal model to enhance the system resilience. Compared to traditional stochastic optimization approaches, based on a probability distribution of the uncertainty data, robust optimal only requires the lower and upper bounds of the uncertain unit [20]. Further, it calculates an optimal solution within an uncertainty, set by considering the worst scenario to guarantee the feasibility of the proposed strategy in every proper scenario.
To obtain the optimal strategy of the ADN, the economic optimal objective should be minimized under the worst case in the uncertainty set just as (7). More precisely, the worst case scenario is when the output power of each uncontrollable generation is at its lower bound, which can be proved in [21], which results in the most total remained loads after the supply interruption. The above proposed optimal model is a min-max dual problem, which must be decoupled into an inner maximization problem and an outer minimization problem. In this paper, a BD algorithm is chosen to decouple it, will be introduced in detail in Section 4.
In the uncertain variable (UV) fluctuation set, different UV leads to different ADN operation cost. Based on this robust idea, this paper needs to select a set of UVs, which maximize the total operation cost of uncontrollable generations. The scenarios described by this set of UVs are defined as the extreme scenarios. Then, in these extreme scenarios, the minimum of the overall optimization economical objective can be solved. In this case, the optimal solution of the decision variables (DV) is obtained. Where U represents the uncertain set, where X is the set of total possible scenarios.
min x X { max u U { t ( p PV ( C p , t S U + C p , t S D + C p , t G ( P ˜ p , t ) ) + w WT ( C w , t S U + C w , t S D + C w , t G ( P ˜ w , t ) ) ) } + t ( e s ESS ( C e s , t c h + C e s , t d c h ) ) + t g G ( C g , t S U + C g , t S D + C g , t G ( P g , t ) ) }

2.2.5. Constraints

In the process of solving the above objective functions, all variables and state variables must satisfy certain constraints. The constraints of solving the model in this paper are as follows:
1. Balance between load and supply:
p P ˜ p , t + w P ˜ w , t + g P g , t + e s ( P e s , t d c h P e s , t c h ) = P L ( t ) .
The load balance constraint (10) [6] ensures that the sum of PV, WT, and traditional generation unit output power, and the ESS net discharging power match the remained electric loads. Where, P L ( t ) is the total power supply for the loads.
2. Uncontrollable DER output power constraints:
P p PV P ^ p PV P ˜ p PV P p PV + P ^ p PV , p PV
P w WT P ^ w WT P ˜ w WT P w WT + P ^ w WT , w WT .
Based on the fluctuation of uncontrollable DER output, it can be restricted in a limit, which contains its nominal value and its maximal fluctuated value. These box constraints are shown in (11) and (12) [12], where P ^ w WT and P w WT are nominal values of PV, and WT, respectively, while P ^ p PV and P ^ w WT are their maximal fluctuated values.
3. Traditional generation unit output power constraints:
P g min P g , t P g max , g G
Δ P g R D P g , t P g , t 1 Δ P g R U g G .
The dispatchable generation unit output power is restricted in the minimum and maximum generation constraints shown in (13) [12]. Meanwhile, the ramp-up/down limits (14) [12] should be considered. Where P g min , P g max are traditional generation unit minimal/maximal outputs, Δ P g R D , Δ P g R U are ramping down/ramping up powers.
4. ESS charge/discharge constraints:
P e s , t P e s , t d c h , max I e s , t d c h P e s , t c h , min I e s , t c h , e s ESS
P e s , t P e s , t d c h , min I e s , t d c h P e s , t c h , max I e s , t c h , e s ESS
I e s , t d c h + I e s , t c h 1 , I e s , t d c h , I e s , t c h { 0 , 1 } e s ESS .
The ESS operates under either charging or discharging mode. Thus, ESS output power in both modes should be limited by minimal and maximal values (15)–(17) [10]. Where P e s , t c h , min , P e s , t c h , max are ESS minimal/maximal charging powers, and P e s , t d c h , min , P e s , t d c h , max are ESS minimal/maximal discharging powers. I e s , t d c h , I e s , t c h are ESS discharging, and charging statues, respectively.
Q e s , t = Q e s , t 1 P e s , t , e s ESS
S O C e s , t = Q e s , t Q e s _ max , e s ESS
20 % S O C e s , t 80 % , e s ESS
The ESS stored energy Q e s , t is calculated, based on previously stored energy Q e s , t 1 and the amount of charged/discharged power, like (18). SOCes,t represents the state of charge of ESS showed in (19) [22] and must be restricted by the specific limit in (20) [22].
5. Load constraints
P i L P ^ i L P ˜ i L P i L + P ^ i L , i L .
The forecasted demands of electric load are restricted in the above limit (21) [12]. Like the constraints of uncontrollable DER output, it contains its nominal value P i L and its maximal fluctuated value P ^ i L .

2.3. Robust Solution Methodology

2.3.1. Min-Max Problem Decoupling based on BD

For the proposed min-max optimal model, BD is used to decompose the model into the main problem (MP) and the sub-problem (SP). The main problem is to solve the optimal solution satisfying the constraint condition under known worst possible scenario.
In the aforementioned robust optimization model, the optimal inner variable u is UV u = ( P ˜ p , t PV , P ˜ w , t WT , P ˜ i , t L ) , while the outer DV x = ( P g , t , P e s , t c h , P e s , t d c h ) is dispatchable. SP is to find the extreme scenarios of UVs that maximize the network cost and minimize resilience. Auxiliary variable z1 is constructed in (22).
In SP, the UVs are regarded as unknown variables, and the DVs are known variables and solved with all the constraints of the problem:
z 1 = f s u b ( P ˜ p , t PV ( k + 1 ) , P ˜ w , t WT ( k + 1 ) , P ˜ i , t L ( k + 1 ) ) = max u U { t ( p PV ( C p , t S U + C p , t S D + C p , t G ( P ˜ p , t ) ) + w WT ( C w , t S U + C w , t S D + C w , t G ( P ˜ w , t ) ) ) } .
As for MP, the objective function is defined in (23). Then, an optimal cut-set z1 is added to the constraints to ensure the set of DVs can satisfy the constraints in the optimization model with arbitrary values of UVs:
F m a i n = z 1 + min x X { t ( e s ESS ( C e s , t c h + C e s , t d c h ) + g G ( C g , t S U + C g , t S D + C g , t G ( P g , t ) ) ) } .
The BD decoupling process is specified as follows, where lower band (LB) and upper band (UB) are defined in (24) and (25).
Step1: Set UB = + , LB = , solve the optimal scheduling problem in the desired scenario and obtain the initial value of the DV x = ( P g , t ( 0 ) , P e s , t c h ( 0 ) , P e s , t d c h ( 0 ) ) .
Step2: Use the DV initial value, solve the SP, and get the current value of UV u = ( P ˜ p , t P V ( 0 ) , P ˜ w , t W T ( 0 ) , P ˜ i , t L ( 0 ) ) .
Step3: Add the optimal cut set to MP constraints, set k = 0, take u = ( P ˜ p , t PV ( k ) , P ˜ w , t WT ( k ) , P ˜ i , t L ( k ) ) as a known value, solve the MP, obtain a DV solution x = ( P g , t ( k + 1 ) , P e s , t c h ( k + 1 ) , P e s , t d c h ( k + 1 ) ) , and update the LB.
Step4: By using the DV, solve the SP, obtain u = ( P ˜ p , t PV ( k + 1 ) , P ˜ w , t WT ( k + 1 ) , P ˜ i , t L ( k + 1 ) ) , and update the UB.
Step5: Verify the difference between LB and UB, if it is smaller than δ , end the process. Otherwise, let k = k + 1.
L B = F m a i n ( P g , t ( k + 1 ) , P e s , t c h ( k + 1 ) , P e s , t d c h ( k + 1 ) )
U B = f s u b ( P ˜ p , t PV ( k + 1 ) , P ˜ w , t WT ( k + 1 ) , P ˜ i , t L ( k + 1 ) ) + t ( e s ESS ( C e s , t c h + C e s , t d c h ) + g G ( C g , t S U + C g , t S D + C g , t G ( P g , t ) ) )

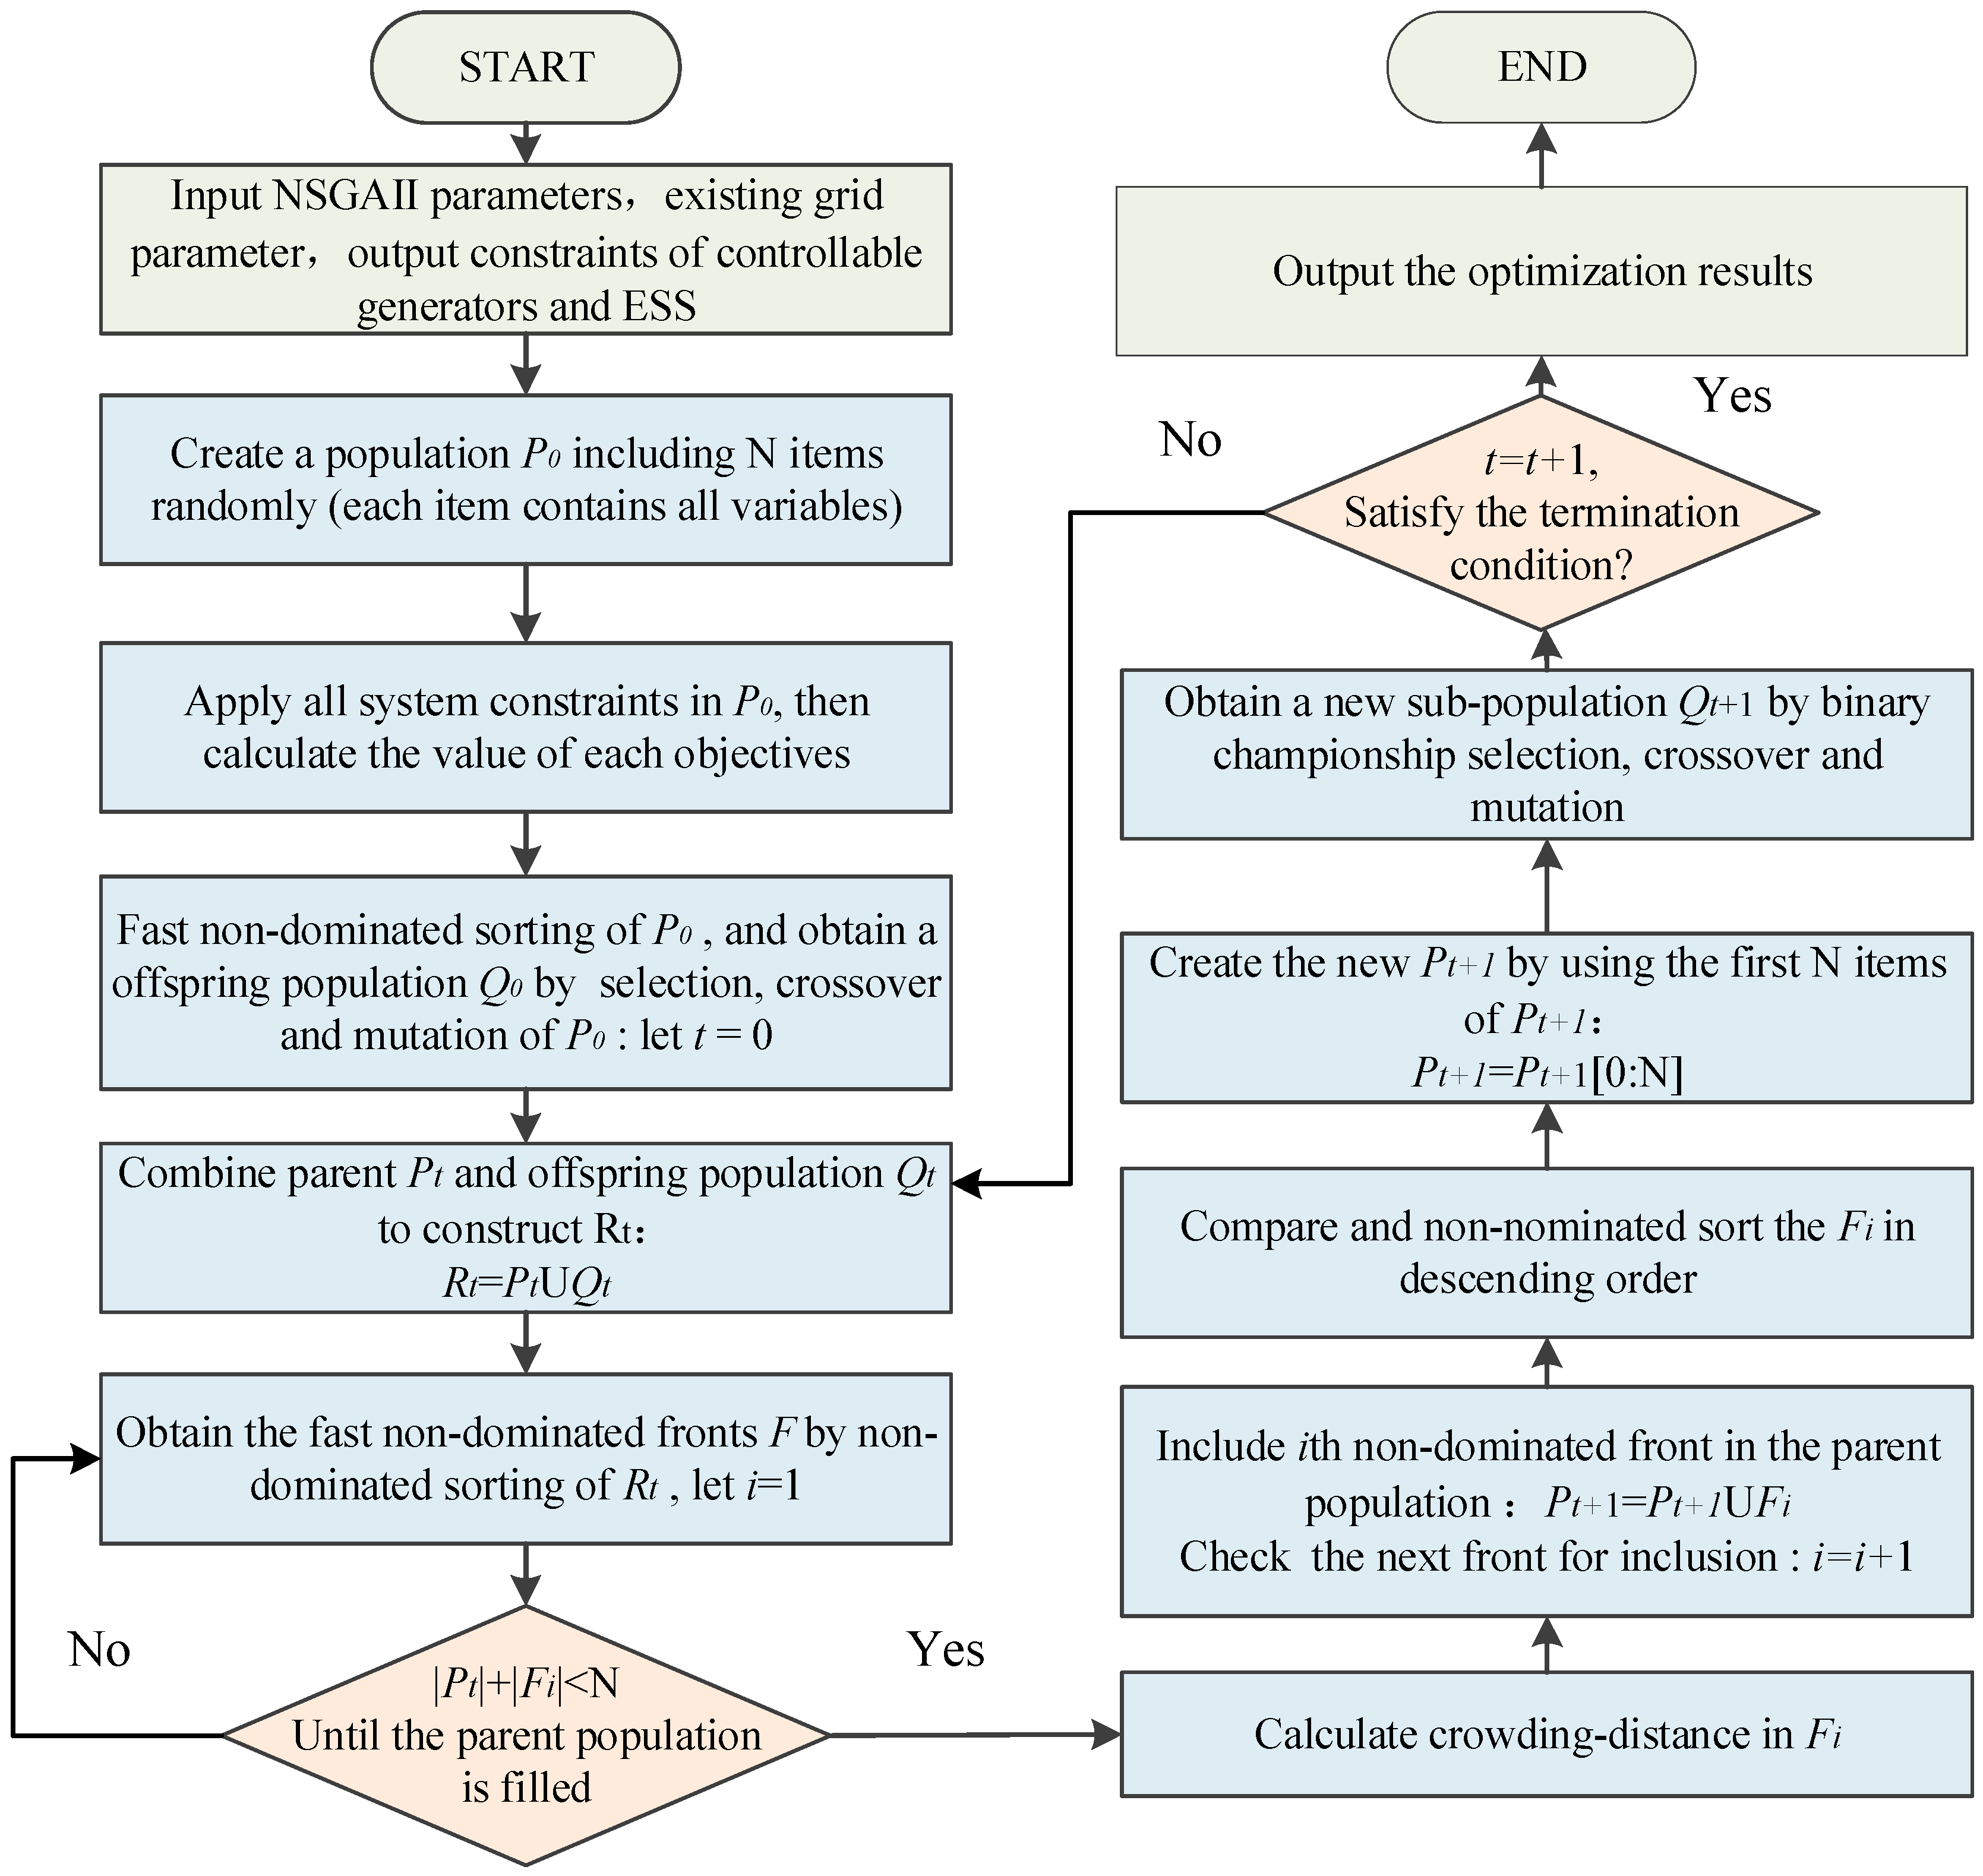
2.3.2. Multi-Objective Problem Solving based on NSGA-II

As for a multiple optimal problem, like (4) proposed in this paper, it needs to give rise to a set of optimal solutions, especially known as Pareto-optimal solutions, instead of a single optimal solution. To move towards the true Pareto-optimal front, it demands to find as many Pareto-optimal solutions as possible. Since the evolutional algorithm (EA) work with a population of solution, an EA can be used to find multiple Pareto-optimal solutions in a single simulation run and an extremely low CPU time.
NSGA-II is an improved EA, based on NSGA, and it is a fast and elitist multi-objective genetic algorithm with O(MN2) computational complexity. A selection operator exists in NSGA-II to create a mating pool by making a combination of parents and offspring populations and select the best N solution. From the amount of simulation results on a number of different test problems, which were made by many researchers, such as Kalyanmoy Deb, NSGA-II outperforms other EAs in terms of finding much better spread of solutions, as well as better convergence near the true Pareto-optimal front.
As a consequence, NSGA-II is applied in this paper to search for the optimal solution, Pareto-optimal front. The processing flow of the NSGA-II is shown as Figure 3.

3. Results and Discussion

In order to verify the feasibility and effectiveness of the proposed optimal operation strategy, the standard IEEE 34-node system is modified and reformed accordingly. Based on the ADN partition methodology proposed in Section 2, this 34-node system can be divided into 4 zones. Thus, the two-stage control mode can be applied in this distribution network.
The studied case with a power interruption in the main grid is shown in Figure 4, and the total number of distributed generation units and energy storage units in the system is 20. The types and rated capacity parameters of each generation unit are shown in Table 1. Meanwhile, the main parameters in the constraints of each controllable DER types are presented in Table 2.
Since the output power of PV panels and WTs are stochastic and uncontrollable, the fluctuated curves of these kinds of DERs can only be obtained, based on historical data and forecast methodology. Here, this paper chooses one PV panel on Node-4 and one WT on Node-7 as the examples to illustrate their output trends. Figure 5 shows that there is fluctuation around the nominal value, and the uncontrollable generation output cannot exceed the determined upper and lower limits. This feature demonstrates the feasibility of robust optimal model applied in this paper.
This study considers a 24-hour operation period of the ADN, operating under the power interruption, and chooses 1-hour as the calculation step length to optimize the economic and environmental objectives. As for the resilience index, based on its definition in Section 2, R(t) is a variable in the steady state. The experimental results of optimal models are demonstrated as follows. In Figure 6, the ‘fc’ represents the total operation cost in this ADN in the 24-period, ‘fp’ is the total pollutant emissions in the 24-period, while ‘fr’ is the difference between 1 and its resilience index.
From the above three-dimensional Pareto surface, based on the multi-objective optimization algorithm, the optimal solution can be obtained as the nearest point to the origin. Thus, the final optimal solution is as follows: The resilience index is 0.82, while, the total operation cost is $ 97,200 and the total pollutant emission is 9669 kg in the 24-period.
While, in order to illustrate the system resilience index, recovery time, and recovery velocity, this paper considers the 35 minutes period and chooses 2-minute as the step to study it. The experimental result of optimal model, compared to the traditional optimal operation strategy, is demonstrated in Figure 7.
In order to clarify the relationship between the resilience and the other two objectives, the two-dimensional cross-sections of Figure 6 are shown in Figure 8. Both relationships have Pareto fronts, demonstrating the necessity of the application of NSGA-II.
The optimal operation strategy is presented in Figure 9, since the peak hours are at night, the biggest output power of the dispatchable DERs appears at 22 h, the total output of traditional generation unit in this 24 h-period is 139.06 MW.

4. Conclusions

This paper proposes a resilience-oriented ADN optimal strategy when a power interruption occurs in the main grid. In this optimal strategy, the resilience acts as the first objective in the optimal model. Further, the total operation costs and pollutant emissions are treated as other objectives. Due to the fluctuation of DER output power, the uncertainty must be taken into account in the proposed strategy. Thus, the economic objective can be described as a robust min-max optimal problem, which is decoupled by BD in this paper. Then, this multi-objective problem is solved by NSGA-II, where the three-dimensional Pareto surface is applied to search the optimal solution.
As for the out-performance of the proposed approach in this paper, among the existing research results, there is no optimal operation strategy in power system that takes resilience, economy, and pollutant emission into account, and acts as objectives. Furthermore, NSGA-II is applied to solve this multi-objective problem, rather than combines these objectives to different extents. Thus, the solution obtained by this paper is more reliable and accurate without being influenced by subjective factors.
NSGA-II outperforms other optimal algorithms in terms of finding a diverse set of solutions and in converging near the true Pareto-optimal set. Thus, the NSGA-II could find a more competitive optimal solution with an extremely low CPU time. And this paper presents three-dimension Pareto optimal fronts to illustrate the optimization results. In this way, the optimal solution can be presented more clearly.
Besides, the simulation results show that it can provide an economic DER integrated ADN operation strategy and enhance the resilience simultaneously by taking the uncertainties into account. This optimal strategy with general usability can also be widely used in different DER-integrated power systems, such as microgrids.

Author Contributions

Conceptualization, J.W. and X.Z.; methodology, J.W.; software, J.W. and W.W.; validation, J.W., N.T. and X.Z.; formal analysis, J.W.; investigation, W.W. and L.L.; resources, N.T.; data curation, J.W. and W.W.; writing—original draft preparation, J.W.; writing—review and editing, X.Z.; visualization, J.W.; supervision, N.T.; project administration, W.W. and L.L.; funding acquisition, N.T.

Funding

This research was funded by Natioanl Key Research and Developement Program of China, grant number 2016YFB0900600, National Natural Science Foundation of China, grant number 51877135, Major Scientific Research and Innovation Projects of Shanghai Education Commission in 2019, grant number 2019-01-07-00-02-E00044 and Shanghai Rising-Star Program, grant number 18QA1402100.

Conflicts of Interest

The authors declare no conflict of interest.

Nomenclature

Indices:
iIndex for loads.
pIndex for PV panels.
wIndex for WTs.
gIndex for Gs.
esIndex for ESSs.
tIndex for time.
Sets:
PVSet of PV panels.
WTSet of WTs.
GSet of Gs.
ESSSet of electrical storage stations.
USet of uncontrollable sources.
XSet of dispatchable variables.
LSet of load.
Constants:
ω f CO2 emission coefficient of the fuel.
P i L Nominal value of the load.
P ^ i L Maximal fluctuation of the load.
P p PV PV nominal output power.
P ^ p PV PV output power maximal fluctuation.
P w WT WT nominal output power.
P ^ w WT WT output power maximal fluctuation.
P g min , P g max G minimal/maximal output power
Δ P g R D , Δ P g R U MT ramp down/ramp up power.
P e s c h , min , P e s c h , max ESS minimal/maximal charging power.
P e s d c h , min , P e s d c h , max ESS minimal/maximal discharging power.
Variables:
R ( t ) Resilience of the DER integrated ADN.
C ( t ) Total cost of the DER integrated ADN.
C O 2 ( t ) Total CO2 emission.
P e s ESS charging/discharging power.
P ˜ p PV PV panel actual output power.
P ˜ w WT WT actual output power.
P m MT output power.
Q e s ESS stored energy.
I e s d c h , I e s c h Discharging and charging statues of ESS.
S O C e s , t State of charge of ESS
F g The amount of fuel consumed byG.
P L Total power supply for loads.
C S U , C S D Startup/shutdown cost.
C c h , C d c h Charge/discharge cost.
C G ( ) Generation cost.

References

  1. Albasrawi, M.N.; Jarus, N.; Joshi, K.A.; Sarvestani, S.S. Analysis of reliability and resilience for smart grids. In Proceedings of the IEEE Signature Conference on Computers, Software and Applications, Vasteras, Sweden, 21–25 July 2014; pp. 529–534. [Google Scholar]
  2. Wang, Z.; Liang, W.; Chen, S.J.; Han, L.; Wang, S.X. Rules of distributed generator integration to urban distribution network. Elect. Power 2013, 46, 43–46. [Google Scholar]
  3. Fan, M.; Su, A.; Zhang, Z. A planning approach for active distribution networks. In Proceedings of the 21st International Conference on Electricity Distribution, Frankfurt, Germany, 6–9 June 2011; pp. 1–4. [Google Scholar]
  4. Chen, Y.; Liu, D.; Li, Q.; Nong, J. Simulation research on distributed energy consumption in active distribution network. In Proceedings of the China International Conference on Electricity Distribution, Shenzhen, China, 23–26 September 2014; pp. 1099–1103. [Google Scholar]
  5. Simonov, M. Dynamic partitioning of DC microgrid in resilient clusters using event-driven approach. IEEE Trans. Smart Grid 2014, 5, 2618–2625. [Google Scholar] [CrossRef]
  6. Barker, K.; Ramirez-Marquez, J.E.; Rocco, C.M. Resilience-based network component importance measures. Reliab. Eng. Syst. Saf. 2013, 117, 89–97. [Google Scholar] [CrossRef]
  7. Bruneau, M.; Chang, S.E.; Eguchi, R.T.; Lee, G.C.; O’Rourke, T.D.; Reinhorn, A.M.; Von Winterfeldt, D. A framework to quantitatively assess and enhance the seismic resilience of communities. Earthq. Spectra 2012, 19, 733–752. [Google Scholar] [CrossRef]
  8. Francis, R.; Bekera, B. A metric and frameworks for resilience analysis of engineered and infrastructure systems. Reliab. Eng. Syst. Saf. 2014, 121, 90–103. [Google Scholar] [CrossRef]
  9. Vugrin, E.D.; Warren, D.E.; Ehlen, M.A.; Camphouse, R.C. A framework for assessing the resilience of infrastructure and economic systems. In Sustainable and Resilient Critical Infrastructure Systems; Springer: Berlin, Germany, 2010. [Google Scholar]
  10. Ouyang, M.; Dueñas-Osorio, L.; Min, X. A three-stage resilience analysis framework for urban infrastructure systems. Struct. Saf. 2012, 36, 23–31. [Google Scholar] [CrossRef]
  11. Haimes, Y.Y. On the definition of resilience in systems. Risk Anal. 2010, 29, 498–501. [Google Scholar] [CrossRef] [PubMed]
  12. Kahan, J.H.; Allen, A.C.; George, J.K. An operational framework for resilience. J. Homel. Secur. Emerg. Manag. 2009, 6. [Google Scholar] [CrossRef]
  13. Ouyang, M.; DueñasOsorio, L. Multi-dimensional hurricane resilience assessment of electric power systems. Struc. Safety 2014, 48, 15–24. [Google Scholar] [CrossRef]
  14. Henry, D.; Ramirez-Marquez, J.E. Generic metrics and quantitative approaches for system resilience as a function of time. Reliab. Eng. Syst. Saf. 2017, 99, 114–122. [Google Scholar] [CrossRef]
  15. Gharavi, H.; Ardehali, M.M.; Ghanbari-Tichi, S. Imperial competitive algorithm optimization of fuzzy multi-objective design of a hybrid green power system with considerations for economics, reliability, and environmental emissions. Renew. Energy 2015, 78, 427–437. [Google Scholar] [CrossRef]
  16. Ben-Tal, A.; Nemirovski, A. Robust optimization–Methodology and applications. Math. Program. 2002, 92, 453–480. [Google Scholar] [CrossRef]
  17. Bertsimas, D.; Brown, D.B.; Caramanis, C. Theory and applications of robust optimization. SIAM Rev. 2010, 53, 464–501. [Google Scholar] [CrossRef]
  18. Fan, M.; Zhang, Z. Research on the problem of active distributed network. Distrib. Util. 2014, 1, 22–27. [Google Scholar]
  19. D’Adamo, C.; Jupe, S.; Abbey, C. Global survey on planning and operation of active distribution networks-Update of CIGRE C6.11 working group activitie. In Proceedings of the International Conference and Exhibition on Electricity Distribution, Prague, Czech Republic, 8–11 June 2009; pp. 1–4. [Google Scholar]
  20. Dai, C.; Wu, L. A two-stage robust transmission expansion planning approach with multi-band uncertainty set. In Proceedings of the IEEE Power and Energy Society General Meeting, Boston, MA, USA, 17–21 July 2016. [Google Scholar]
  21. Jiang, R.; Zhang, M.; Li, G.; Guan, J. Two-Stage Robust Power Grid Optimization Problem. Available online: https://pdfs.semanticscholar.org/7050/199ae47dacd2cc84679b4d4d1f100051fb15.pdf (accessed on 1 August 2019).
  22. Khodaei, A. Resiliency-oriented microgrid optimal scheduling. IEEE Trans. Smart Grid 2014, 5, 1584–1591. [Google Scholar] [CrossRef]
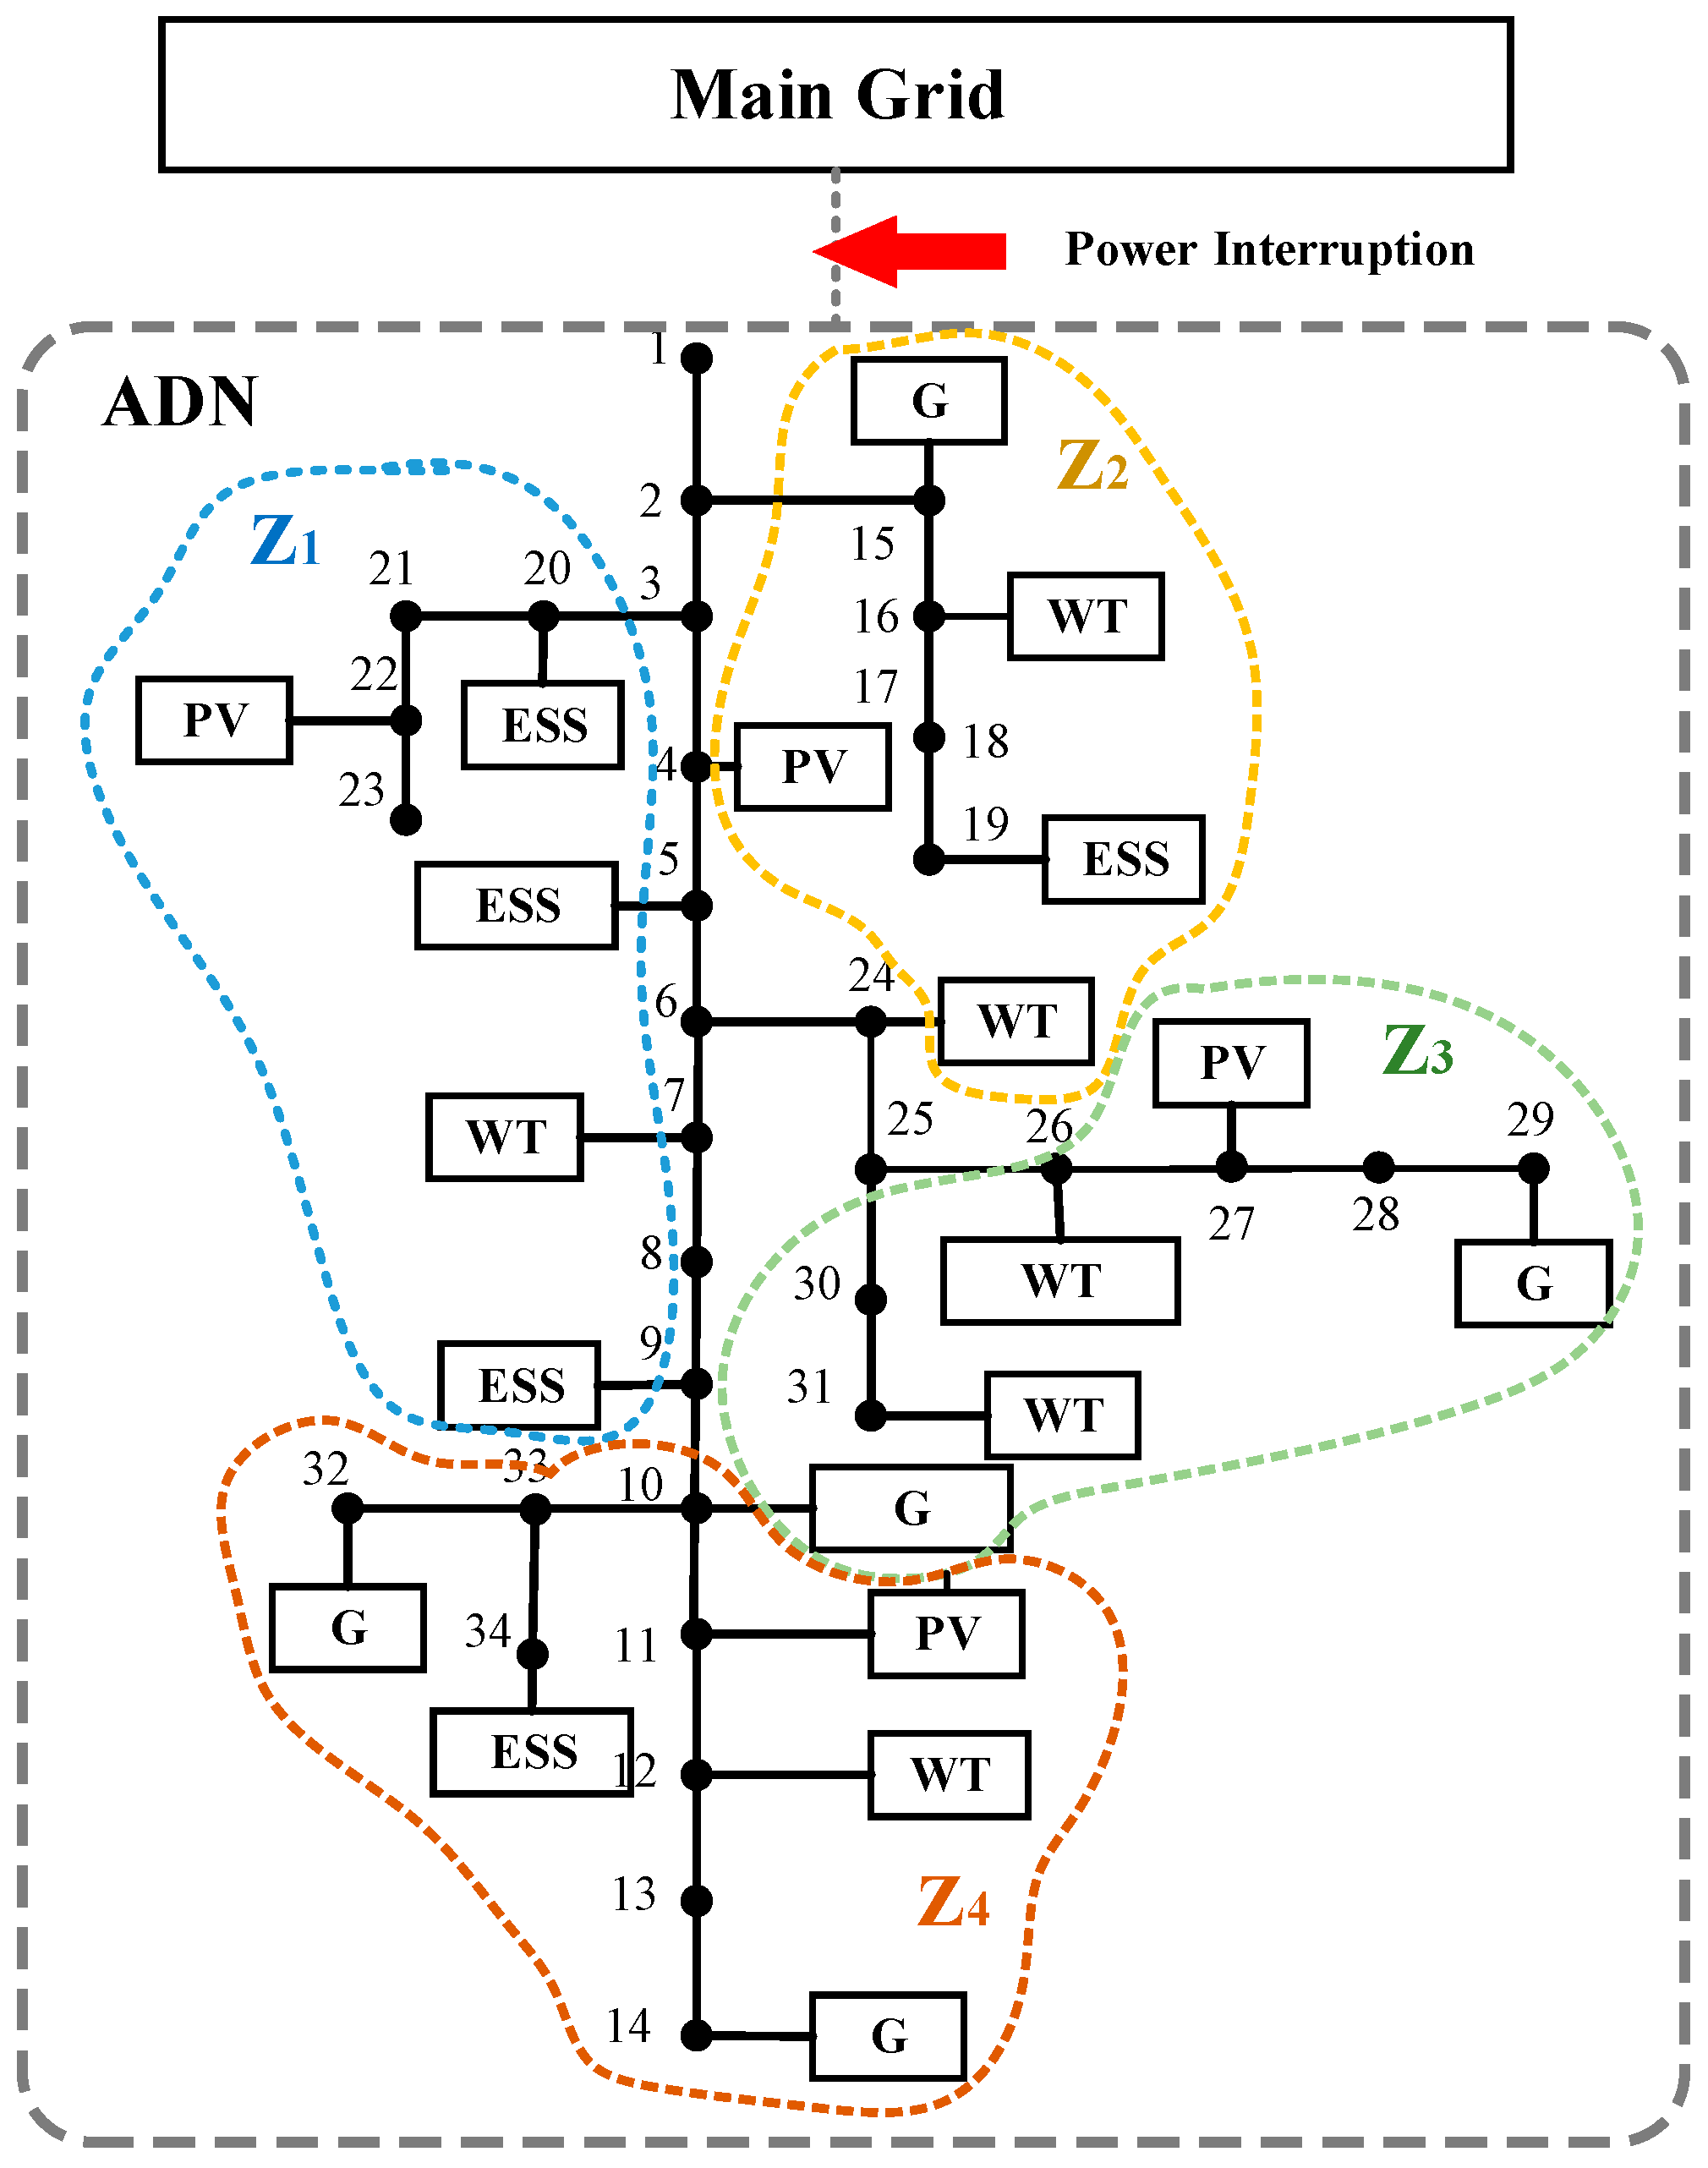
Figure 1. Two-stage controlled distributed energy resources (DER) integrated active distribution network (ADN) model.
Energies 12 03380 g001
Figure 2. System operation state over time.
Energies 12 03380 g002
Figure 3. Processing flow of non-dominated sorting genetic algorithm II (NSGA-II).
Energies 12 03380 g003
Figure 4. Structure of modified IEEE 34-node system.
Energies 12 03380 g004
Figure 5. (a) The fluctuated curve of photovoltaic (PV) on Node-4; (b) The fluctuated curve of wind turbines (WT) on Node-7; (c) The fluctuated curve of total electric load demand.
Energies 12 03380 g005
Figure 6. The three-dimensional Pareto surface of the proposed optimal strategy.
Energies 12 03380 g006
Figure 7. The optimal results of resilience.
Energies 12 03380 g007
Figure 8. (a) The relationship between resilience and cost based on the cross-section of the Pareto surface; (b) the relationship between resilience and pollutant emission based on the cross-section of the Pareto surface.
Energies 12 03380 g008
Figure 9. The output of traditional generations and storage units.
Energies 12 03380 g009
Table 1. The capacity parameter of distributed energy resources (DER) unit.
Node NumberGeneration TypeRated Capacity
4PV1.8 MW
5ESS1.5 MW·h
7WT3.5 MW
9ESS1.5 MW·h
10G3 MW
11PV1.25 MW
12ESS1.5 MW·h
14G3 MW
15G3 MW
16WT3 MW
19ESS1.5 MW·h
20ESS1.5 MW·h
22PV2 MW
24WT4.5 MW
26WT2.5 MW
27PV1.5 MW
29G3 MW
31WT3.5 MW
32G3 MW
34ESS2MW·h
Table 2. Main parameters of the controllable sources in case.
GESS
P G min = 0.3   MW P e s c h , min = 0.25   MW
P G max = 3   MW P e s c h , max = 1.5   MW
Δ P g R D = 0.6   MW / h P e s d c h , min = 0.25   MW
Δ P g R U = 0.9   MW / h P e s d c h , max = 1.5   MW

