Article

Modeling and Validation of an Electrohydraulic Power Take-Off System for a Portable Wave Energy Convertor with Compressed Energy Storage

1
Mechanical Engineering Department, Dalian Maritime University, Dalian 116026, China
2
Liaoning Key Laboratory on Rescue and Salvage Engineering, Dalian Maritime University, Dalian 116026, China
*
Author to whom correspondence should be addressed.
Energies 2019, 12(17), 3378; https://doi.org/10.3390/en12173378
Submission received: 9 May 2019 / Revised: 29 August 2019 / Accepted: 29 August 2019 / Published: 2 September 2019
(This article belongs to the Special Issue Wave Energy Conversion)

Abstract

:
Small-scale, portable generation of electricity from ocean waves provides a versatile solution to power the ocean sensors network, in addition to the traditional large-scale wave energy conversion facilities. However, one issue of small-scale wave energy convertor (WEC) is the low capturable power density, challenging the design of the efficient power take-off (PTO) system. To tackle this challenge, in this paper, an electrohydraulic PTO system with compressed energy storage was proposed to boost output power of a portable WEC. Lumped-parameter kinematics and dynamics of the four-bar mechanism, the fluid dynamics of the digital fluid power circuit, and the mechanical and volumetric power losses were modeled and experimentally validated. Initial test results of the 0.64 m2 footprint prototype showed that the inclusion of storage improved the averaged electric power output over 40 times compared to the traditional architecture, and the proposed device can deliver up to 122 W at peaks.

1. Introduction

Oceans on earth are enormous bodies with rich renewable resources. As interests in ocean sensing continue to grow, e.g., building an ocean sensing array composed of smart surface or subsea beacons, etc., provisions of electrical power for the distributed sensors’ network becomes a necessity. Adjacent to several oceans, China has a long coastline and is abundant in wave energy reserves, whose mean power is estimated to be over 12 gigawatts; even in the less wave energy dense regions, such as Liaoning Province in the far north, the annual mean wave height is still around 0.4 m [1]. Electricity generation from the heaving motion of the waves is clean and sustainable, and a viable solution to long-term maritime operations [2]. One kind of device that achieves the function is a wave energy convertor (WEC). A typical WEC includes a buoy that draws in the power from the motion of the oscillating wave, and a power take-off (PTO) system that converts it into electrical power [2,3]. Thus, the performance depends on both the buoy hydrodynamics and the energy conversion processes. As a result, in the design of efficient WECs, the two major approaches are either through the optimization of the fluid-structure interaction between the wave and the buoy, or through the PTO design. The former often employs tools such as computational fluid dynamics (CFD) or experiments, and the goals are to improve the efficiency of the buoy responding to the wave motion [4,5,6,7]. The latter usually focuses on improving the PTO’s architectural features, such as the traditional single or multiple-step conversion types [8,9,10,11,12,13,14,15,16,17,18]. Single step conversion usually requires a linear electric generator, the advantage of which, is that the direct conversion eliminates the inter-step losses of a multiple-step conversion system [8]. However, due to the uncertainty of wave conditions during a short period in a region, contrasting with the stable year-round mean wave power, it is difficult to maintain consistent performance. To generate electricity more stably, multiple-step conversion WECs are developed. In such systems, most PTOs would employ a rotary electric generator, driven mechanically [9,10,11], pneumatically [12], or hydraulically [13,14]. Though the overall efficiency could be offset by the increased number of energy conversion steps, the architecture could utilize more complicated energy conversion schemes, such as multiple connected bodies to resonate to a particular band of wave frequencies [11,15], or the accumulators in hydraulic or pneumatic PTOs to absorb excessive pressure fluctuations for more consistent power output [13]. For this reason, traditional large-scale wave energy conversion facilities are often of multistage design [16,17,18]. However, since centralized wave energy conversion facilities are usually permanently deployed near shore [16,17] or require certain mooring equipment [18], the traditional large-scale WECs lack the ability of redeployment. Additionally, mitigating line losses could be a challenging engineering task for the long transmission distances (in the magnitude of several hundred kilometers) between the sensors and power hub. In contrast, distributed power generation by small-scale WECs could offer more flexibility through onsite power generation with tunable transmission losses [19]. Nonetheless, a major drawback of small-scale WECs is the low power output (only a few Watts), which is an intrinsic limitation, since the capacity of the wave power absorbable by the WEC is directly governed by the projected area of the buoy on the ocean surface [20].
To improve the limited output power of a small-scale WEC, this paper explores the feasibility of a new electrohydraulic PTO design with energy storage to achieve greater power output. An illustration of the proposed WEC is shown in Figure 1. The first stage features a hinged twin-board design: An inverted four-bar double slider mechanism connects the two hinged boards, which captures the heaving motion of the wave to drive a single cylinder hydraulic piston pump. The second stage utilizes digital fluid power control. First, the taken-off wave kinetic energy is converted into stored compressed energy in a bladder-type accumulator; then a digital on-off valve controls the release of the energy storage of the accumulator to generate electricity through a hydraulic motor coupled to a rotary electric generator. The choice of the proposed electrohydraulic PTO system with energy storage capability enables, in particular, a more compact system [21].
The goal of this paper is to model and validate the key dynamics of the proposed electrohydraulic PTO system, and study the effects of accumulator pre-charged pressure on system performance. The paper is organized as follows. In Section 2, the design of the proposed WEC is demonstrated, and the lumped dynamic models of the mechanism, the fluid power system, and the mechanical and volumetric losses are established. In Section 3, a numerical solution to the dynamics of the digital hydraulic circuit is proposed. In Section 4, an experimental testbed and test procedures of the proposed WEC are demonstrated. In Section 5, the derived PTO models are validated, and effects of key design parameters are discussed.

2. Mathematical Models

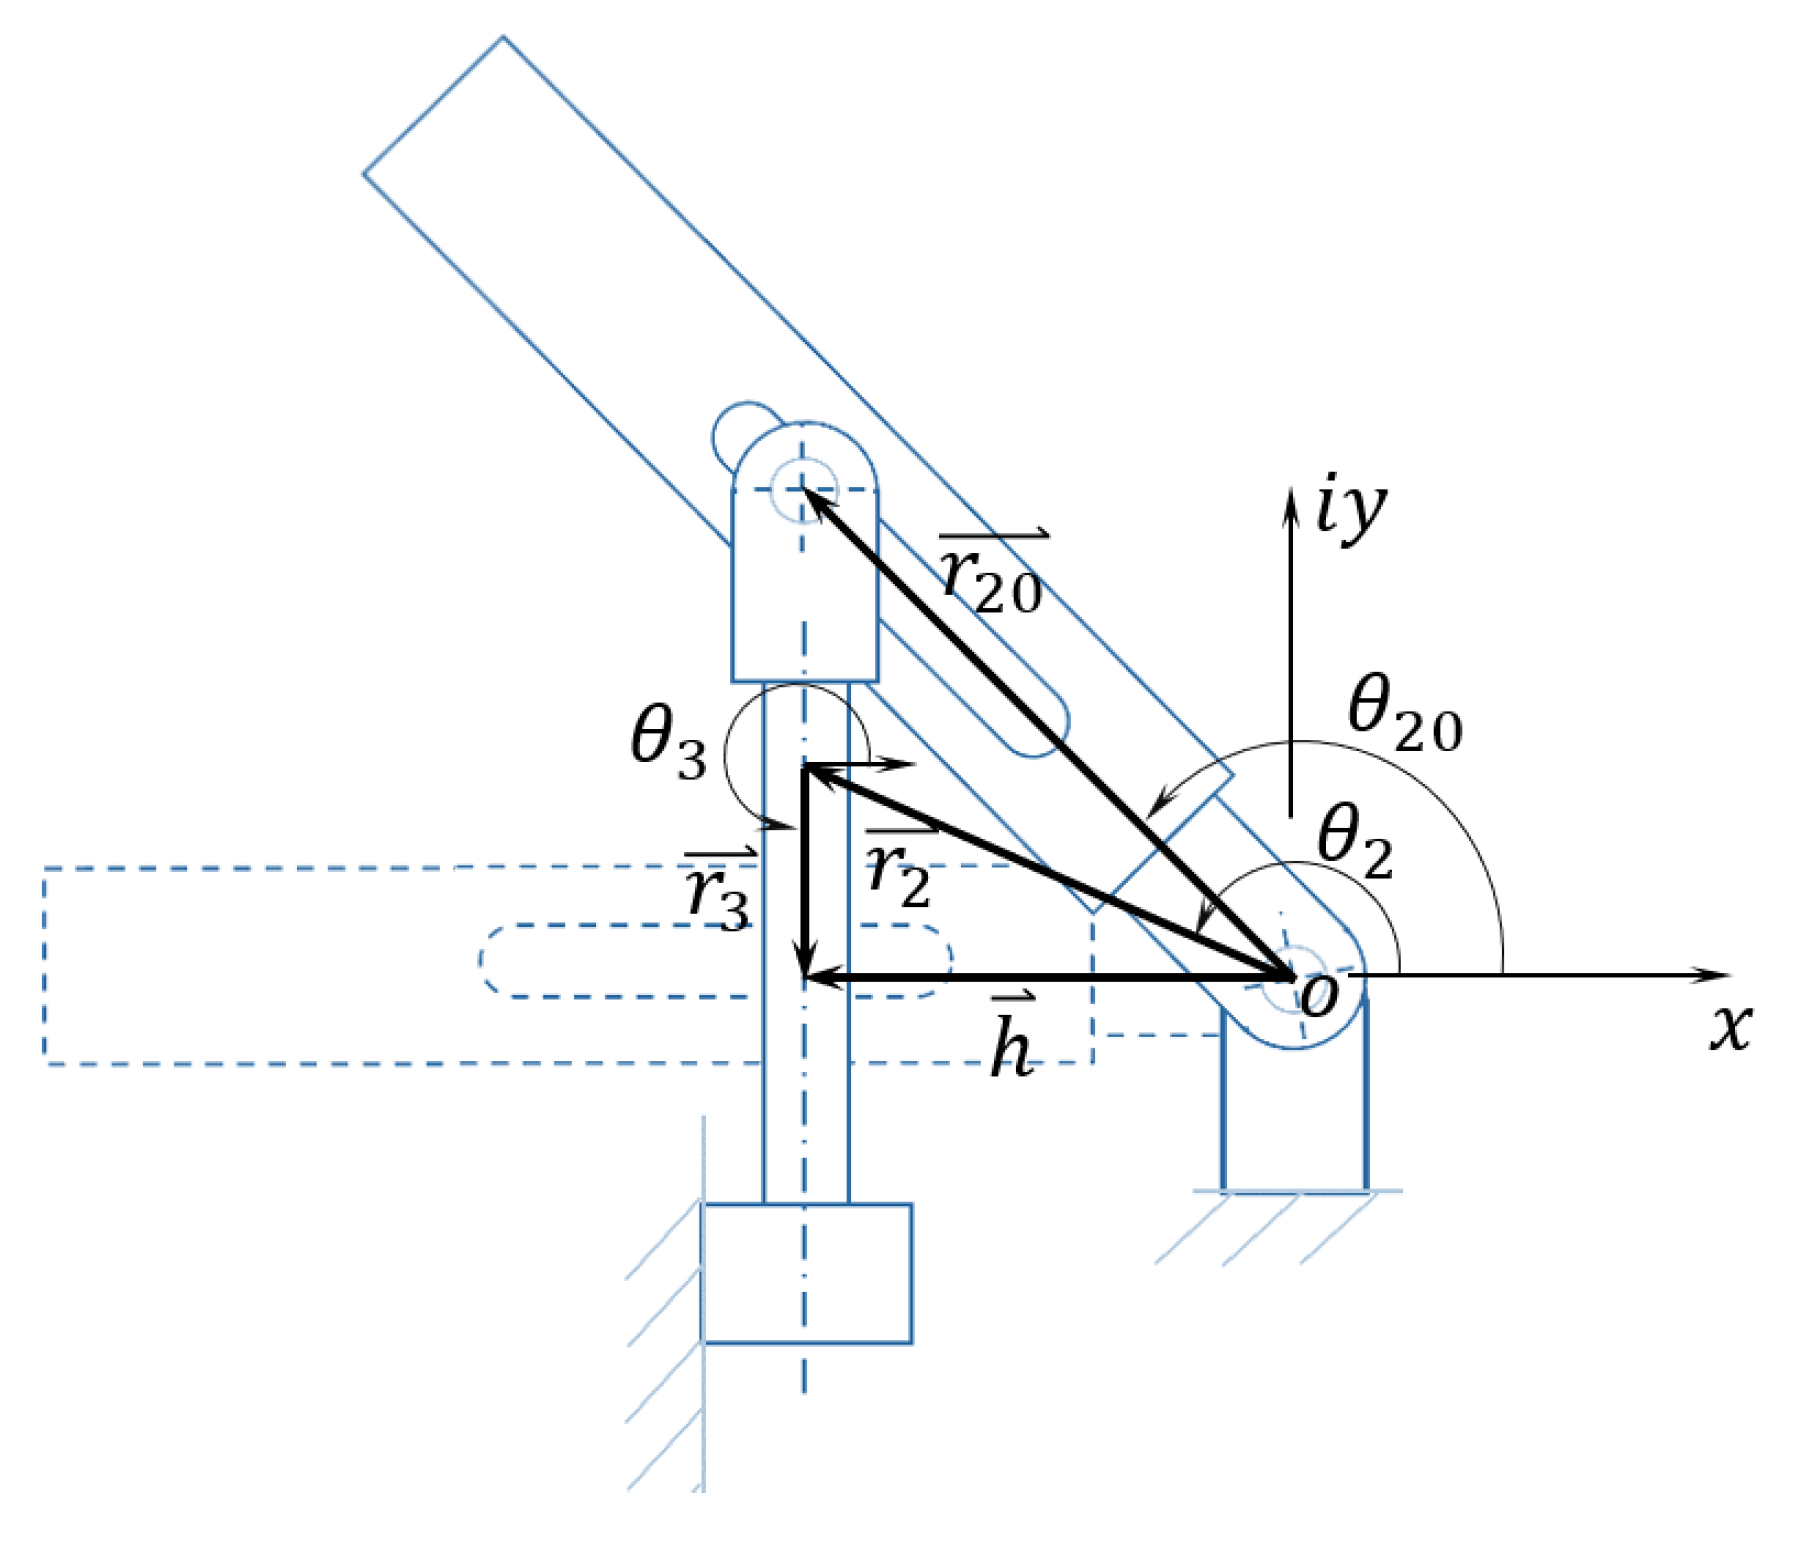
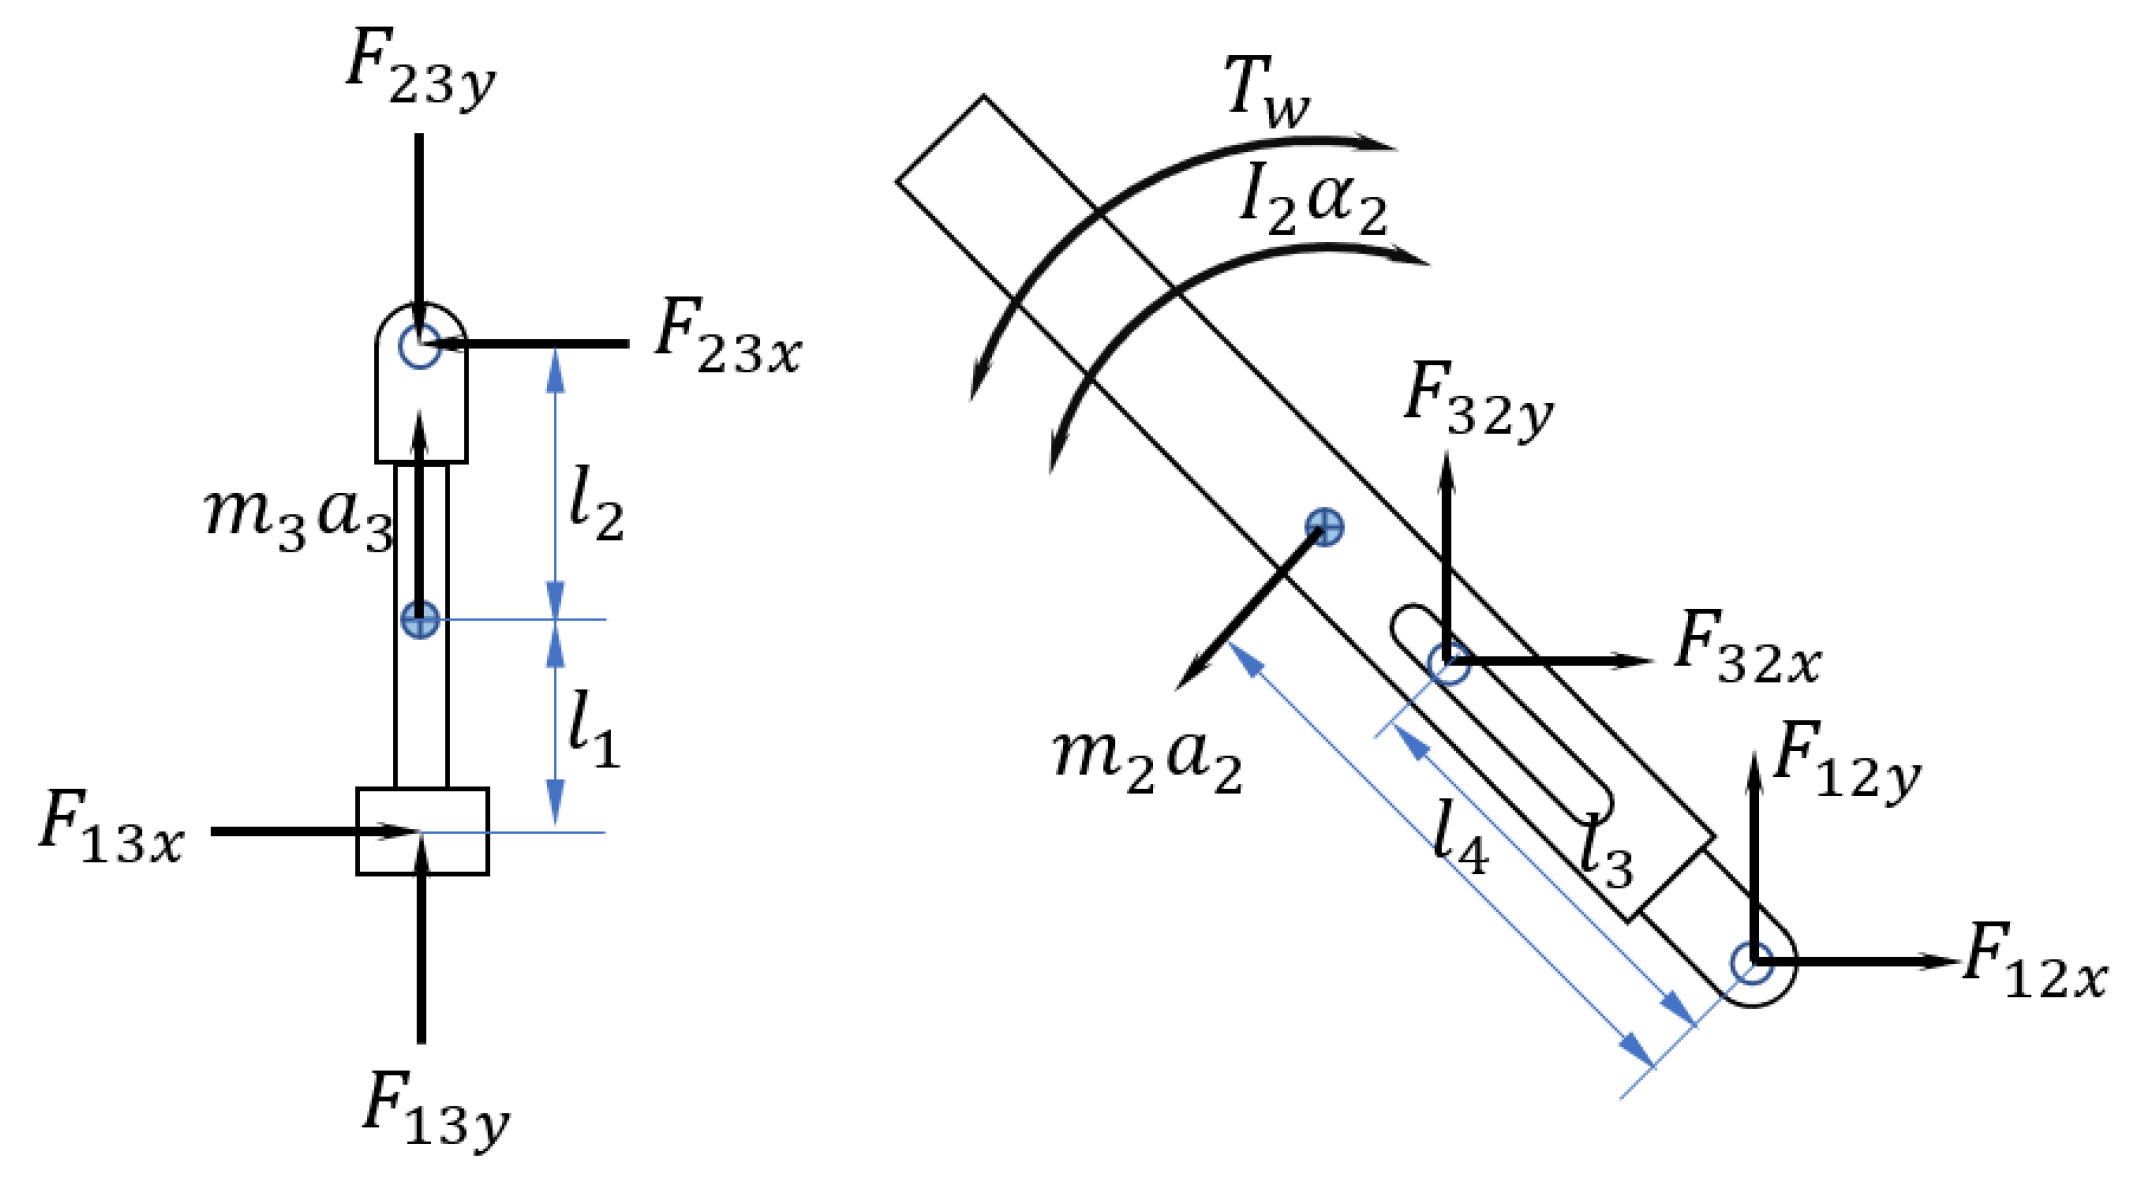
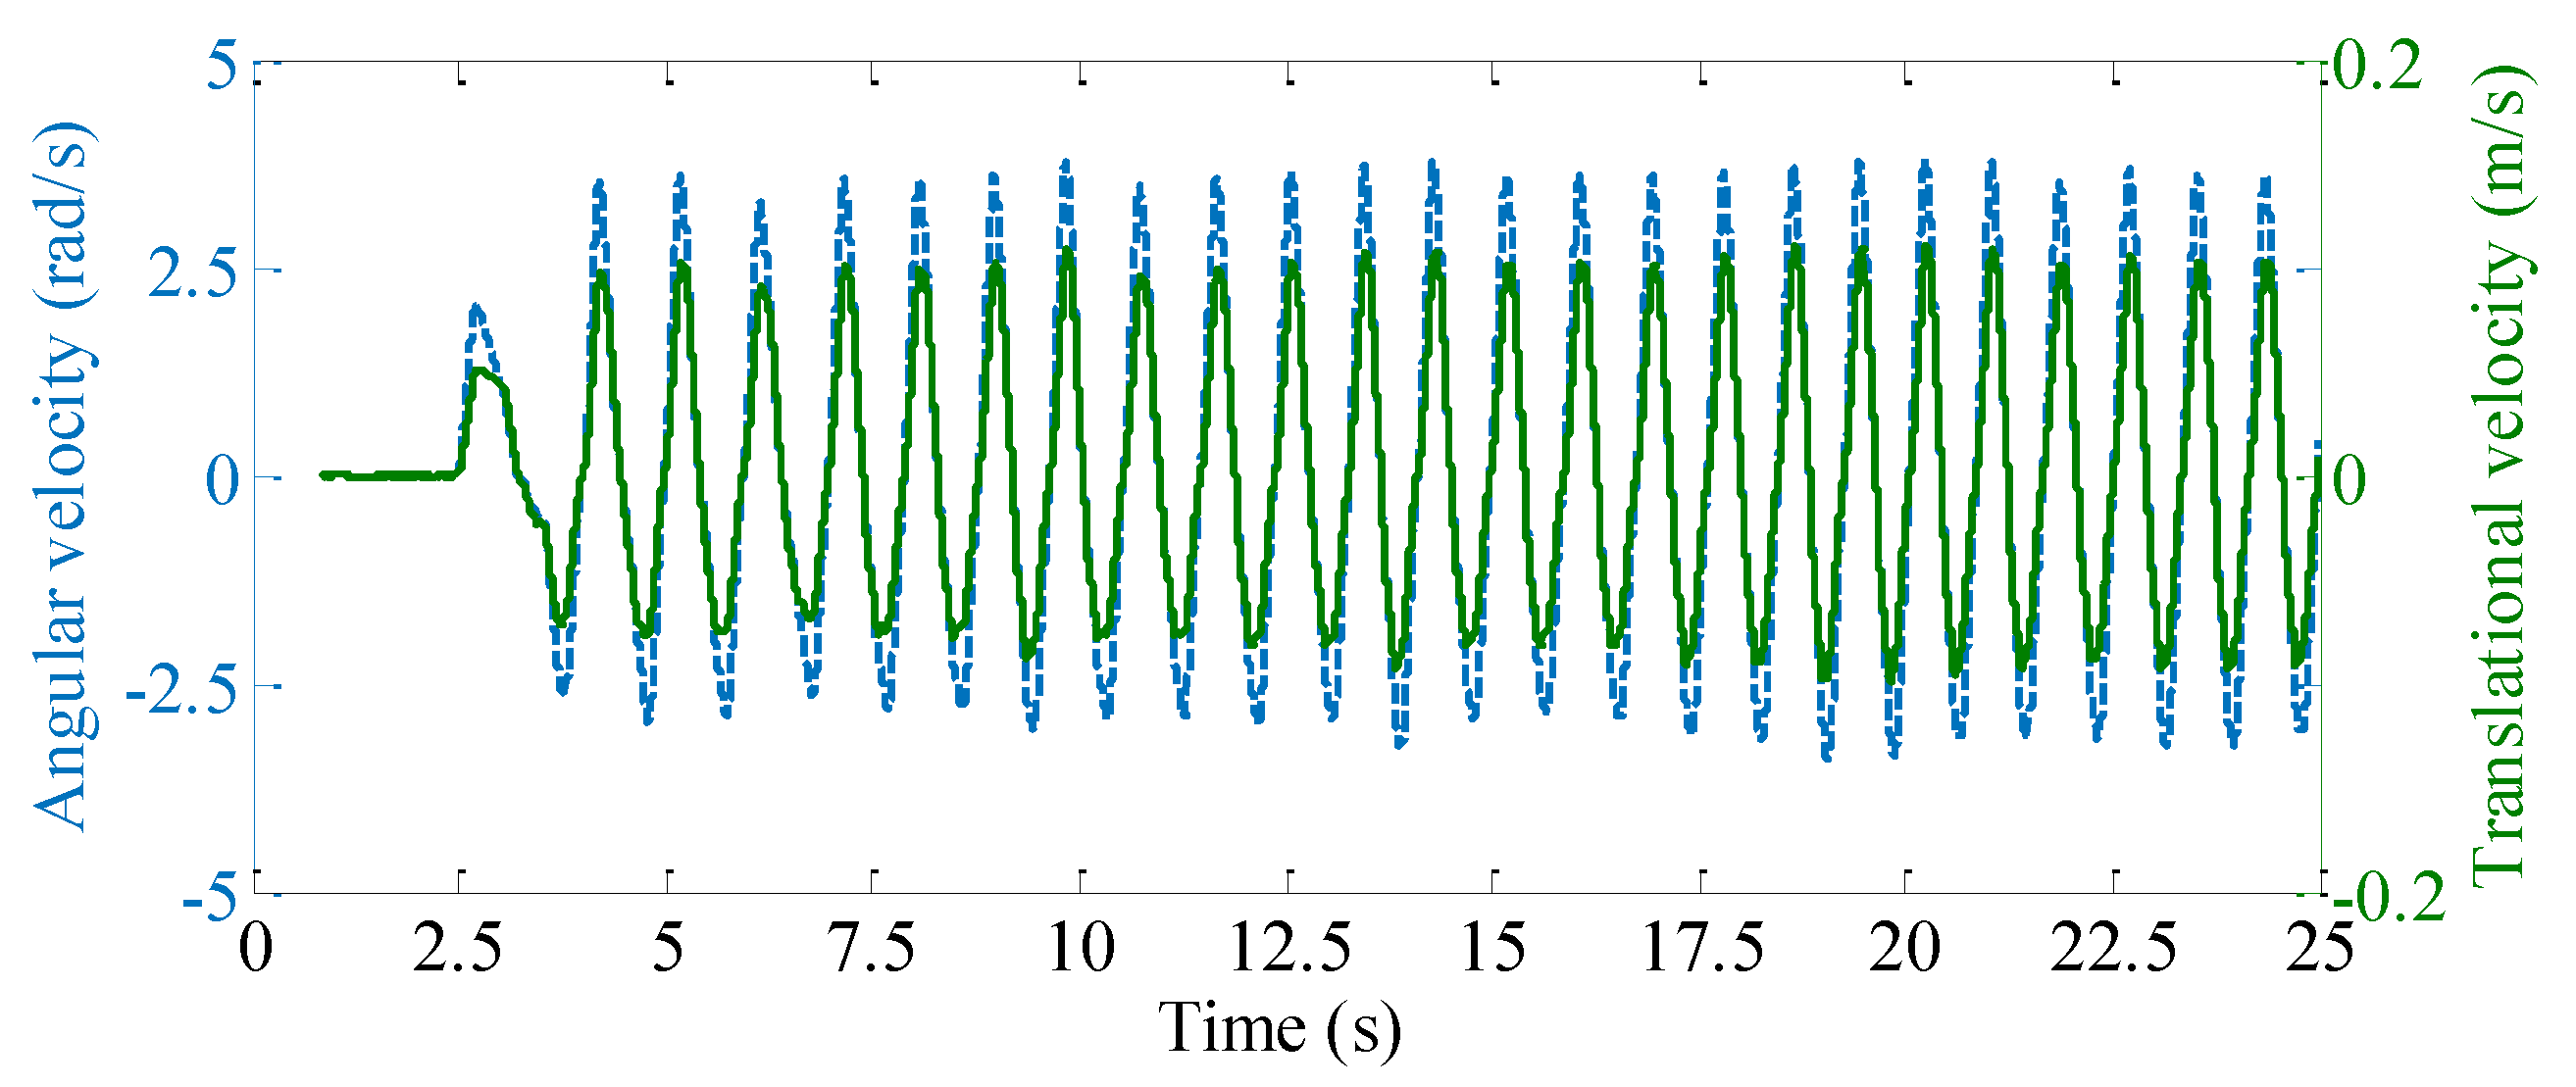
2.1. Dynamics of the Linkage Wave Follower

The proposed hinged twin-board WEC is assumed to react to the heaving motion of the wave, resulting in an oscillating angle between the two boards about the hinge. A four-bar double-slider mechanism is used to convert the wave activated rocking motion of the input link (i.e., torque and angular velocity) into the motion of the piston pump (i.e., force and linear velocity), visualized in Figure 2.
Assuming all mechanical components are rigid bodies, the motion of the piston can be simply derived from the vector equality in a complex coordinate system as follows:
r 3 = h r 2
where r 3 = r 3 e i θ 3 is the vector defining piston displacement, h is the constant horizontal vector pointing from the revolute joint to the piston axis, and r 2 = r 2 e i θ 2 is the rocker link vector, rotated and retracted from r 20 , the vector denoting the maximum liftable position of the rocker link.
The velocity and acceleration characteristics of the wave absorber linkage can be found through temporal derivation of the vector loop equation. Since the distance and orientation of the relative position between the rocker pivot and piston axis are constant; i.e., d h / d t = 0 . Thus, the velocity vector loop is found by
r 3 ˙ = r 2 ˙ = r 2 ˙ e i θ 2 r 2 ω 2 e i θ 2 i
By performing one more derivation with respect to time, the acceleration relationship is obtained
r 3 ¨ = r 2 ¨ e i θ 2 2 r 2 ˙ ω 2 e i θ 2 i + r 2 α 2 e i θ 2 i + r 2 ω 2 2 e i θ 2
The buoy (Link 2) of the mechanism is activated by the heaving motion of the wave, resulting in relative revolute motion ( θ 2 ˙ ) about the pivot joint o :
θ 2 ˙ = r 2 ˙
where the definition of the angle is r 2 = im ( r 2 ) / re ( r 2 ) .
Similarly, the angular acceleration of the buoy is θ 2 ¨ = r 2 ¨ .
The dynamics of the mechanism is solved by constructing the free body diagrams and analyzing all the forces and moments in every link, as in Figure 3. Applying d’Alembert’s principle [22] and balancing forces on the horizontal and vertical axes and torques on links 2 and 3, the matrix defining the dynamics of the mechanism can be obtained as:
[ m 2 a 2 x m 2 a 2 y I 3 α 3 m 3 a 3 x m 3 a 3 y + F 13 y I 2 α 2 + m 2 a 2 r 4 ] = [ 1 0 1 0 0 0 0 1 0 1 0 0 0 0 l 2 0 l 1 0 0 0 1 0 1 0 0 0 0 1 0 0 0 0 l 3 sin θ 2 l 3 cos θ 2 0 1 ] [ F 12 x F 12 y F 23 x F 23 y F 13 x T w ]
where F 13 y is an input, calculated from the piston cylinder pressure (which will be discussed in Section 3) multiplied by the piston area, I s are the rotary moments of inertia, for which subscript denotes the link number, and l s are the normal distances of force about the revolution center. By applying matrix inversion to Equation (5), the reaction forces, [ F 12 x   F 12 y   F 23 x   F 23 y   F 13 x   T w ] 1 , can be resolved. The properties of the mechanism can be found in Table 1.

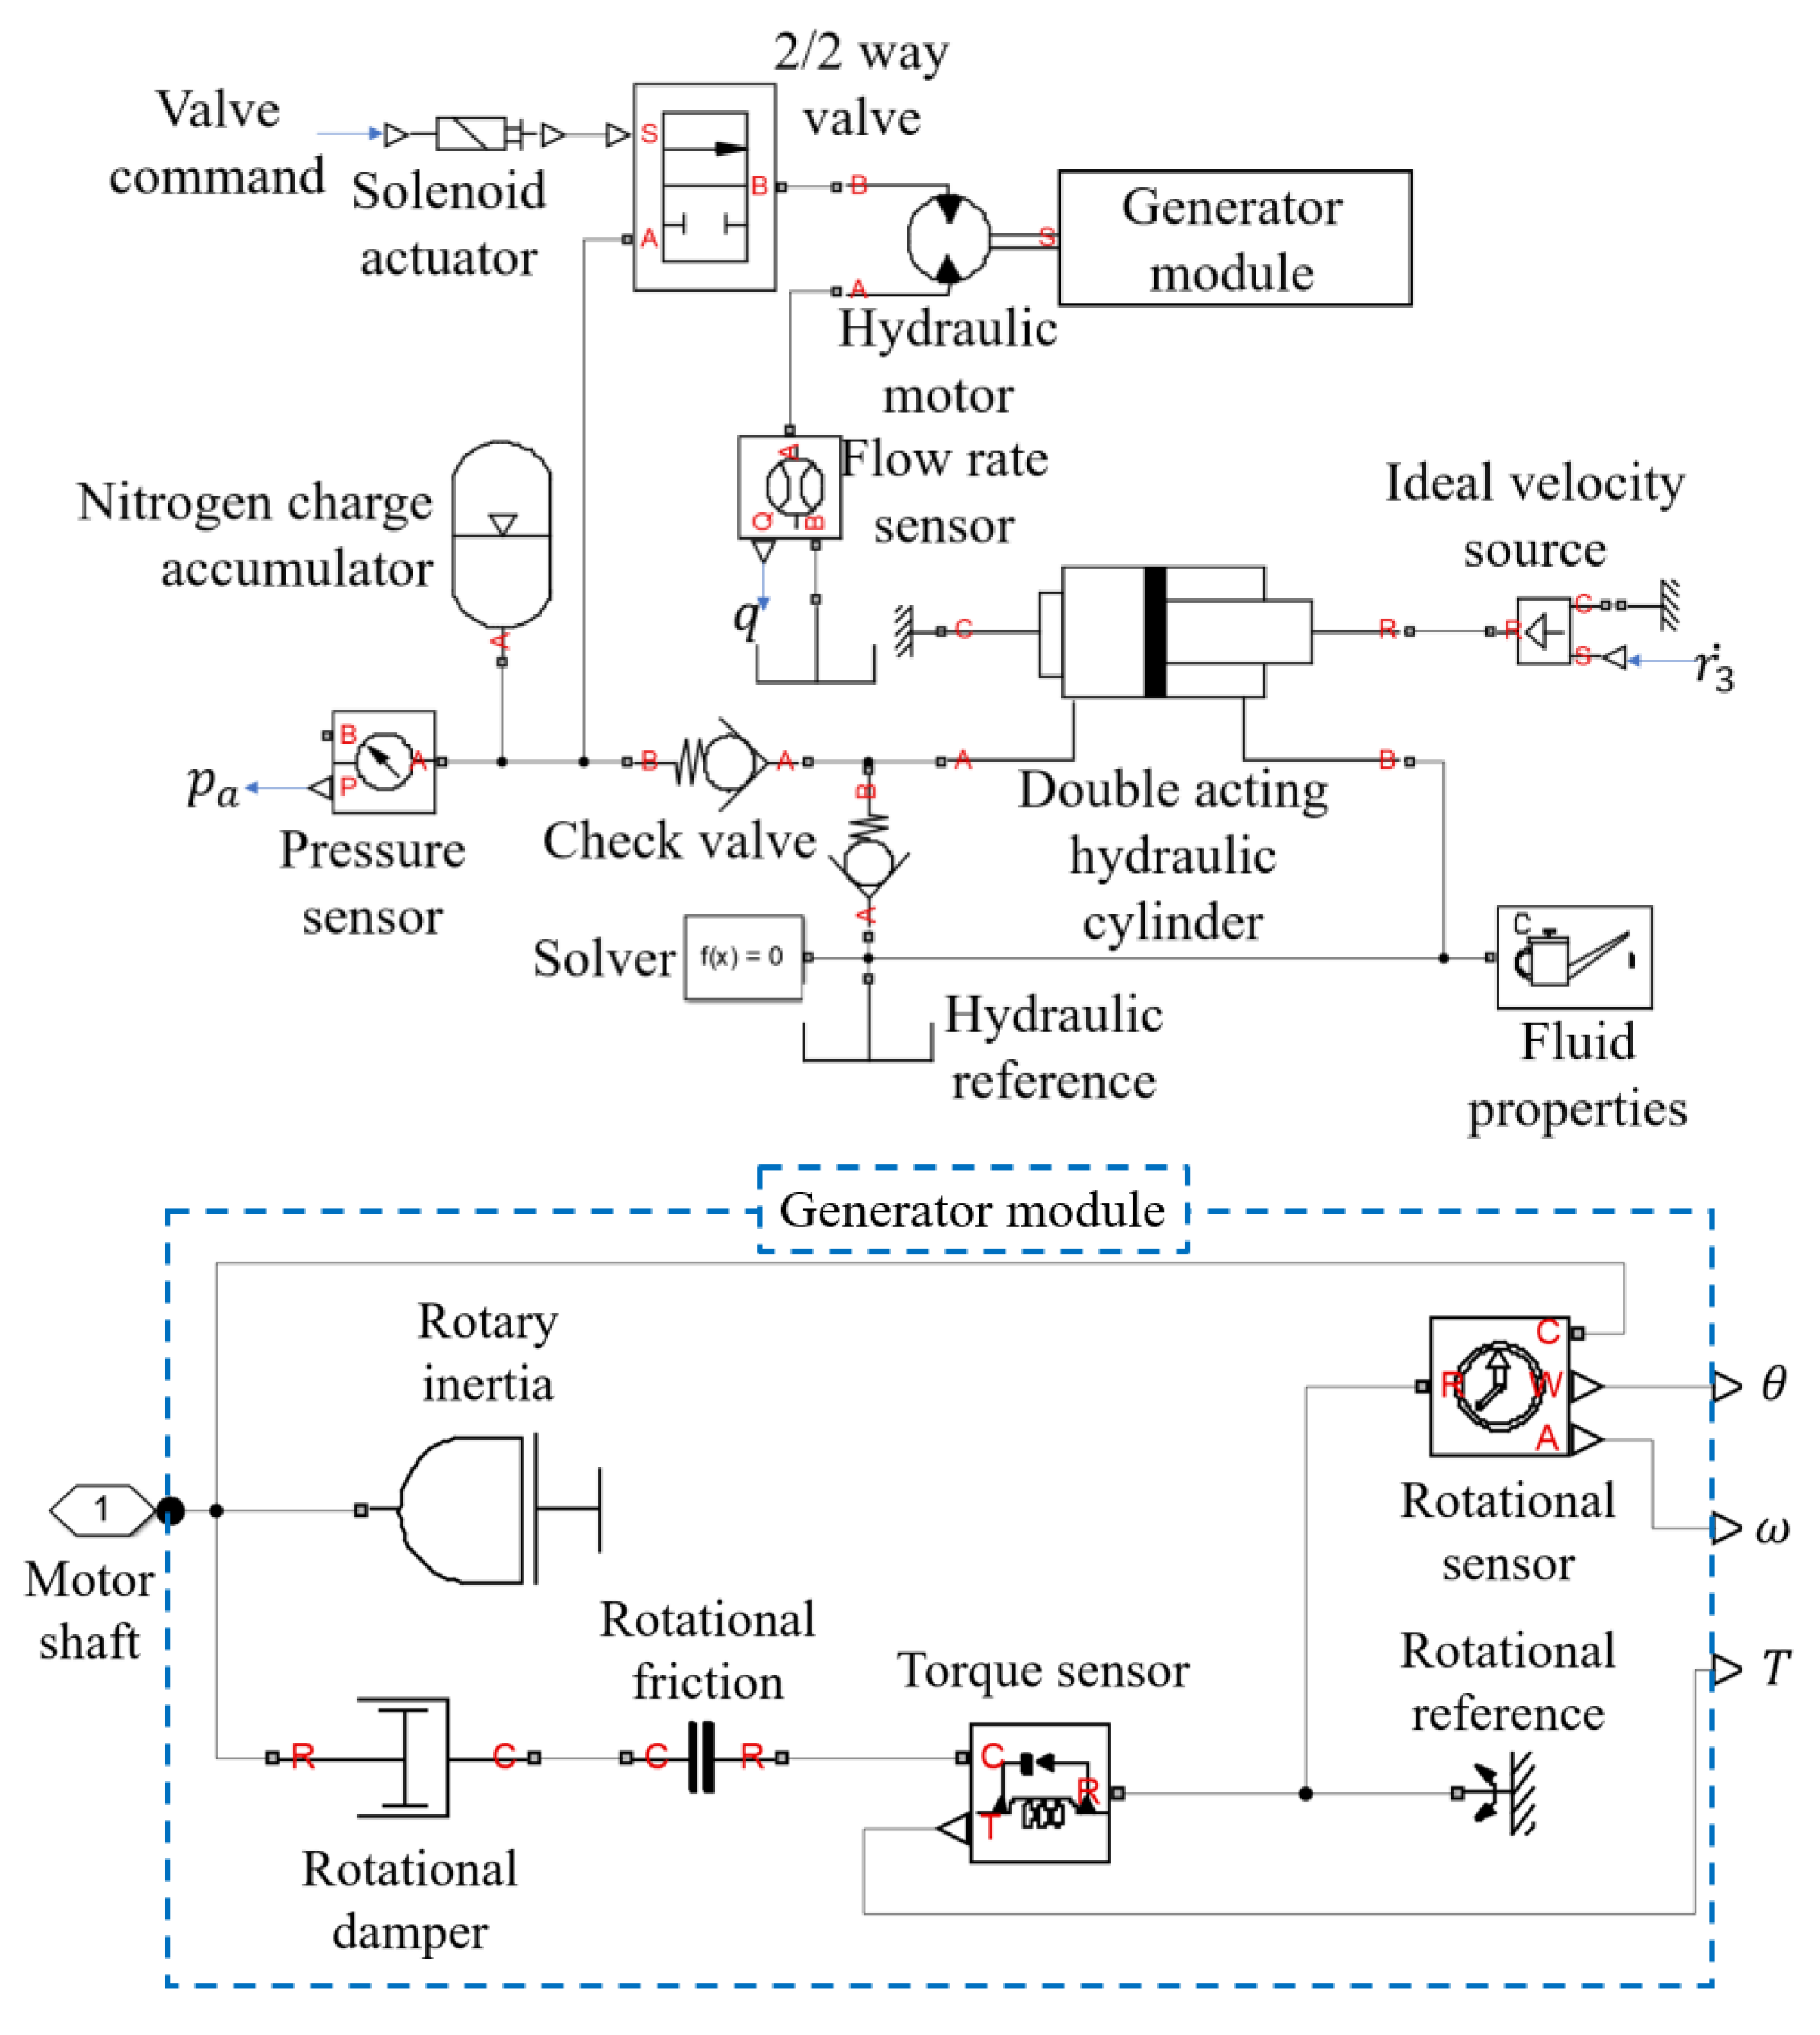
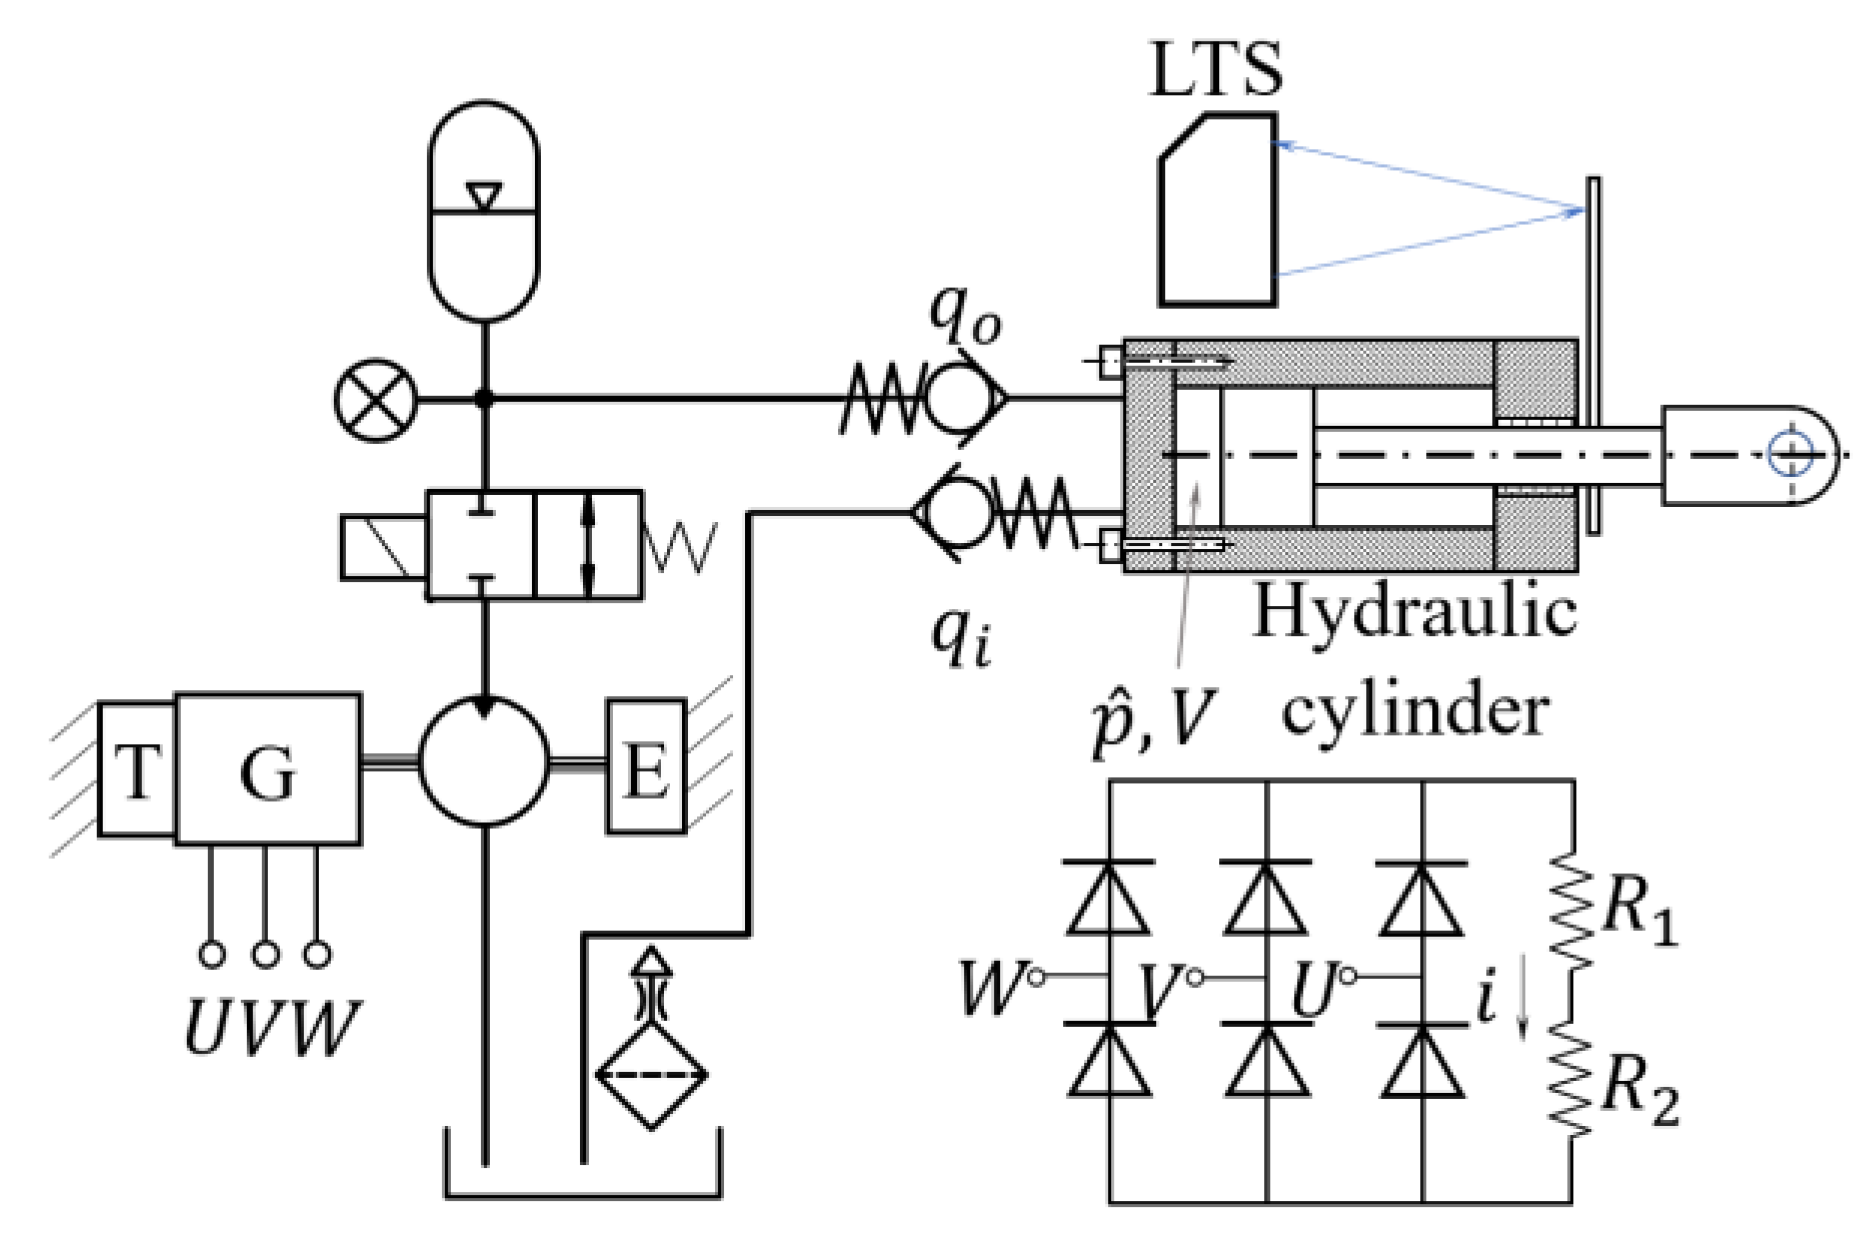
2.2. Dynamics of the Electrohydraulic PTO System

The pressure dynamics of the fluid power circuit are modeled based on the definition of the fluid bulk modulus ( β e ), the orifice flow equation ( q i , o ), the leakage due to valve clearance ( q l ), and check value dynamics ( q c ), shown below:
p ˙ = β e V ( V ˙ + q i , o + q l + q c )
where V is the volume of the fluid within a given control surface; i.e., the total volume of oil in the accumulator plus the volume in the manifold and hoses; the latter two are neglected as the accumulator volume dominates, and the effective bulk modulus ( β e ) of oil with entrained air can be modeled using the two-phase (air-oil) polytropic model [23,24].
The constitutive relationships between pressure and flow can be modeled traditionally using lumped parameter models, e.g., the discharge flow equation, so that the rate of volumetric flow is modeled to be proportional to the square root of pressure differential across the valve orifice, the valve open area, the density of fluid, and the parallel plates’ leakage, etc. [24,25]. Alternatively, the aforementioned V ˙ , q i , o , q l , and q c models can be constructed in a Simulink block diagram, as shown in Figure 4. Then, the dynamic pressure in Equation (6) can be solved.
In the simulation, a double acting hydraulic cylinder block with only one port used acts as the hydraulic cylinder, while the piston displacement information either comes from user-defined input or the measured data (details on setting up the experimental work are shown in the next section). Two ball-type check valve blocks are used to ensure the flow direction of the single cylinder piston pump is checked. A rotary inertia-damper-friction combination is used to mimic the dynamic performance of the electrical generator. A two-position-two-way (2/2-way) digital on-off valve is used to control the release of the compressed energy from the accumulator, following the external valve command signal ( u v ):
u v = { 1 i f   p a p s e t   o n 0 i f   p a p s e t   o f f
where p s e t   o n and p s e t   o f f are the two set pressure values to command the on-off valve to whether isolate or release the accumulator to the hydraulic motor. The simulation parameters can be found in Table 2.

2.3. Energy Storage and Power Output

Based on the proposed two-stage design, the output electric power of the PTO system can be expressed as
W E ˙ = η G ( ω r o t o r ) ( W P ˙ ( ω w a v e ) W F ˙ ( ω w a v e ) W H ˙ ( p ) )
where η G is the generator efficiency, which is an intrinsic property of the generator, determined by the rotor rotational frequency; and ω w a v e is the frequency of the wave. In this work, it is the frequency of the piston cylinder input. W P ˙ and W F ˙ represent the piston input and the mechanism friction power respectively; each is a function of the wave frequency. W H ˙ is the leakage loss at a given hydraulic circuit pressure. Obviously, for a higher electrical power output, one can increase W P ˙ , while keeping W F ˙ and W H ˙ low.
The friction work in the mechanism includes the translational and rotational pin friction in the joints:
W F ( ω w a v e ) = μ F 32 r 3 ˙ + T f 12 θ 2 ˙
where μ is the friction coefficient, F 32 is the force acting on the pin; T f 12 =   μ | F 12 | r p i n is the friction torque on a pin with radius of r p i n ; r 3 ˙ and θ 2 ˙ are solved from the kinematic relationships in Equations (2) and (4); and both F 12 and F 32 are the reaction forces solved from Equation (5).
The power of leakage loss is modelled as a simple parallel plate flow with hydrodynamic clearance:
W H ˙ ( p ) = C 1 p 2 ,
where C 1 =   B c 3 12 μ L is the lumped leakage coefficient. Derivation details can be found in Appendix A.
The piston input power is directly coupled to the wave frequency, and the average input power is governed by the pressure–volume (P–V) trajectory:
W P ˙ ( ω w a v e ) = p d v ˙
where d v = d r 3 A p , and A p is the area of the piston. A special case is that when the accumulator is storing compressible energy; i.e., when the 2/2-way digital valve is deenergized, allowing the compressed fluid to first be accumulated before being released at a later time. In this case, the input work can be simply calculated by integrating the P–V trajectory under adiabatic heat capacitance ratio of γ ( γ = 1.4 ), assuming the gas side of the accumulator follows the ideal gas law:
W P ˙ = V 0 V 1 p 0 ( V 0 ν ) γ d ν ˙ = 1 ( 1 γ ) Δ t ( p 1 V 1 p 0 V 0 )
Equation (12) shows that W P ˙ monotonically increases with the final pressure, p 1 . It is, therefore, obvious to increase the final pressure for a higher amount of stored energy. That way, during the electrical generation process, releasing the compressible potential energy from the accumulator through the activation of the on-off valve at a higher pressure than in normal operating conditions can increase the overall power output, which will be validated in the experiments displayed in Section 4. Though it is a linear relationship of final pressure with respect to W P ˙ , it is worth mentioning that in the design of economical fluid power components, the magnitude of pressure should be limited within 30 MPa, reconciling the material strength, weight, and cost.

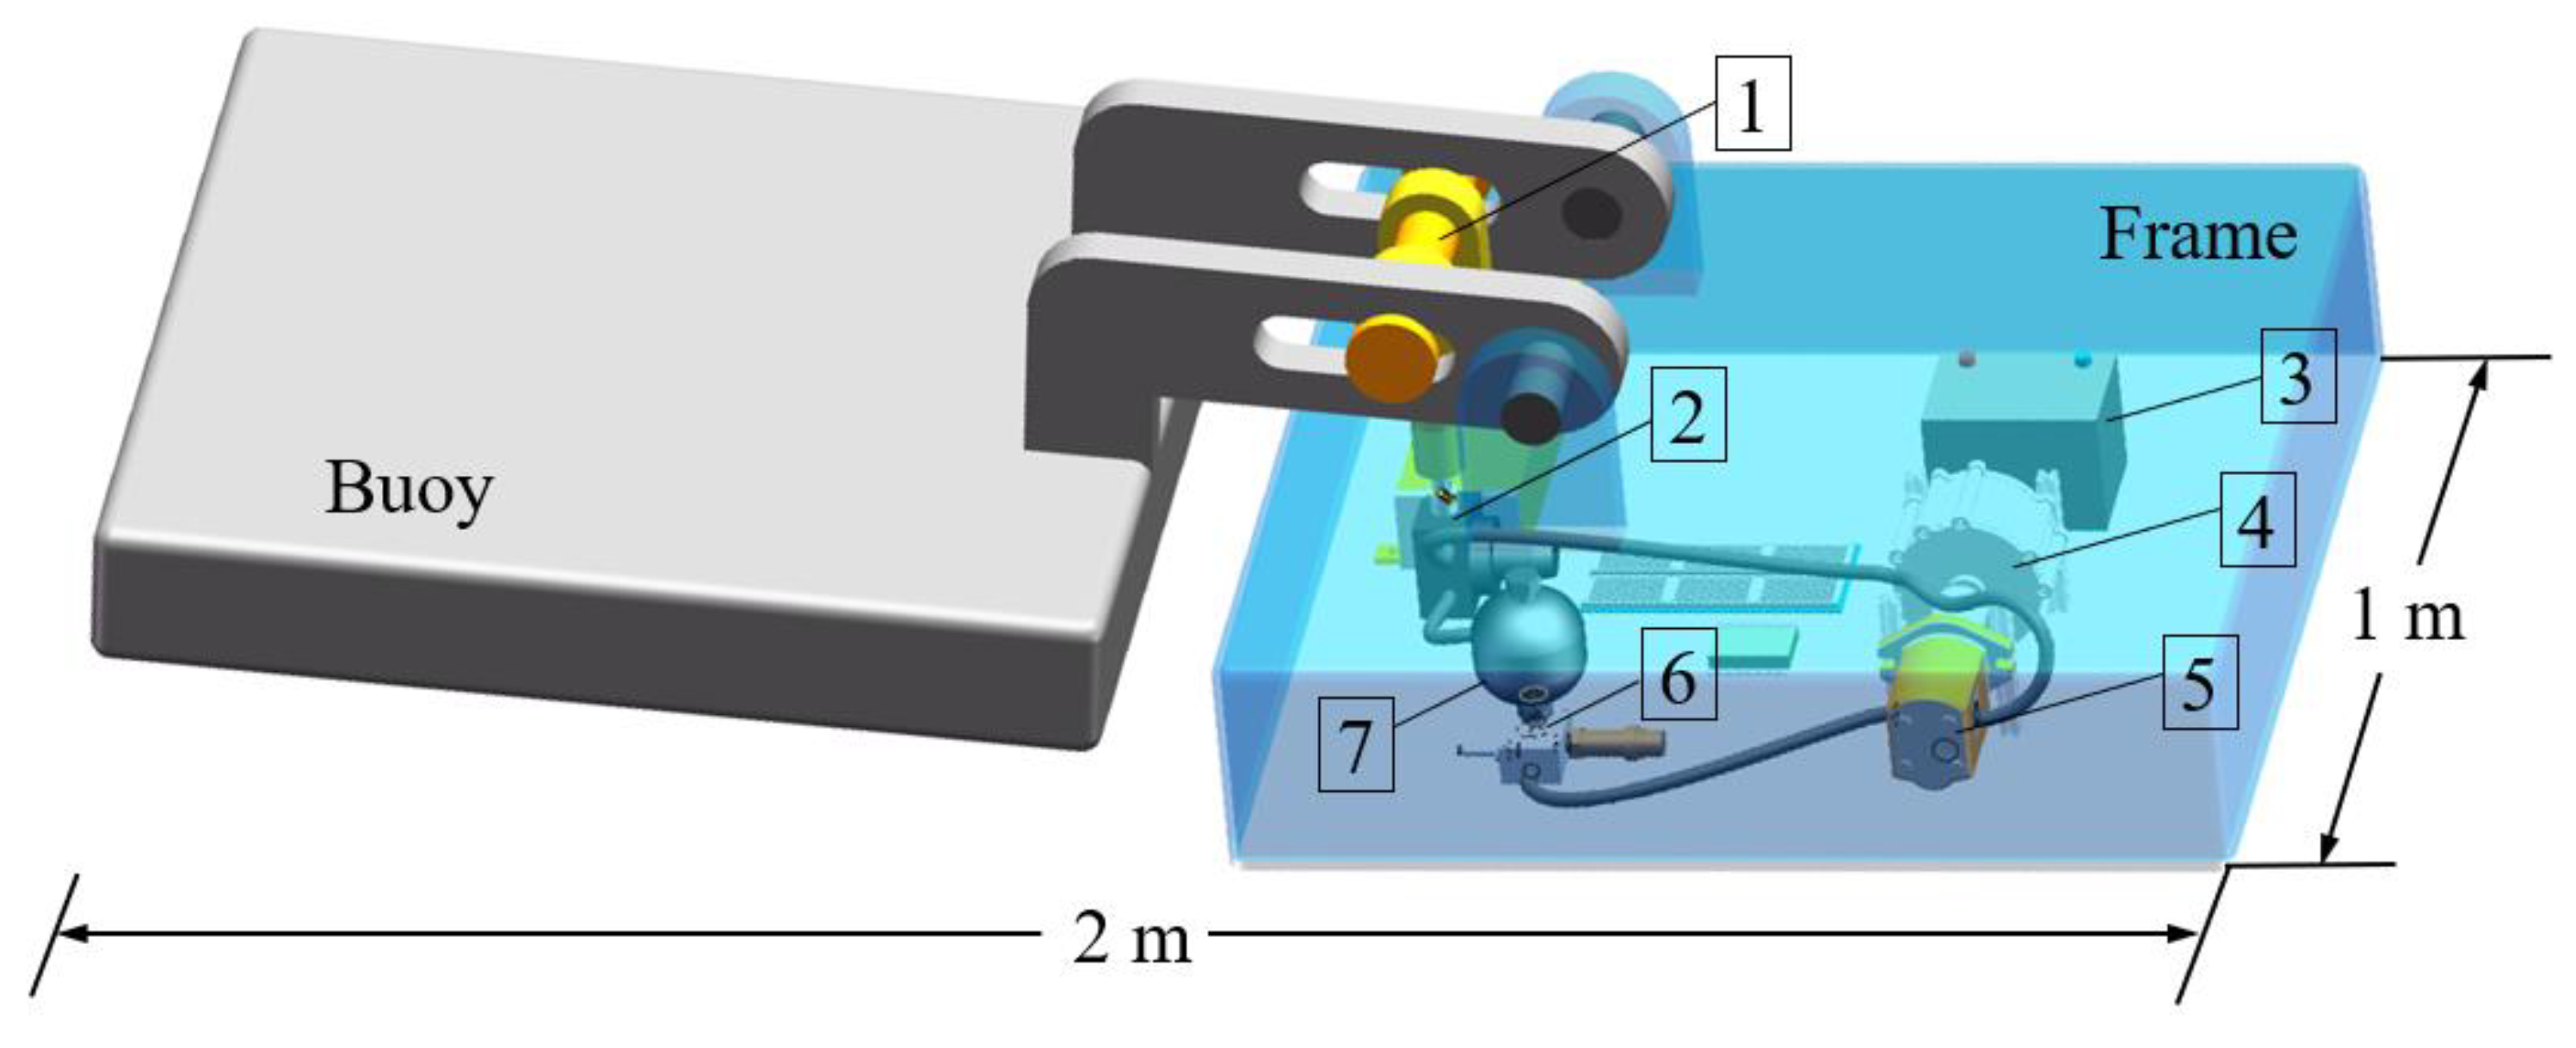
3. Experimental System
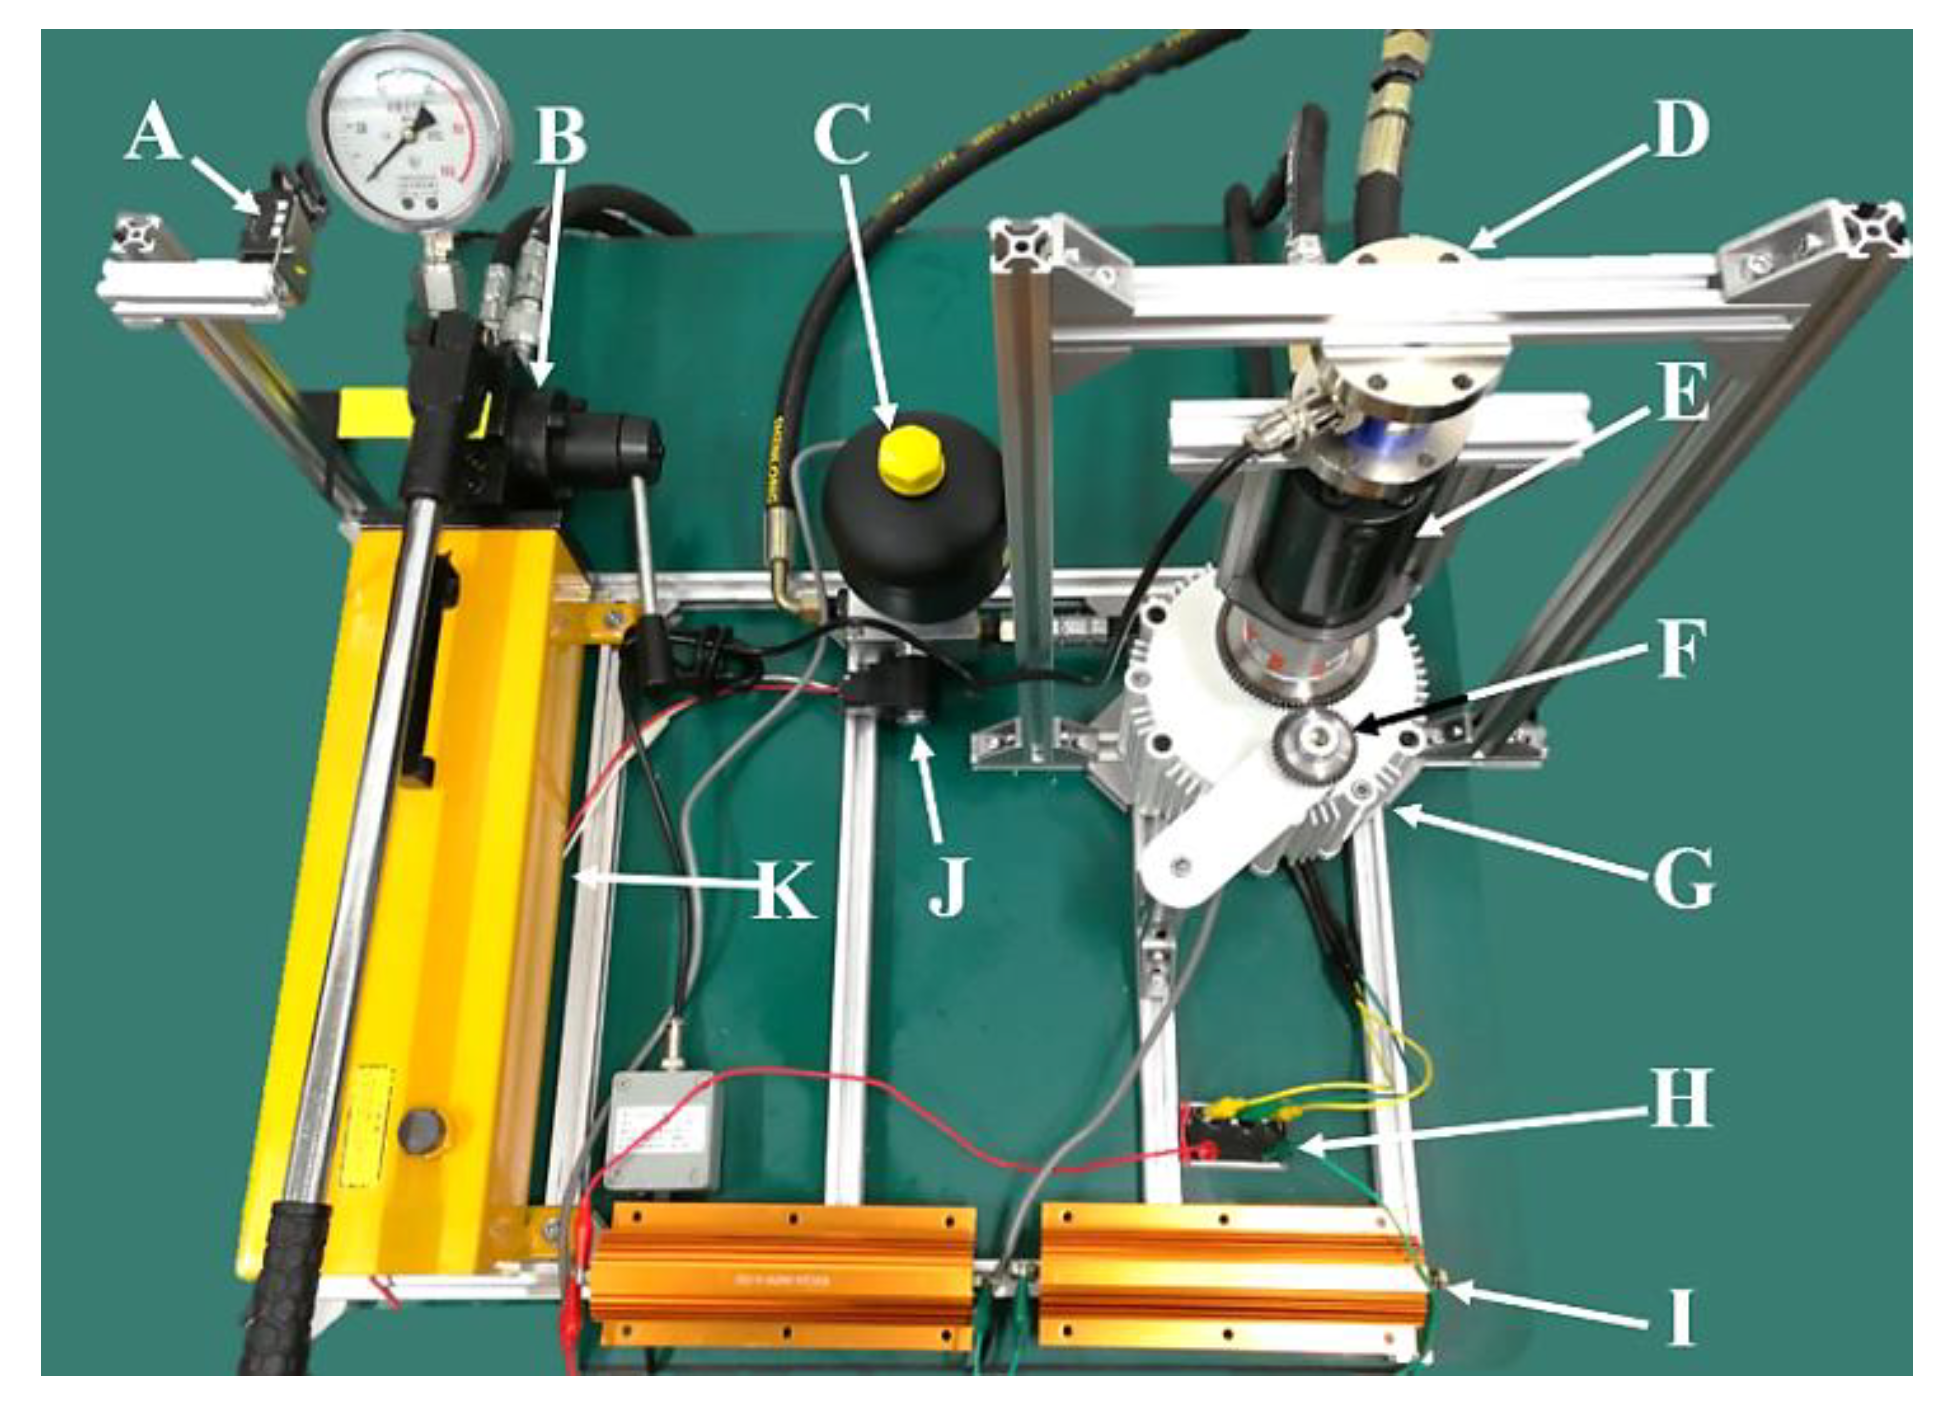
3.1. Testbed

The proposed electrohydraulic PTO system was designed and fabricated inhouse with a small footprint of 0.8 m by 0.8 m. The schematic and a photo of the testbed are shown in Figure 5 and Figure 6. The core components of the PTO are the inverted four-bar double slider mechanism, the electrohydraulic circuit, and the electronics that coverts the rotary motion of the hydraulic motor into direct current electric power through a generator. The heaving motion of the buoy was simulated with an input handle pushing and pulling the piston of the hydraulic cylinder. The goals of the test bed are to measure the displacement input of the rocker, the pressure of the accumulator, the torque and angular velocity of the hydraulic motor, and the electric output power of the system.
As shown in Figure 6, a manual pump is used to mimic the relative motion of the buoy to the frame of the WEC when reacting to surface wave. The displacement of the plunger is directly measured using a laser triangulation sensor (LTS). The pumped fluid travels through the valve block into the accumulator pre-charged with nitrogen gas, and the storage pressure is regulated through a 2/2-way on-off valve. A pressure transducer senses the pressure in the accumulator. When the valve energizes, the released high-pressure flow drives a gerotor hydraulic motor and a 3-phase electric generator. The generated three-phase alternating current is rectified by a full diode bridge, and the load is simulated by two load resistors, R 1 and R 1 , of whose resistance values are 0.1 Ω and 0.3 Ω, respectively. The accumulator pressure, the piston displacement, the angular velocity, the torque on the generator shaft, and the output voltage on the load resistors are sampled by a data acquisition system (National Instruments USB6009).

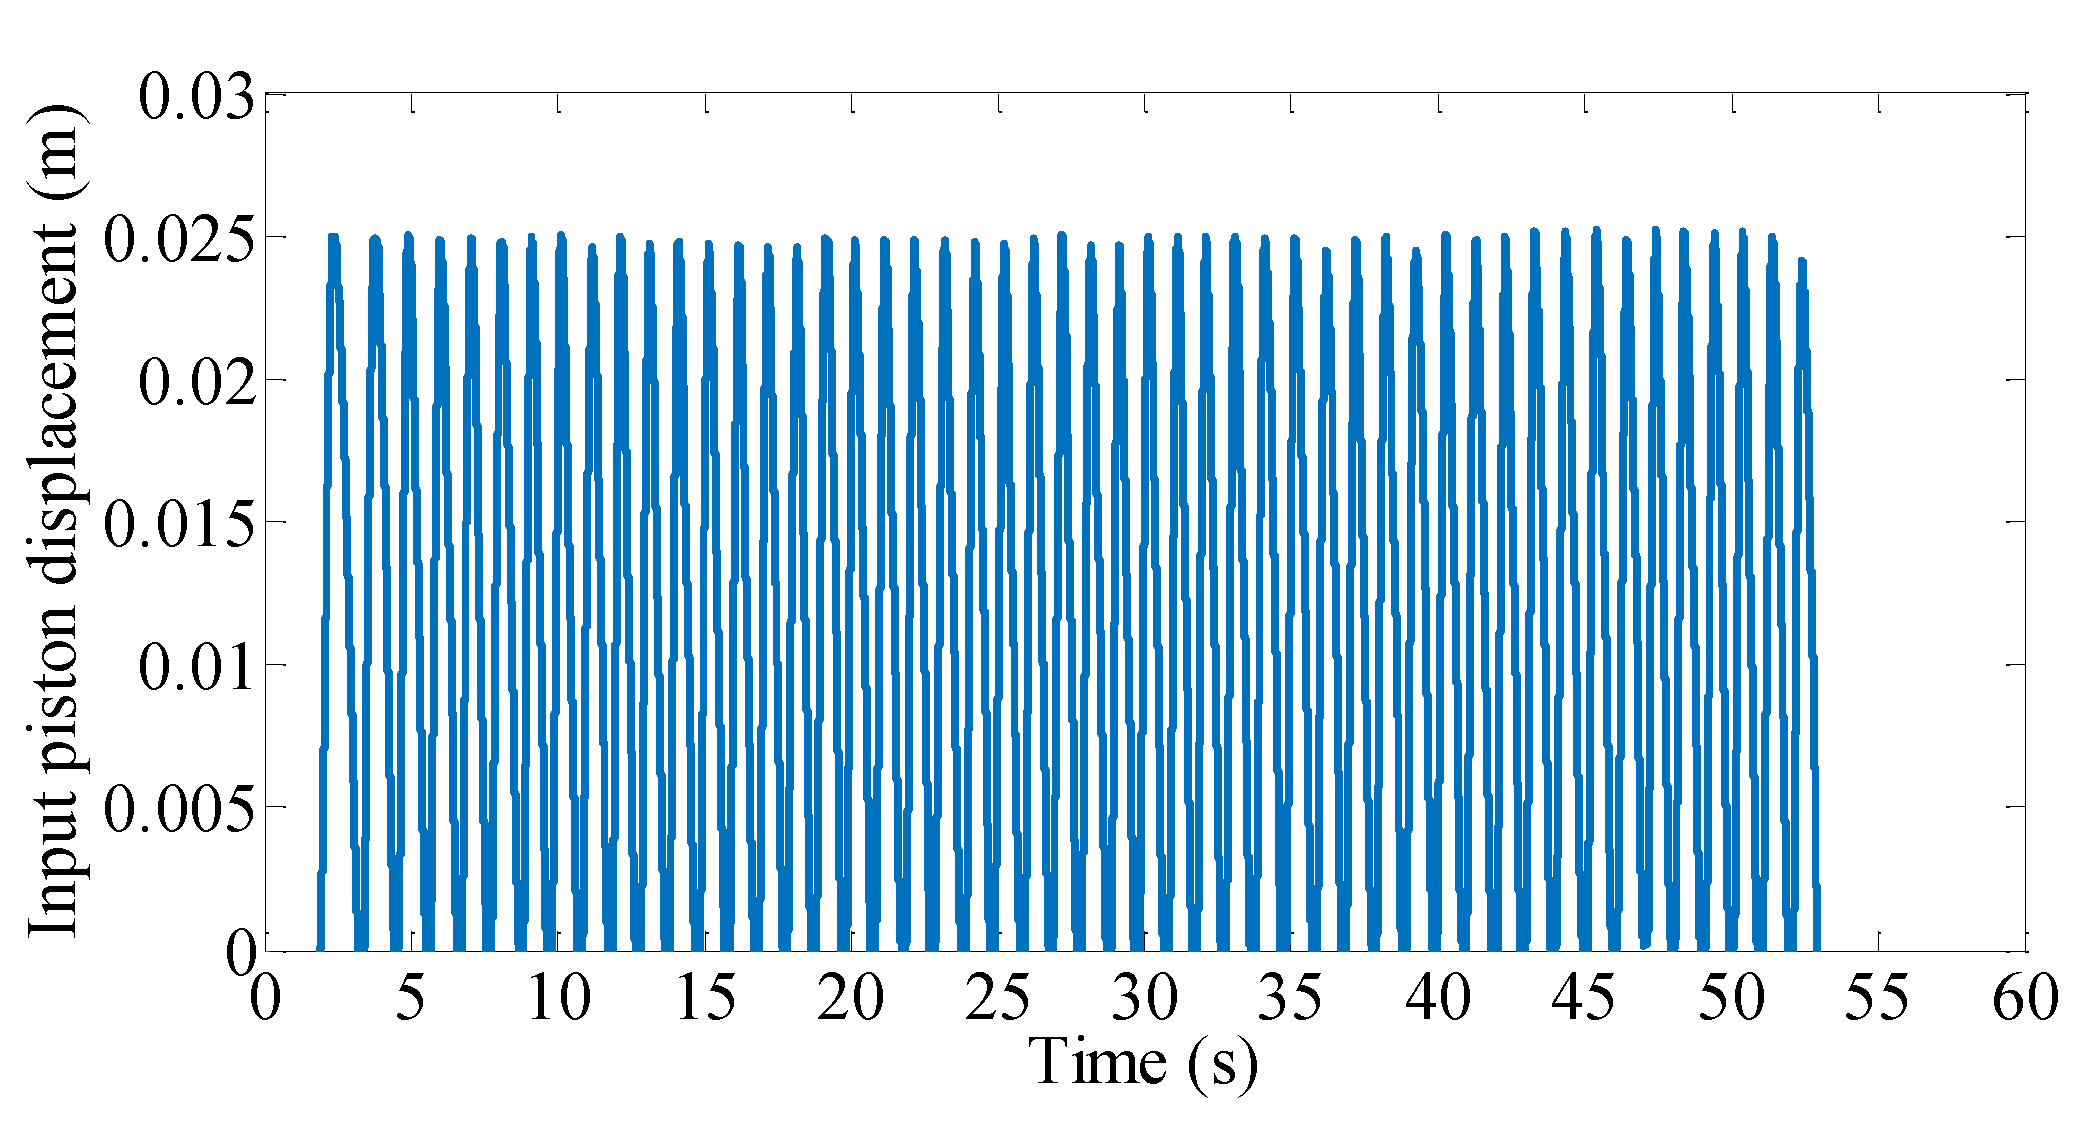
3.2. Test Procedures

During the dynamic test, an operator would manually pump at nearly constant frequencies (~1 Hz) for a given number of reciprocating cycles. Synchronous real-time acquisition of spool displacement, coil, and drive current was performed. The acquisition started after the system was warmed up; i.e., the solenoid, electric circuit, and sensors were on for 10 min to avoid temperature drift. In a multiple-cycle test, the acquisition time was 100 s and the sampling frequency was 10 kHz. The equations set to calculate the experimental heaving input, the hydraulic motor output, and the electric output power, are summarized in Table 3. Additionally, a measured input piston motion (i.e., 50 pumping cycles) is shown in Figure 7. It is worth noting that the experimental input was done by manual pumping; no advanced trajectory control was implemented beyond the operator’s perception. For PTO performance under realistic wave conditions, a simulation using the experimentally validated models and wave data from ocean sensors can be found in Section 4.2.

4. Results and Discussion

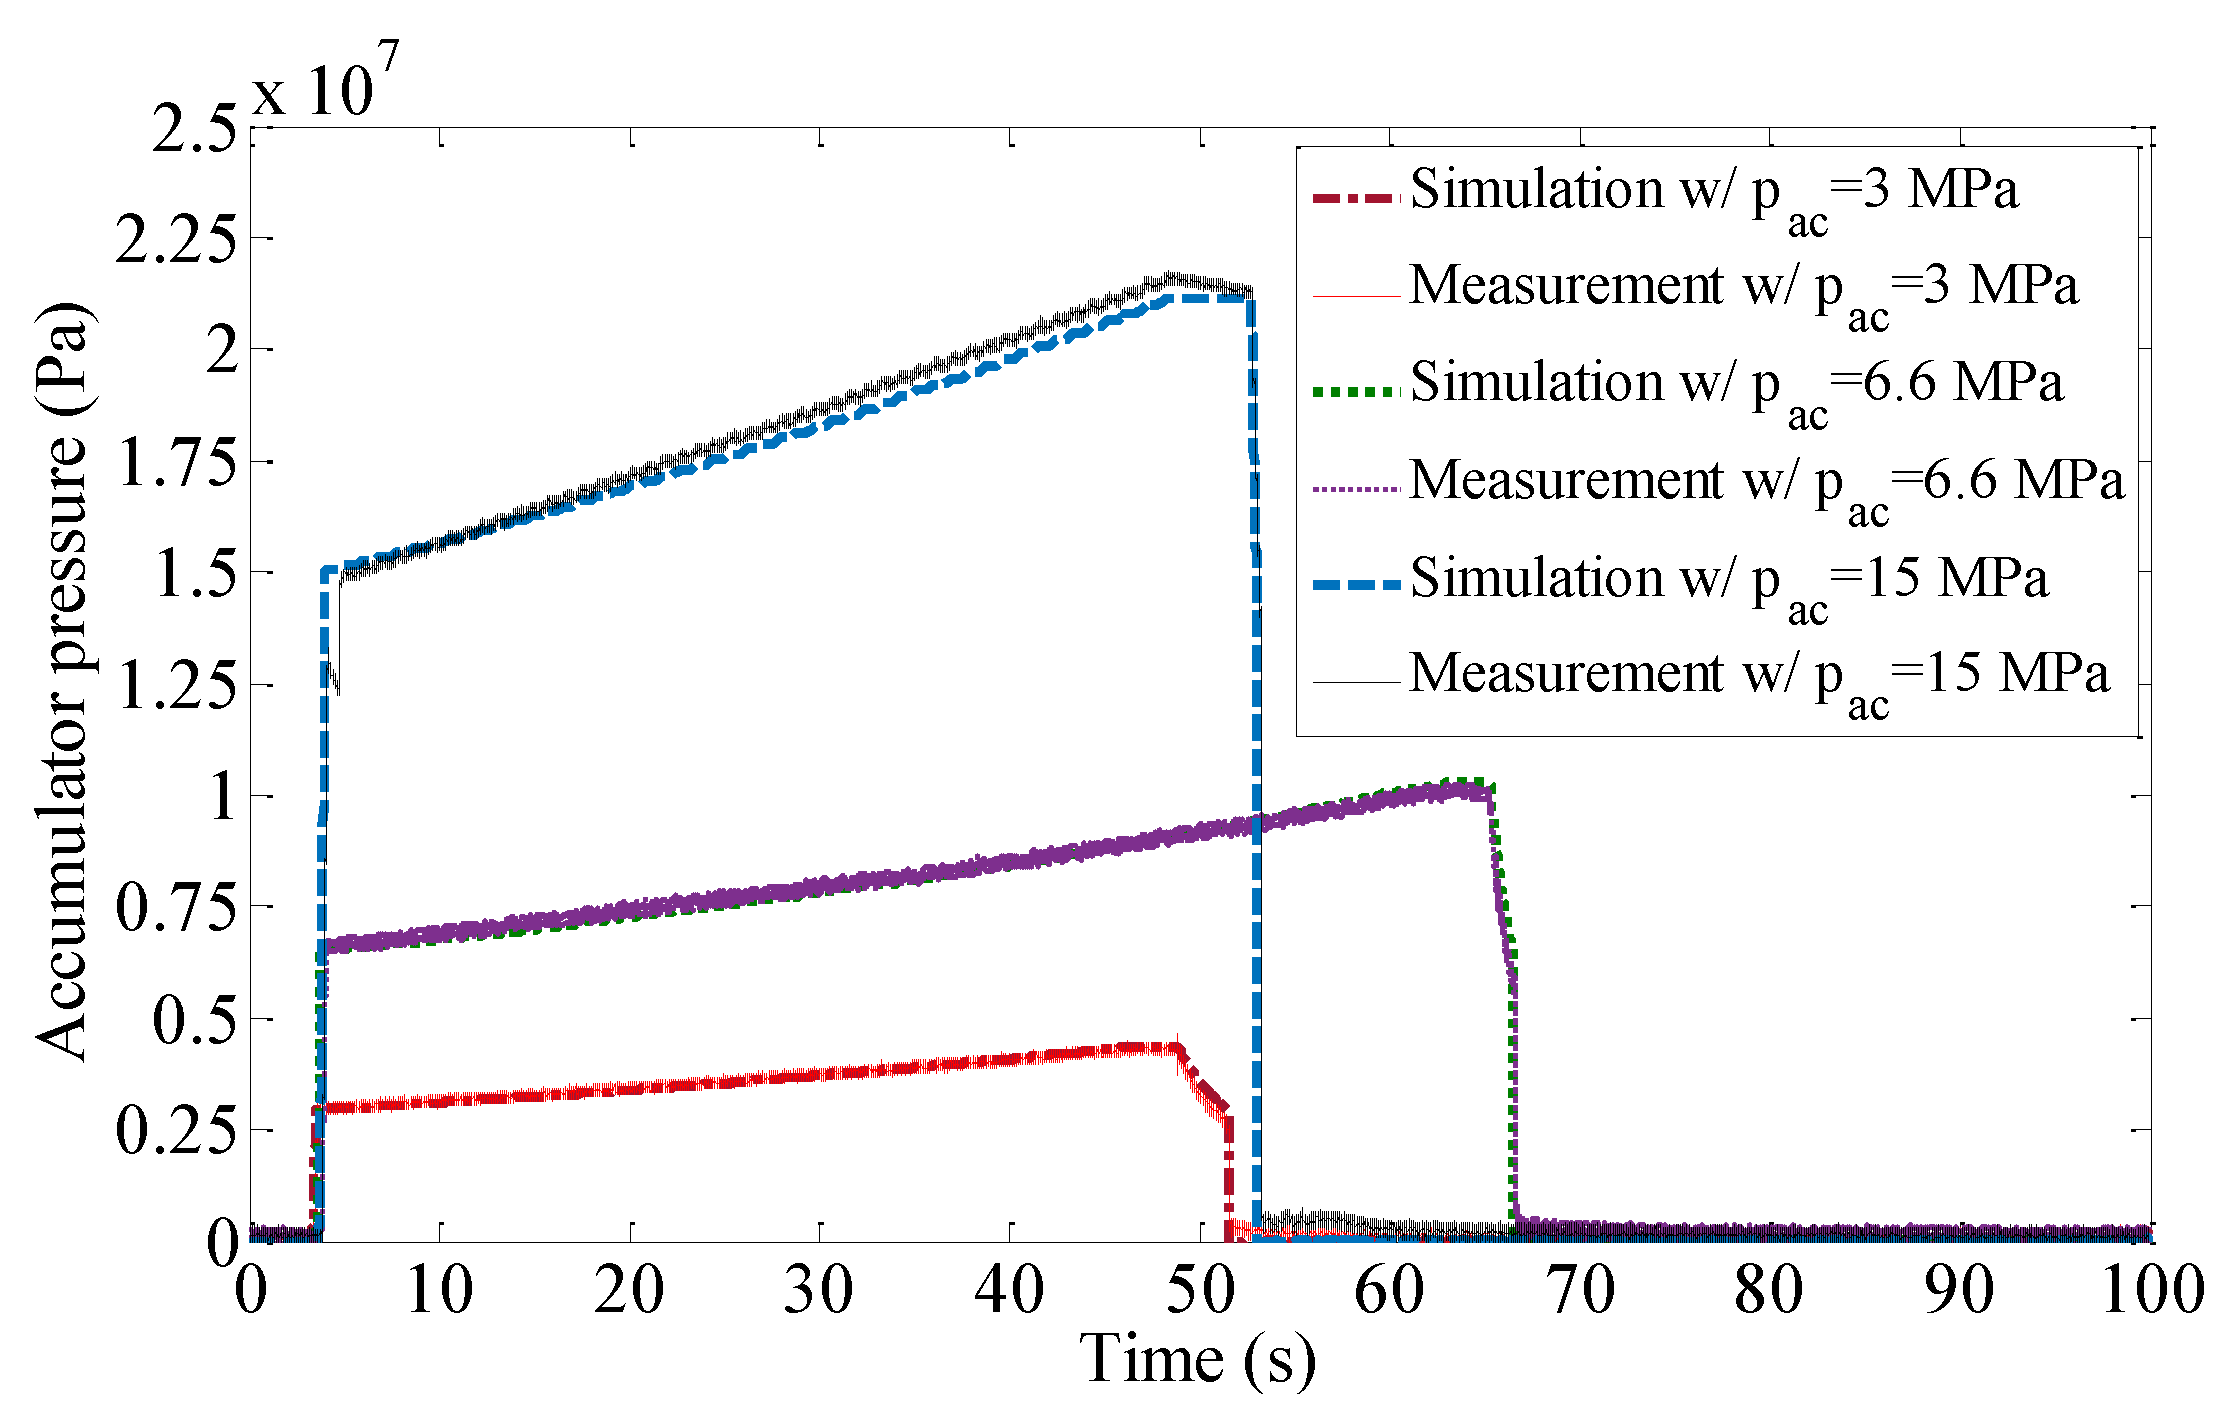
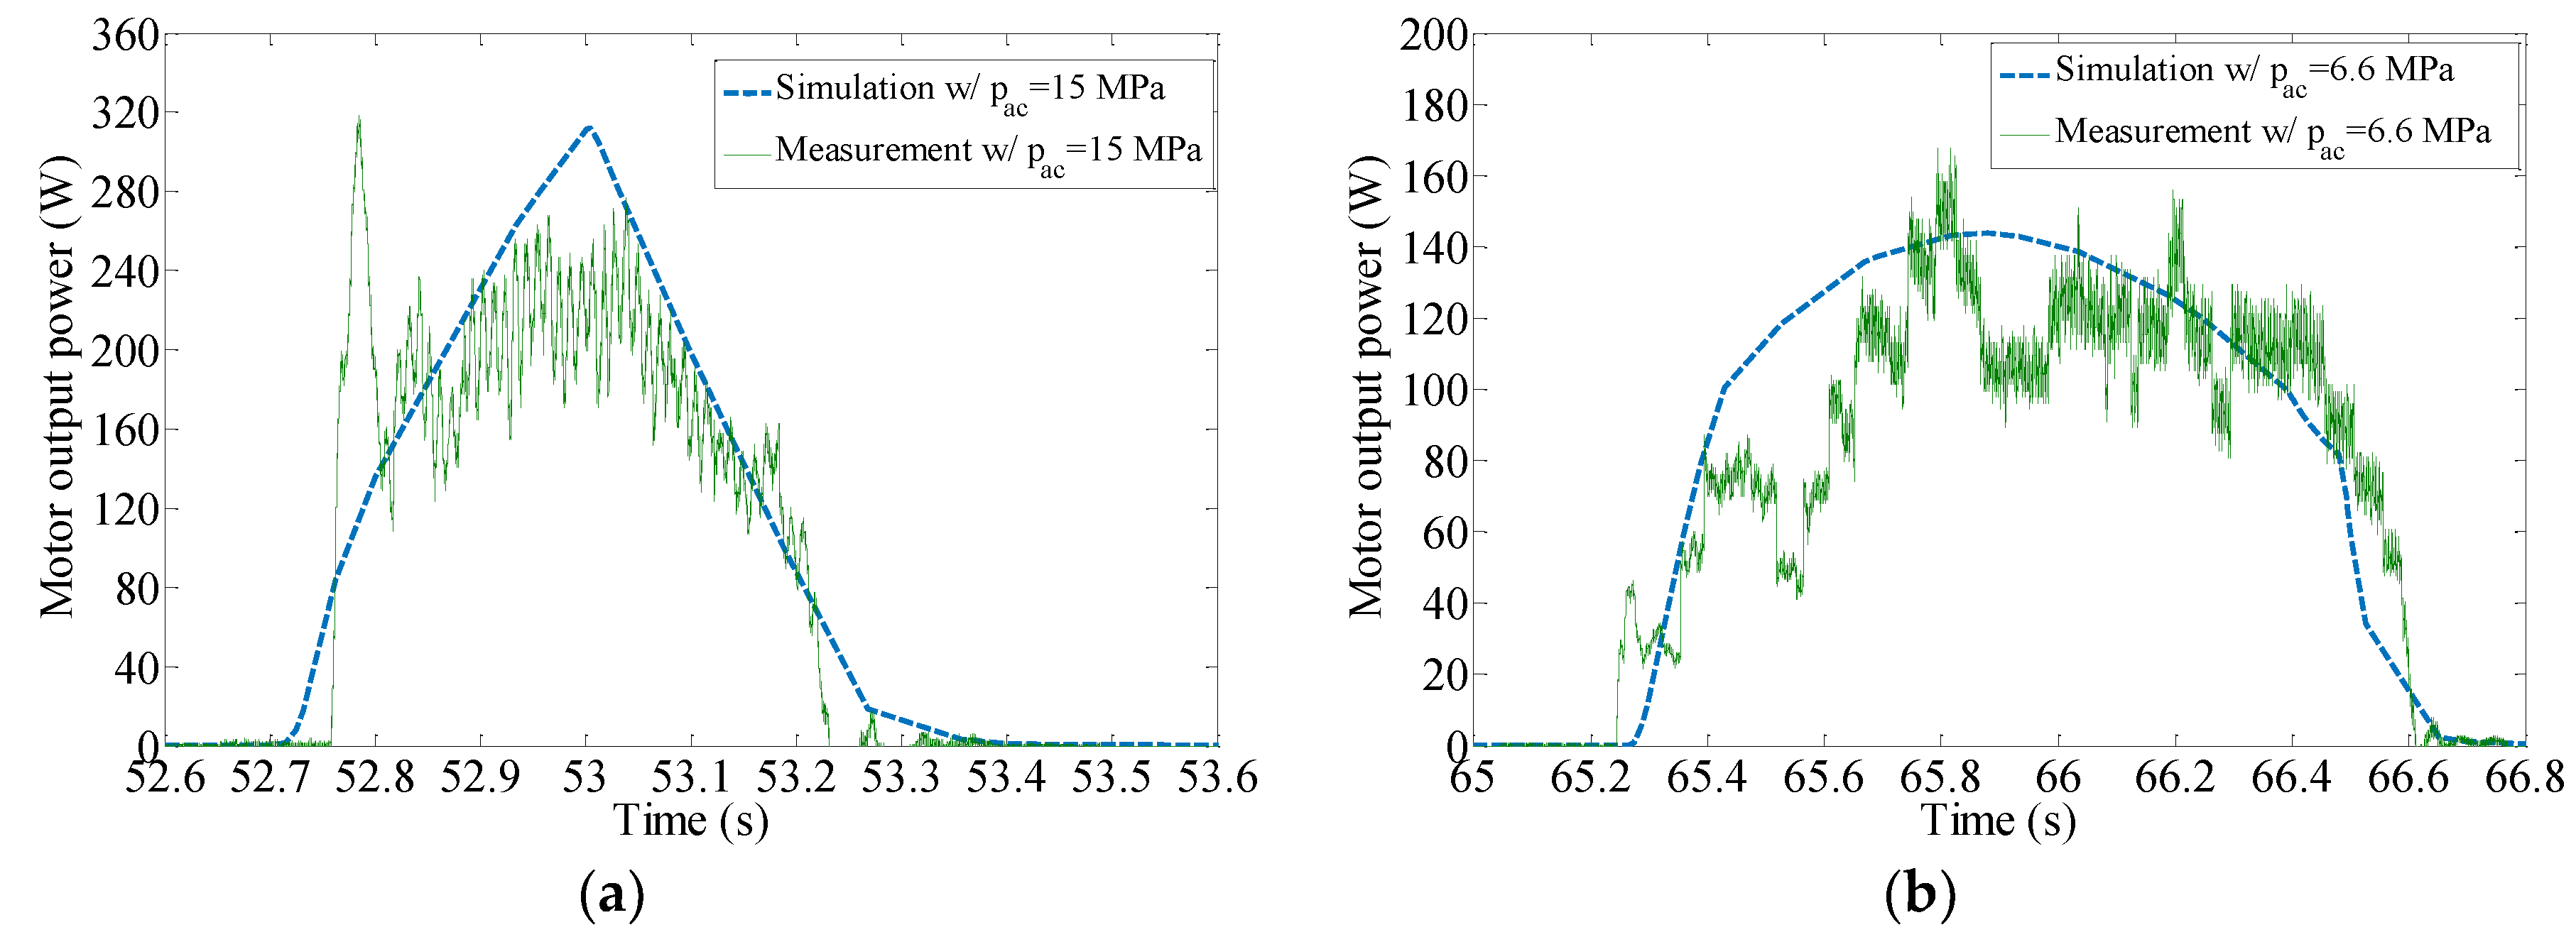
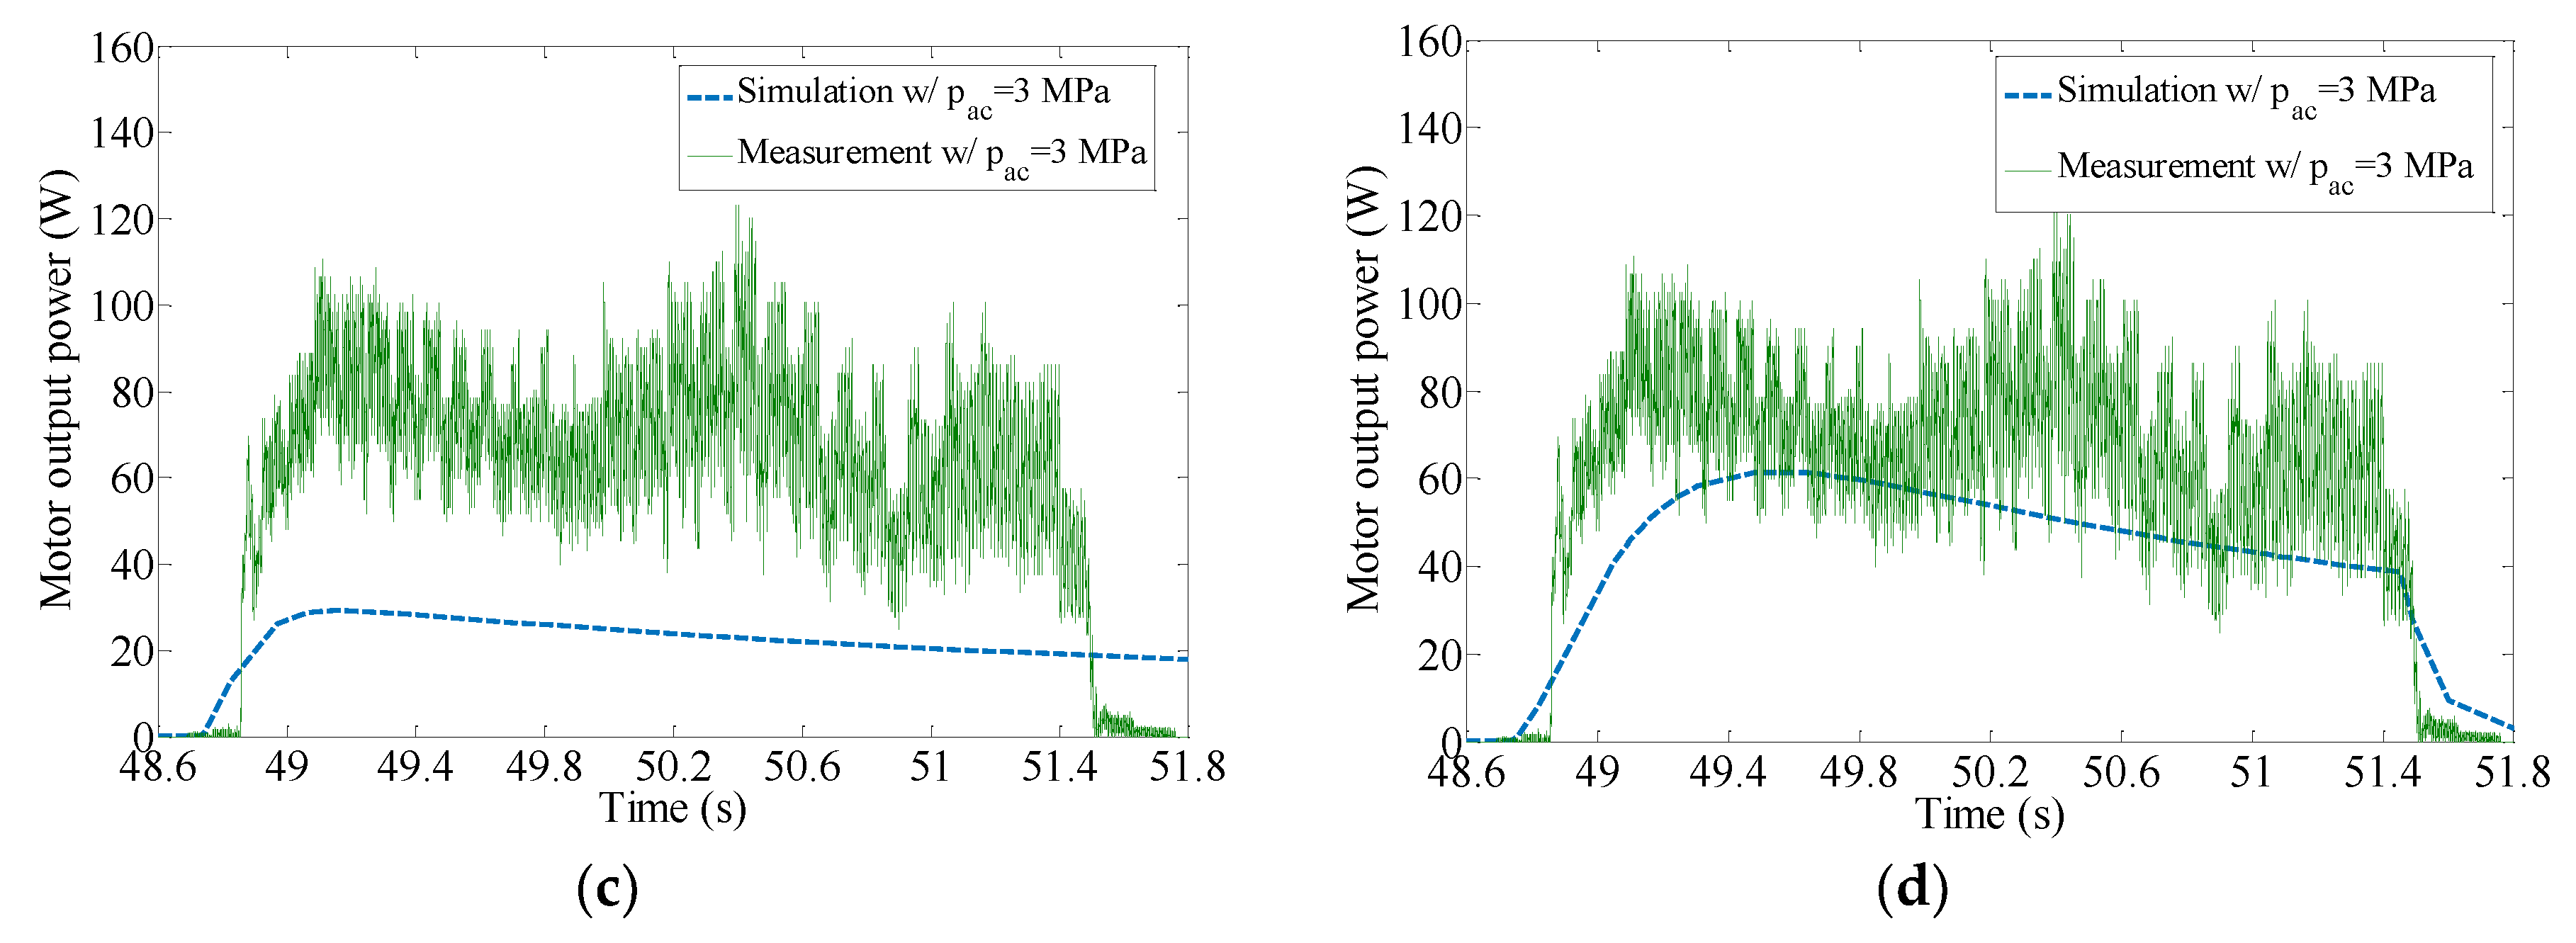
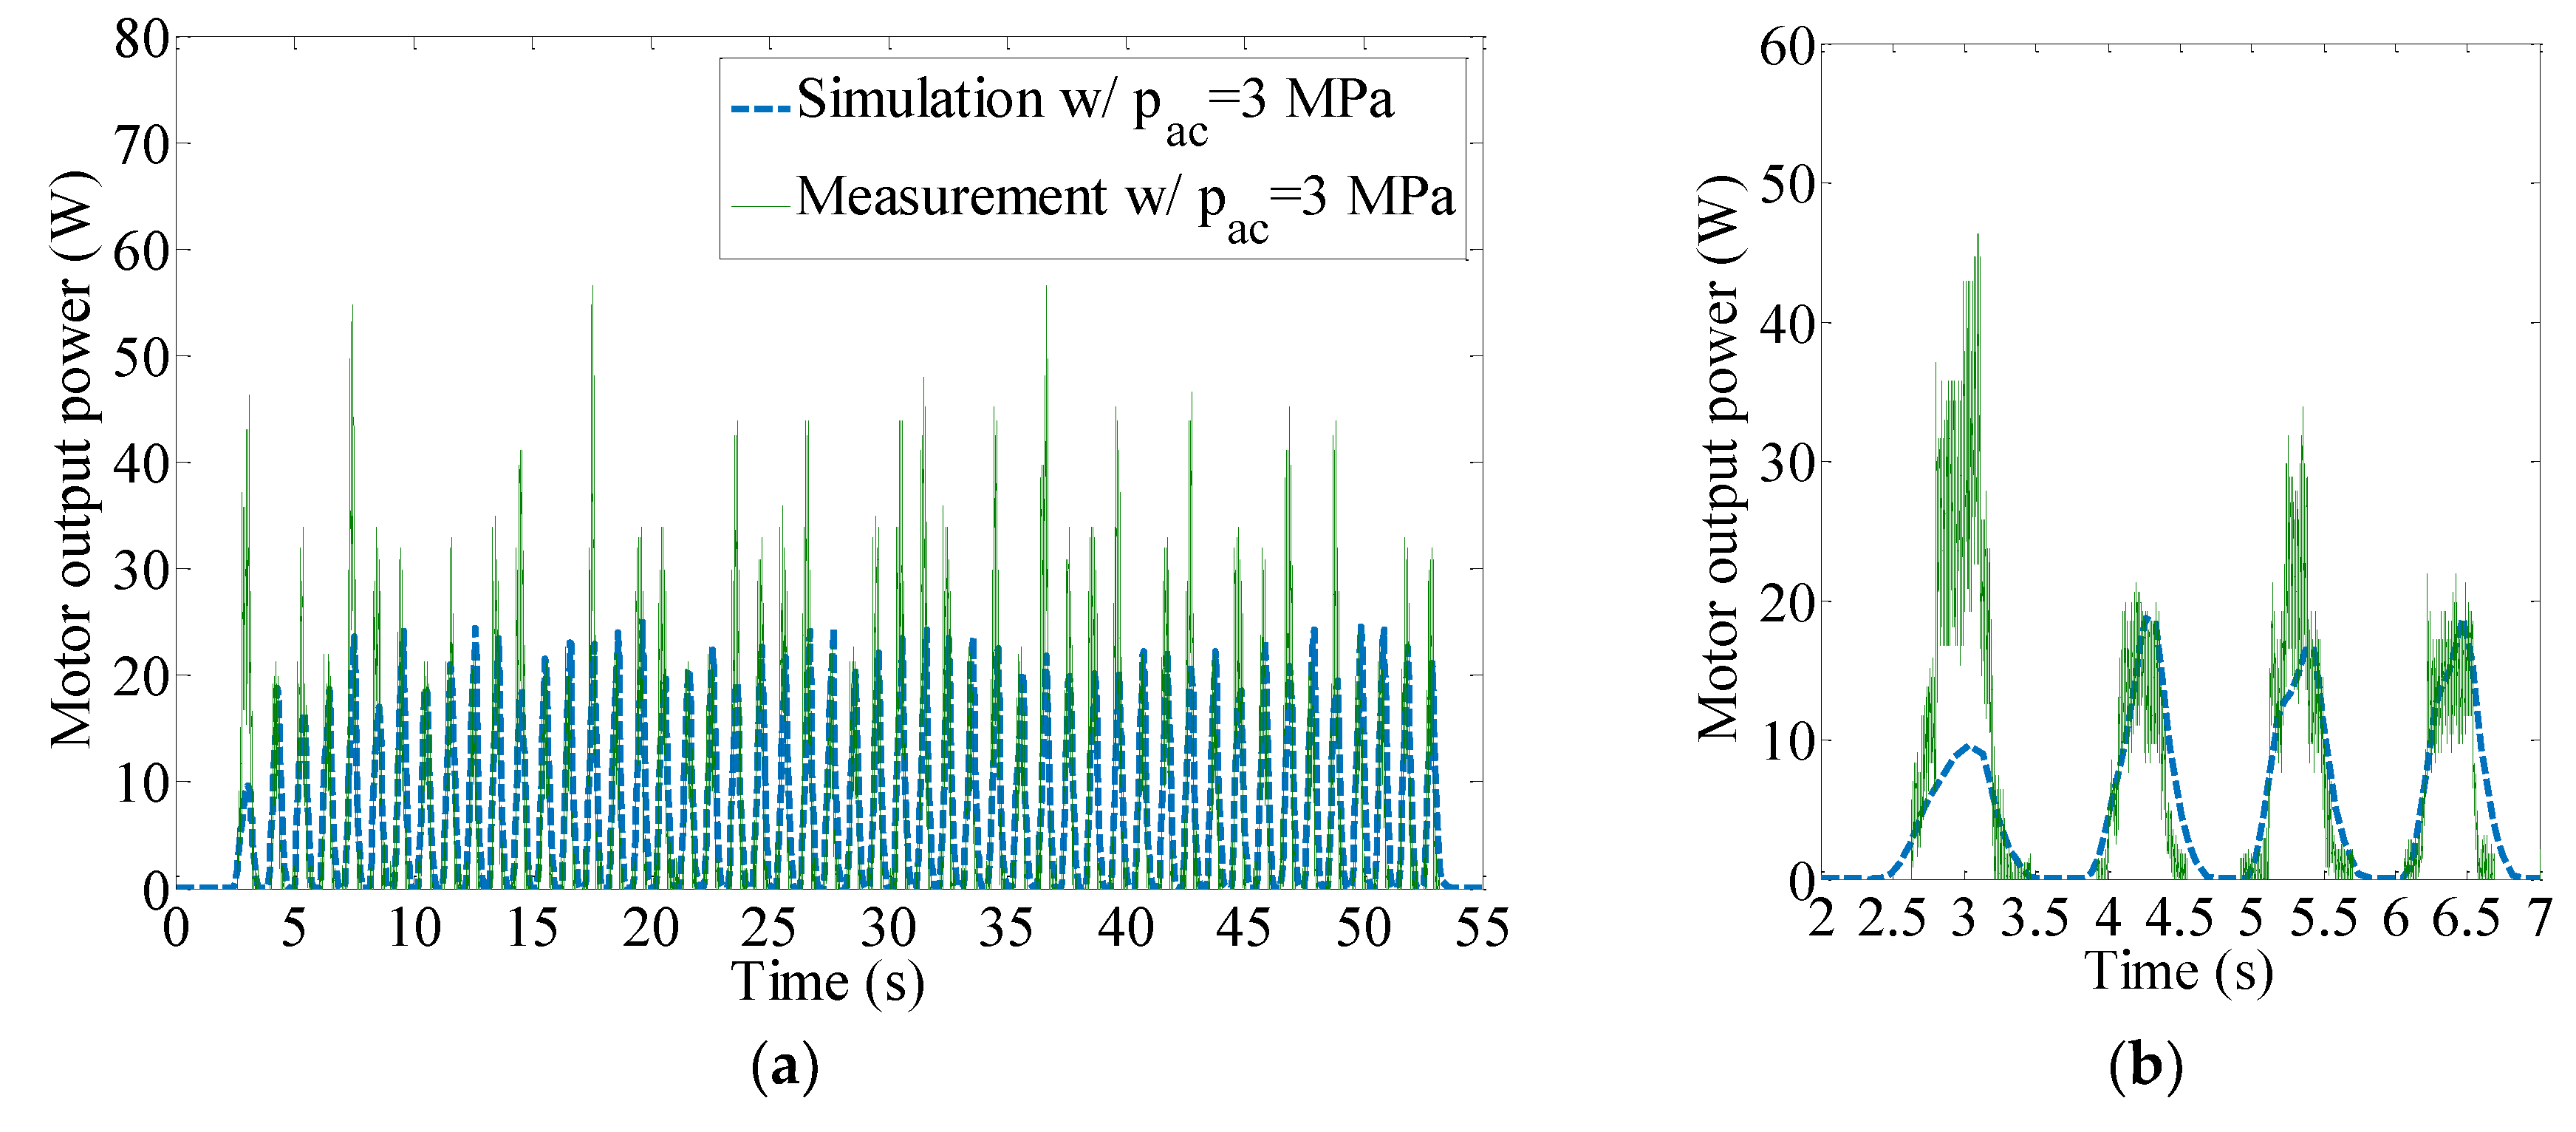
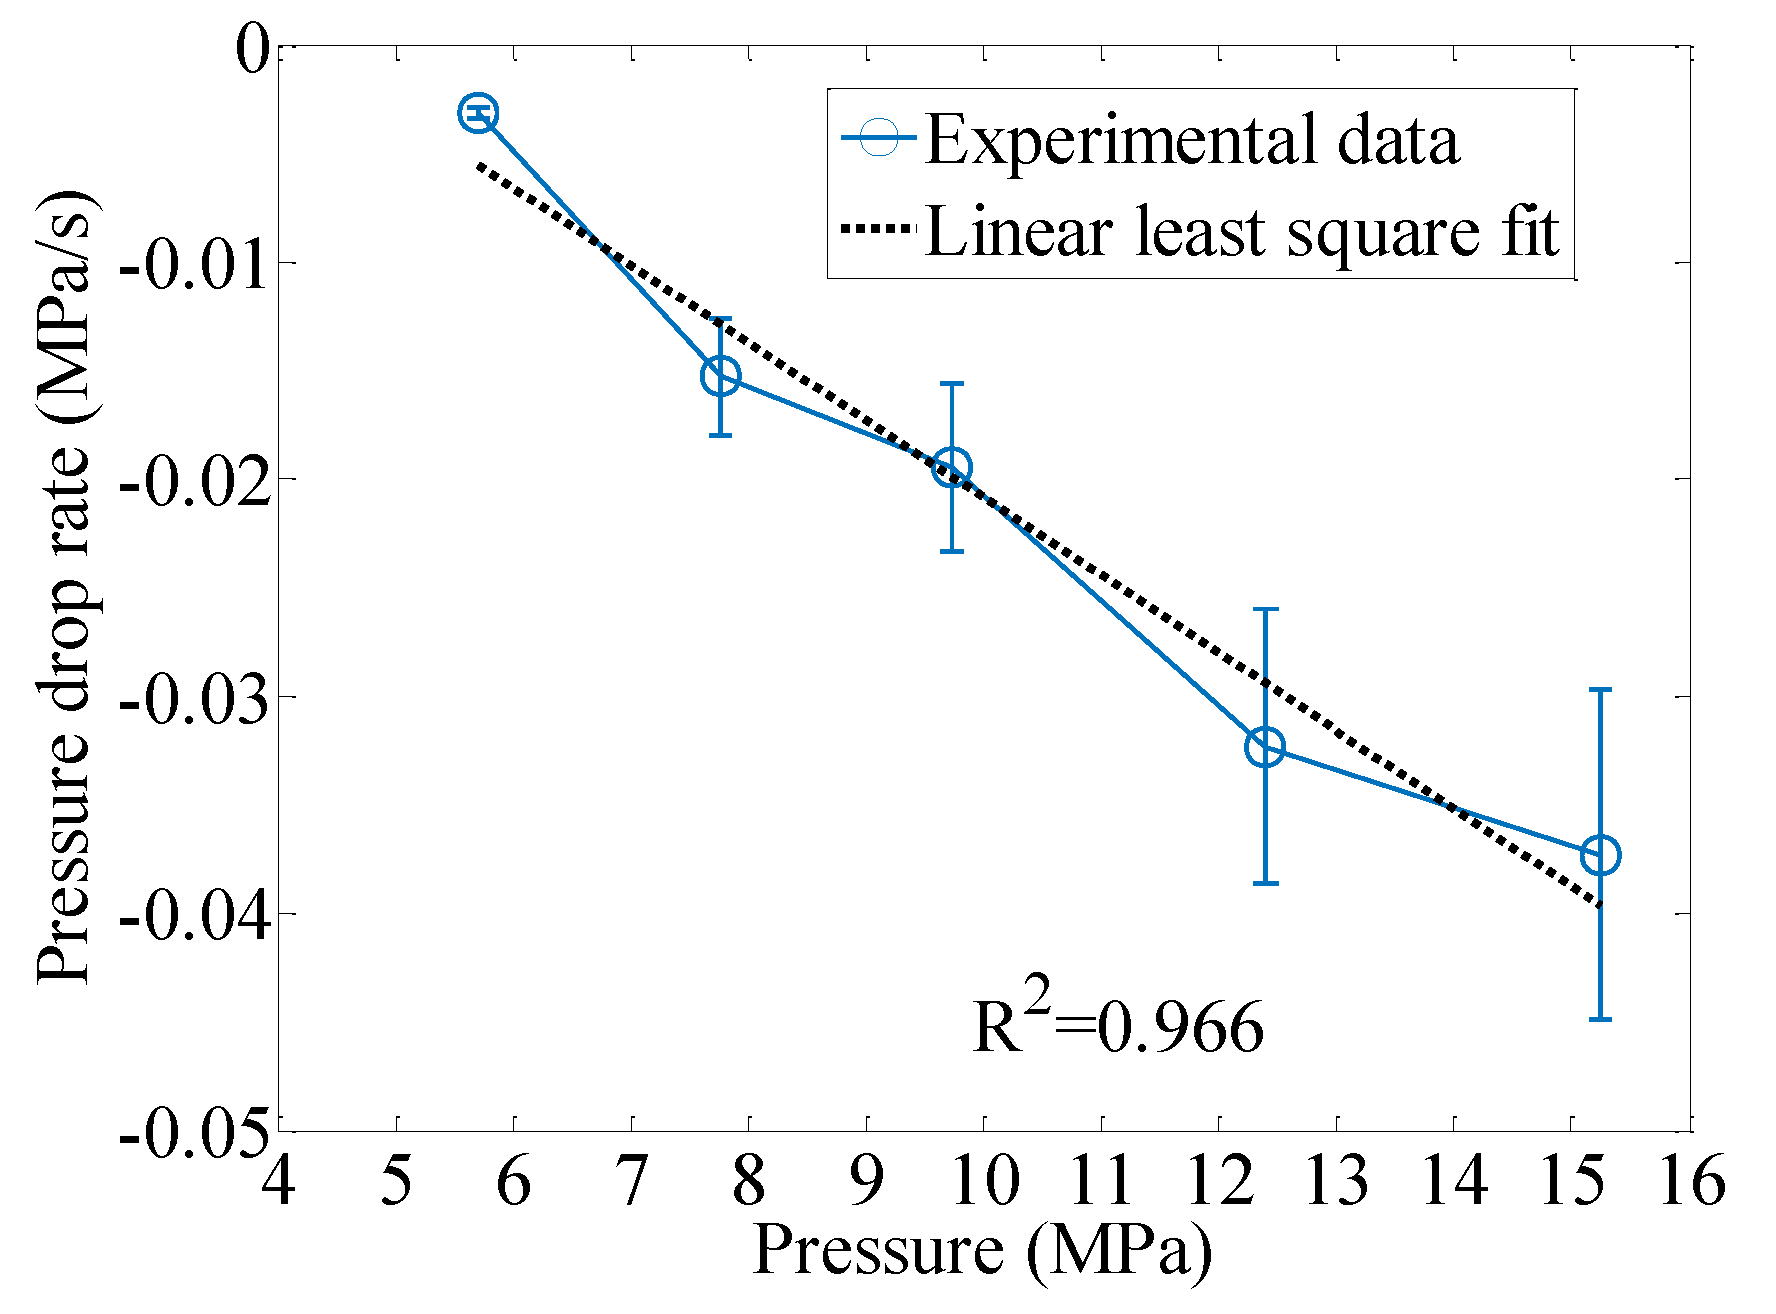
4.1. Model Validation

The performance of the proposed PTO system depends upon that of the electrohydraulic circuit. Therefore, the fluid power models developed in Section 2.2 were validated first. A comparison between the measured and the simulated accumulator pressure based on Equation (6) was made when the accumulator was pre-charged to 3 MPa, 6.6 MPa, or 15 MPa, as shown in Figure 8. The simulation results match the measurement in three experimental settings. For the same number of input pump strokes as in Figure 7, the accumulator pressure reached a higher magnitude, as the pre-charged pressure increased. The pressure history between 5 s and 45 s shows a trend that almost linearly increases with time, which is due to the charging of the pressurized fluid into the accumulator by the hydraulic piston pump. The sharp corners at 52 s for the 15 MPa case, 65 s for the 6.6 MPa case, or 47 s for the 3 MPa case, indicate rapid loss of pressurized fluid in the accumulator chamber, which was due to the energizing of the digital on-off valve at those designated times to discharge. It is also noticed that the duration of the accumulator discharge decreased with the pre-charged pressure. This was also expected, as most hydraulic motors output higher shaft speeds under elevated pressure.
The output power from the hydraulic motor shaft drives the electrical generation system, higher output power indicates greater potential for electricity generation. The simulated hydraulic motor output power of 3 MPa, 6.6 MPa, or 15 MPa accumulator pre-charged pressures were validated by being compared to the experimental results, as shown in Figure 9a–c.
As shown in Figure 9a,b the simulated results estimate the output power with good precision compared to the measurements. However, in the case of Figure 9c, the deviation is over 50%. The significant deviation is due to the unmodeled nonlinearities in the combined hydraulic motor-electric generator simulation; in Figure 9a–c, all use the same damping coefficient 0.50 Nm/(rad/s), as in Table 2. By reducing the damping coefficient for Figure 9c to 0.20 Nm/(rad/s), the updated simulated results show a better match with experiments, as demonstrated in Figure 9d, which supports the assumption that the damping effect in the combined motor-generator is nonlinear with respect to the shaft rotational speed. In addition, the case where the digital on-off valve is kept energized during the entire experiment, i.e., the accumulator only acts as a pressure damper, as in [12], was also tested and validated, as in Figure 10. Compared to the case of Figure 9d, without the storage and release of compressible energy from the accumulator, the output shaft power from the hydraulic motor is strained under 60 Watts (W), where for the same input motion, the peak output power in Figure 9d can reach as high as 122 W; or by increasing the pre-charge pressure of the accumulator, the peak is found over 220 W in Figure 9a. The instantaneous output power gain from the proposed PTO system with a higher storage pressure is significant.

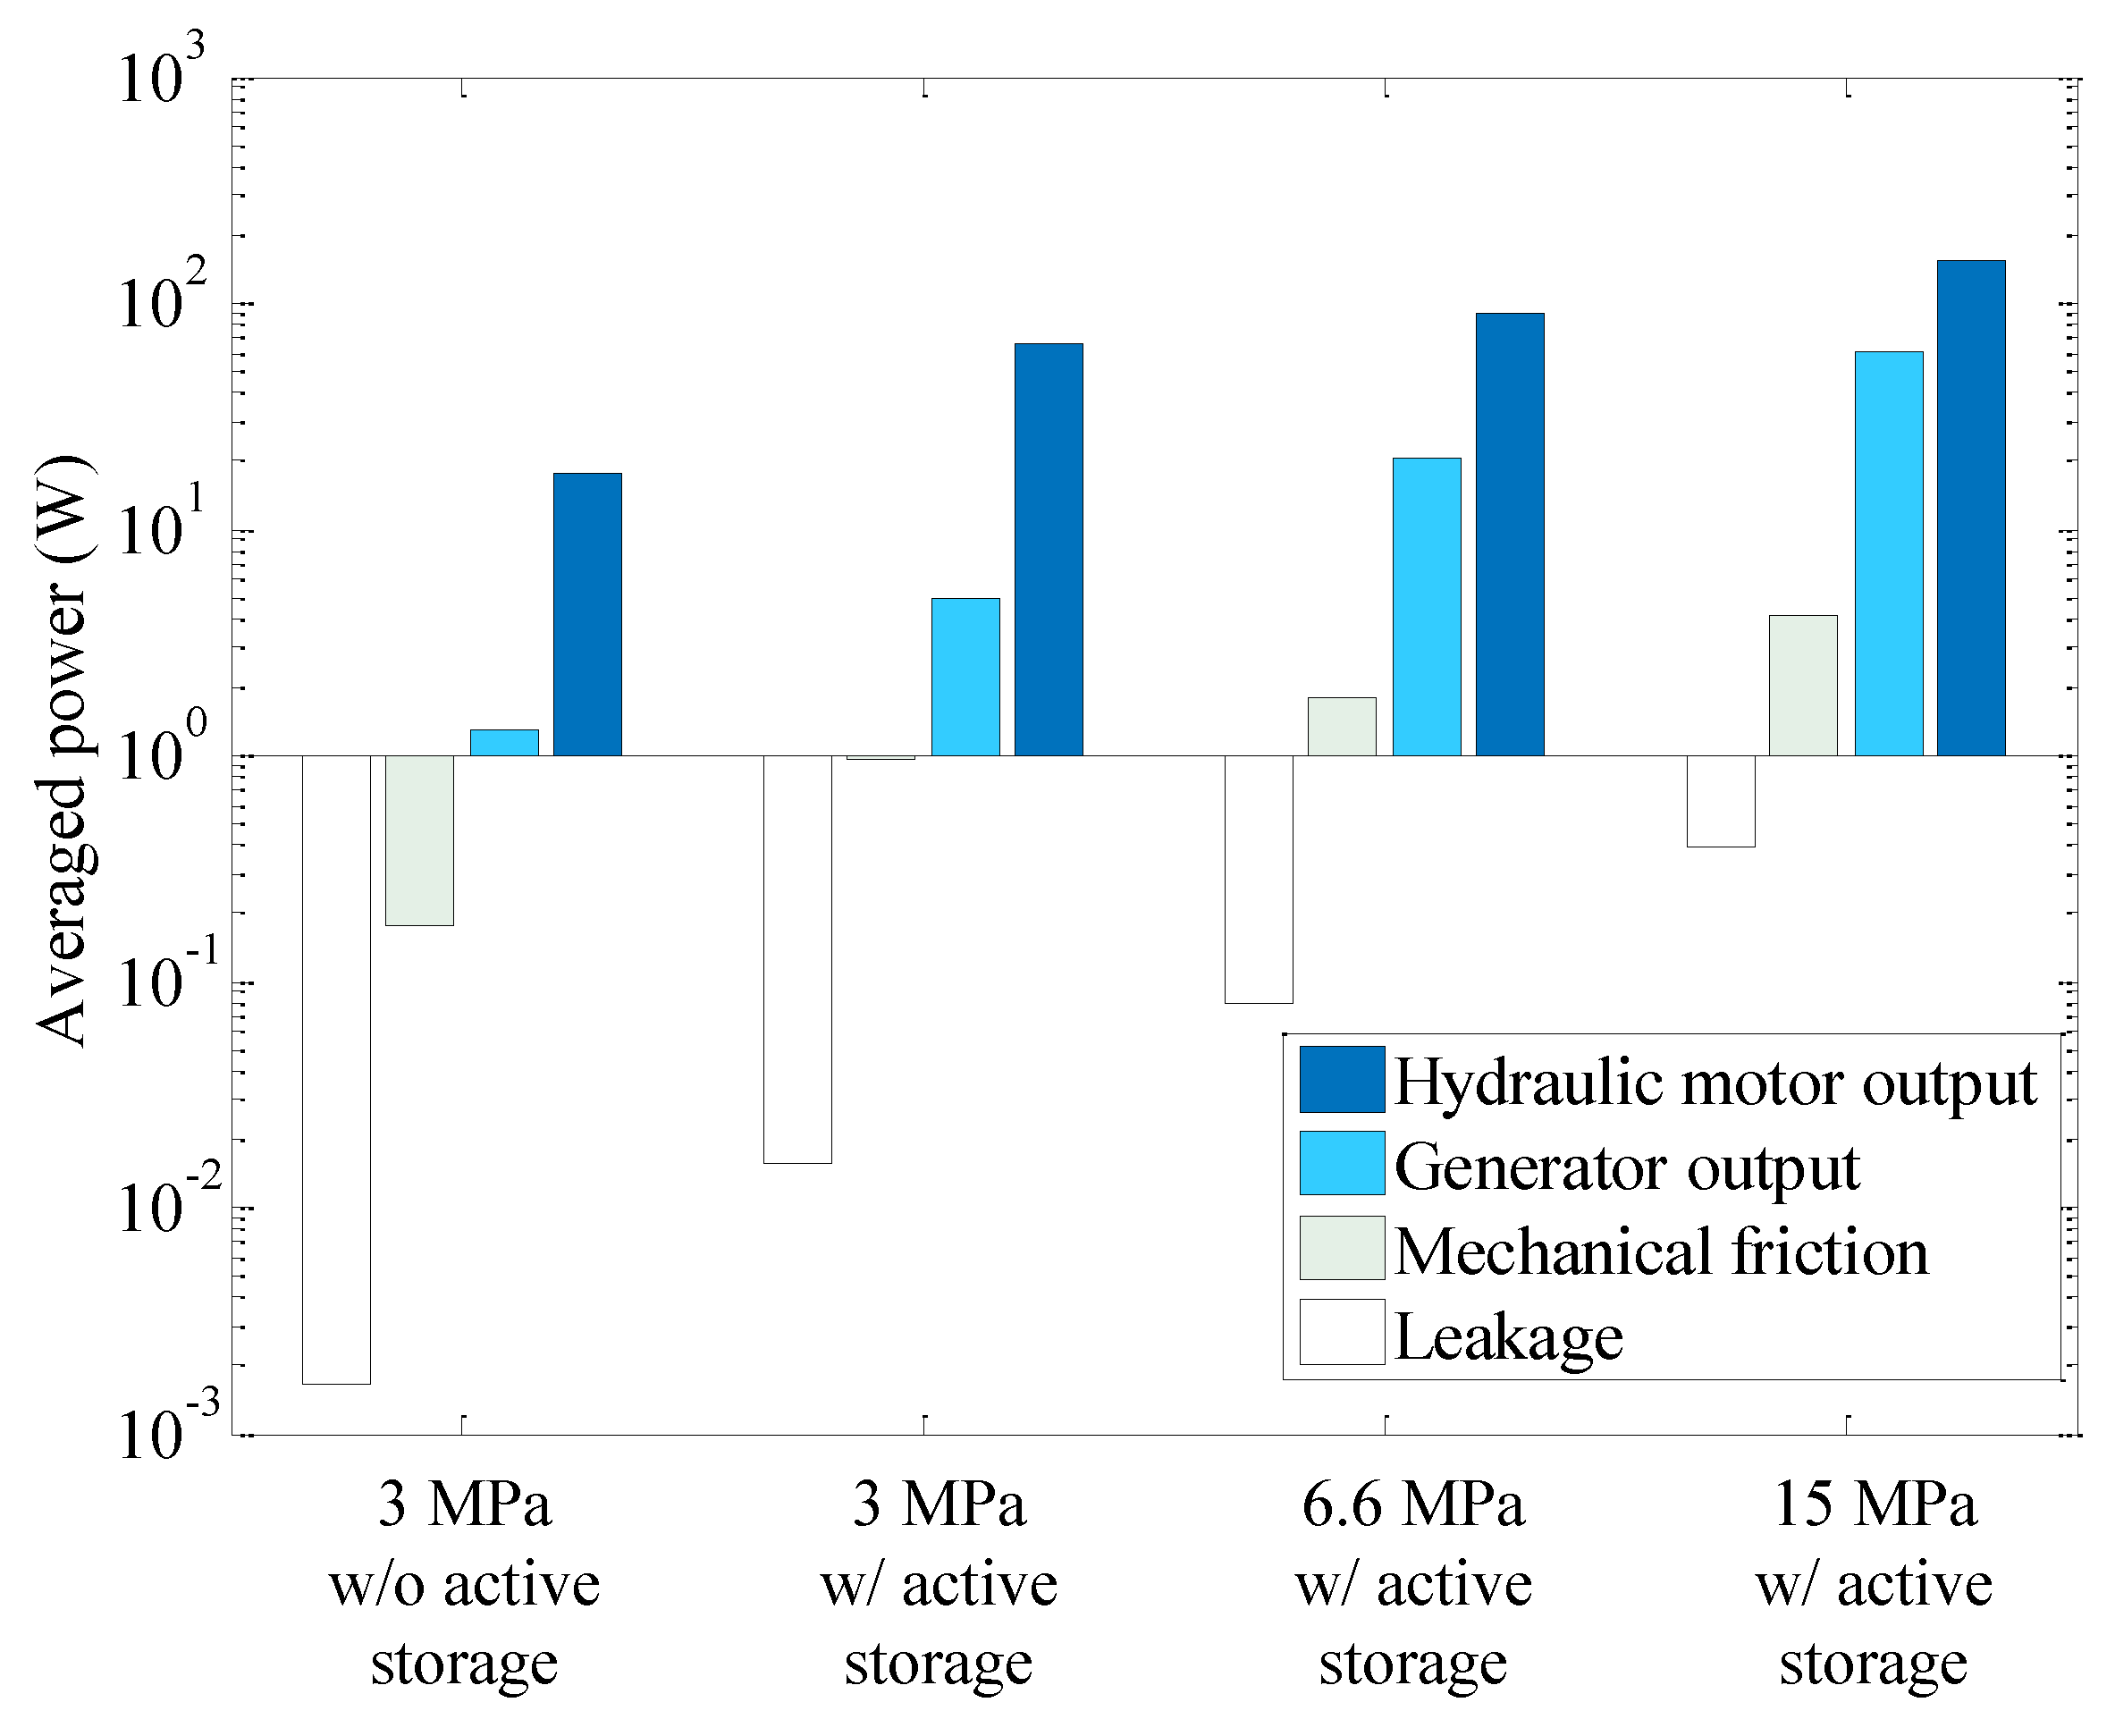
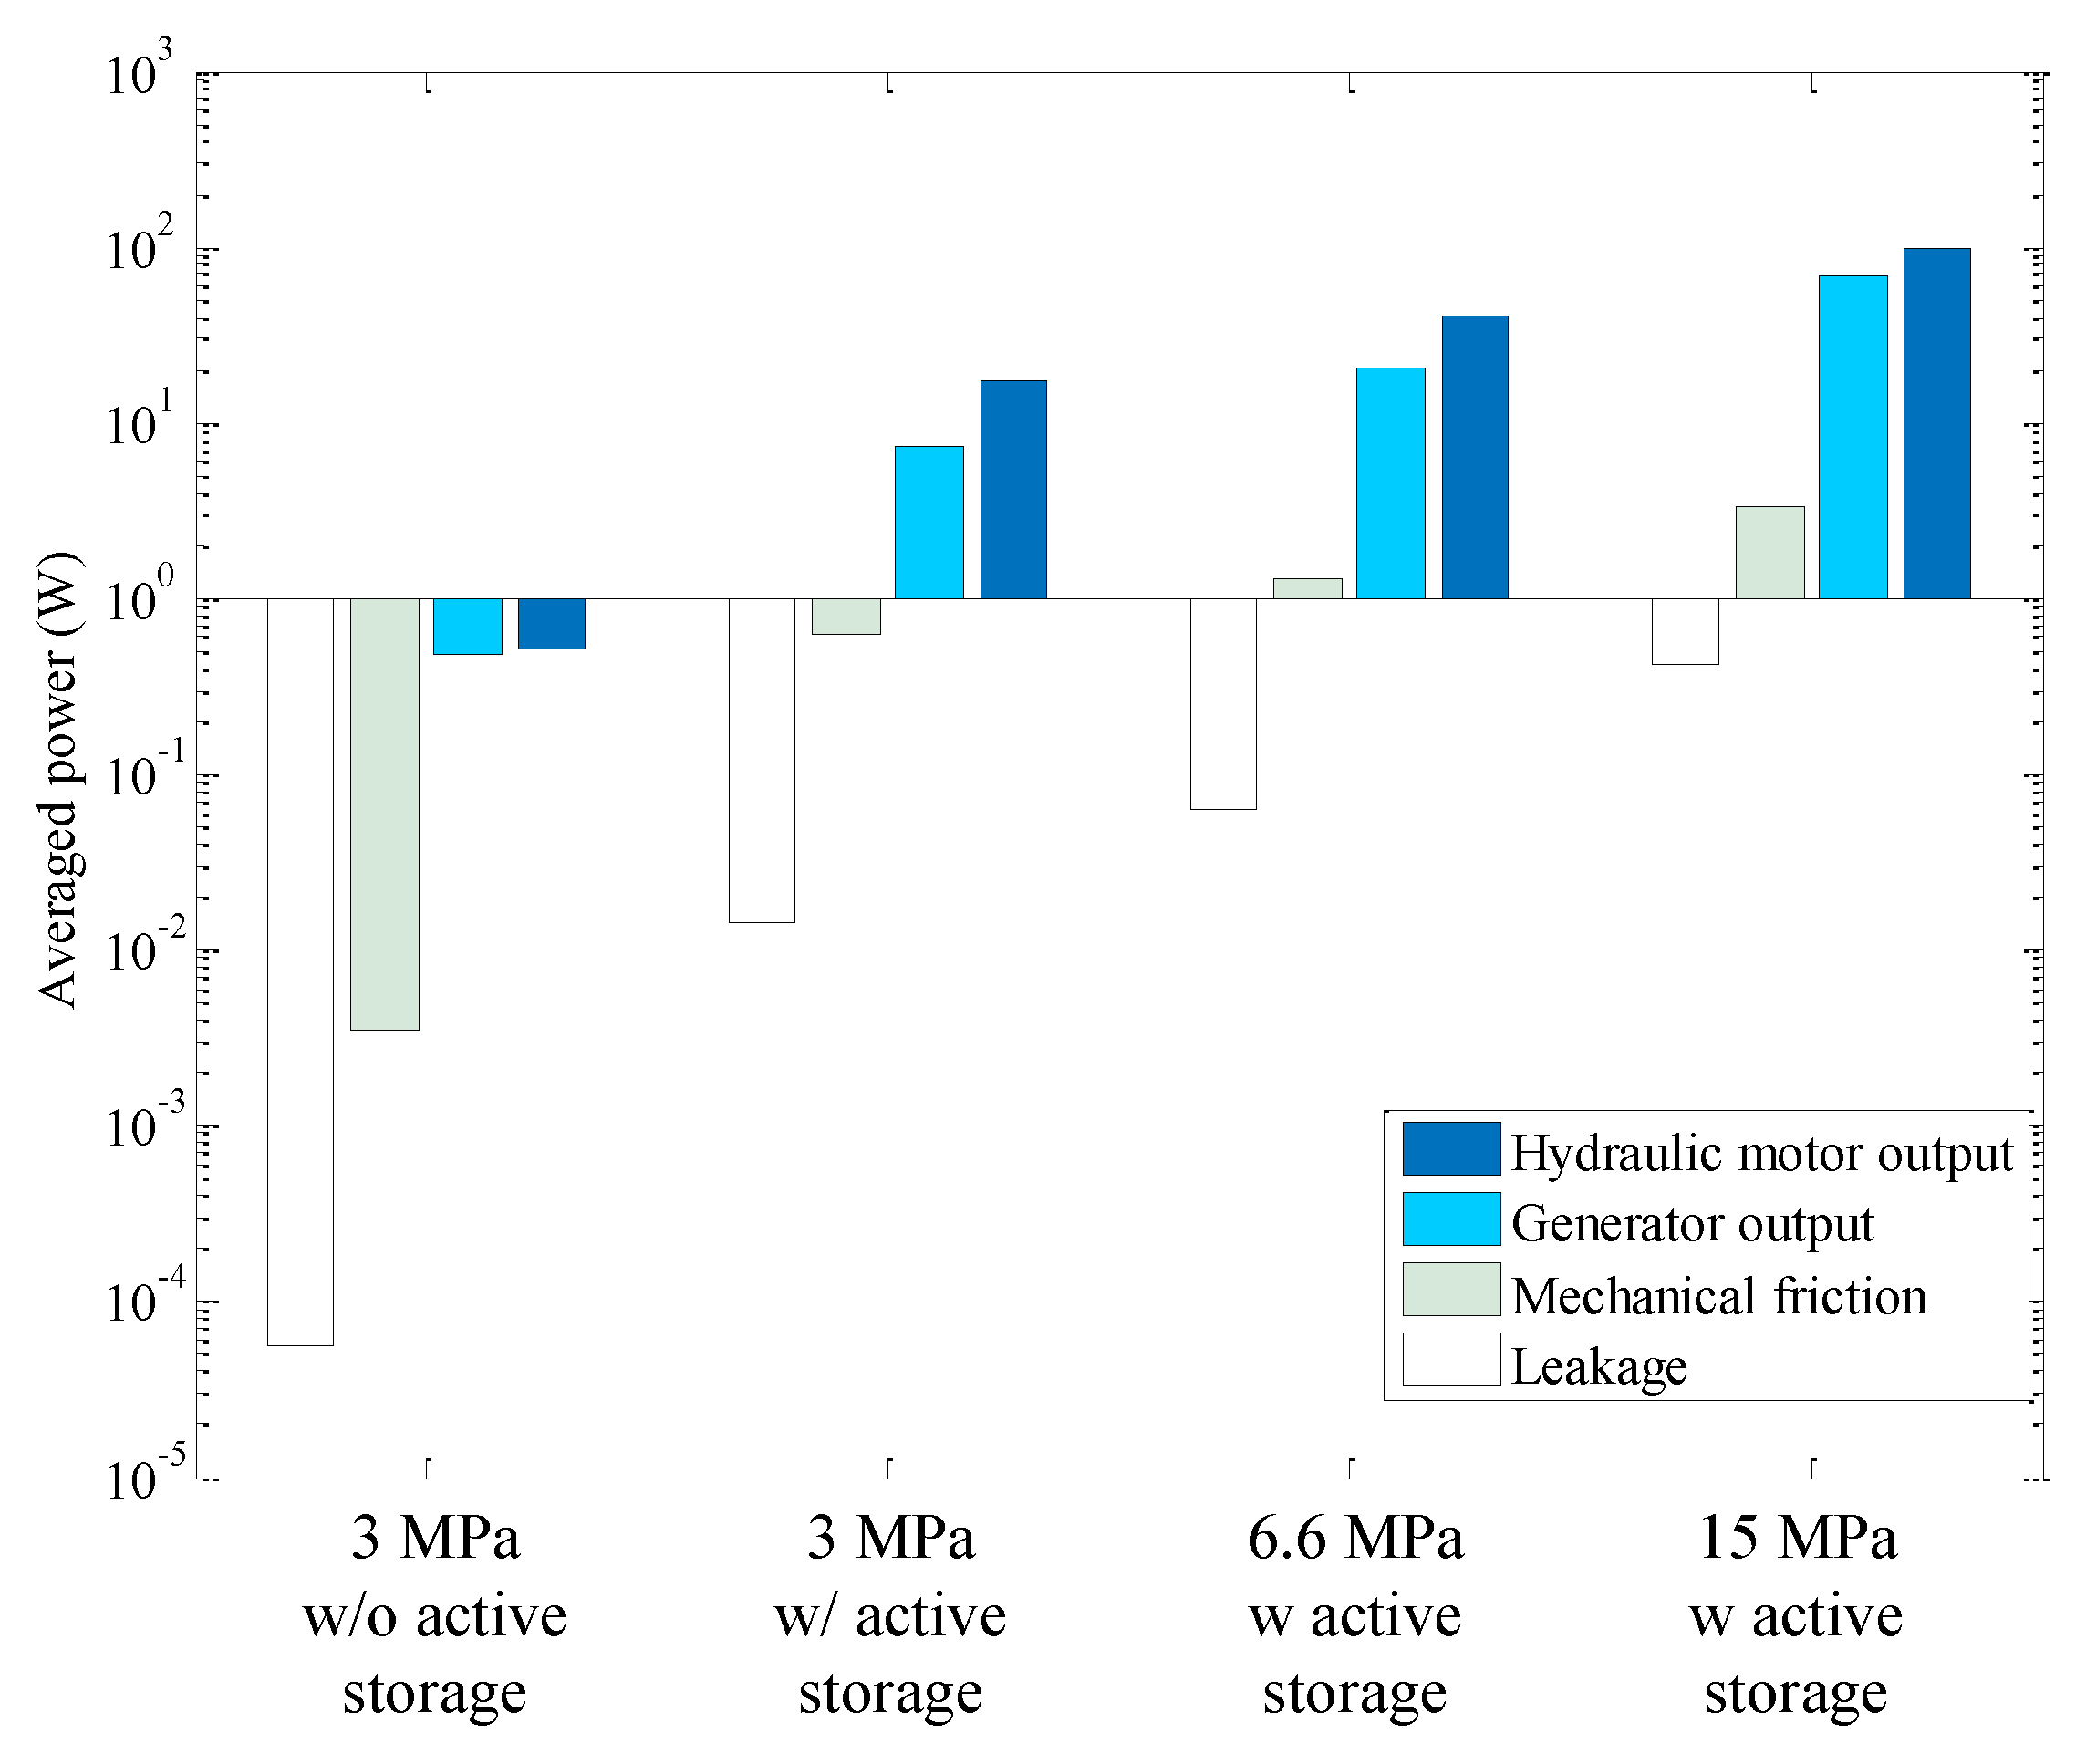
4.2. Power Output and Losses

The performance of the PTO balances between the power output and losses. To calculate the input piston work, and the mechanical and volumetric losses in the proposed PTO using Equations (9) through (12), the link velocity, the pin reaction forces, and the leakage coefficient need to be determined. In Figure 11, the translational velocity of Link 2, r 2 ˙ , is obtained by calculating Equation (2) using the trajectory in Figure 7, and the rotational angular velocity from Equation (4). With the knowledge of those parameters, and F 13 y using measured piston pressure, the reaction forces on the right-hand side of the Equation (5) were calculated. Then all the unknowns in Equation (9) were obtained.
By substituting the measured piston displacement and accumulator chamber pressure into Equations (9)–(12), the hydraulic motor output, the electrical generator output, the mechanical friction loss due to the relative motion between the pin and slot, and the leakage loss power can be obtained, as in Figure 12.
From Figure 12, the performance of the proposed PTO shows that for the same input number of waves, higher accumulator pressure results in greater generated electric power. In the 3 MPa case, without active energy storage, the generator output power is only a few Watts, comparable to other WEC designs under a similar footprint [12]. However, once the pressurized flow from the pump is actively stored as in the other three cases, the output power increases significantly, especially at a higher pre-charged pressure. When the accumulator is discharged at 21 MPa in the 15 MPa case, the average electric power reaches 60.2 W (with peak power over 122 W), which is at least 46 times higher than in those without energy storage. And this supports the authors’ argument that the implementation of energy storage devices on portable WECs significantly boosts the output electric power. Another observation is that the leakage loss increases with pre-charged pressure, but the magnitude is much smaller compared to the mechanical friction; e.g., leakage power is only 0.4 W in the 15 MPa case according to Equation (10), whereas the mechanical friction is over 4.2 W by Equation (9). Additionally, the mechanical friction loss could offset the electrical output at a higher pressure or faster pin rotational frequency, according to Equation (9). Nonetheless, results show that under 15 MPa pressure, and 1 Hz, the combined leakage and mechanical friction losses constitute only 7.6% of the electrical output power.
To estimate the performance of the PTO under real ocean environment, the validated models were simulated using recorded ocean wave input from published surface elevation data in [26]. The four configurations for the power take-off were tested, the same way as for Figure 12, and the results are shown in Figure 13. The averaged electrical outputs are 0.5 W, 7.3 W, 20.2 W, and 69.1 W. The overall trend and magnitude of the simulation results match those in Figure 12. It was expected, since the selected wave data also contained 50 input cycles, the result would be similar accumulated pressure. However, the mechanical friction reduces about 20% from the experiment, due to significantly slower wave frequency of the real wave at 0.05 Hz, compared to the manual pumping experiment at 1 Hz. The leakage stays relatively constant, as it is a function of pressure. Although the simulated output power is consistent with the experiment, the simulation took about 6 to 10 times longer to charge the accumulator than that in the experiment, as the recorded wave frequency is significantly slower.
In terms of application of the proposed energy storage-and-release concept for PTOs, it can be applied to industrial or commercial electrohydraulic PTO systems for boosted output power. If the original PTO system is already based on fluid power transmission, the proposed method can be readily applied, and the benefits of an increased output power are expected by adding an on/off valve to control the release of the accumulator storage energy, as the schematic shows in Figure 5. Conveniently, the target system still operates at the original pressure rating in this case, without the need for replacing the existing components. As for the improvement, according to the results in Figure 12 and Figure 13, if the target system has a similar footprint as the one in this paper, a two to four times increase of output power is expected. To further increase the output power, one needs to dial up the magnitude of pre-charged pressure of the accumulator. Although, according to Equations (11) and (12), for the same input heaving motion, the input power grows proportionally with both the accumulator’s pre-charge pressure and the volume; neither can be set infinitely high. This is because the power of leakage loss is directly proportional to the square of the accumulator pressure, as in Equation (10), which grows much faster than the output power does. Also, practical constraints, such as the fluid pressure rating of the original system (e.g., economically, commercial fluid power systems are usually rated below 30 MPa), and the difficulty in manufacturing large fluid power components, could set additional obstacles, which all need to be removed before the proposed method can be applied at significantly elevated pressure settings. In all, the proposed method is tested to boost the output power of a WEC over 40 times compared to a traditional electrohydraulic PTO system without storage, when the pre-charged pressure of the accumulator is set over 15 MPa; even if the original system is operating on low pressure settings (i.e., below 3 MPa), the improvement of the system output is still significant. Yet, there is still room for future improvements on the understanding of the combined effects of the motor/generator rotation speed, accumulator volume, and storage pressure, with further optimization and experimental study.

5. Conclusions

The electrical output capability of a traditional small-scale WEC is limited by its physical dimensions. To increase the electricity output of small-scale, portable WECs, a hinged twin-board designed WEC, utilizing an electrohydraulic PTO system with compressed energy storage is proposed, modeled, and experimentally validated. Initial test results showed that the derived models well predict the performance of the system, and the proposed PTO system with high pre-charge accumulator pressure can improve the peak electric output by up to 122 W. The two major conclusions derived from this combined simulation and experimental study are:
(1) Energy storage concept was proposed for the fluid-power-based PTO systems in a portable WEC. Simulation and experimental measurements demonstrated output power improvements of two to over 40 times, depending on the accumulator’s pre-charged pressure.
(2) A combined kinematic-fluid power model was derived, simulated, and experimentally validated for the proposed electrohydraulic PTO system, laying the ground work for future parametric studies.
Apart from the benefits of the proposed approach, the pressure rating of the original system and regulating of high flow rate are the two major challenges. In future work, through further optimization and experimental study, the combined effects of the rotation speed, accumulator volume, storage pressure, and the constraints of manufacturability, can be better evaluated to improve the output power of the PTO.

Author Contributions

Formal analysis, H.T. and Z.Z.; methodology, H.T.; validation, Z.Z. and Y.S.; writing, H.T.

Funding

This research was funded by National Natural Science Foundation of China, grant number 51705061, Key Laboratory for Precision and Non-traditional Machining of Ministry of Education, Dalian University of Technology, grant number JMTZ201703, and Fundamental Research Funds for the Central Universities, grant number 3132019121.

Conflicts of Interest

The authors declare no conflict of interest. The funders had no role in the design of the study; in the collection, analyses, or interpretation of data; in the writing of the manuscript, or in the decision to publish the results.

Appendix A. Derivation of the Power Loss on Leakage

Since the volumetric flow rate of the leakage cannot be directly measured, and usually only the system pressure can be obtained in an experimental system, the power loss on leakage based purely on the system pressure is derived as follows. Based on the lumped pressure dynamics in Equation (6), if we only consider leakage in the form of parallel plate flow ( q l = Δ p B c 3 12 μ L ) [24,25], then the leakage–pressure relationship is:
p ˙ = β e V Δ p B c 3 12 μ L = C 0 p
where μ is the viscosity of the fluid, L and B are the length and width of the leakage path, c is the hydrodynamic clearance height, and Δ p is the pressure differential across the leakage region Δ p = p , if gauge pressure is used. Then one can lump all the parameters except the gauge pressure into C 0 , arriving at a linear function of the rate of pressure change, p ˙ about p . Then the magnitude of C 0 can be obtained from the slope of the pressure drop in Figure 12.
Finally, the power loss due to leakage is the multiplication of the gauge pressure and the volumetric rate flow:
W H ˙ = C 1 p 2
where C 1 = V β e C 0 .
Based on the experimentally obtained pressure drop rate as a function of pressure, as in Figure A1, a rather linear relationship was found, confirming that the leakage is dominated by hydrodynamic clearance flow.
Figure A1. Experimental leakage measurement. Note that the linear least square fit of the experimental data showed the coefficient (C1) of the pressure drop rate with respect to the accumulator pressure is 0.0036 MPa/s per 1 MPa. Note, the regression performance value, R2, is 0.966.
Energies 12 03378 g0a1

References

  1. Wang, S.; Yuan, P.; Li, D.; Jiao, Y. An overview of ocean renewable energy in China. Renew. Sustain. Energy Rev. 2011, 15, 91–111. [Google Scholar] [CrossRef]
  2. Sheng, W. Wave energy conversion and hydrodynamics modelling technologies: A review. Renew. Sustain. Energy Rev. 2019, 109, 482–498. [Google Scholar] [CrossRef]
  3. Zhao, X.; Ning, D.; Zou, Q.; Qiao, D.; Cai, S. Hybrid floating breakwater-WEC system: A review. Ocean Eng. 2019, 186, 106126. [Google Scholar] [CrossRef]
  4. Rodríguez, C.A.; Rosa-Santos, P.; Taveira-Pinto, F. Assessment of damping coefficients of power take-off systems of wave energy converters: A hybrid approach. Energy 2019, 169, 1022–1038. [Google Scholar] [CrossRef]
  5. Jiang, X.; Day, S.; Clelland, D. Hydrodynamic responses and power efficiency analyses of an oscillating wave surge converter under different simulated PTO strategies. Ocean Eng. 2018, 170, 286–297. [Google Scholar] [CrossRef] [Green Version]
  6. Rodríguez, C.A.; Rosa-Santos, P.; Taveira-Pinto, F. Assessment of the power conversion of wave energy converters based on experimental tests. Energy Convers. Manag. 2018, 173, 692–703. [Google Scholar] [CrossRef]
  7. Reabroy, R.; Zheng, X.B.; Zhang, L.; Zang, J.; Yuan, Z.; Liu, M.Y.; Sun, K.; Tiaple, Y. Hydrodynamic response and power efficiency analysis of heaving wave energy converter integrated with breakwater. Energy Convers. Manag. 2019, 195, 1174–1186. [Google Scholar] [CrossRef]
  8. Zou, H.; Wang, M.; Tang, M.; Li, C.; Tian, C. Experimental investigation and performance analysis of a direct-driven linear generator. Energy Procedia 2017, 142, 284–290. [Google Scholar] [CrossRef]
  9. Dai, Y.; Chen, Y.; Xie, L. A study on a novel two-body floating wave energy converter. Ocean Eng. 2017, 130, 407–416. [Google Scholar] [CrossRef]
  10. Martinelli, L.; Zanuttigh, B.; Kofoed, J.P. Selection of design power of wave energy converters based on wave basin experiments. Renew. Energy 2011, 36, 3124–3132. [Google Scholar] [CrossRef]
  11. Lin, Z.; Zhang, Y. Dynamics of a mechanical frequency up-converted device for wave energy harvesting. J. Sound Vib. 2017, 367, 170–184. [Google Scholar] [CrossRef]
  12. Liermann, M.; Samhoury, O.; Atshan, S. Energy efficiency of pneumatic power take-off for wave energy converter. Int. J. Mar. Energy 2016, 13, 62–79. [Google Scholar] [CrossRef]
  13. Do, H.-T.; Dinh, Q.-T.; Nguyen, M.-T.; Phan, C.-B.; Dang, T.-D.; Lee, S.; Park, H.-G.; Ahn, K.K. Proposition and experiment of a sliding angle self-tuning wave energy converter. Ocean Eng. 2017, 132, 1–10. [Google Scholar] [CrossRef]
  14. Truong, D.Q.; Ahn, K.K. Development of a novel point absorber in heave for wave energy conversion. Renew. Energy 2014, 65, 183–191. [Google Scholar] [CrossRef]
  15. Crowley, S.; Porter, R.; Taunton, D.; Wilson, P.; Taunton, D.; Wilson, P. Modelling of the WITT wave energy converter. Renew. Energy 2018, 115, 159–174. [Google Scholar] [CrossRef]
  16. Yu, H.-F.; Zhang, Y.-L.; Zheng, S.-M. Numerical study on the performance of a wave energy converter with three hinged bodies. Renew. Energy 2016, 99, 1276–1286. [Google Scholar] [CrossRef]
  17. Sheng, L.; Zhou, Z.; Charpentier, J.; Benbouzid, M. Stand-alone island daily power management using a tidal turbine farm and an ocean compressed air energy storage system. Renew. Energy 2017, 103, 286–294. [Google Scholar] [CrossRef] [Green Version]
  18. Wilkinson, L.; Whittaker, T.J.T.; Thies, P.R.; Day, A.; Ingram, D. The power-capture of a nearshore, modular, flap-type wave energy converter in regular waves. Ocean Eng. 2017, 137, 394–403. [Google Scholar] [CrossRef]
  19. Thorburn, K.; Bernhoff, H.; Leijon, M. Wave energy transmission system concepts for linear generator arrays. Ocean Eng. 2004, 31, 1339–1349. [Google Scholar] [CrossRef]
  20. Wang, Y.; Wang, L. Towards realistically predicting the power outputs of wave energy converters: Nonlinear simulation. Energy 2018, 144, 120–128. [Google Scholar] [CrossRef]
  21. Li, P.Y.; Loth, E.; Qin, C.; Simon, T.W.; Van de Ven, J.D. Open Accumulator Isothermal Compressed Air Energy Storage (OA-ICAES) System. In Energy Storage Handbook; Wiley Publishing: Hoboken, NJ, USA, 2018. [Google Scholar]
  22. Erdman, A.G.; Sandor, G.N.; Kota, S. Introduction to Dynamics of Mechanisms. In Mechanism Design: Analysis and Synthesis, 4th ed.; Pearson: Boston, MA, USA, 2001; pp. 279–329. [Google Scholar]
  23. Cho, B.B.H.; Lee, H.H.W.; Oh, J.S.J. Estimation technique of air content in automatic transmission fluid by measuring effective bulk modulus. Int. J. Automot. Technol. 2002, 3, 57–61. [Google Scholar]
  24. Tian, H. Study of Active Valve Timing on Efficient Hydraulic Piston Motor Operations. Ph.D. Thesis, Department of Mechanical Engineering, University of Minnesota, Twin Cities, Minneapolis, MN, USA, 2016. [Google Scholar]
  25. Cengel, Y.A.; Turner, R.H.; Cimbala, J.M. External flow: Drag and lift. In Fundamentals of Thermal-Fluid Sciences, 3rd ed.; McGraw-Hill: New York, NY, USA, 2008; pp. 581–584. [Google Scholar]
  26. Ashtonn, I.G.C.; Johanning, L. On errors in low frequency wave measurements from wave buoy. Ocean Eng. 2015, 95, 11–22. [Google Scholar] [CrossRef]
Figure 1. An overview of the proposed wave energy converter (WEC) with an electrohydraulic power take-off (PTO) system. 1: Piston rod; 2: Hydraulic piston pump; 3: Electric circuit (battery, control, etc.); 4: Electric generator; 5: Hydraulic motor; 6: Digital on-off valve; and 7: Hydraulic accumulator. Note the wave length of the surface wave is much longer than that of the buoy, and the buoy is assumed to follow the heaving motion of the wave.
Energies 12 03378 g001
Figure 2. Mechanism kinematics of the proposed WEC.
Energies 12 03378 g002
Figure 3. Free body diagrams for the piston and rocker link of the proposed wave absorption mechanism.
Energies 12 03378 g003
Figure 4. Simulink block diagram for dynamic simulation of the electrohydraulic circuit. Note the electrical generator is emulated by a user-defined “generator module,” which contains a rotary inertia, a rotational damper, and friction. The motor shaft motion works as the input. The resultant angular velocity and the torque are the outputs.
Energies 12 03378 g004
Figure 5. Circuit diagram of the experimental system. Note: T represents the torque transducer; G is the electric generator; E is the rotary encoder; and U, V, and W are the three winding coils of the generator.
Energies 12 03378 g005
Figure 6. A photo of the WEC core components testbed. A: Laser displacement sensor; B: Manual single cylinder piston pump; C: Compressed nitrogen gas accumulator; D: Torque transducer; E: Gerotor motor; F: Rotary encoder; G: Three-phase 12 V electric generator; H: Three-phase full-wave bridge rectifier; I: Load resistors; J: Solenoid on-off valve; K: Oil reservoir.
Energies 12 03378 g006
Figure 7. Piston pump input trajectory. Note that there are 50 pumping cycles in total.
Energies 12 03378 g007
Figure 8. A comparison between the dynamic pressure simulation and the experiment results when the accumulator is pre-charged to 3 MPa, 6.6 MPa, and 15 MPa. Note the simulation takes piston displacement as input and output is the accumulator pressure.
Energies 12 03378 g008
Figure 9. Simulated and experimental results on the hydraulic output power: (a) Accumulator pre-charged to 15 MPa and released at 21 MPa; (b) accumulator pre-charged to 6.6 MPa and released at 10 MPa; (c) accumulator pre-charged to 3 MPa and released at 4 MPa; and (d) accumulator pre-charged to 3 MPa and released at 4 MPa, but with an adjusted rotational damping coefficient from 0.50 Nm/(rad/s) to 0.20 Nm/(rad/s).
Energies 12 03378 g009aEnergies 12 03378 g009b
Figure 10. Simulated and experimental results on the hydraulic output power when the accumulator is pre-charged to 3 MPa and is always connected to the motor (i.e., the digital on-off valve is kept energized the entire time during the experiment): (a) Full 50-cycle comparison, and (b) zoomed-in 4-cycle result timed from 2 s to 7 s for clarity.
Energies 12 03378 g010
Figure 11. Calculated rotational angular velocity (dotted line) and translational velocity (solid line) of Link 2. Note the translational velocity has been smoothed by a moving window with a width of 2001 data points.
Energies 12 03378 g011
Figure 12. Calculated averaged power of the proposed PTO using experimental data. Note the magnitudes of the averaged power are shown in a semi-logarithmic plot for clarity. The averaged outputs of electrical power for the four cases are 1.3 W, 5.0 W, 20.6 W, and 60.2 W.
Energies 12 03378 g012
Figure 13. Simulated averaged power under realistic wave input. Note the time series of surface elevations data was recorded by a wave buoy at the South West UK, on 18 March 2010, 15:00, published in [26]. The peak frequency of the wave is 0.05 Hz and the maximum amplitude is 5 m. A saturation operation was applied to the wave trajectory to limit input to piston displacement between 0 mm and 25 mm. Additionally, a total duration of 430 s of data was used so that 50 completed piston input cycles were achieved to match that of Figure 12. The averaged output electrical power of the four cases are 0.5 W, 7.3 W, 20.2 W, and 69.1 W.
Energies 12 03378 g013
Table 1. Mechanism parameters.
SymbolParameter DefinitionValueUnit
m 2 mass of link 233.6kg
m 3 mass of link 30.2kg
I 2 moment of inertia of link 20.14kgm2
I 3 moment of inertia of link 30.10kgm2
| h | length of ground link23mm
| r 20 | maximum length of link 234mm
Table 2. Simulation parameters for the block diagram.
Simulation ParametersValueUnit
Simulation duration100s
SolverODE15s
Piston area1 × 10−4m2
Piston stroke (nominal)0.025m
Bulk modulus1.4GPa
Entrained air vol. fraction0.02
Moment of inertia of motor0.05kgm2
Rotary damping coefficient0.5Nm/rad/s
Crack pressure (check valve)7kPa
Accumulator volume0.5L
Table 3. Equations set to calculate the experimental averaged power.
DescriptionEquationUnit
Heaving input 1 Δ t p A p r 3 ˙ d t W
Hydraulic motor output 1 Δ t T m ω m d t W
Electric output 1 Δ t i L 2 R L d t W
Note: T m and ω m are the measured torque and angular velocity at the hydraulic motor shaft, and i L and R L are the load current and resistance, respectively. Since the heaving input is simulated through the operation of the manual pump, the equation in the first line is equivalent to Equation (11).

