Reliability Assessment of Distribution Networks with Optimal Coordination of Distributed Generation, Energy Storage and Demand Management


Abstract
:1. Introduction
- The effects of DGs, energy storage and dispatchable loads are jointly modelled in the proposed methodology for reliability assessment. The resources are comprehensively represented in a unique model, including:
- Renewable and conventional DGs.
- Uncertainties of generation and demand, because their chronological fluctuations.
- Dispatchable and non-dispatchable loads. Dispatchable loads are formed of several portions or levels of load shedding.
- Priorities in the restoration of loads or portions of loads.
- Chronological relationship and uncertainties in the level of state-of-charge (SOC) of the storage.
- Optimisation is applied to model the coordination of the resources with an aim to improve the reliability of the system. The following formulations are proposed for this purpose:
- A mixed integer linear optimisation problem is proposed, in order to obtain the optimal solution and reduce the computation burden. Minimisation of the energy-not-supplied to critical customers during faults is sought.
- An analytical approach is used for efficient evaluation of the reliability indices. As the literature shows, the analytical approach demands less computation resources than the alternative Monte Carlo simulation [25]. However, note that the optimisation problem can be easily adapted to Monte Carlo simulation, if necessary.
- Monthly and hourly variations of demand and generation are modelled in compliance with the analytical formulation. Their chronological dependencies are properly modelled for the accurate evaluation of the the optimal coordination.
- Additional operational alternatives not yet considered by existing reliability assessment methodologies are modelled and studied, including: more than one interruption during a fault, coordination of non-dispatchable and dispatchable loads with demand-control levels, and possible hourly constraints for energy storage operation. The effect of these criteria in the reliability calculation is evaluated.
- Comparative and sensitivity studies can be readily performed by using the proposed algorithm and applied to calculate the consequences of the resources and parameters modelled in a very complex reliability assessment. The impact of optimal coordinated restoration, energy storage size, number and levels of dispatchable loads, and more than one interruption per fault, among others, is evaluated and critically analysed in this work.
2. Problem Definition and Solution Proposed
2.1. Problem Definition
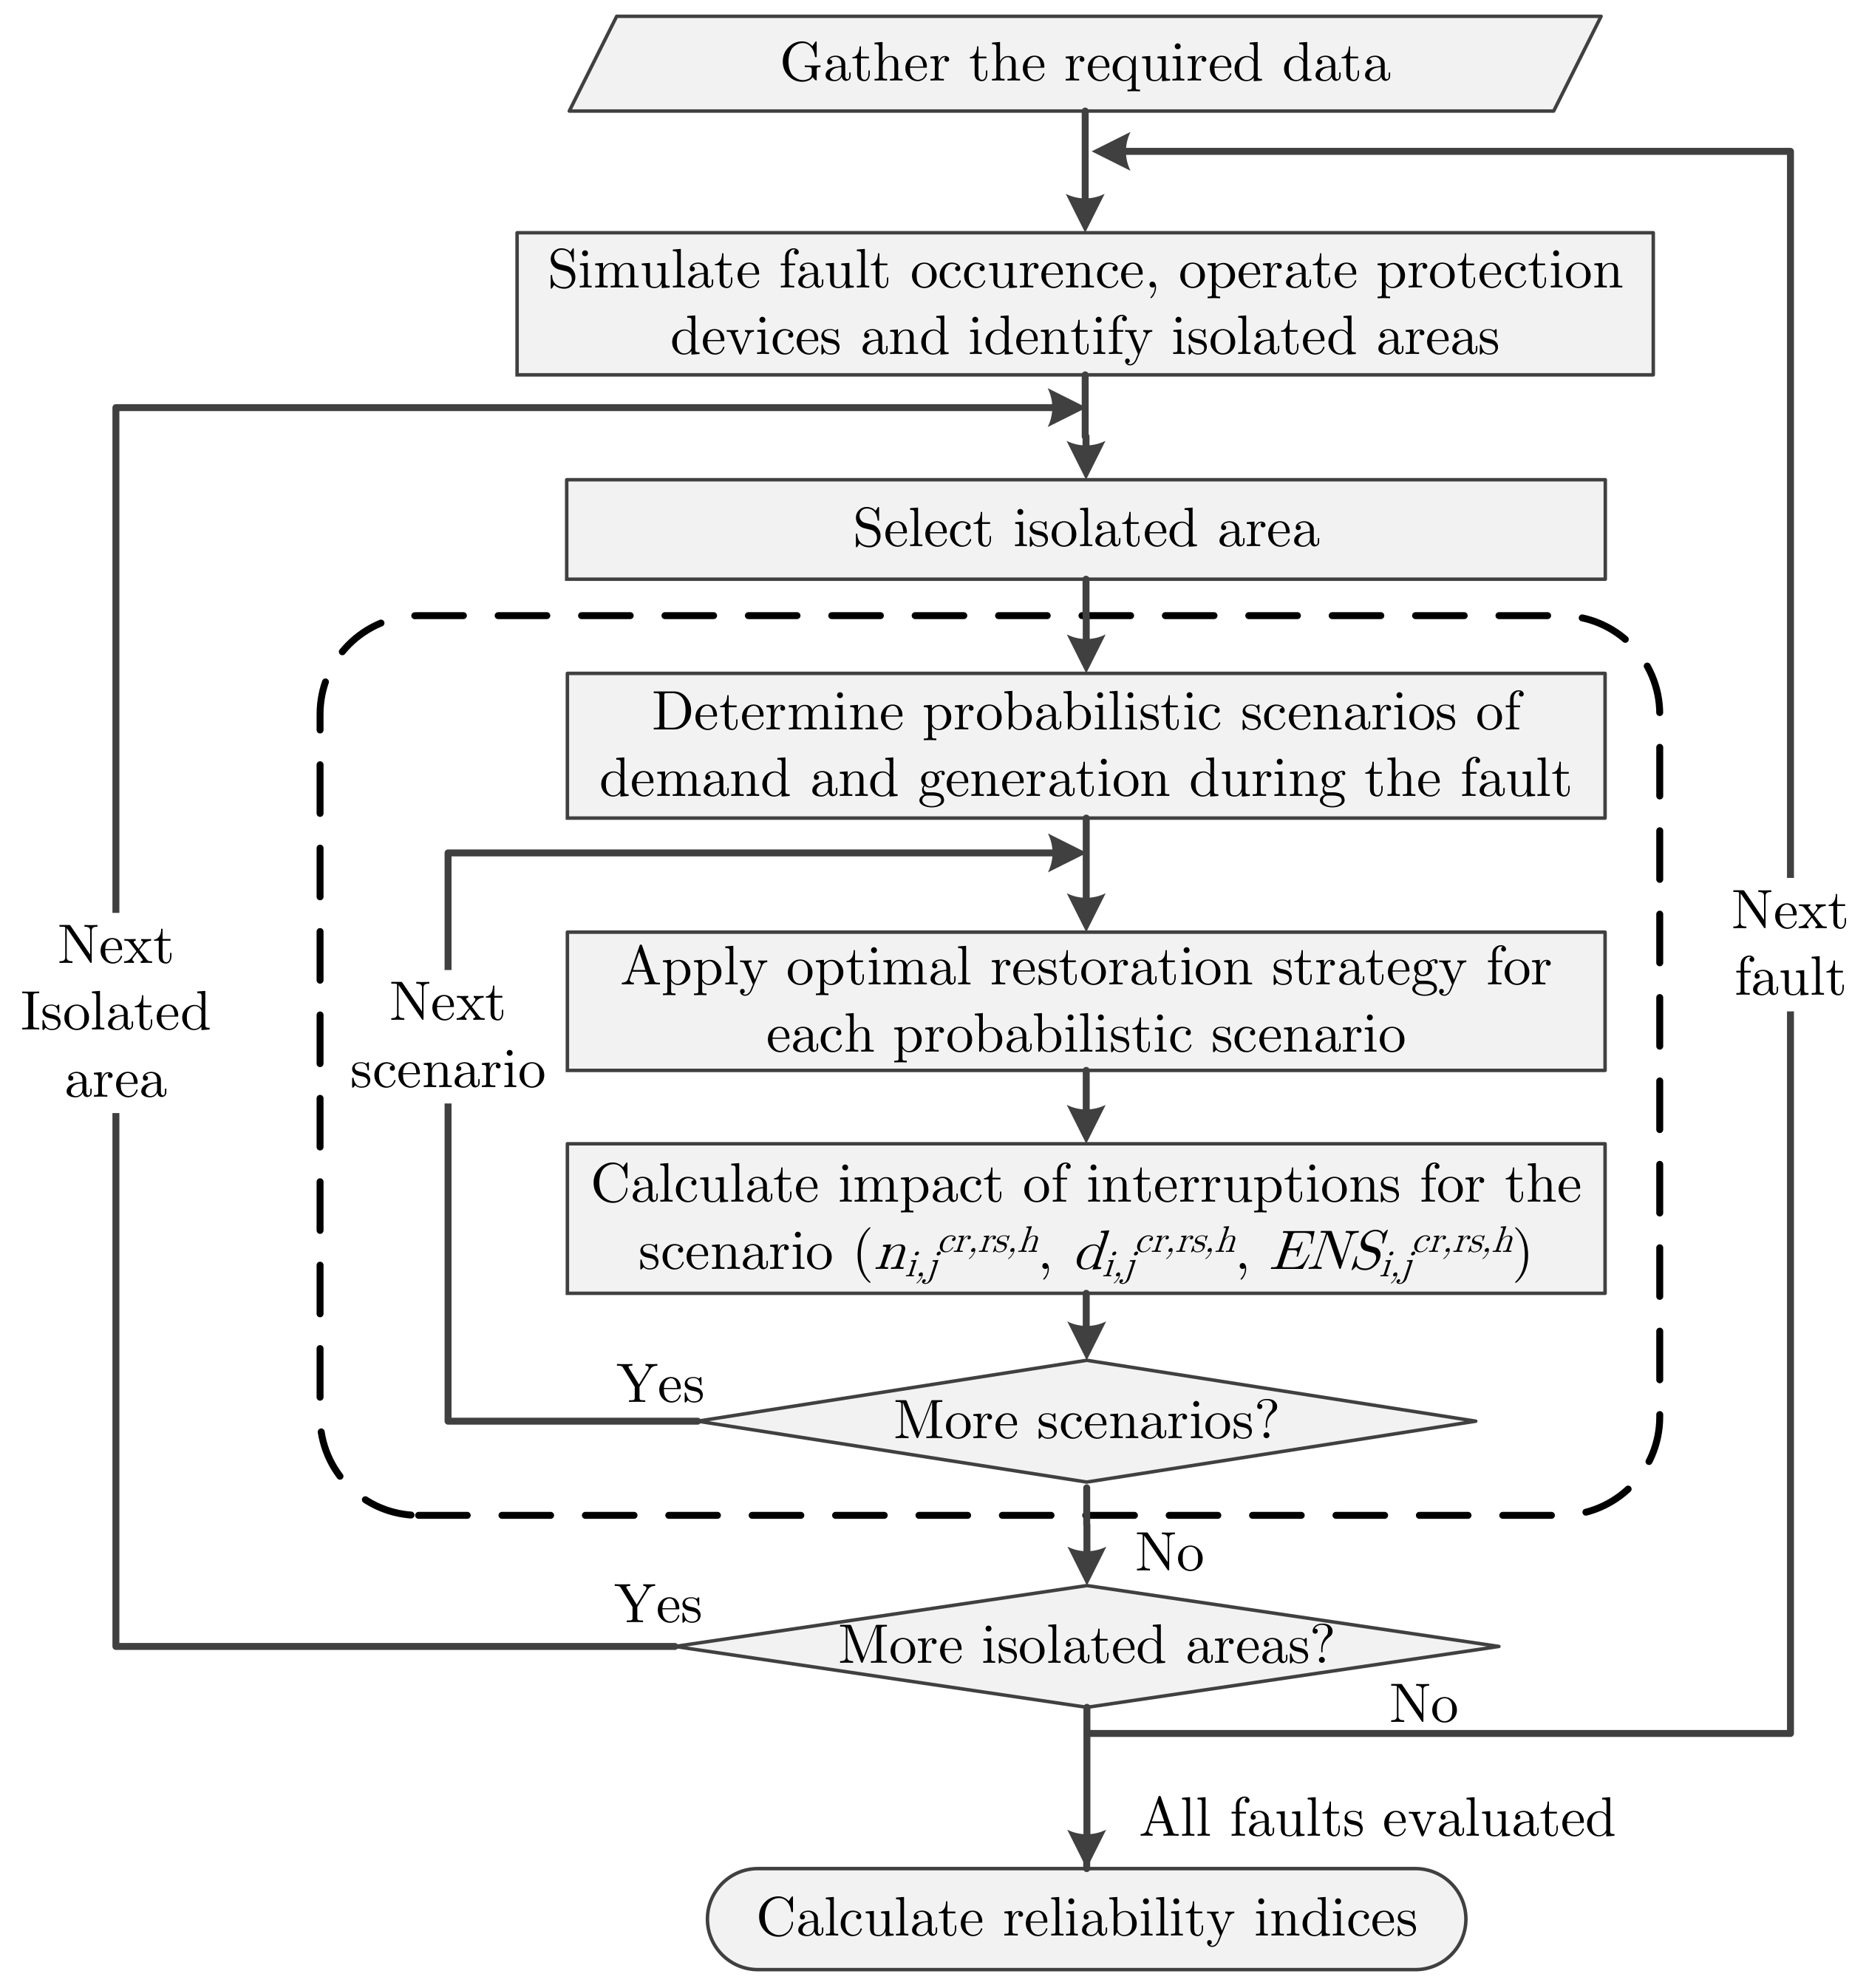
2.2. Overview of the Proposed Method
3. Reliability Indices Calculation
3.1. Load Points without Islanded Restoration
3.2. Load Points with Islanded Restoration
4. Renewable Generation and Demand Modelling
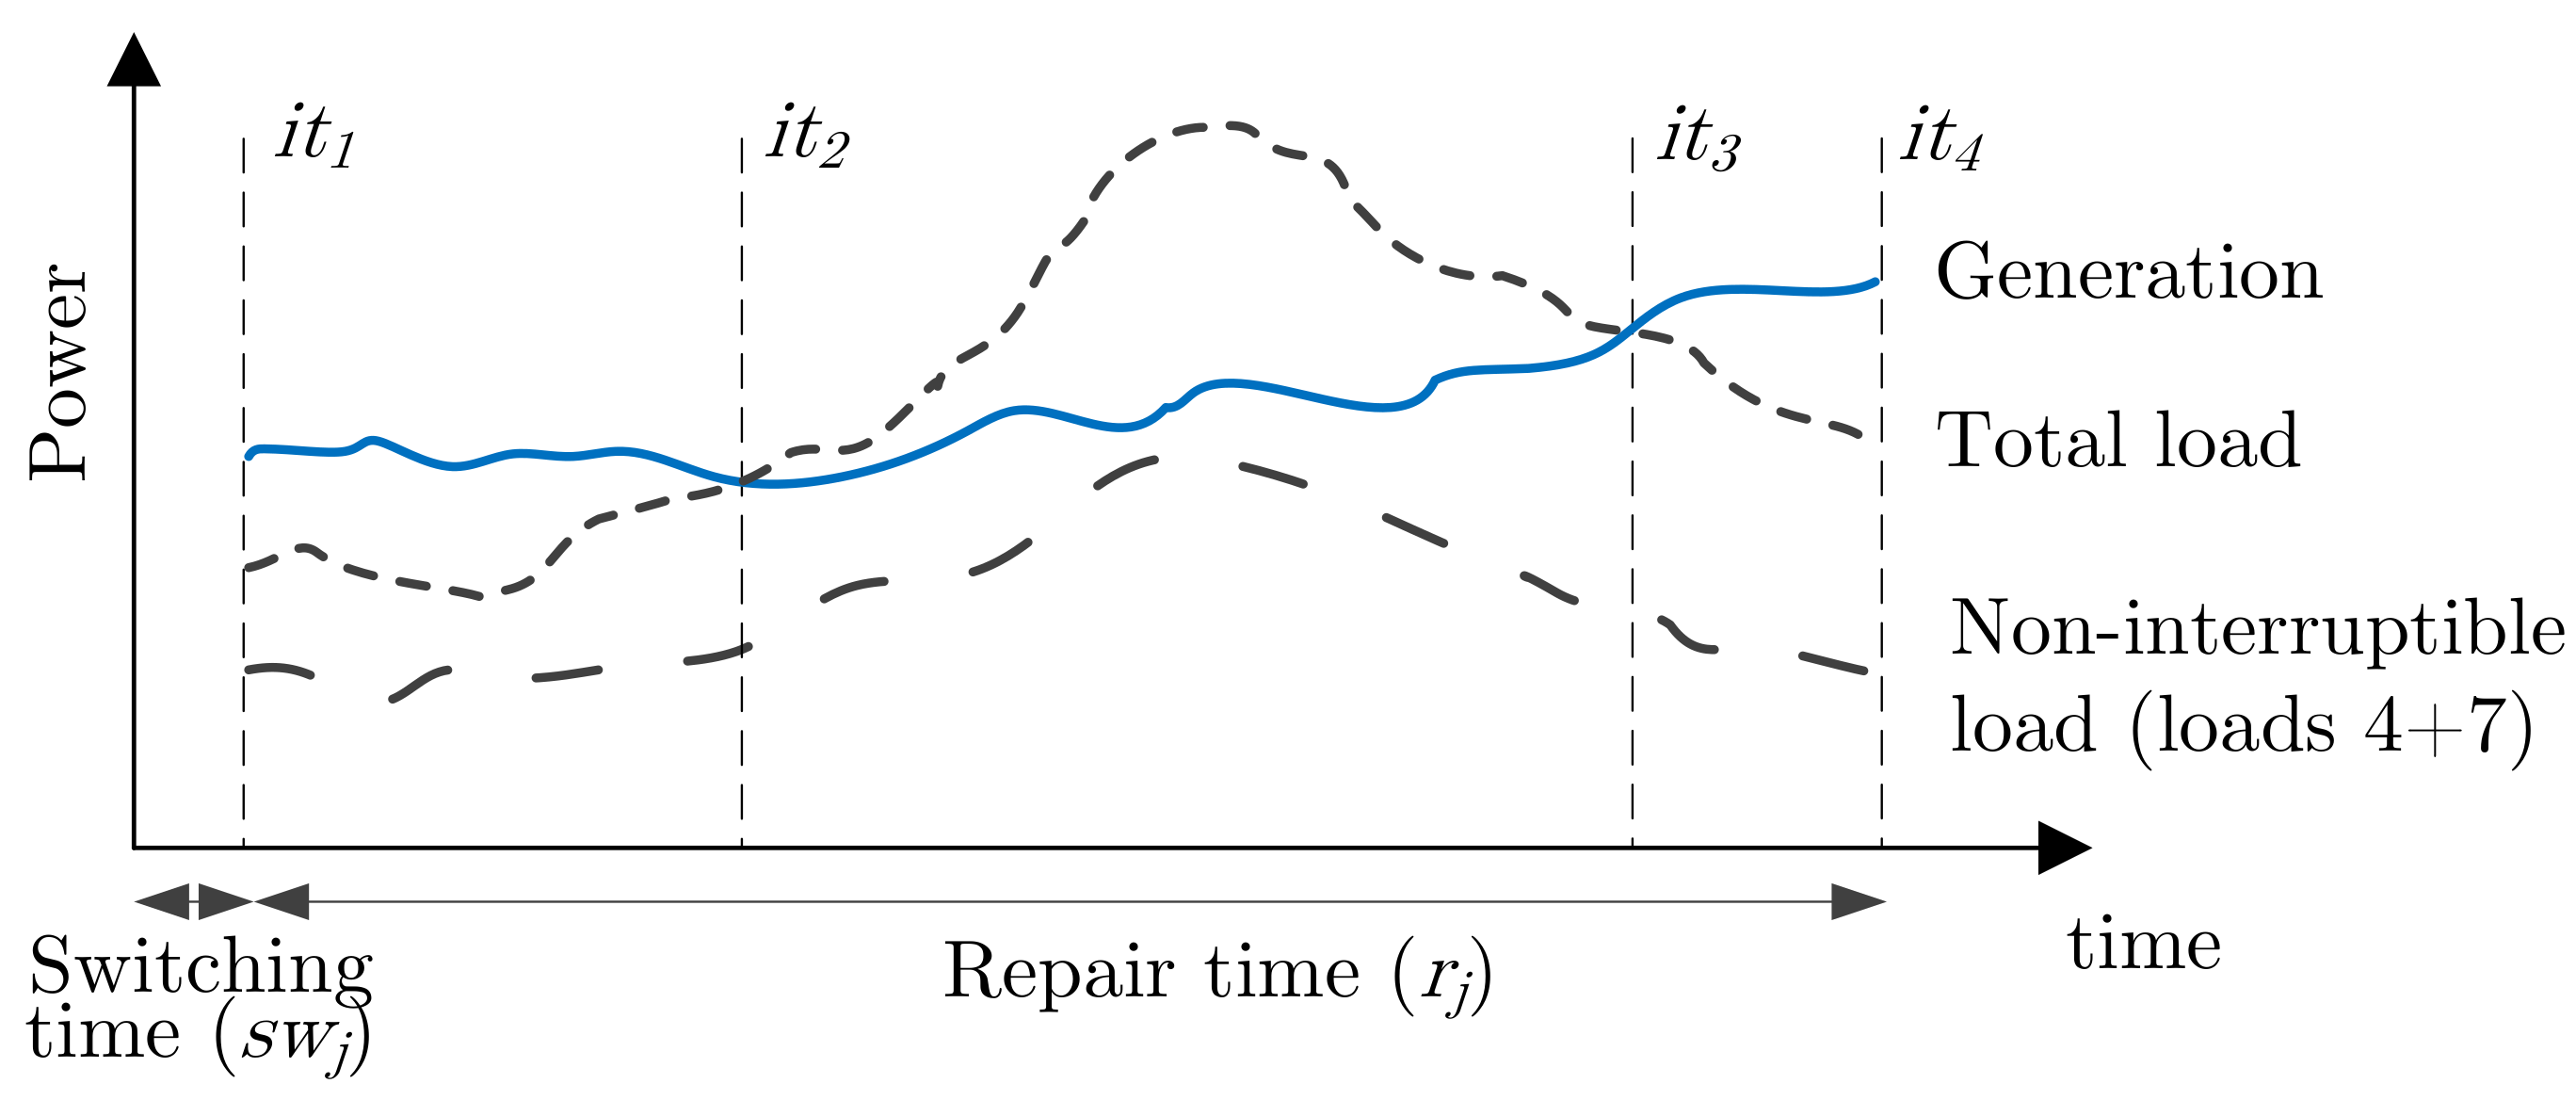
4.1. Generation and Demand Profiles During Outages
4.2. Scenarios Calculation
- The period of one year is divided into representative time-intervals, for example, one day per month. Typical profiles of renewable generation and demand are obtained for these time-intervals as in Reference [21]. Moreover, typical profiles of SOC are included assuming normal operating conditions (they can be obtained from real data or by using algorithms [33]).
- Different profiles of generation and demand are obtained during an outage. These profiles are taken from the typical profiles defined in (1) by assuming that the analysed fault may occur at any time-step of the representative time-interval. These profiles are assigned to the load points and renewable DGs in an isolated area. Moreover, the SOC in that time-step is assigned to each storage device representing its values when the fault occurs.
- Probabilistic states of the DGs and storage devices in the isolated area are created as in Reference [21]. Each device has two possible states, up and down, that are combined for all the devices in the area resulting in a set of probabilistic states.
- Generation profiles in (2) are combined with the devices states in (3) to obtain the generation-demand scenarios used in the reliability evaluation. Their annual probability is determined as:
5. Modelling Optimal Restoration in Reliability Assessment
5.1. Impact of the Interruptions
5.1.1. Non-Dispatchable Load Points
5.1.2. Dispatchable Load Points
5.2. Equality and Inequality Constraints
5.2.1. Adequacy Assessment
5.2.2. Energy Storage
5.2.3. Load Shedding
5.2.4. Number of Interruptions during a Fault
5.3. Optimisation Problem
6. CaseStudy
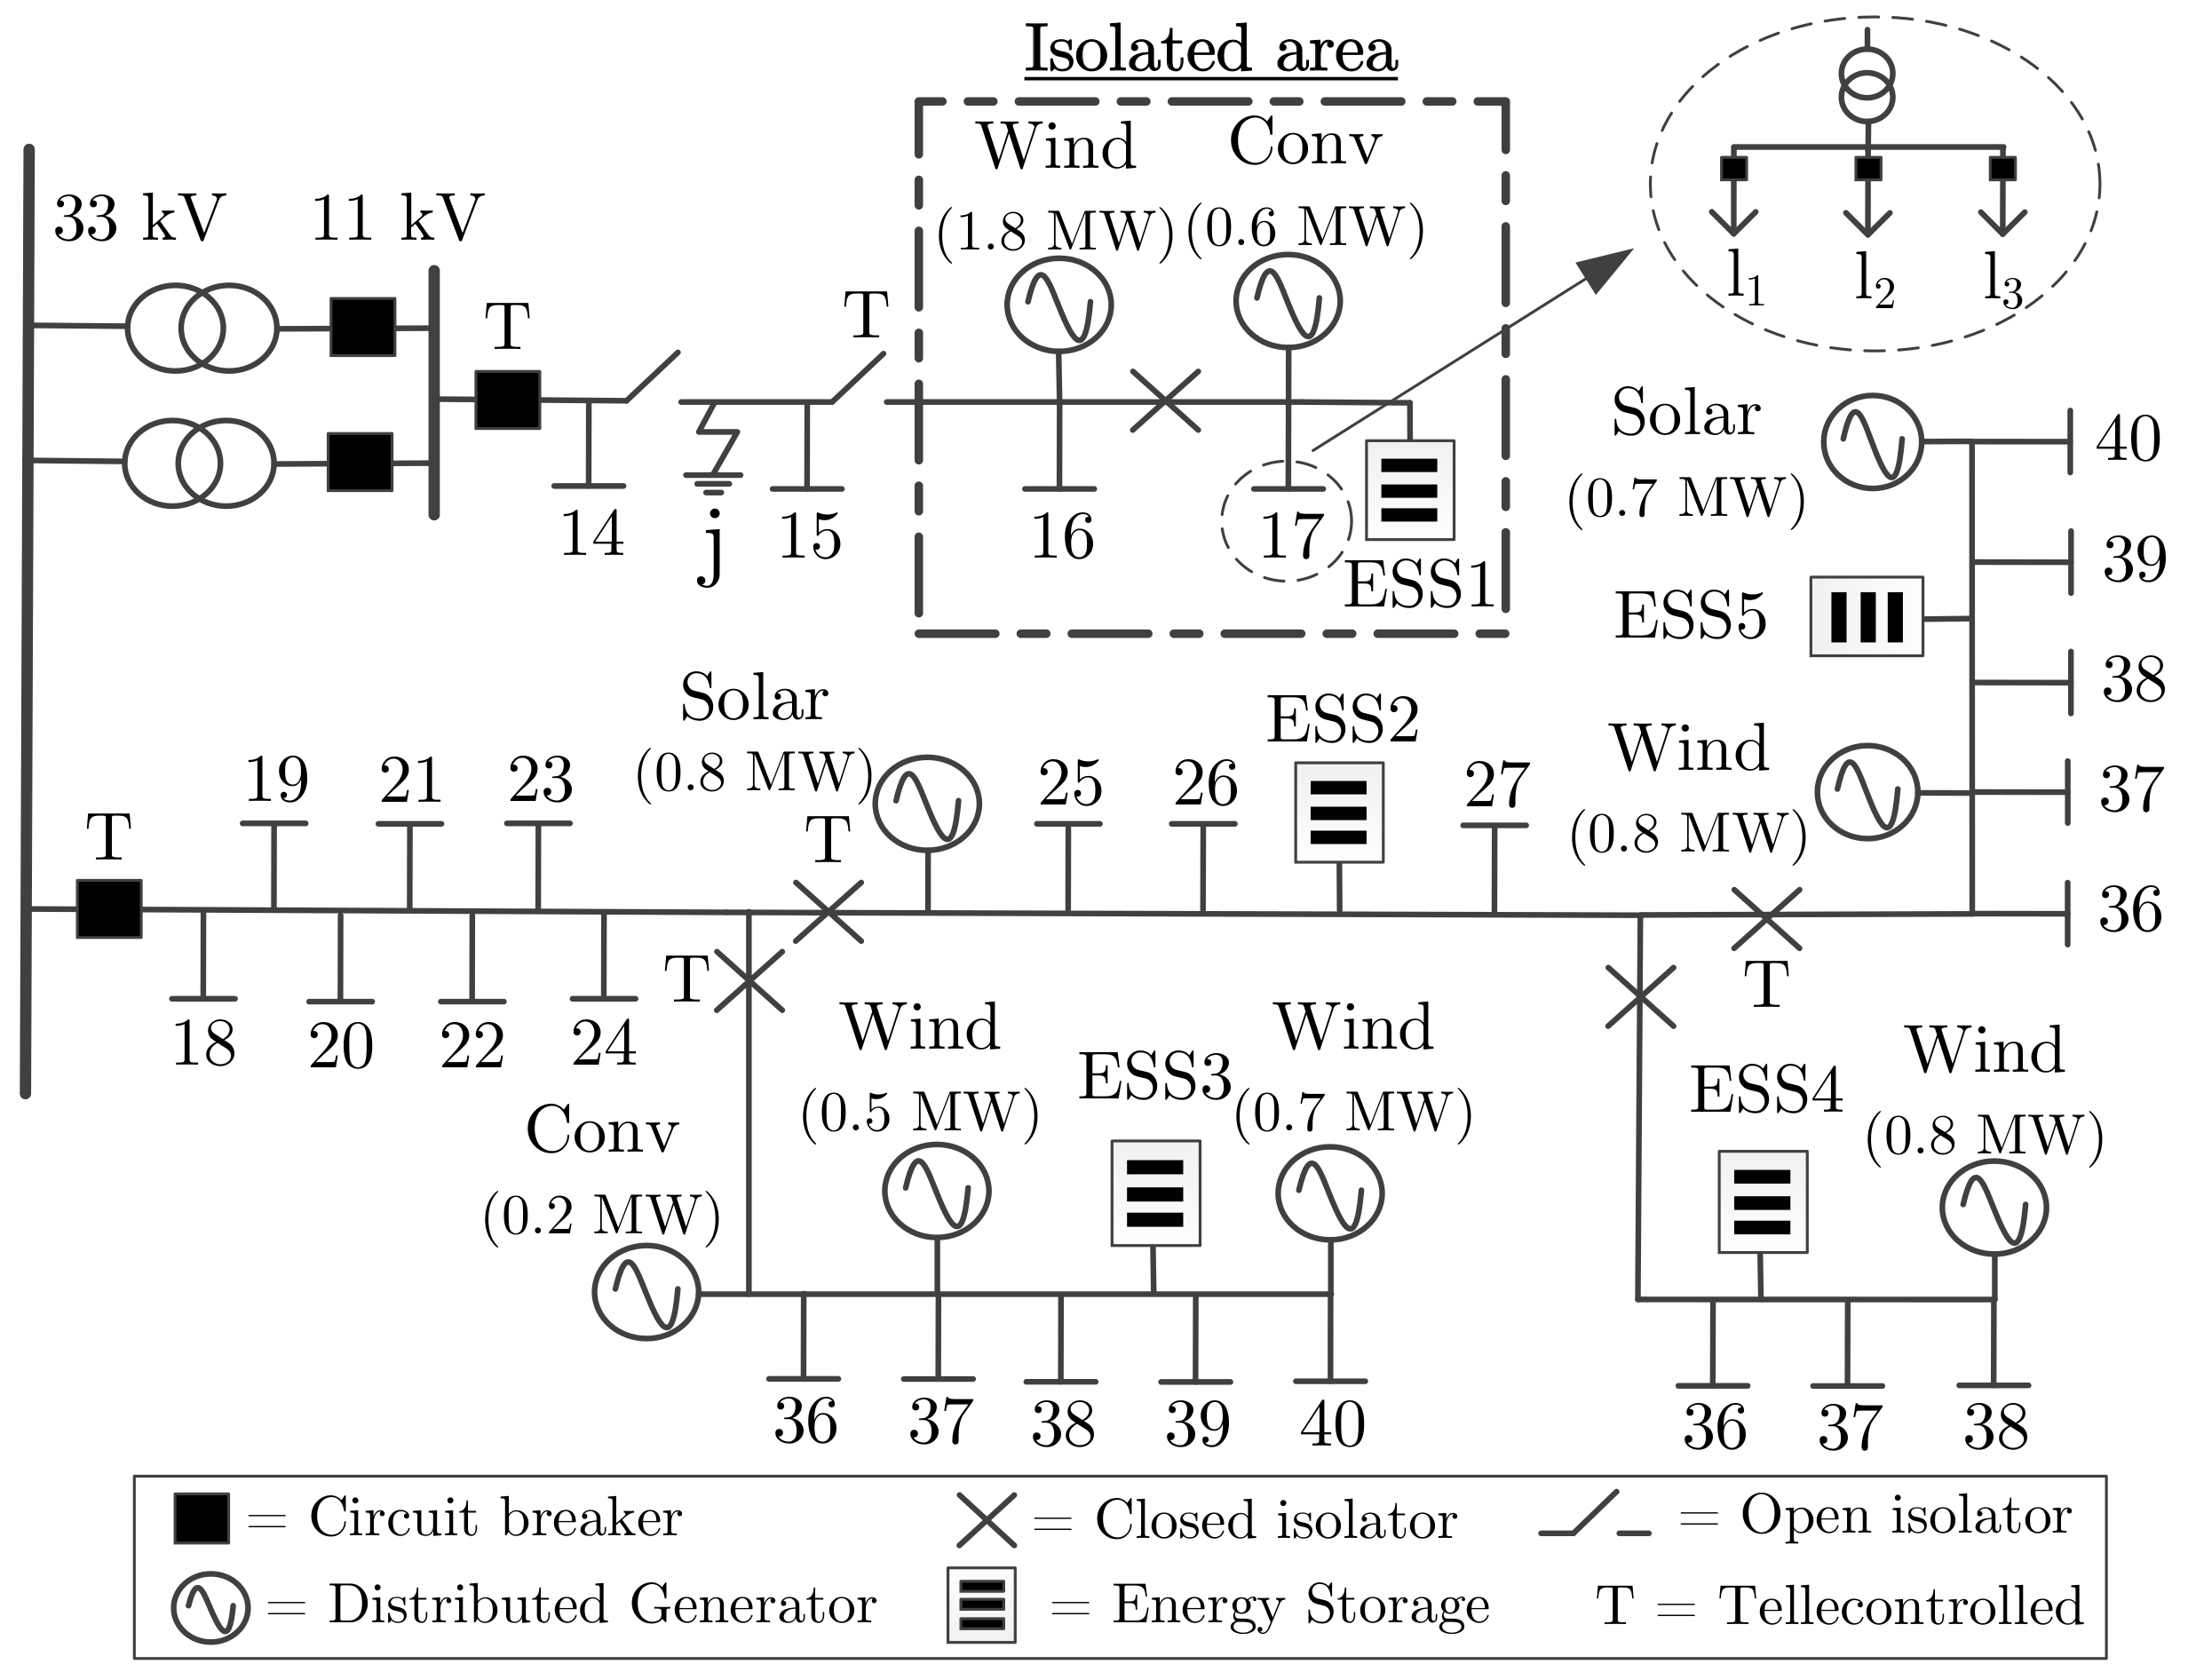
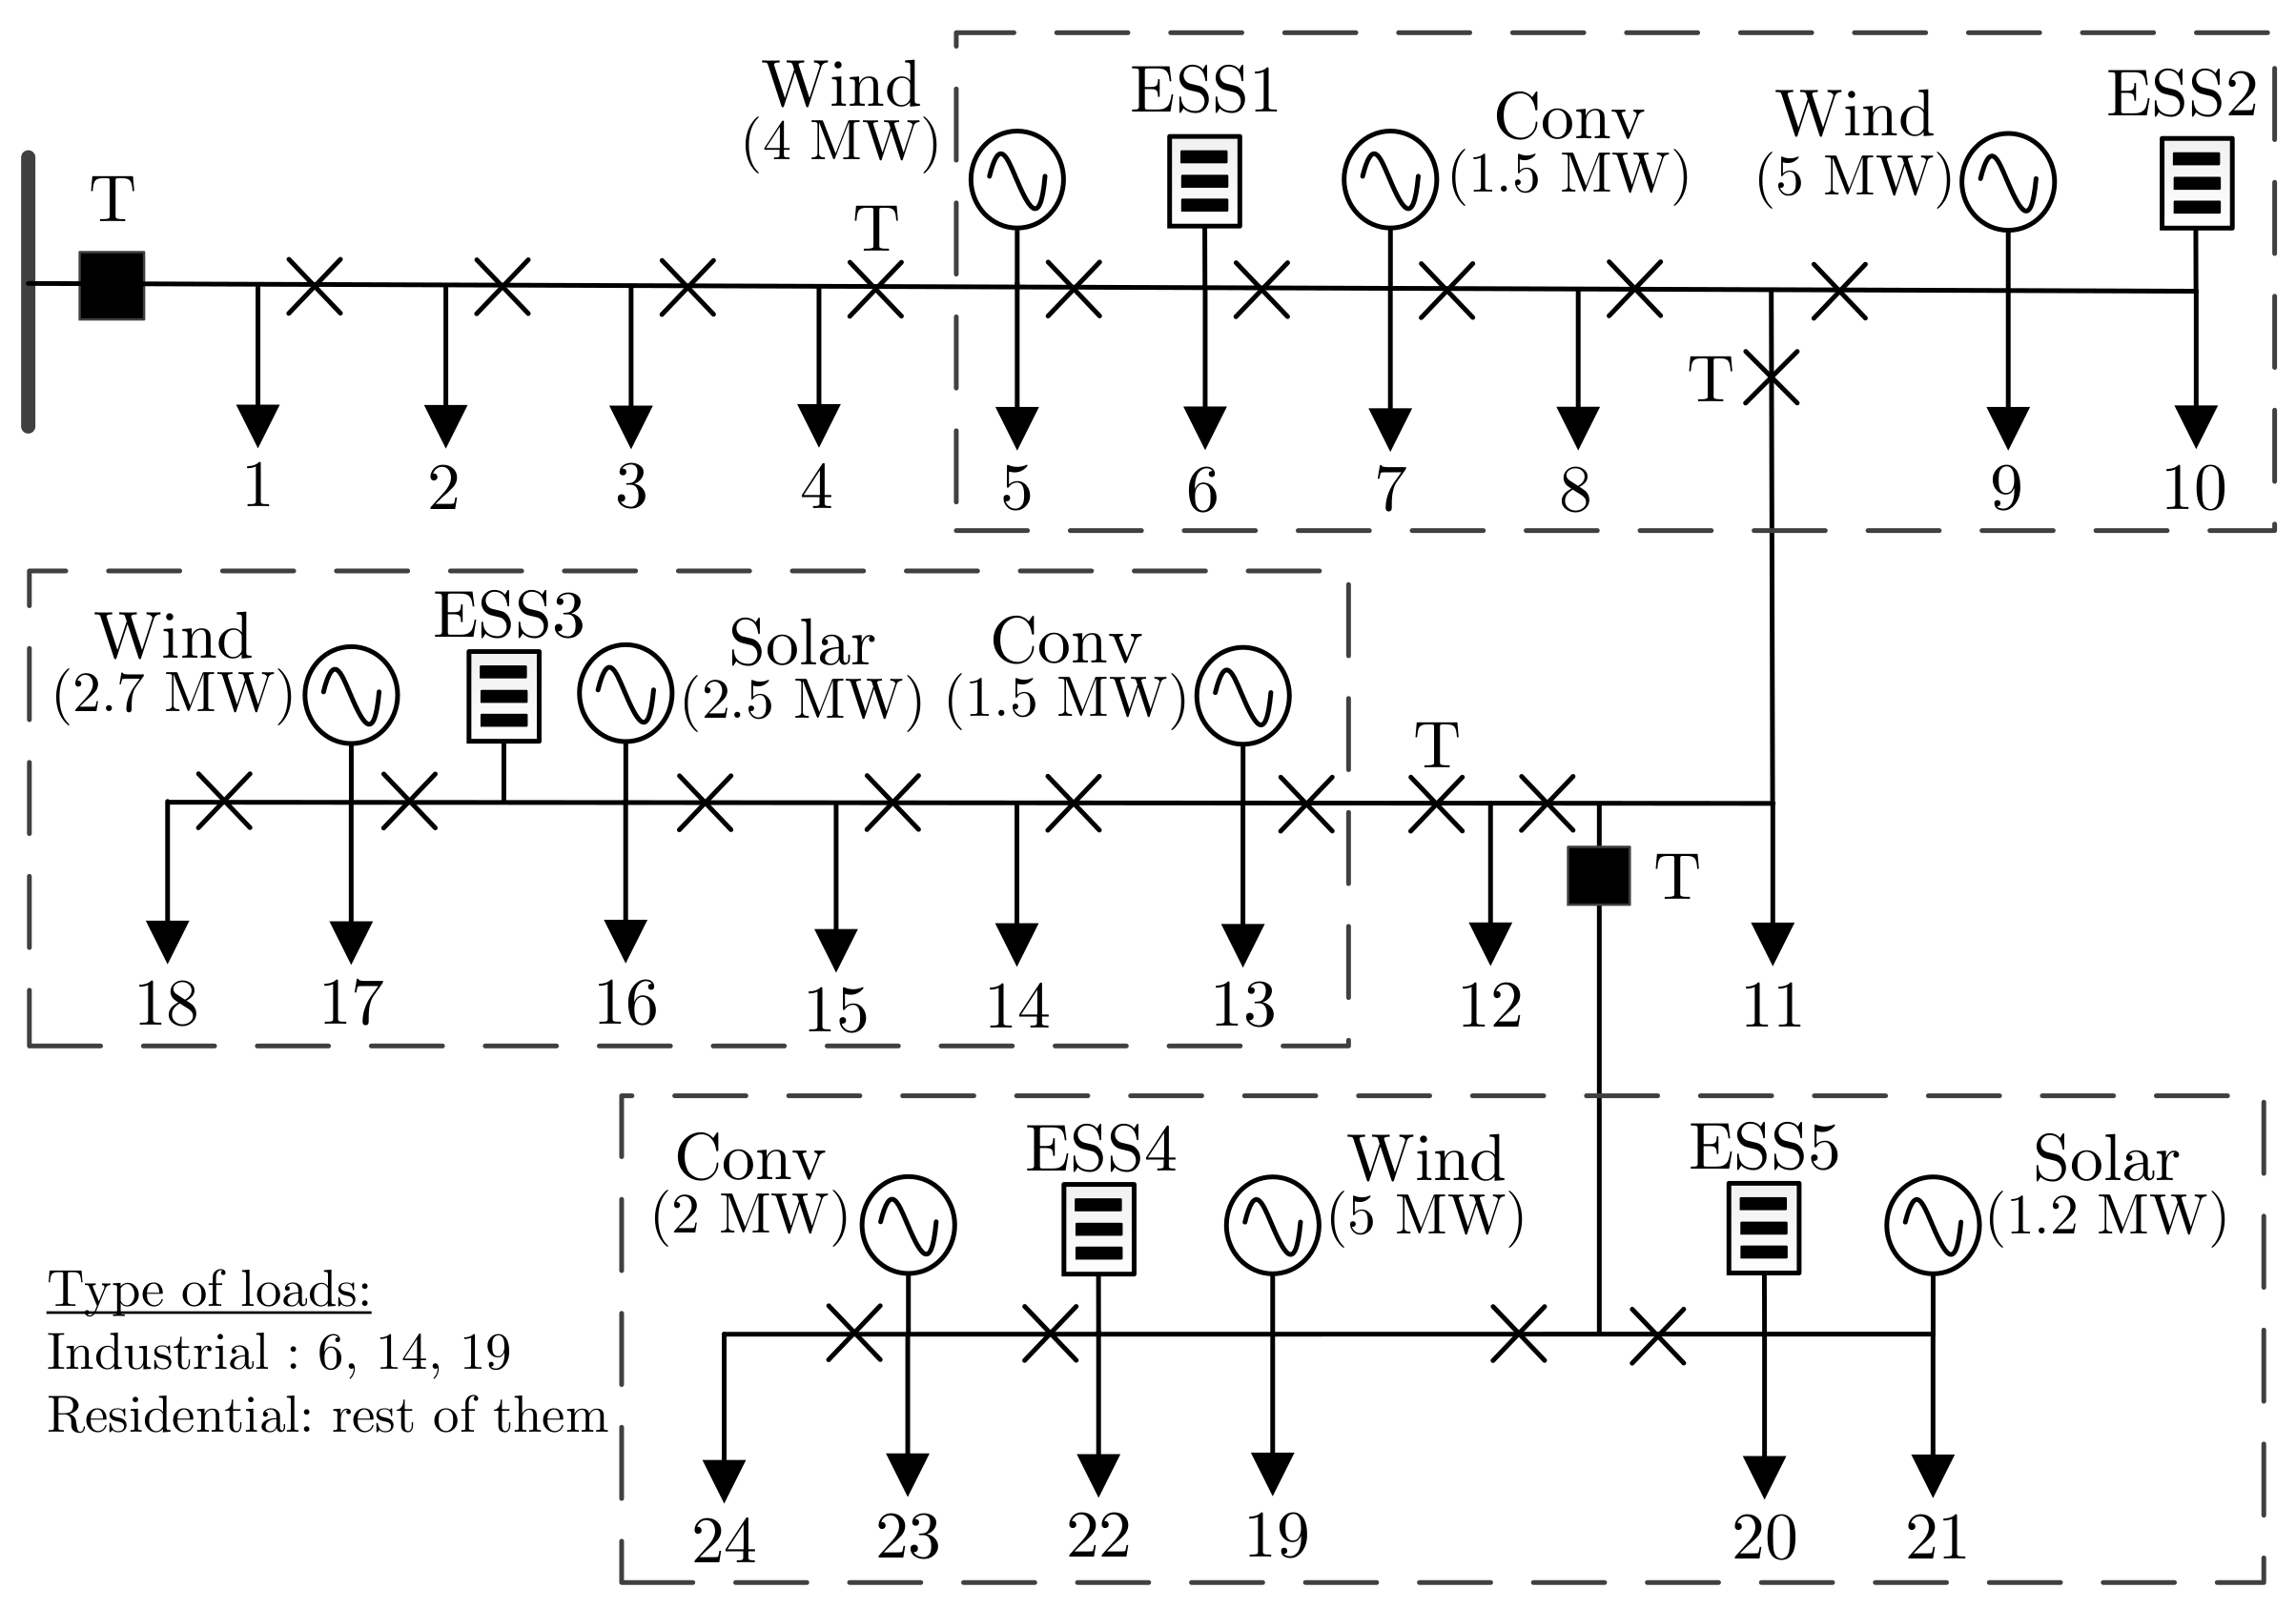
6.1. Test Network
- DG and Load Shedding (DG+LS): the load shedding functionality was added to the case DG only. Except in Section 6.4, all the results were obtained for a scenario with low level of dispatchable loads, and for one level of load shedding in these loads. The priority factors per customer type ( and ) were 10 for commercial/industrial, 1.9 for small/residential and 0.5 for farms. The types of customers are specified in Reference [34] and in Figure 4.
- DG, Energy Storage and Load Shedding (DG+ESS+LS): the three resources were coordinated and optimally operated for the selective restoration of the isolated areas.
6.2. Test Comparison
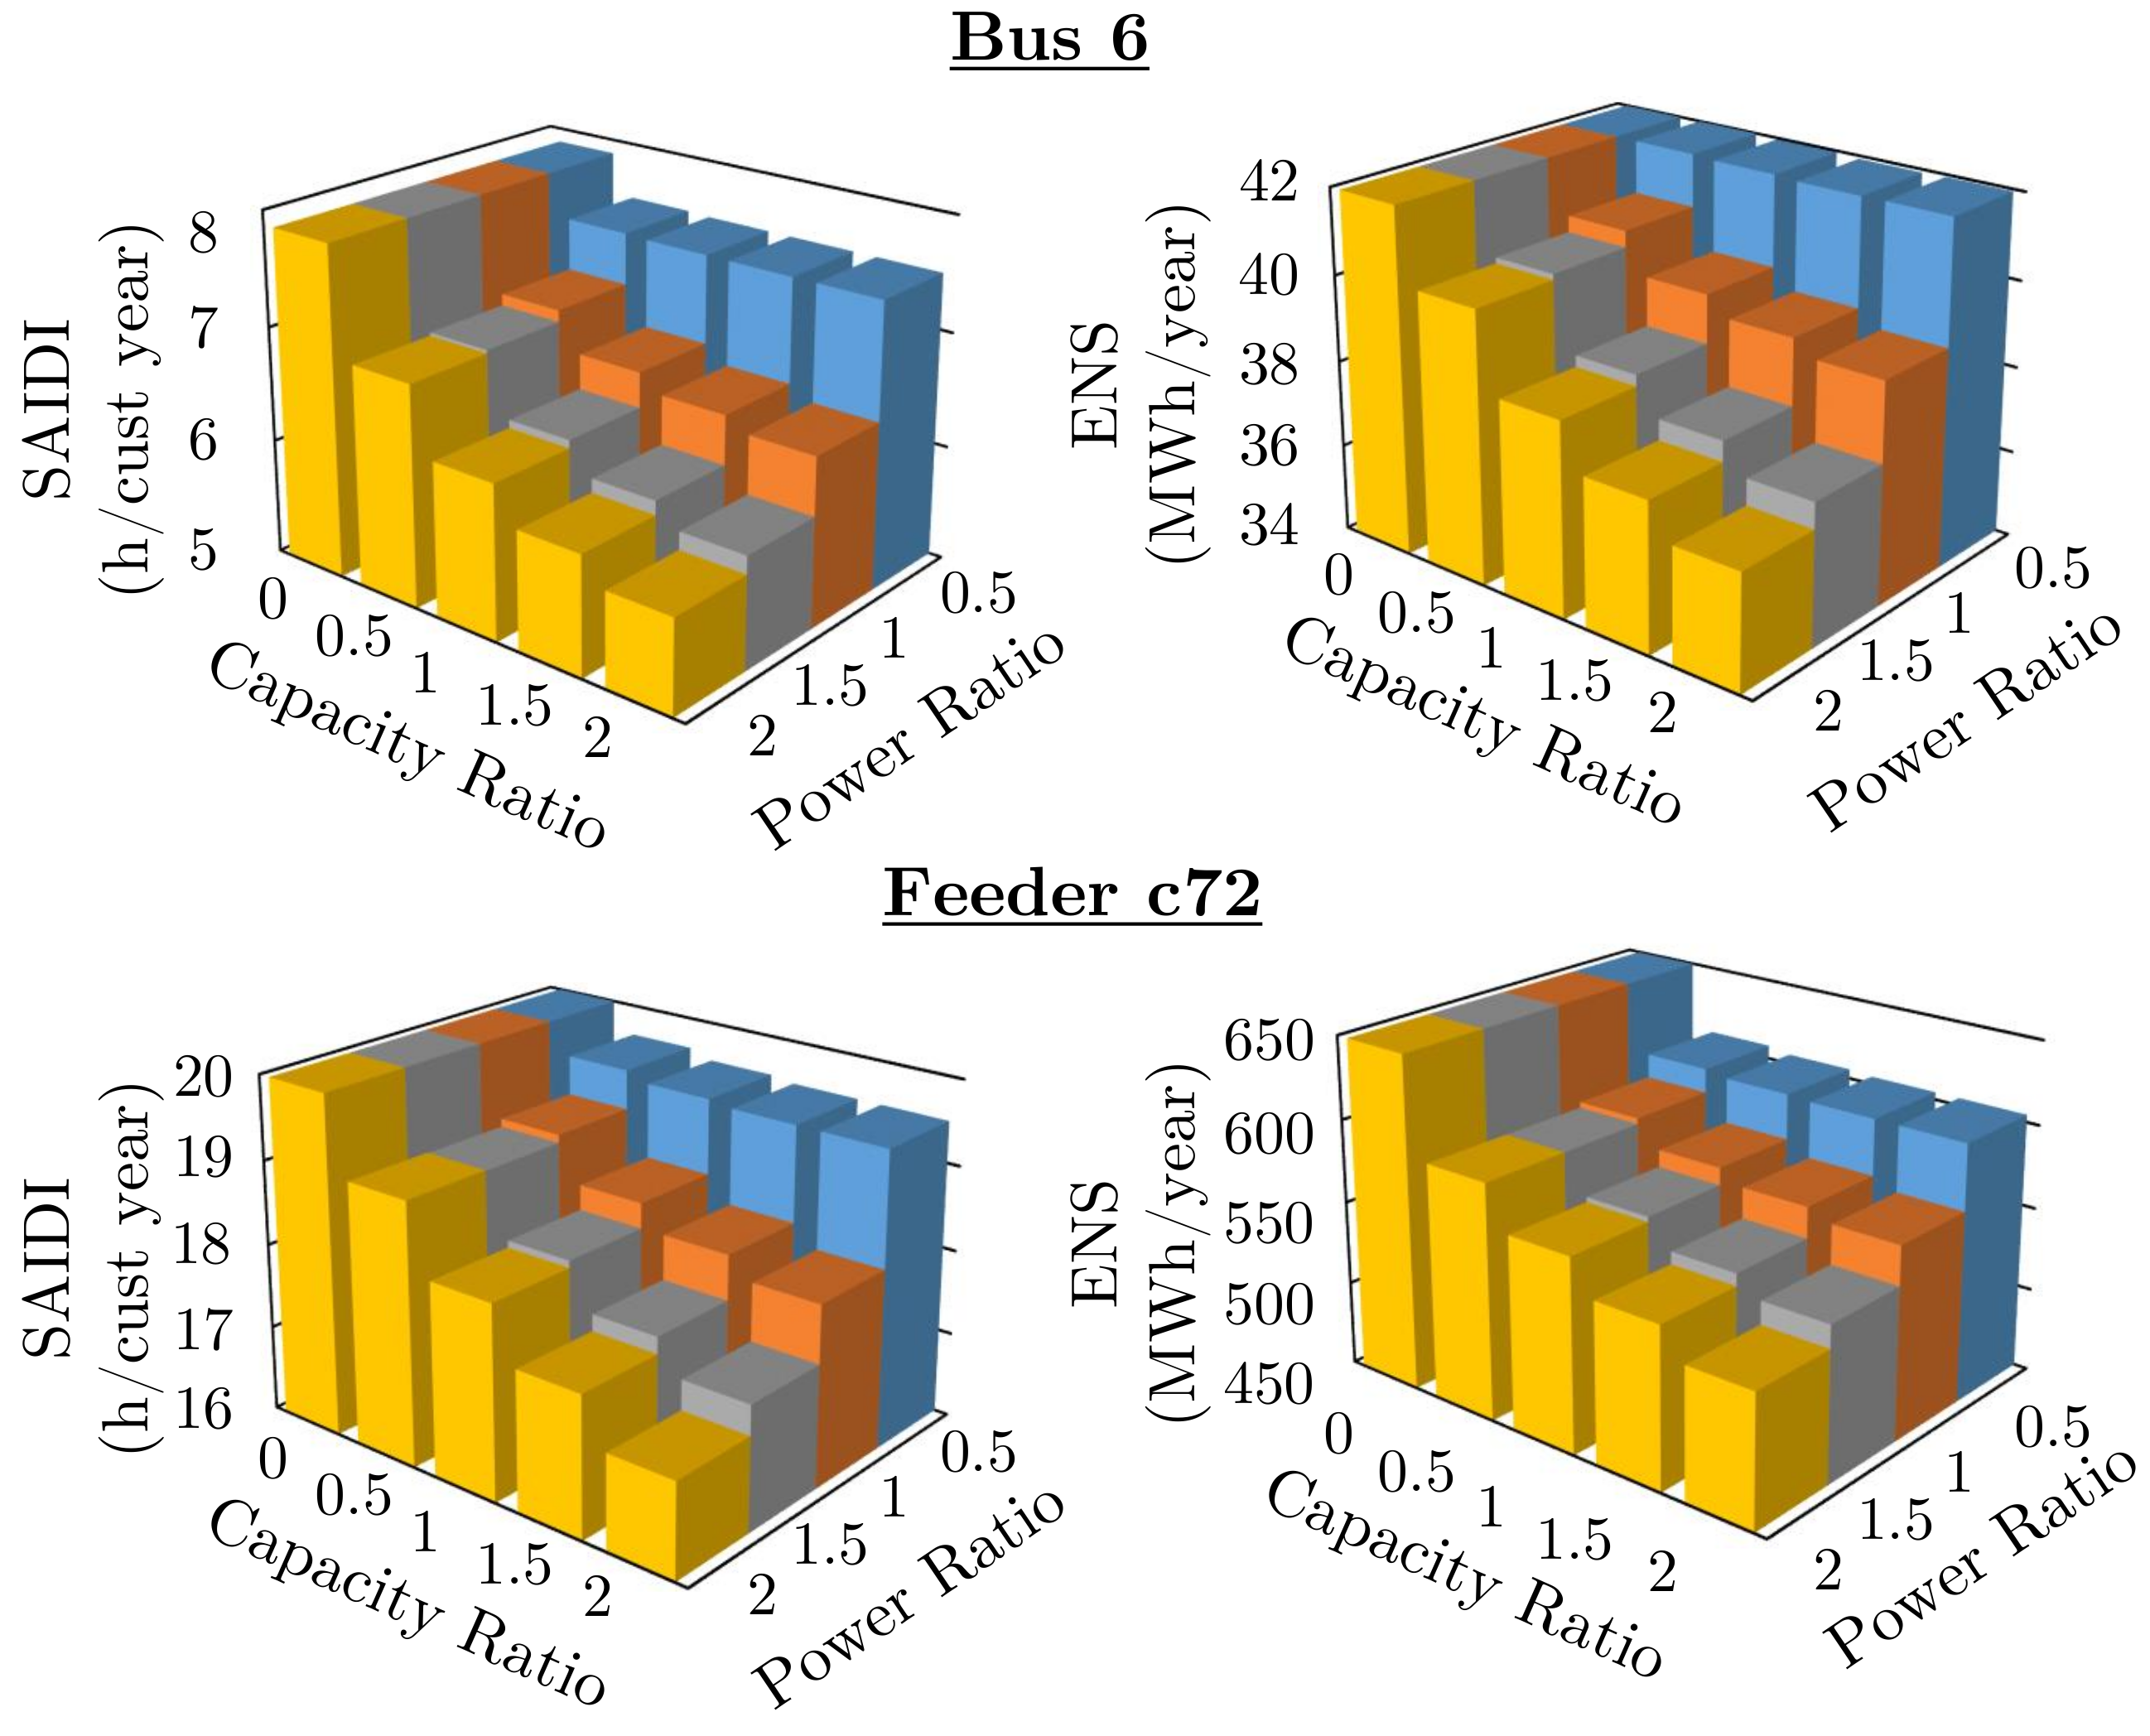
6.3. Energy Storage Size Analysis
6.4. Load Shedding Analysis
6.5. Analysis of the Number of Interruptions
7. Conclusions
Author Contributions
Funding
Conflicts of Interest
References
- Allan, R.; Billinton, R. Probabilistic assessment of power systems. Proc. IEEE 2000, 88, 140–162. [Google Scholar] [CrossRef]
- Billinton, R.; Ali, S.; Wacker, G. Rural distribution system reliability worth evaluation using individual customer outage cost characteristics. Int. J. Electr. Power Energy Syst. 2004, 26, 235–240. [Google Scholar] [CrossRef]
- Shang, Y. Resilient Multiscale Coordination Control against Adversarial Nodes. Energies 2018, 11, 1844. [Google Scholar] [CrossRef]
- Shang, Y. Resilient consensus of switched multi-agent systems. Syst. Control. Lett. 2018, 122, 12–18. [Google Scholar] [CrossRef]
- The Need for a Fundamental Review of Electricity Networks Reliability Standards; ETP SG Security And Resilience Task Force, 2016. Available online: https://www.etip-snet.eu/wp-content/uploads/2017/04/ETP_SG_Future_Network_Reliability_Standards_2016.pdf (accessed on 19 August 2019).
- Nigim, K.A.; Hegazy, Y.G. Intention islanding of distributed generation for reliability enhancement. In Proceedings of the 2003 IEEE Power Engineering Society General Meeting (IEEE Cat. No. 03CH37491), Toronto, ON, Canada, 13–17 July 2003; Volume 4, p. 2451. [Google Scholar]
- Arya, R.; Choube, S.; Arya, L. Reliability evaluation and enhancement of distribution systems in the presence of distributed generation based on standby mode. Int. J. Electr. Power Energy Syst. 2012, 43, 607–616. [Google Scholar] [CrossRef]
- Escalera, A.; Hayes, B.; Prodanović, M. A survey of reliability assessment techniques for modern distribution networks. Renew. Sustain. Energy Rev. 2018, 91, 344–357. [Google Scholar] [CrossRef]
- Zhou, Y.; Mancarella, P.; Mutale, J. Modelling and assessment of the contribution of demand response and electrical energy storage to adequacy of supply. Sust. Energy Grids Netw. 2015, 3, 12–23. [Google Scholar] [CrossRef]
- Billinton, R.; Allan, R. Reliability Evaluation of Power Systems, 2nd ed.; Plenum: New York, NY, USA, 1996. [Google Scholar]
- Atwa, Y.M.; El-Saadany, E.F. Reliability Evaluation for Distribution System With Renewable Distributed Generation During Islanded Mode of Operation. IEEE Trans. Power Syst. 2009, 24, 572–581. [Google Scholar] [CrossRef]
- Bie, Z.; Zhang, P.; Li, G.; Hua, B.; Meehan, M.; Wang, X. Reliability Evaluation of Active Distribution Systems Including Microgrids. IEEE Trans. Power Syst. 2012, 27, 2342–2350. [Google Scholar] [CrossRef]
- Al-Muhaini, M.; Heydt, G.T. Evaluating Future Power Distribution System Reliability Including Distributed Generation. IEEE Trans. Power Deliv. 2013, 28, 2264–2272. [Google Scholar] [CrossRef]
- Zou, K.; Agalgaonkar, A.P.; Muttaqi, K.M.; Perera, S. An Analytical Approach for Reliability Evaluation of Distribution Systems Containing Dispatchable and Nondispatchable Renewable DG Units. IEEE Trans. Smart Grid 2014, 5, 2657–2665. [Google Scholar] [CrossRef]
- Escalera, A.; Prodanović, M.; Castronuovo, E.D.; Mazuera, J.C. A Comparison of The Renewable Distributed Generation Models used in Reliability Assessment. In Proceedings of the 2018 IEEE International Conference on Probabilistic Methods Applied to Power Systems (PMAPS), Boise, ID, USA, 24–28 June 2018; pp. 1–6. [Google Scholar]
- Conti, S.; Nicolosi, R.; Rizzo, S.A. Generalized Systematic Approach to Assess Distribution System Reliability with Renewable Distributed Generators and Microgrids. IEEE Trans. Power Deliv. 2012, 27, 261–270. [Google Scholar] [CrossRef]
- Wang, S.; Li, Z.; Wu, L.; Shahidehpour, M.; Li, Z. New Metrics for Assessing the Reliability and Economics of Microgrids in Distribution System. IEEE Trans. Power Syst. 2013, 28, 2852–2861. [Google Scholar] [CrossRef]
- Chen, C.; Wu, W.; Zhang, B.; Singh, C. An Analytical Adequacy Evaluation Method for Distribution Networks Considering Protection Strategies and Distributed Generators. IEEE Trans. Power Deliv. 2015, 30, 1392–1400. [Google Scholar] [CrossRef]
- Xu, Y.; Singh, C. Adequacy and Economy Analysis of Distribution Systems Integrated With Electric Energy Storage and Renewable Energy Resources. IEEE Trans. Power Syst. 2012, 27, 2332–2341. [Google Scholar] [CrossRef]
- Narimani, A.; Nourbakhsh, G.; Ledwich, G.; Walker, G. Optimum electricity purchase scheduling for aggregator storage in a reliability framework for rural distribution networks. Int. J. Electr. Power Energy Syst. 2018, 94, 363–373. [Google Scholar] [CrossRef]
- Escalera, A.; Prodanović, M.; Castronuovo, E.D. Analytical methodology for reliability assessment of distribution networks with energy storage in islanded and emergency-tie restoration modes. Int. J. Electr. Power Energy Syst. 2019, 107, 735–744. [Google Scholar] [CrossRef]
- Farzin, H.; Fotuhi-Firuzabad, M.; Moeini-Aghtaie, M. Stochastic Energy Management of Microgrids During Unscheduled Islanding Period. IEEE Trans. Ind. Inform. 2017, 13, 1079–1087. [Google Scholar] [CrossRef]
- Moeini-Aghtaie, M.; Farzin, H.; Fotuhi-Firuzabad, M.; Amrollahi, R. Generalized Analytical Approach to Assess Reliability of Renewable-Based Energy Hubs. IEEE Trans. Power Syst. 2017, 32, 368–377. [Google Scholar] [CrossRef]
- Wang, P.; Li, W. Reliability evaluation of distribution systems considering optimal restoration sequence and variable restoration times. IET Gener. Transm. Distrib. 2007, 1, 688–695. [Google Scholar] [CrossRef]
- Billinton, R.; Wang, P. Teaching distribution system reliability evaluation using Monte Carlo simulation. IEEE Trans. Power Syst. 1999, 14, 397–403. [Google Scholar] [CrossRef]
- Safdarian, A.; Degefa, M.Z.; Lehtonen, M.; Fotuhi-Firuzabad, M. Distribution network reliability improvements in presence of demand response. IET Gener. Transm. Distrib. 2014, 8, 2027–2035. [Google Scholar] [CrossRef]
- Farzin, H.; Fotuhi-Firuzabad, M.; Moeini-Aghtaie, M. Role of Outage Management Strategy in Reliability Performance of Multi-Microgrid Distribution Systems. IEEE Trans. Power Syst. 2018, 33, 2359–2369. [Google Scholar] [CrossRef]
- Hamzah, B.N. Islanded Operation of Distribution Networks; Technical Report; Distributed Generation Coordinating Group (DGCG), 2005. Available online: www.distributedgeneration.gov.uk (accessed on 16 August 2019).
- Allan, R.N.; Billinton, R.; Sjarief, I.; Goel, L.; So, K.S. A reliability test system for educational purposes-basic distribution system data and results. IEEE Trans. Power Syst. 1991, 6, 813–820. [Google Scholar] [CrossRef]
- Ćurčić, S.; Ozveren, C.S.; Crowe, L.; Lo, P. Electric power distribution network restoration: A survey of papers and a review of the restoration problem. Electr. Power Syst. Res. 1995, 35, 73–86. [Google Scholar] [CrossRef]
- Chowdhury, A.; Koval, D. Power Distribution System Reliability: Practical Methods and Applications; John Wiley & Sons, Inc.: Hoboken, NJ, USA, 2009. [Google Scholar]
- IEEE Guide for Electric Power Distribution Reliability Indices, IEEE Std 1366, 2001 ed.; IEEE: Piscataway, NJ, USA, 2001.
- Macedo, L.H.; Franco, J.F.; Rider, M.J.; Romero, R. Optimal Operation of Distribution Networks Considering Energy Storage Devices. IEEE Trans. Smart Grid 2015, 6, 2825–2836. [Google Scholar] [CrossRef]
- Billinton, R.; Jonnavithula, S. A test system for teaching overall power system reliability assessment. IEEE Trans. Power Syst. 1996, 11, 1670–1676. [Google Scholar] [CrossRef]
- European Commision SmartHG Project Website. Available online: http://smarthg.di.uniroma1.it/ (accessed on 16 August 2019).


| System | Parameter | ESS1 | ESS2 | ESS3 | ES4 | ESS5 |
|---|---|---|---|---|---|---|
| Bus 6 | C (MWh) | 1.75 | 0.8 | 1.2 | 0.75 | 1.5 |
| , (MW) | 0.35 | 0.16 | 0.24 | 0.15 | 0.3 | |
| Feeder | C (MWh) | 4 | 5 | 5.2 | 5 | 1.2 |
| c72 | , (MW) | 0.8 | 1 | 1.04 | 1 | 0.24 |
| System | Index | DG | DG+ESS | DG+LS | DG+ESS+LS |
|---|---|---|---|---|---|
| Bus 6 | SAIDI | 8.6 | 8.3 (−4.0%) | 7.9 (−8.5%) | 6.7 (−22.1%) |
| ENS | 45.6 | 44.4 (−2.8%) | 43.5 (−4.7%) | 39.8 (−12.7%) | |
| Feeder | SAIDI | 22.6 | 22.6 (−0.3%) | 21.2 (−6.4%) | 18.6 (−17.8%) |
| c72 | ENS | 683 | 682 (−0.2%) | 650 (−4.9%) | 578 (−15.4%) |
| Scenario | Buses in Bus 6 | Buses in Feeder c72 |
|---|---|---|
| Low | 16, 26, 30, 32, 34, 35, 37, 38 | 7–9, 13, 17–18, 20, 22–23 |
| Medium | Low + 15, 25, 29, 33, 40 | Low + 5, 10, 15, 16, 19 |
| High | Medium + 17, 27, 28, 31, 36, 39 | Medium + 6, 14, 21, 24 |
| System | Index | LI = 1 | LI = 2 | LI = 3 | % LI 1-2 | % LI 1-3 |
|---|---|---|---|---|---|---|
| SAIFI | 1.33 | 1.52 | 1.60 | 14% | 20% | |
| Bus 6 | SAIDI | 6.71 | 6.42 | 6.42 | −4.3% | −4.4% |
| ENS | 39.8 | 38.9 | 38.9 | −2.3% | −2.4% | |
| Feeder | SAIFI | 3.5 | 4.3 | 4.6 | 22% | 32% |
| c72 | SAIDI | 18.6 | 18.2 | 18.2 | −2.6% | −2.6% |
| ENS | 578.2 | 563.2 | 562.9 | −2.6% | −2.6% |
© 2019 by the authors. Licensee MDPI, Basel, Switzerland. This article is an open access article distributed under the terms and conditions of the Creative Commons Attribution (CC BY) license (http://creativecommons.org/licenses/by/4.0/).
Share and Cite
Escalera, A.; Castronuovo, E.D.; Prodanović, M.; Roldán-Pérez, J. Reliability Assessment of Distribution Networks with Optimal Coordination of Distributed Generation, Energy Storage and Demand Management. Energies 2019, 12, 3202. https://doi.org/10.3390/en12163202
Escalera A, Castronuovo ED, Prodanović M, Roldán-Pérez J. Reliability Assessment of Distribution Networks with Optimal Coordination of Distributed Generation, Energy Storage and Demand Management. Energies. 2019; 12(16):3202. https://doi.org/10.3390/en12163202
Chicago/Turabian StyleEscalera, Alberto, Edgardo D. Castronuovo, Milan Prodanović, and Javier Roldán-Pérez. 2019. "Reliability Assessment of Distribution Networks with Optimal Coordination of Distributed Generation, Energy Storage and Demand Management" Energies 12, no. 16: 3202. https://doi.org/10.3390/en12163202