Article

Households’ Preferences for a New ‘Climate-Friendly’ Heating System: Does Contribution to Reducing Greenhouse Gases Matter?

by
Stefania Troiano
1,
Daniel Vecchiato
2,*,
Francesco Marangon
1,
Tiziano Tempesta
2 and
Federico Nassivera
3
1
Department of Economics and Statistics, University of Udine, 33100 Udine, Italy
2
Department of Land, Environment, Agriculture and Forestry, University of Padova, 35020 Legnaro (PD), Italy
3
Department of Agricultural, Food, Environmental and Animal Sciences, University of Udine, 33100 Udine, Italy
*
Author to whom correspondence should be addressed.
Energies 2019, 12(13), 2632; https://doi.org/10.3390/en12132632
Submission received: 22 May 2019 / Revised: 1 July 2019 / Accepted: 5 July 2019 / Published: 9 July 2019
(This article belongs to the Special Issue Economics of Sustainable and Renewable Energy Systems)

Abstract

:
This study investigates the preferences of Italian home-owners when choosing a new domestic heating system. The focus is on understanding the influence on consumer choice of a potential label certifying the effect of the heating system on the greenhouse effect. To this end, we designed a survey including a discrete choice experiment and administered it to residents in north-eastern Italy. Our findings reveal that, on average, respondents pay particular attention to the green effect of their purchase. The carbon dioxide reduction label was considered second in terms of importance after cost. Further analysis found that our sample presents three clusters of customers, with intra-cluster homogeneous preferences. The cluster analysis showed that while the initial system costs are considered to varying degrees by the whole sample, the carbon dioxide reduction label was considered important by 79% of respondents (members of clusters 1 and 2). To achieve greater results in reducing the greenhouse effect of the domestic heating sector, a combination of policies should be used simultaneously to achieve greater effectiveness. Our simulations support the hypothesis that policymakers should achieve greater results in terms of reducing the domestic greenhouse gas emissions by applying a combined policy that leverages the importance citizens accord to the different characteristics of a heating system. From our results, the application of a ‘low carbon dioxide ( C O 2 ) emissions’ label will amplify the effect of a subsidy that reduces the initial system costs.

1. Introduction

According to the Intergovernmental Panel on Climate Change 2018 report [1], carbon dioxide ( C O 2 ) emissions are responsible along with other greenhouse gasses for global warming and keeping global warming 1.5 C above pre-industrial levels ‘requires limiting the total cumulative global anthropogenic emissions of C O 2 since the pre-industrial period’ [1] (p. 14). The European policy for reducing the effect of climate change currently targets C O 2 emissions reduction. The European Union [2] plans to achieve an 80% reduction in greenhouse gas emissions by 2050 (compared with 1990 levels). According to Muntean et al. [3], C O 2 emissions from the European Union (EU28) increased by 1.1% in 2017 compared with 2016. Although EU28 emissions reached 3.5 Gt C O 2 in 2017, the EU28 share of global fossil C O 2 emissions has remained constant since 2015 at 9.6%, equivalent to 7 tonnes C O 2 /cap/year. With 10.2% fossil C O 2 emissions in 2017, Italy was among the largest contributors to total EU28 emissions. According to the 2018 EU Report, energy use in buildings is the second main source of C O 2 emissions in Europe after transport. The 2017 Italian C O 2 emissions caused by energy use in domestic buildings are nearly stable (−4%) compared with the 1990 level, and are 19% lower compared with the 2005 level.
The importance of C O 2 as a greenhouse gas is further emphasised by UK National Statistics [4]: C O 2 accounts for 81% of total UK greenhouse gas emissions. In 2017, the UK residential sector accounted for 17% of all UK C O 2 emissions and the main source of emissions from this sector was the use of natural gas for heating and cooking.
According to the Enea 2017 annual report on energy efficiency [5] for Italy, ‘in 2015, residential energy consumption was equal to 32.5 Mtoe with an increase by 10.0% relative to 2014. Natural gas is the main energy source: it covers more than 50% of sectorial energy consumption, followed by wood (19.5%) and electricity (17.5%)’. Considering domestic energy uses, heating is one of the major sources of energy consumption and one of the main contributors to C O 2 emissions. Therefore, energy savings could be a win-win strategy for the domestic energy sector in reducing both the household expenses as well as the environmental effect. Households could be incentivized to exchange their current heating system with one that has better energy efficiency and that will, therefore, reduce the annual heating costs.
There is an increasing awareness among citizens about the positive environmental effects of energy saving [6]; however, the effect of the recession has considerably influenced the choice and use of heating sources. On the one hand, households struggle to reduce energy consumption and costs demanding alternative heating, and on the other hand, they consider alternatives that are not always sustainable (e.g., room air-conditioners) [7].
Through their choices and preferences, households could play a significant role in affecting environmental quality when they choose their residential heating systems. For example, according to Hong and Howarth [8], ‘replacing any of the water heaters considered in this study with a heat pump water heater will give net climatic benefits over all time frames (up to 100 years)’, even if the electricity consumed by heat pumps is generated with carbon sources. Consequently, identifying and understanding the factors that determine the choice of a new heating system by households could be very important in the design of environmentally sustainable and climate mitigation policies. These will help governments design future policies focused on creating the right incentives for households in supporting the adoption of less-polluting energy sources and heating system technologies and increasing the implementation of energy efficiency measures. Policies that encourage such behaviour are even more important if we consider that a house-heating system is a long term investment undertaken usually only every 10 or 15 years. Providing incentives to move towards more environment-friendly heating systems is therefore a great opportunity that, if neglected, would postpone the reduction of the environmental effects of the domestic sector for several years.
In Italy, such policies have so far relied mainly on financial incentives in the form of a subsidy covering 65% of the purchase cost, with a repayment timeframe of 10 years. It is therefore important to understand whether a protraction of institutional financial incentives to increase the number of renewable energy heating systems is still effective according to the public opinion.
Stated preference methods [9,10,11] are a suitable choice for analysing consumers’ preferences especially when dealing with an ex-ante valuation, given that they allow the building of a hypothetical market that includes some product characteristics not yet available in the real market. The literature includes several applications of such methodologies in different fields, including renewable energy and environmental policies. Several studies analyse awareness [12,13] and estimate citizens’ willingness to pay (WTP) for the use of renewable energy sources (e.g., [14,15,16,17,18,19,20]). A number of studies also investigate homeowners’ preferences for renewable domestic heating systems using the discrete choice experiment (DCE) approach [21,22,23,24,25,26,27,28,29,30,31,32,33,34,35] or conjoint and variance analysis [36], and most of them suggest that whilst renewable energy adoption is notably valued by households, this value is not enough to counterbalance the importance of the economic factors while purchasing a new heating [24,25,27,29]. In addition, Curtis et al. [37] state that knowledge of fuel costs or associated emissions, or engagement in environmentally sustainable behaviours do not appear to explain the choice of heating system. A number of studies focus on the estimation of Italian households’ WTP for reducing emissions of energy production systems. For example, Bollino [38], Strazzera et al. [39] and Strazzera et al. [40] perform Contingent Valuation studies to assess the potential trade-off between external costs and the cost of energy for households. Their results show that households are keen to buy renewable energy, and are willing to pay more for it. Similar results are obtained by Bigerna and Polinori [41], who state that there is a noticeable WTP among Italian households for increasing Italian green energy production. Cicia et al. [15] use a DCE to point out that Italian consumers are very inclined towards solar and wind energy. Moreover, Vecchiato and Tempesta [19] show that respondents are willing to pay for electricity contracts including renewable energies, whereas Caporale and De Lucia [42] find the existence of a positive consumer attitude towards renewable energy sources (wind power) in the Apulia Region. Vecchiato [43] adopts a DCE and finds a positive WTP for wind energy.
Nevertheless, to the best of our knowledge no studies have investigated Italian households’ preferences for reducing emissions from their domestic heating systems adopting a DCE.
The objective of this study is to understand:
  • the importance given by customers to the environmental impact—in terms of C O 2 emissions—when purchasing a new heating system;
  • the effect on consumer choices of a public subsidy linked to the heating system performance in terms of C O 2 emissions.
The second objective will be studied using the DCE results to simulate the role of a public incentive in leading consumers to choose the most energy-efficient and ‘climate-friendly’ heating system.
The rest of the paper is organized as follows. In 
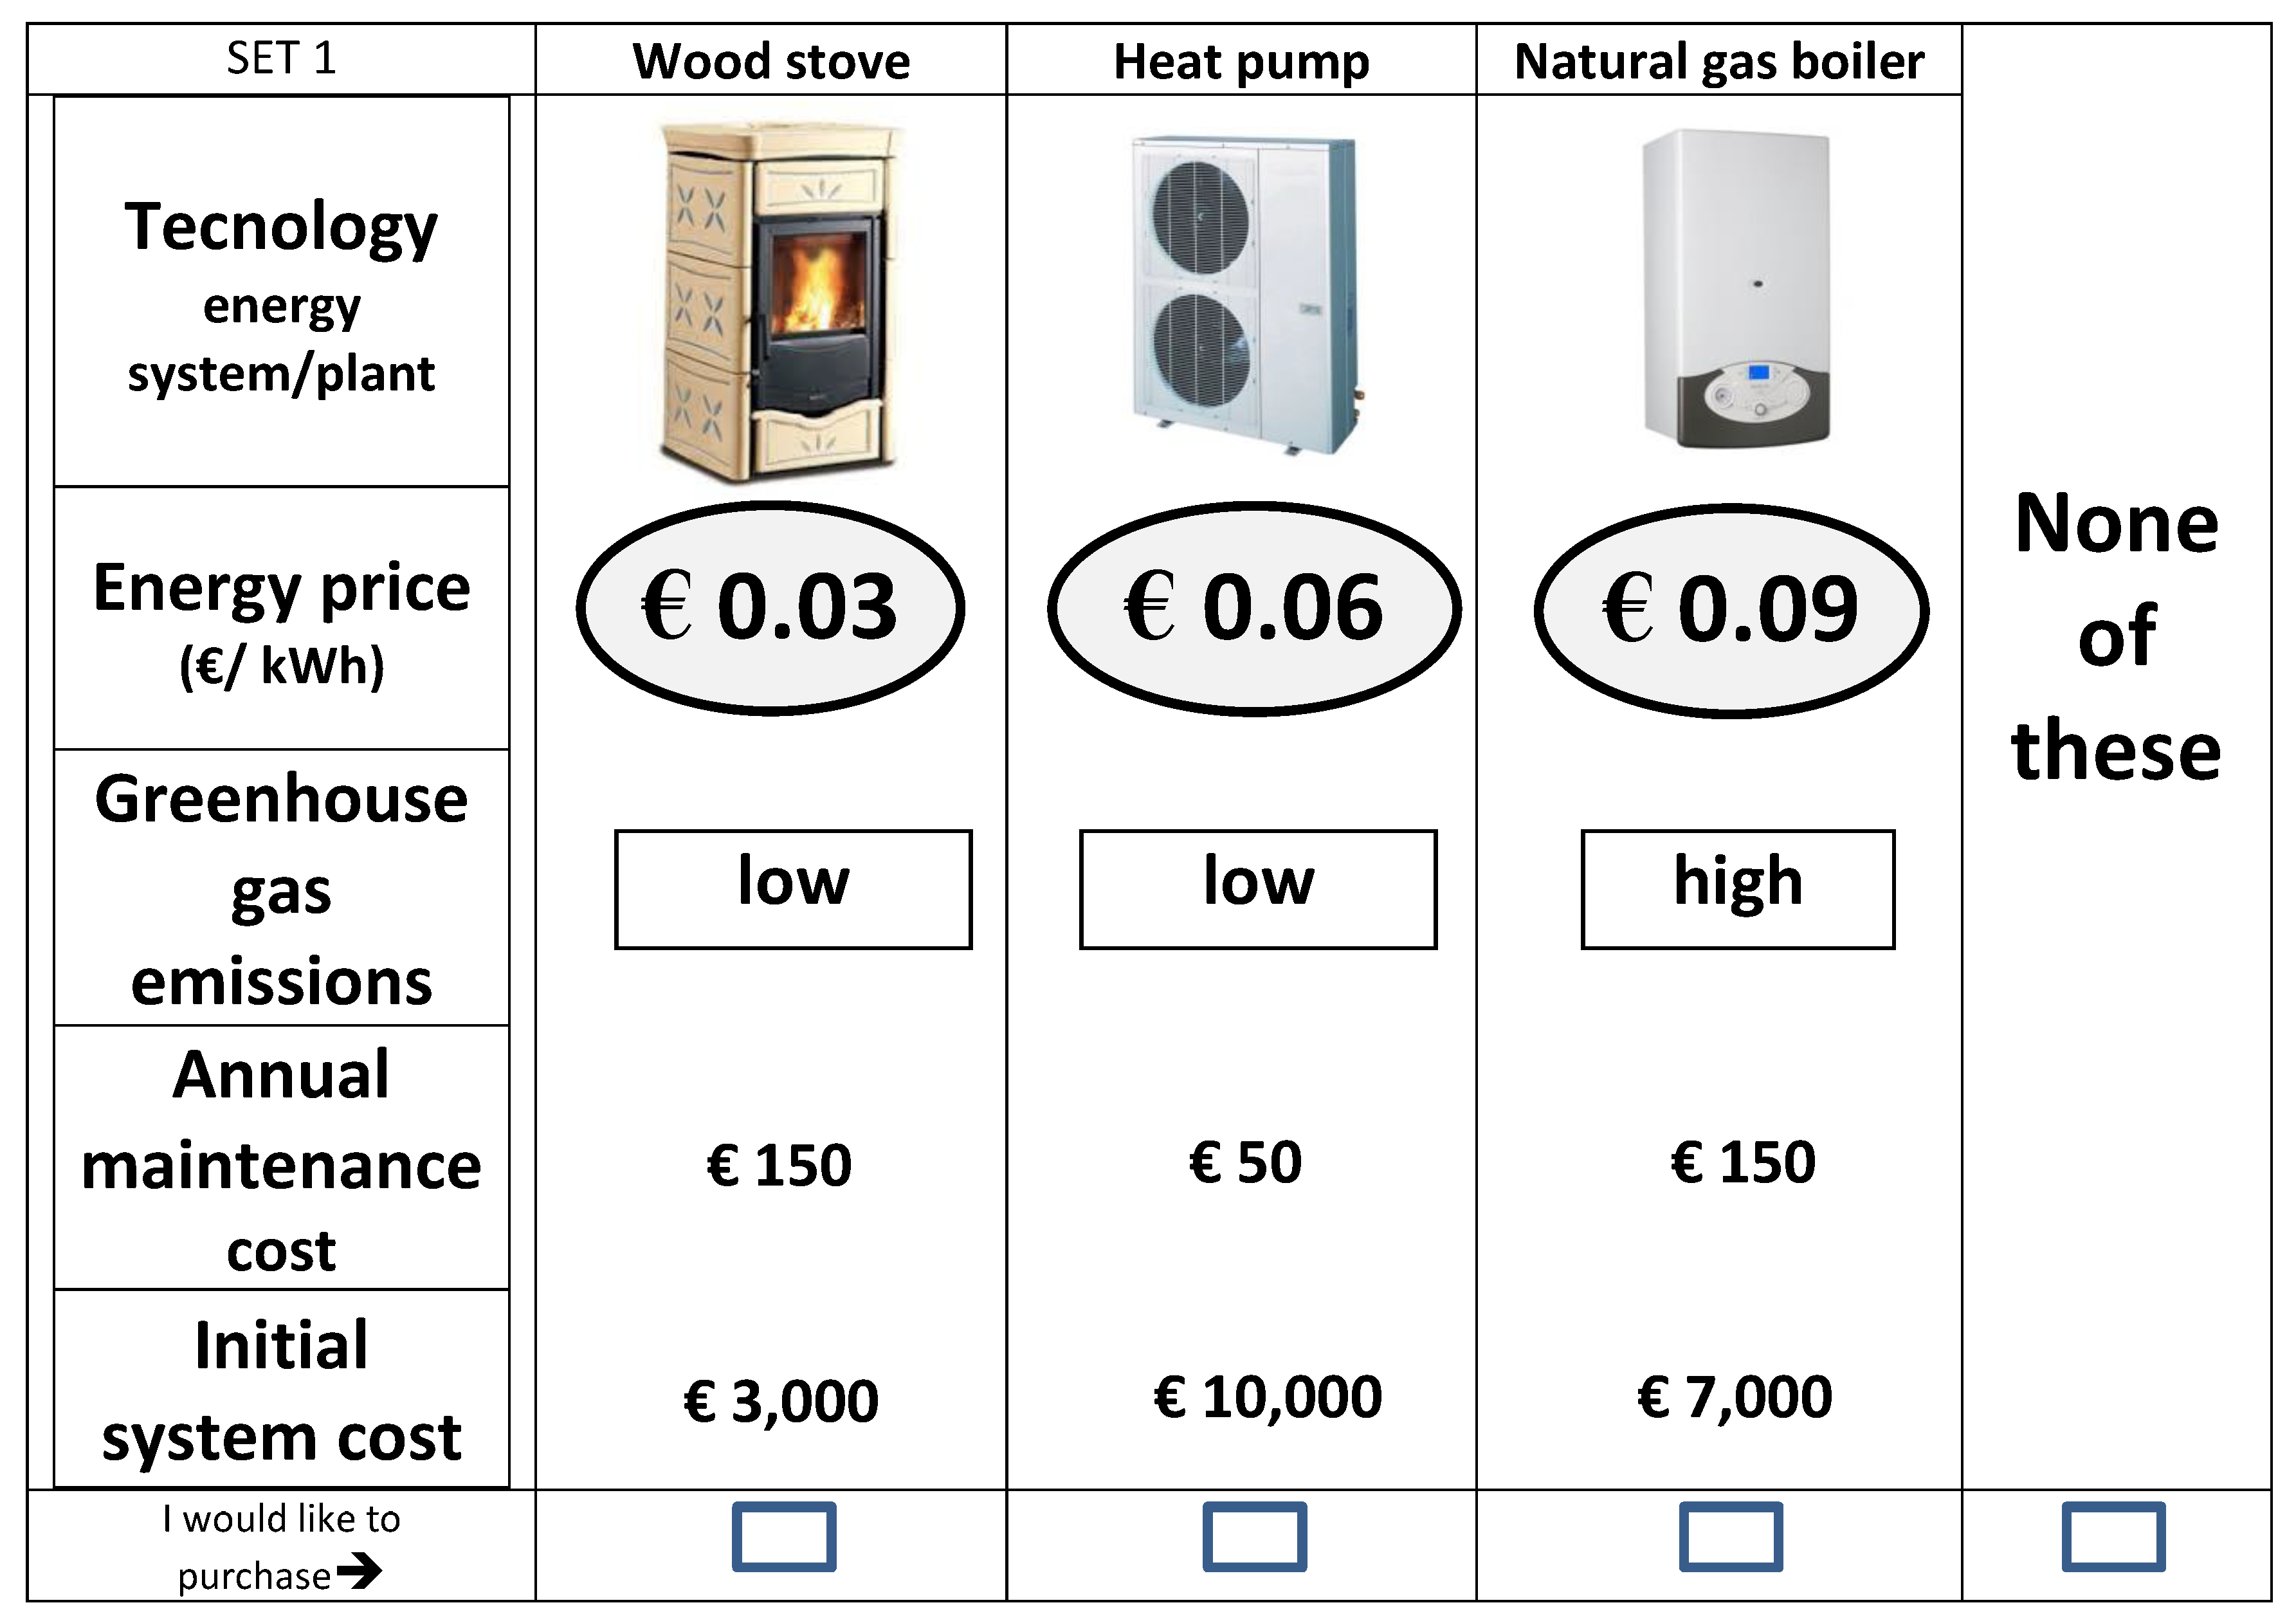
Section 2 we describe the materials and the methodology used in the study and present the survey design and implementation. Section 3.1 describes the socio-economic characteristics of the sample, whereas Section 3.2 analyses respondents’ opinions on energy sources. Section 3.3 presents the DCE results and their policy implications followed by the discussion and conclusions in Section 4.

2. Material and Methods

2.1. The Discrete Choice Experiment Approach

To achieve this aim we used a DCE [44,45,46] to estimate consumers’ preferences regarding the C O 2 emission reduction of heating systems in Italian residential buildings. The DCE approach has been widely used in the last couple of decades in marketing, agribusiness, environmental valuation, health economics and transportation studies. Its popularity is due to its ability to estimate both the value of a good/service as a whole and the implicit value of its attributes [47]. This method is commonly used by scholars to assess the trade-offs underlying respondents’ choices and to compare the relative importance of attribute levels. The DCE is based on the theory of stated preference [11], which enables the portrayal of respondents’ preference structures using hypothetical contexts [44]. The DCE approach uses questionnaires to collected data and such questionnaires include, among the other questions, a hypothetical market, where respondents are requested to choose among a set of options (called choice set). To build such choice sets the researcher adopts what is technically called an ‘experimental design’. The first step of the DCE implementation process consists in the identification of the key attributes of the good/service studied. A vector of levels (i.e., considering the attribute ‘color’ its levels can be ‘yellow, red and black’) is then associated with each attribute. By means of the experimental design it is then possible to choose a subset of all possible combinations of attribute and levels and to define the final choice sets that will be presented to respondents. Respondents are requested to choose their preferred alternative among those presented in the choice sets. The respondents are assumed to perform their choice among the alternatives in the choice set maximizing their expected utility. The overall utility of an alternative can be considered to be the sum of the utilities of its attributes. In this respect the utility of an alternative is a function of the alternative characteristics. According to Random Utility Theory [48,49], the utility function of each respondent is the sum of an observable and an unobservable (random component) part. While the observable part of utility is a function of factors that influence the respondent’s utility, the random part is unobservable. The researcher is not able to directly measure respondent utility; nevertheless, he/she can observe people choices. It is then possible to estimate the part-worths utilities of the attribute levels linking the probability of choice to the respondent utility function. Assuming that the respondent chooses the alternative that maximizes his/her utility, different models can be used in DCE studies for such purpose. Such models are an extension of McFadden [50] conditional logit model, often referred to as Multinomial logit (MNL) in the DCE literature. MNL models have been widely applied when studying sample mean preferences. Specifically, the MNL model assumes homogeneous preferences among respondents and is subject to the assumption of independence of irrelevant alternatives (IIA). Consequently, Random Parameter Logit models (RPL) [51,52,53] and Latent Class models (LCM) are applied [54] for investigating heterogeneity across respondents, as they are more flexible and not subject to the IIA assumption. Although both models are suitable, they differ. RPL takes preference heterogeneity into account in a continuous fashion, considering it random with a specific density function, whereas LCM can be considered a semiparametric variant of MNL [51], as the probability of choosing an option is conditional on two aspect: the good characteristics and the individual belonging to a cluster of people with common preferences.
DCEs facilitate the understanding of whether the attributes considered in the experimental design are important for customers in determining the probability of their choice and to determine the relative importance of the attributes considered in the DCE.

2.2. Calculations

DCE data were analysed using R software (version 3.5.2) [55] and in particular the gmnl [56] and mlogit [57] packages. First we analysed an MNL model to find the sample average preferences and then we used an RPL and LCM to check for the presence of heterogeneity among respondents. When using an RPL model, the scholars have to make strong distributional assumptions about the random parameters’ distribution, and in our models, all random parameters were assumed to be normally distributed. We applied a linear and additive parameters utility function in all three models and the different levels of our attributes where dummy coded.
The utility function used in the MNL and RPL models is:
U ( X i ) = β G a s · G a s + β H P · H P + β W o o d · W o o d + β L o w - e m i s s · L o w E m i s s + β L o w - m a i n t · L o w M a i n t + β E P 03 · E P 03 + β E P 06 · E P 06 + β C o s t · C o s t
where Gas, HP, and Wood are alternative specific constants for the choice options labelled natural gas, heat pump, and wood, respectively; LowEmiss is a dummy variable that equals 1 when the system has a low emissions label; LowMaint is a dummy variable that equals 1 when the system has low maintenance costs; E P 03 is a dummy variable that indicates if the energy price of the system is 0.03 €/kWh; E P 06 is a dummy variable that indicates if the energy price of the system is 0.06 €/kWh and Cost is a continuous variable indicating the initial system cost (in 1000 €).
The LCM model utility function was similar to Equation (1), but some further parameters were included to characterise the class membership according to the respondents’ sex, age class, and rating given to the importance of the following items: low environmental impact of the heating system, the presence of a public incentive and the cost of the system.
As described by Kuhfeld [58], the importance of an attribute can be computed as the ratio between: (a) the part-worth utility range for each attribute; (b) the sum of all ranges. Such ratio should then be multiplied by 100. Therefore, it is possible to determine the relative importance as:
A t t I m p o r t a n c e i = [ m a x ( β i ) m i n ( β i ) ] · m a x ( Z i ) i = 1 n [ m a x ( β i ) m i n ( β i ) ] · m a x ( Z i ) · 100
where i identifies the i-th attribute and Z i the attribute level of the i-th attribute (in our case Z can be 1 if the attribute levels are coded as dummies, or 10 for the Cost attribute—expressed as thousands in the model—that is continuous). Considering Equation (2), m i n ( β i ) equals zero when an attribute is continuous rather than discrete (e.g., the ‘Initial system cost’ in our design).

2.3. Survey Structure and Experimental Design

To analyse households’ preferences for the use of renewable energy systems for domestic heating and estimate their WTP for reducing emissions, we carried out a survey including a DCE, which was conducted during 2014 and 2015. Data were collected by means of a questionnaire. The final questionnaire used for the data collection consists of three parts. The first part collects socio-economic characteristics of respondents, whereas the second investigates respondents’ preferences and knowledge of different energy resources and renewable energy sources including their supposed environmental effects. Finally, the third part is devoted to the DCE, which first presents the hypothetical market scenario and the selected attributes with the corresponding levels. Then, respondents were requested to indicate their preferred option in each choice set.
To develop the DCE we conducted some focus groups involving 50 stakeholders (public institutions and private citizens) to choose the relevant attributes and levels for the DCE experimental design. To provide discussion points for the focus groups, a number of candidate attributes were obtained from a literature review [24,59]. Then they were refined and tested during the focus groups after a number of consultations with experts. Considering the indications collected during the focus groups, five attributes were considered crucial for the study (Table 1): the heating system technology depending on its combustion source (heat pump, wood, gas), the greenhouse gas emissions (Low; High), the initial cost (€3000; €7000; €10,000), the annual maintenance cost (Low—50 €; High—150 €), and the energy price (0.03 €/kWh; 0.06 €/kWh; 0.09 €/kWh).
As regards technology, we considered wood heating, heat pump, and natural gas heating, because of their different energy sources and greenhouse gas emissions. The attribute greenhouse gas emissions mimics the potential ‘green label’ of the heating system and has two levels: low and high emissions. Focus groups highlighted that when choosing a domestic heating system, besides technology, consumers usually also consider both initial and maintenance costs [60,61,62]. For this reason, these attributes were also introduced, and their levels were established among the focus groups by experts. Using IBM SPSS ® software (version 19), a fractional factorial orthogonal design was used to reduce the original combinations of attributes and levels, resulting in six choice sets with 4 options each. The design was labelled according to the system technology, and therefore in each choice set, the respondents found 3 options (one for each heating technology) and a ‘none-of-these’ option. This latter option was necessary, because in reality respondents are not obliged to choose between a number of alternatives. An example of the choice card is presented in Figure 1.
We conducted a preliminary pilot survey with 50 respondents. This pre-test resulted in a number of minor changes in the formulation of questions.
Data were collected by a trained and supervised team carrying out a face-to-face survey using a convenience sampling technique. Interviewees were contacted both at supermarkets/grocery stores and at home by using a random approach. The survey was conducted in the Friuli Venezia Giulia and Veneto Regions, in the north-eastern part of Italy. The male and female heads of households were alternatively interviewed and, given the aim of the survey, interviewers were told not to interview more than one member per family.

3. Results

3.1. Socio-Economic Characteristics of Respondents

Eight hundred and eighteen respondents completed the questionnaire. Respondents were, on average, 37.4 years old and 53% were men. The level of education was good, in fact 77% of respondents were relatively highly educated. Almost 42% were employees. The majority (59%) lived in a household with three to four members. Ninety-four percent declared that they were environmental association members. Table 2 presents the interviewees’ and population descriptive statistics.

3.2. Respondents’ General Opinions on Energy Sources

The respondents were asked to specify their level of agreement or disagreement on an ‘agree-disagree’ Likert scale for a number of statements. The range of the Likert scale should capture the intensity of their feelings for a given item. In our survey, we used a uniform five-point Likert scale ranging from 1 (disagreement) to 5 (agreement). According to scholars who over the years have argued that the median and the mode should be used as the measure of central tendency for Likert scale data, we calculate both. However, the mode could probably be considered the most suitable for easy interpretation [63].
The mode value of importance of preferences among different energy sources assessed among individuals in this sample was 5 for wind, solar, and geothermal energy, whereas the median score was 5 for solar energy only (Table 3).
We asked respondents if their choices were influenced when choosing a specific energy source by its environmental effect, the presence of subsidies, and the low cost of the energy source. The importance of energy sources producing low environmental effects was considered as a key aspect by respondents (mean score = 4.28). Similarly, the presence of a market-based instrument (a subsidy) to incentivise the choice of an energy source is strongly valued by the sample (mean score = 3.94). Finally, respondents support the low cost of energy sources, despite considering it less important than the previous two aspects (mean score = 3.78).

3.3. Choice Experiment Results

Our analysis was performed in three steps: first we estimated a multinomial logit model (MNL) to check for the sample parameters mean values; then, we moved to a random parameter logit model (RPL) to analyse whether the sample preferences were characterised by heterogeneity estimating parameters at an individual level; finally, we applied a latent class model (LCM) to check if it was possible to find clusters of respondents with homogeneous preferences.

3.3.1. Mean Sample Preferences

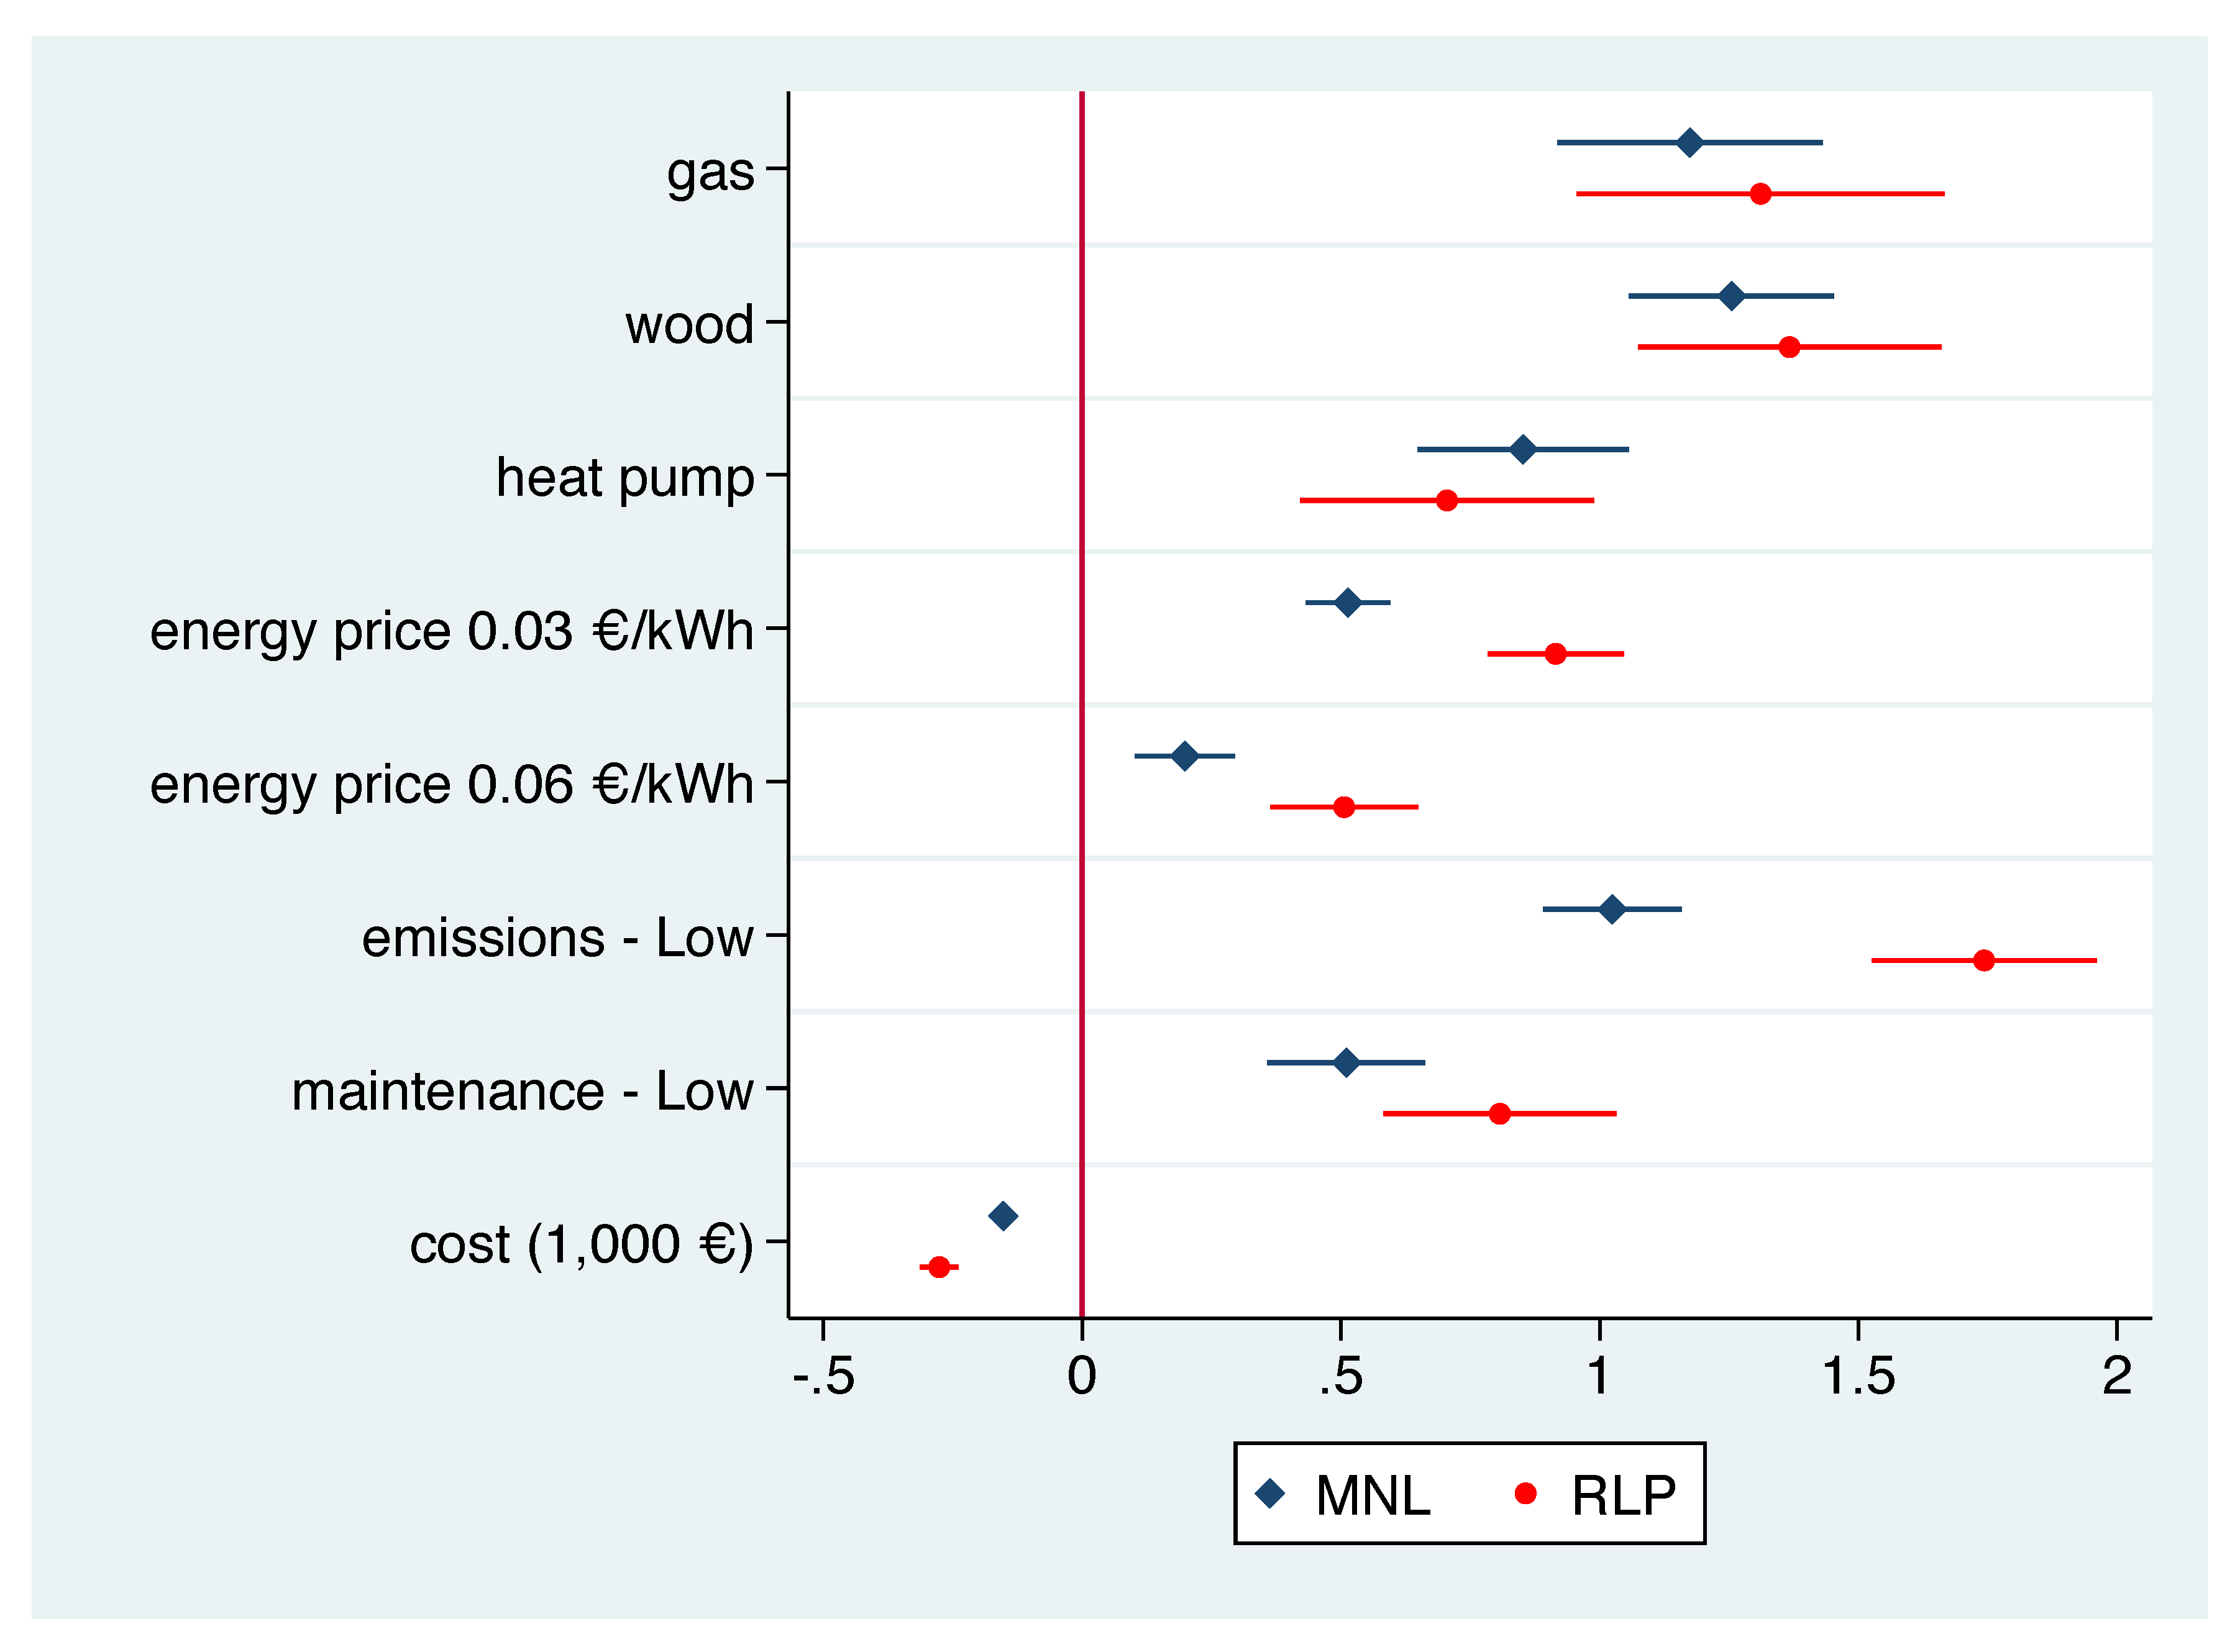
According to our analysis, all estimated parameters were significant in both the MNL and RPL models (Table 4 and Figure 2). Looking at the McFadden pseudo- R 2 , both models have a good fit (Louviere et al. [64] stated that a McFadden pseudo- R 2 statistic in the 0.20–0.30 range is comparable to an ordinary least square adjusted R 2 of 0.70–0.90. Consequently, according to Hensher et al. [44], it is possible to state that our RPL model has an acceptable fit (McFadden pseudo- R 2 = 0.30)) and explicative capacity, and that it provides a better performance than the MNL model (McFadden pseudo- R 2 = 0.304 vs. 0.221 of the MNL model).
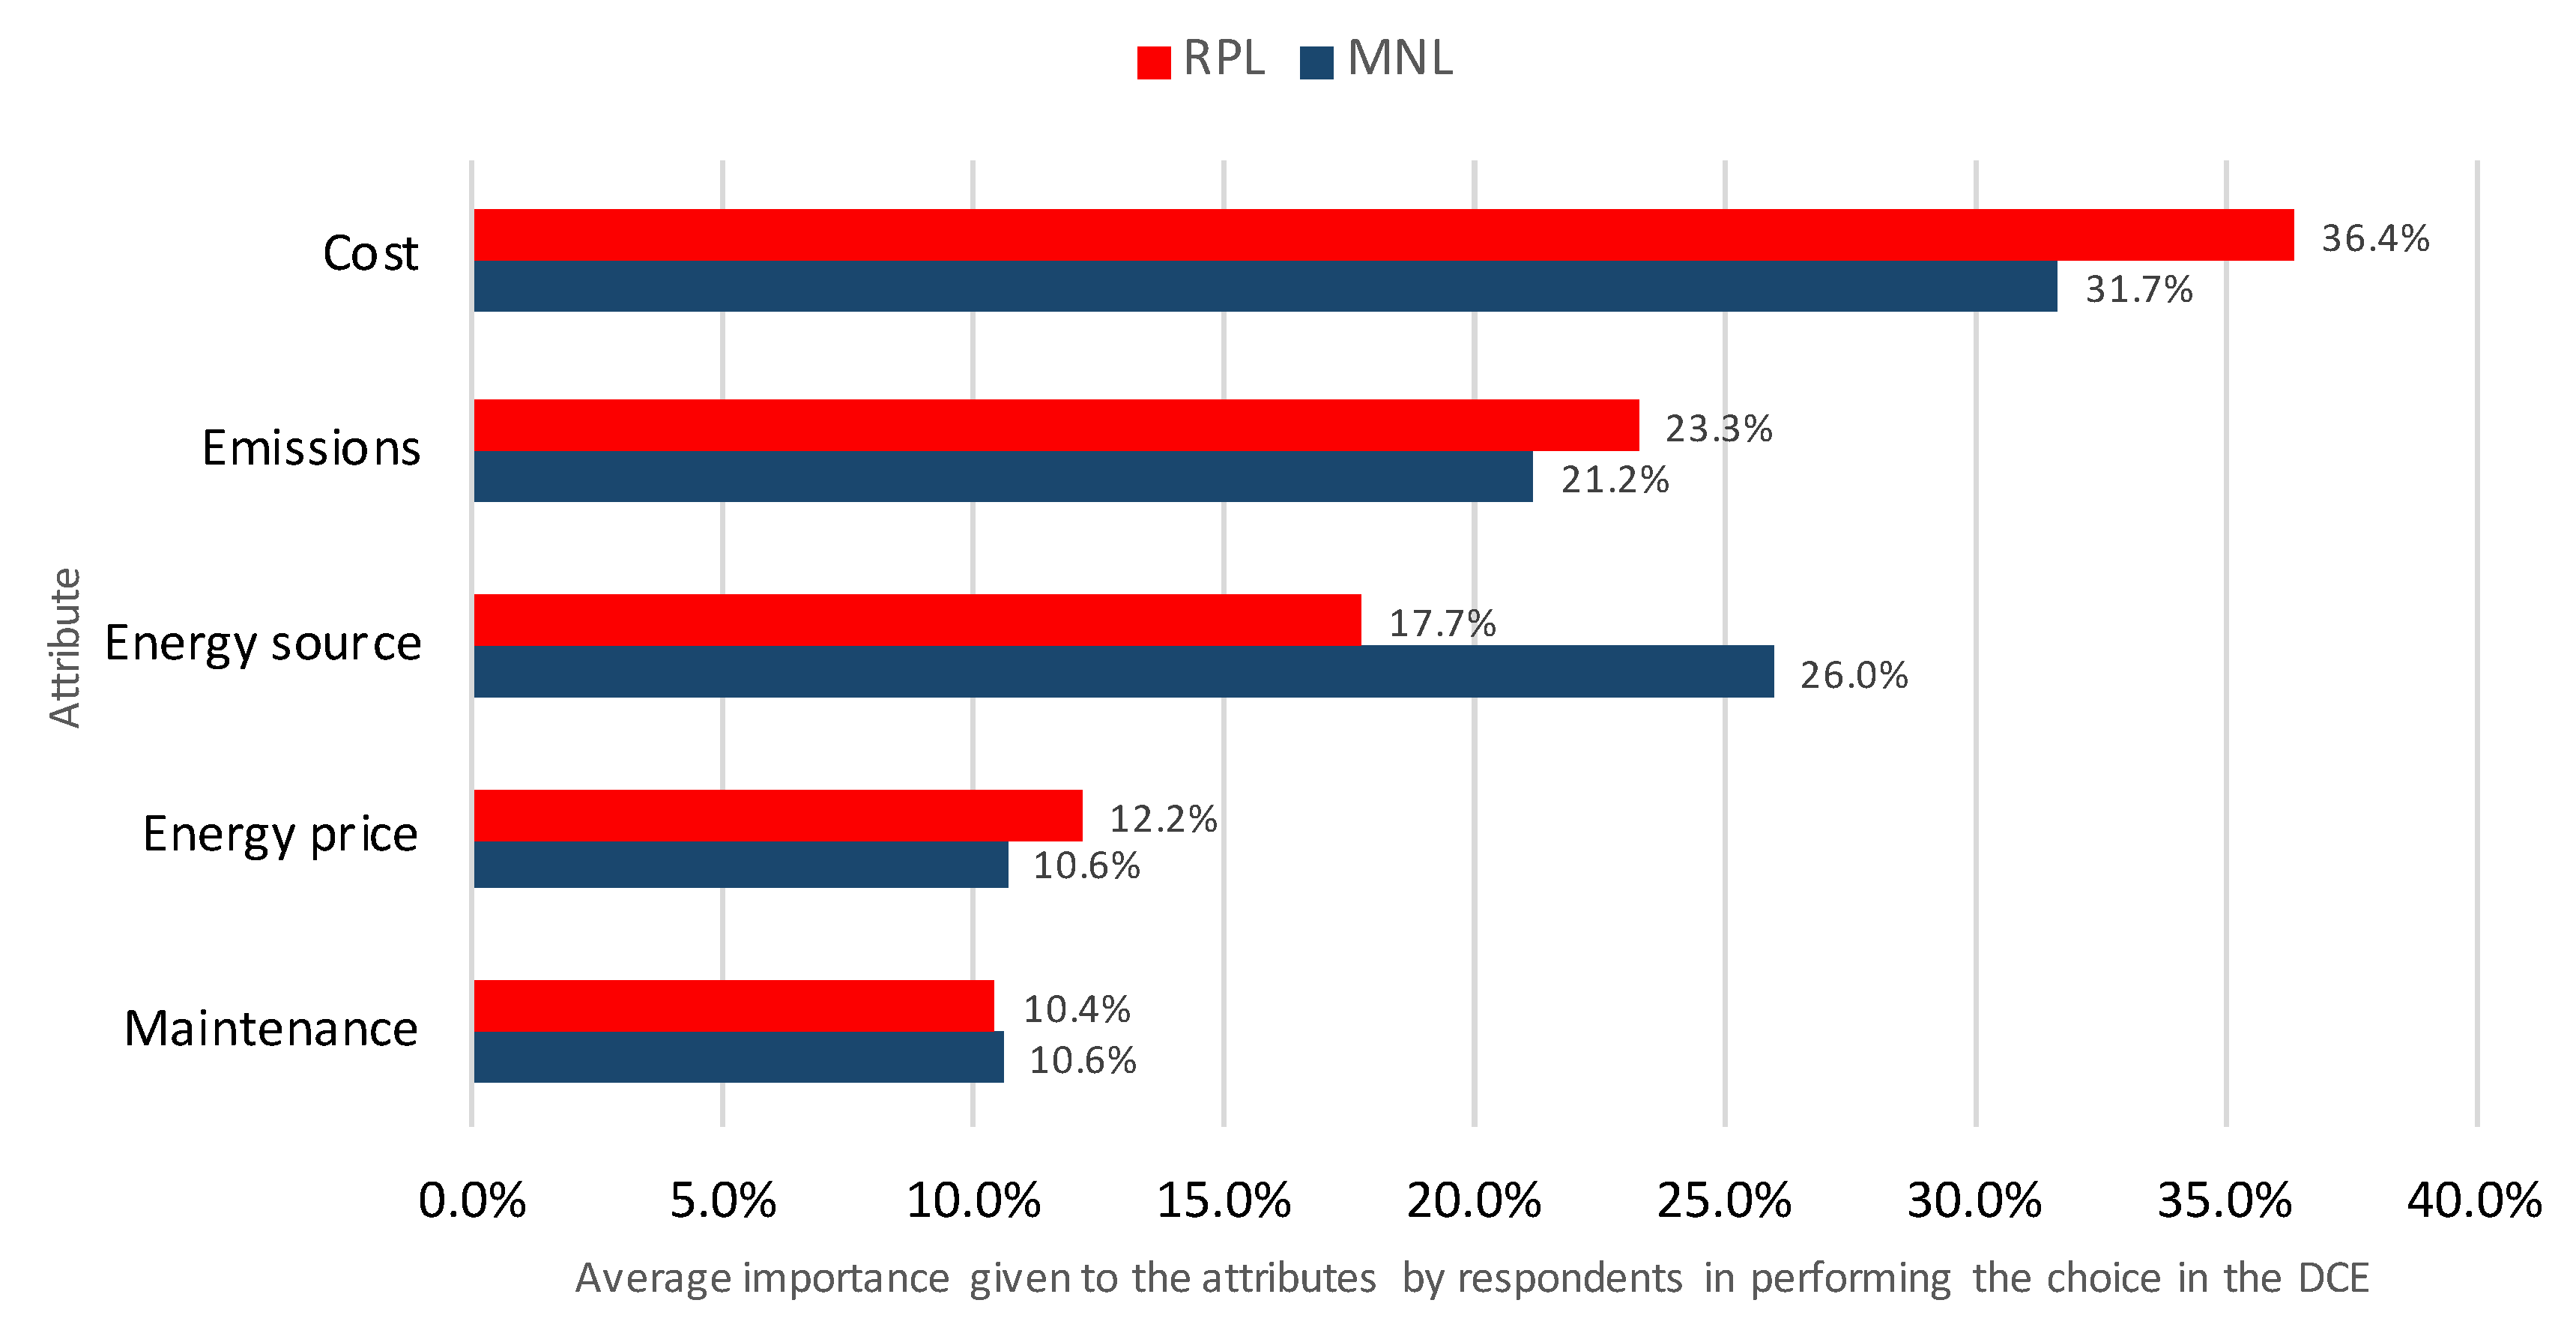
We calculated the relative importance given on average by respondents to the different attributes in choosing a new heating system (Figure 3). According to the RPL model, respondents seem to be mainly concerned about the system initial cost (36.4% importance), followed by the level of C O 2 emissions (23.3%), the type of energy source (17.7%), the energy price (12.2%), and finally by the maintenance costs (10.4%). The results of the relative importance of attributes according to the two models are similar with the exception of the positions of the level of C O 2 emissions and the energy price, which in the MNL are inverted, not taking into account preference heterogeneity results in overvaluing the importance of the energy source.
Looking at the estimated coefficients in the RPL model, a greater initial cost decreases the probability of choice, whereas wood and gas are the types of energy sources that mainly increase such probability. Low C O 2 emissions and costs of maintenance are preferred, while the lower the energy price, the better.

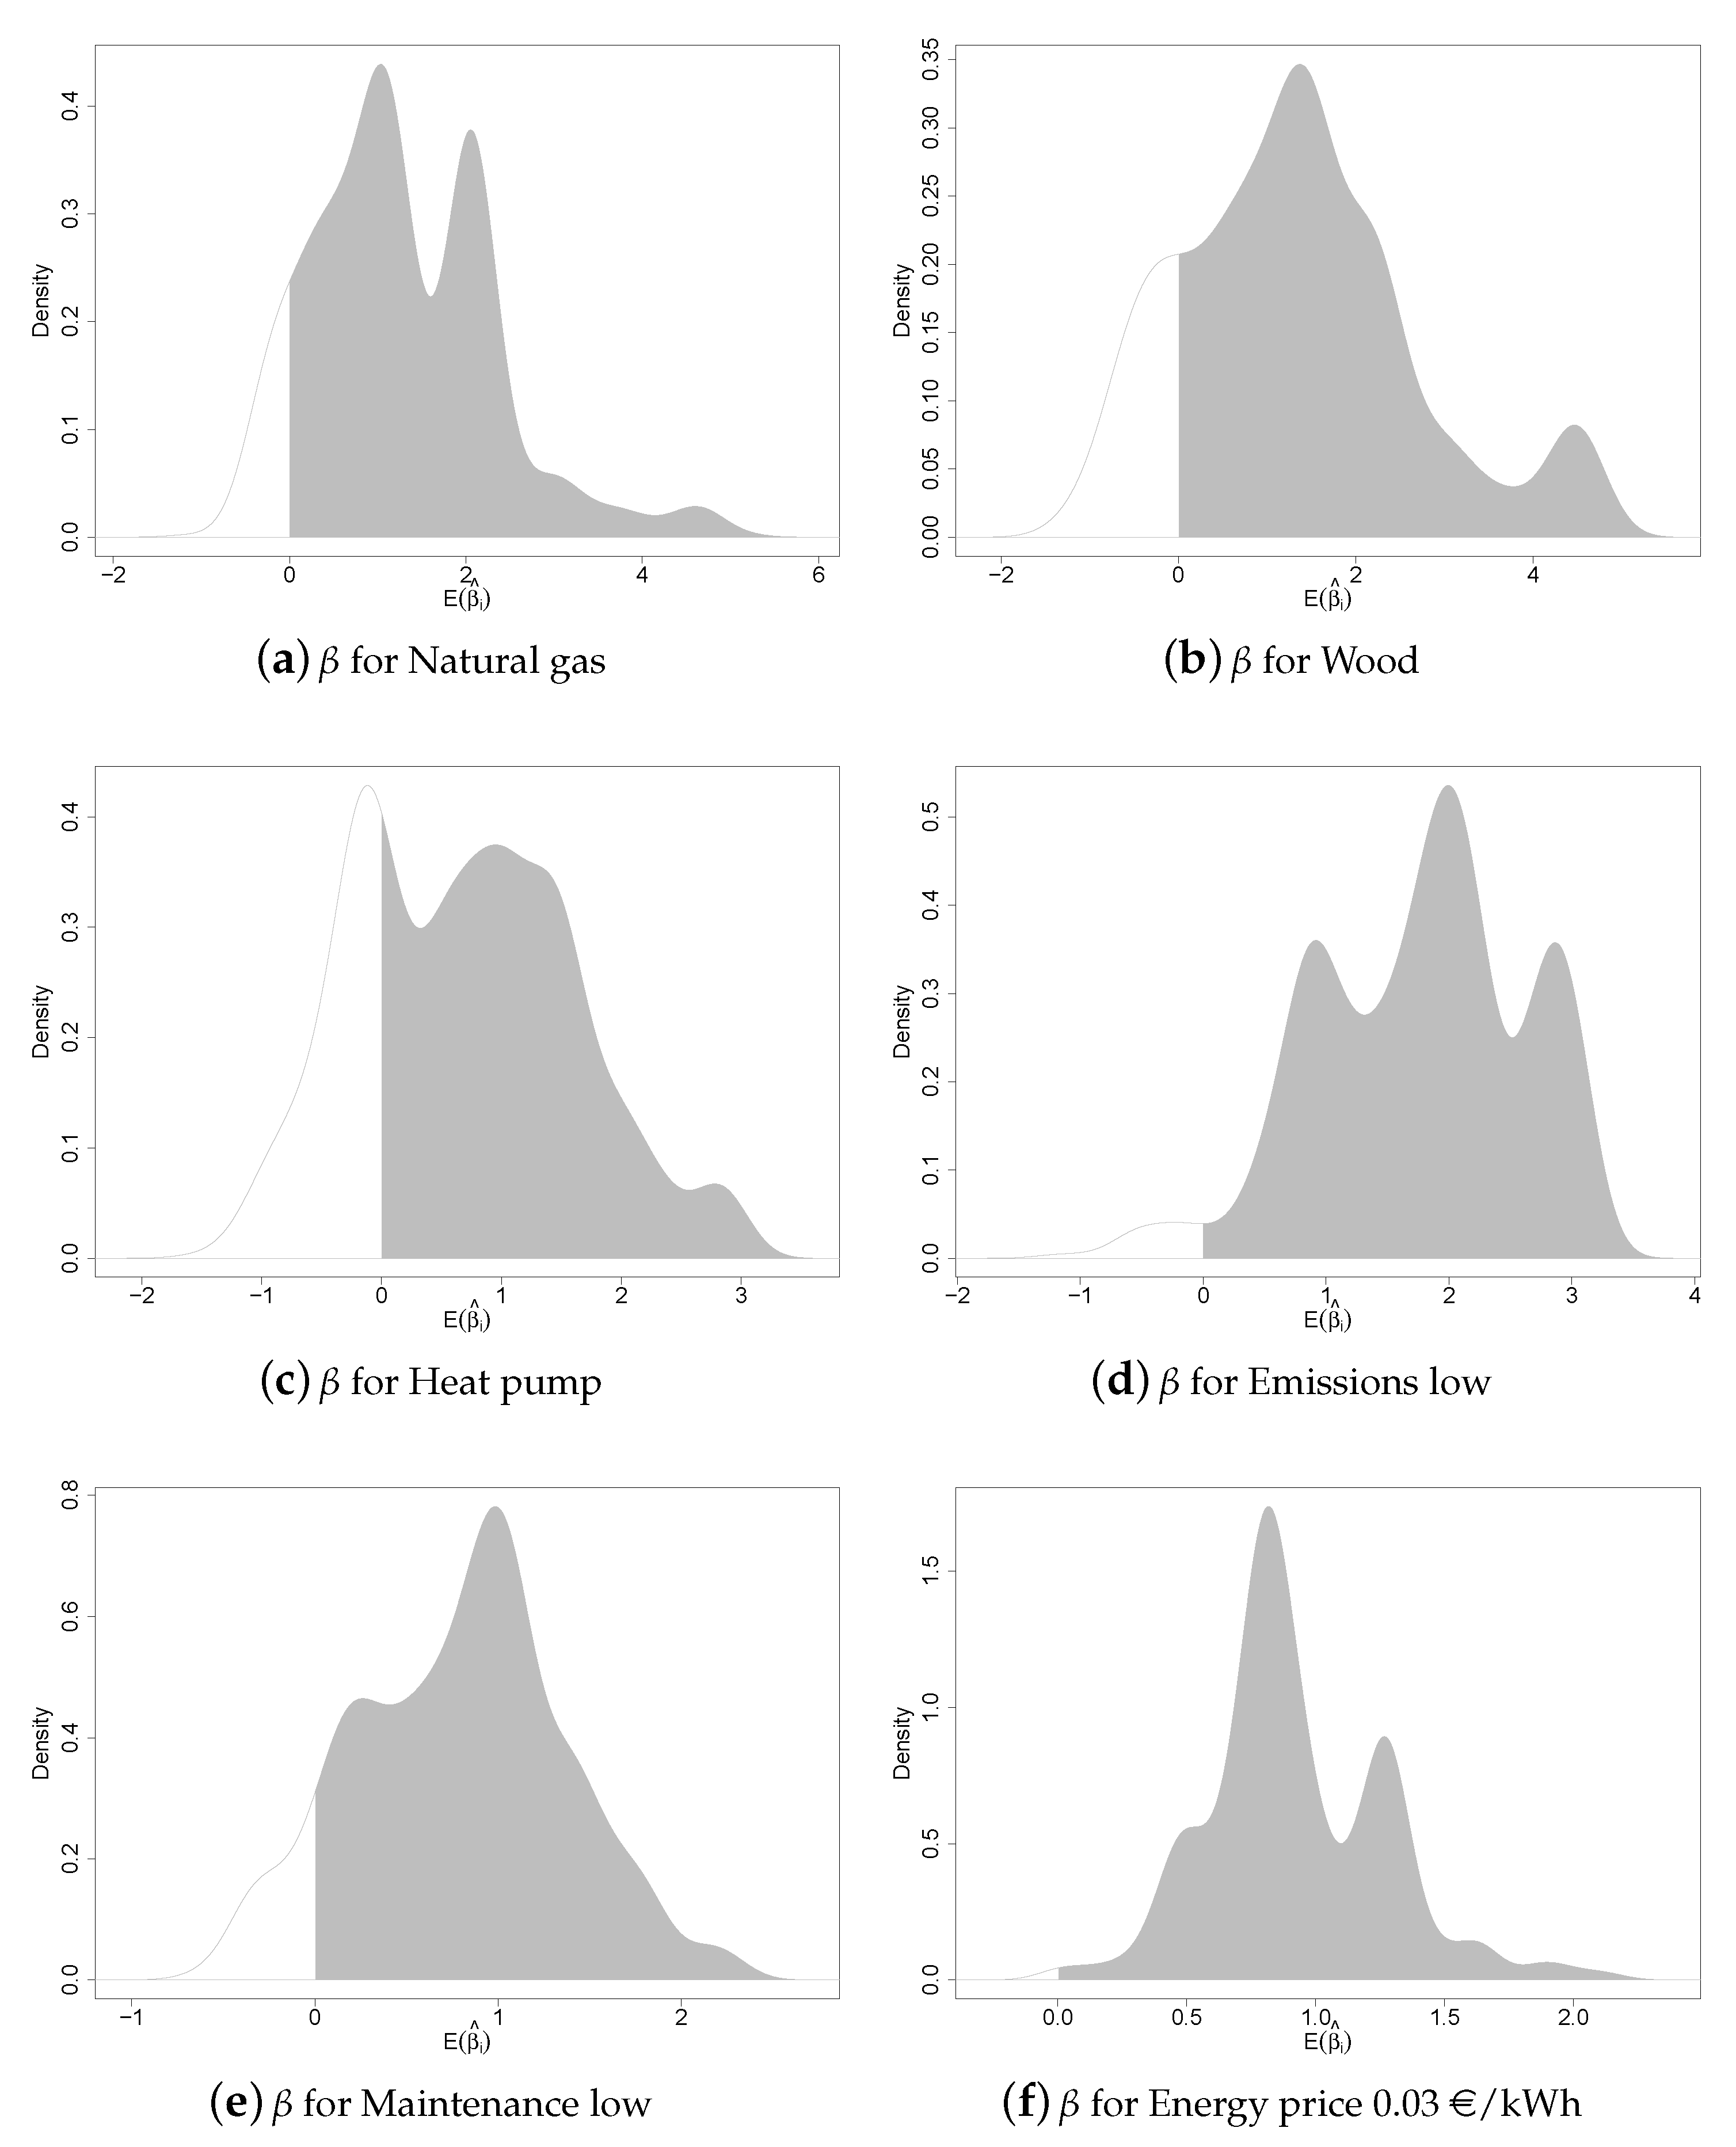
3.3.2. Heterogeneity in Sample Preferences

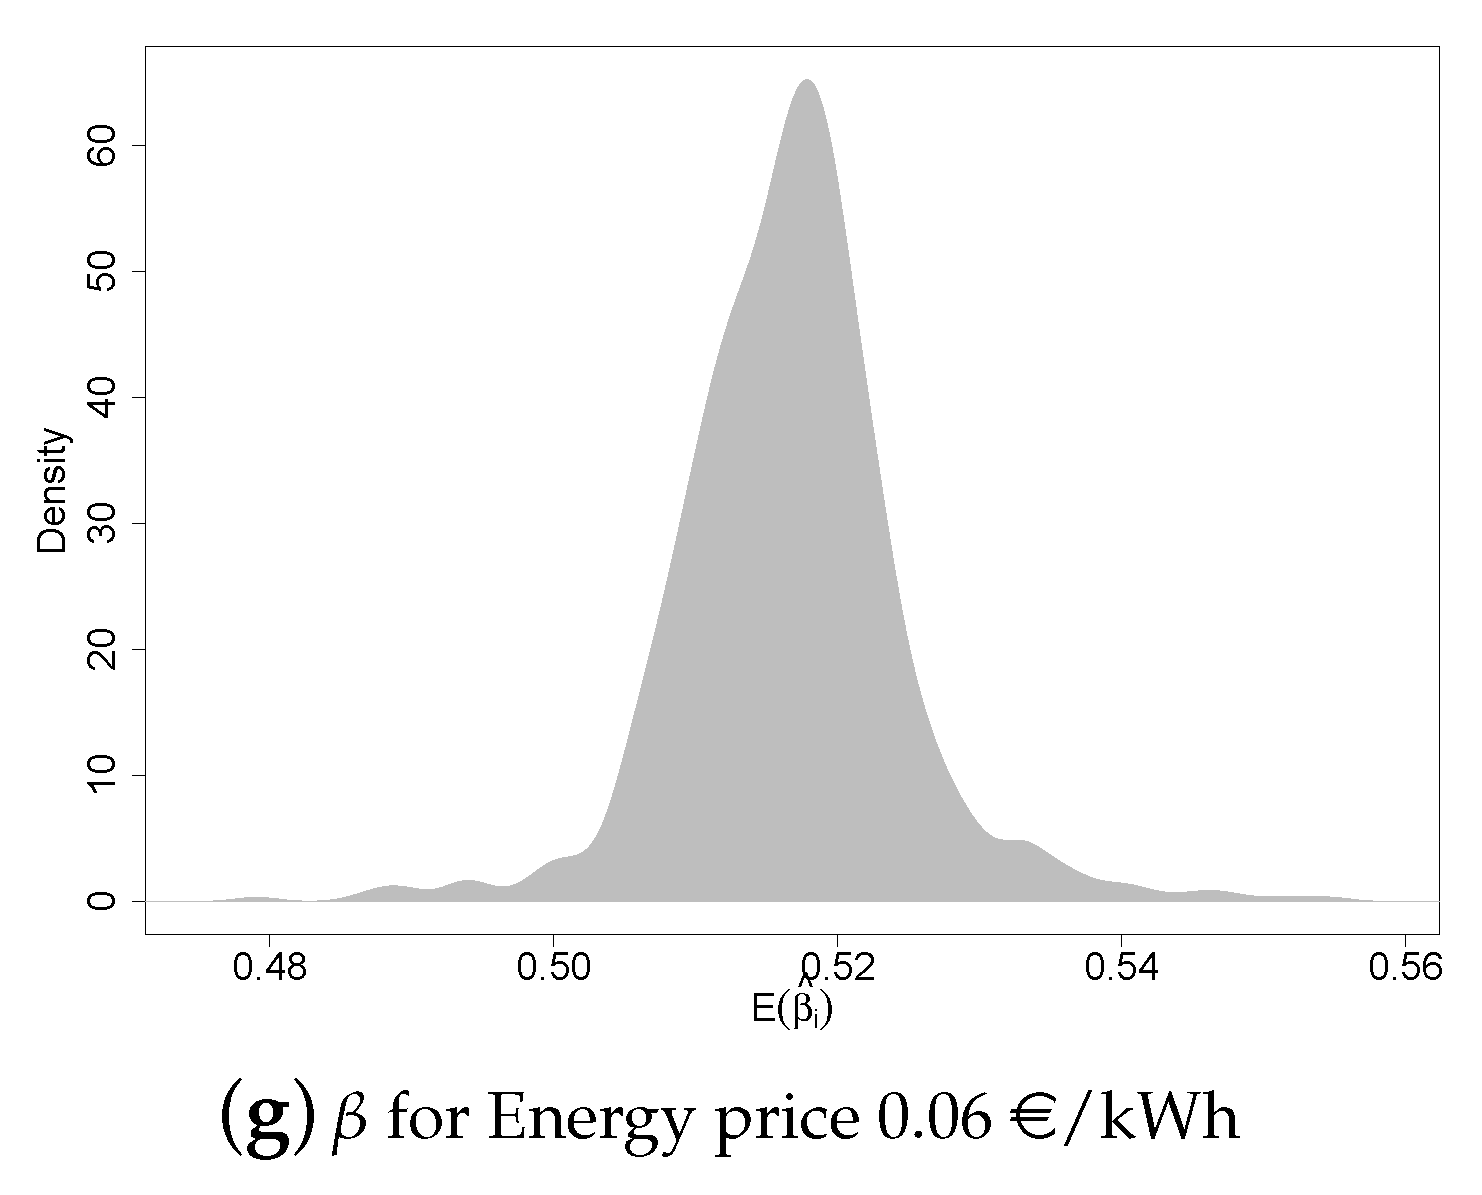
According to the analysis of the statistical significance of the standard deviation of random parameters in the RPL model (Table 4), all the variables, apart from energy price at 0.06 €/kWh, present a significant level of heterogeneity (p-value < 0.05). This result is confirmed by the analysis of the kernel density functions of the estimated random parameters (Figure 4). Looking in particular at the multimodal distribution of the individual coefficient for the attribute level ‘emissions—Low’ (Figure 4d), it emerges that, especially for this attribute, there might be three clusters of respondents with homogeneous preferences. This hypothesis was tested analysing the data with an LCM model.
The application of the LCM model confirmed the presence of three clusters of respondents. According to the results reported in Table 5, the first class includes 16% of the sample, the second class the majority of the sample (63%) and the third class the remaining 21%.
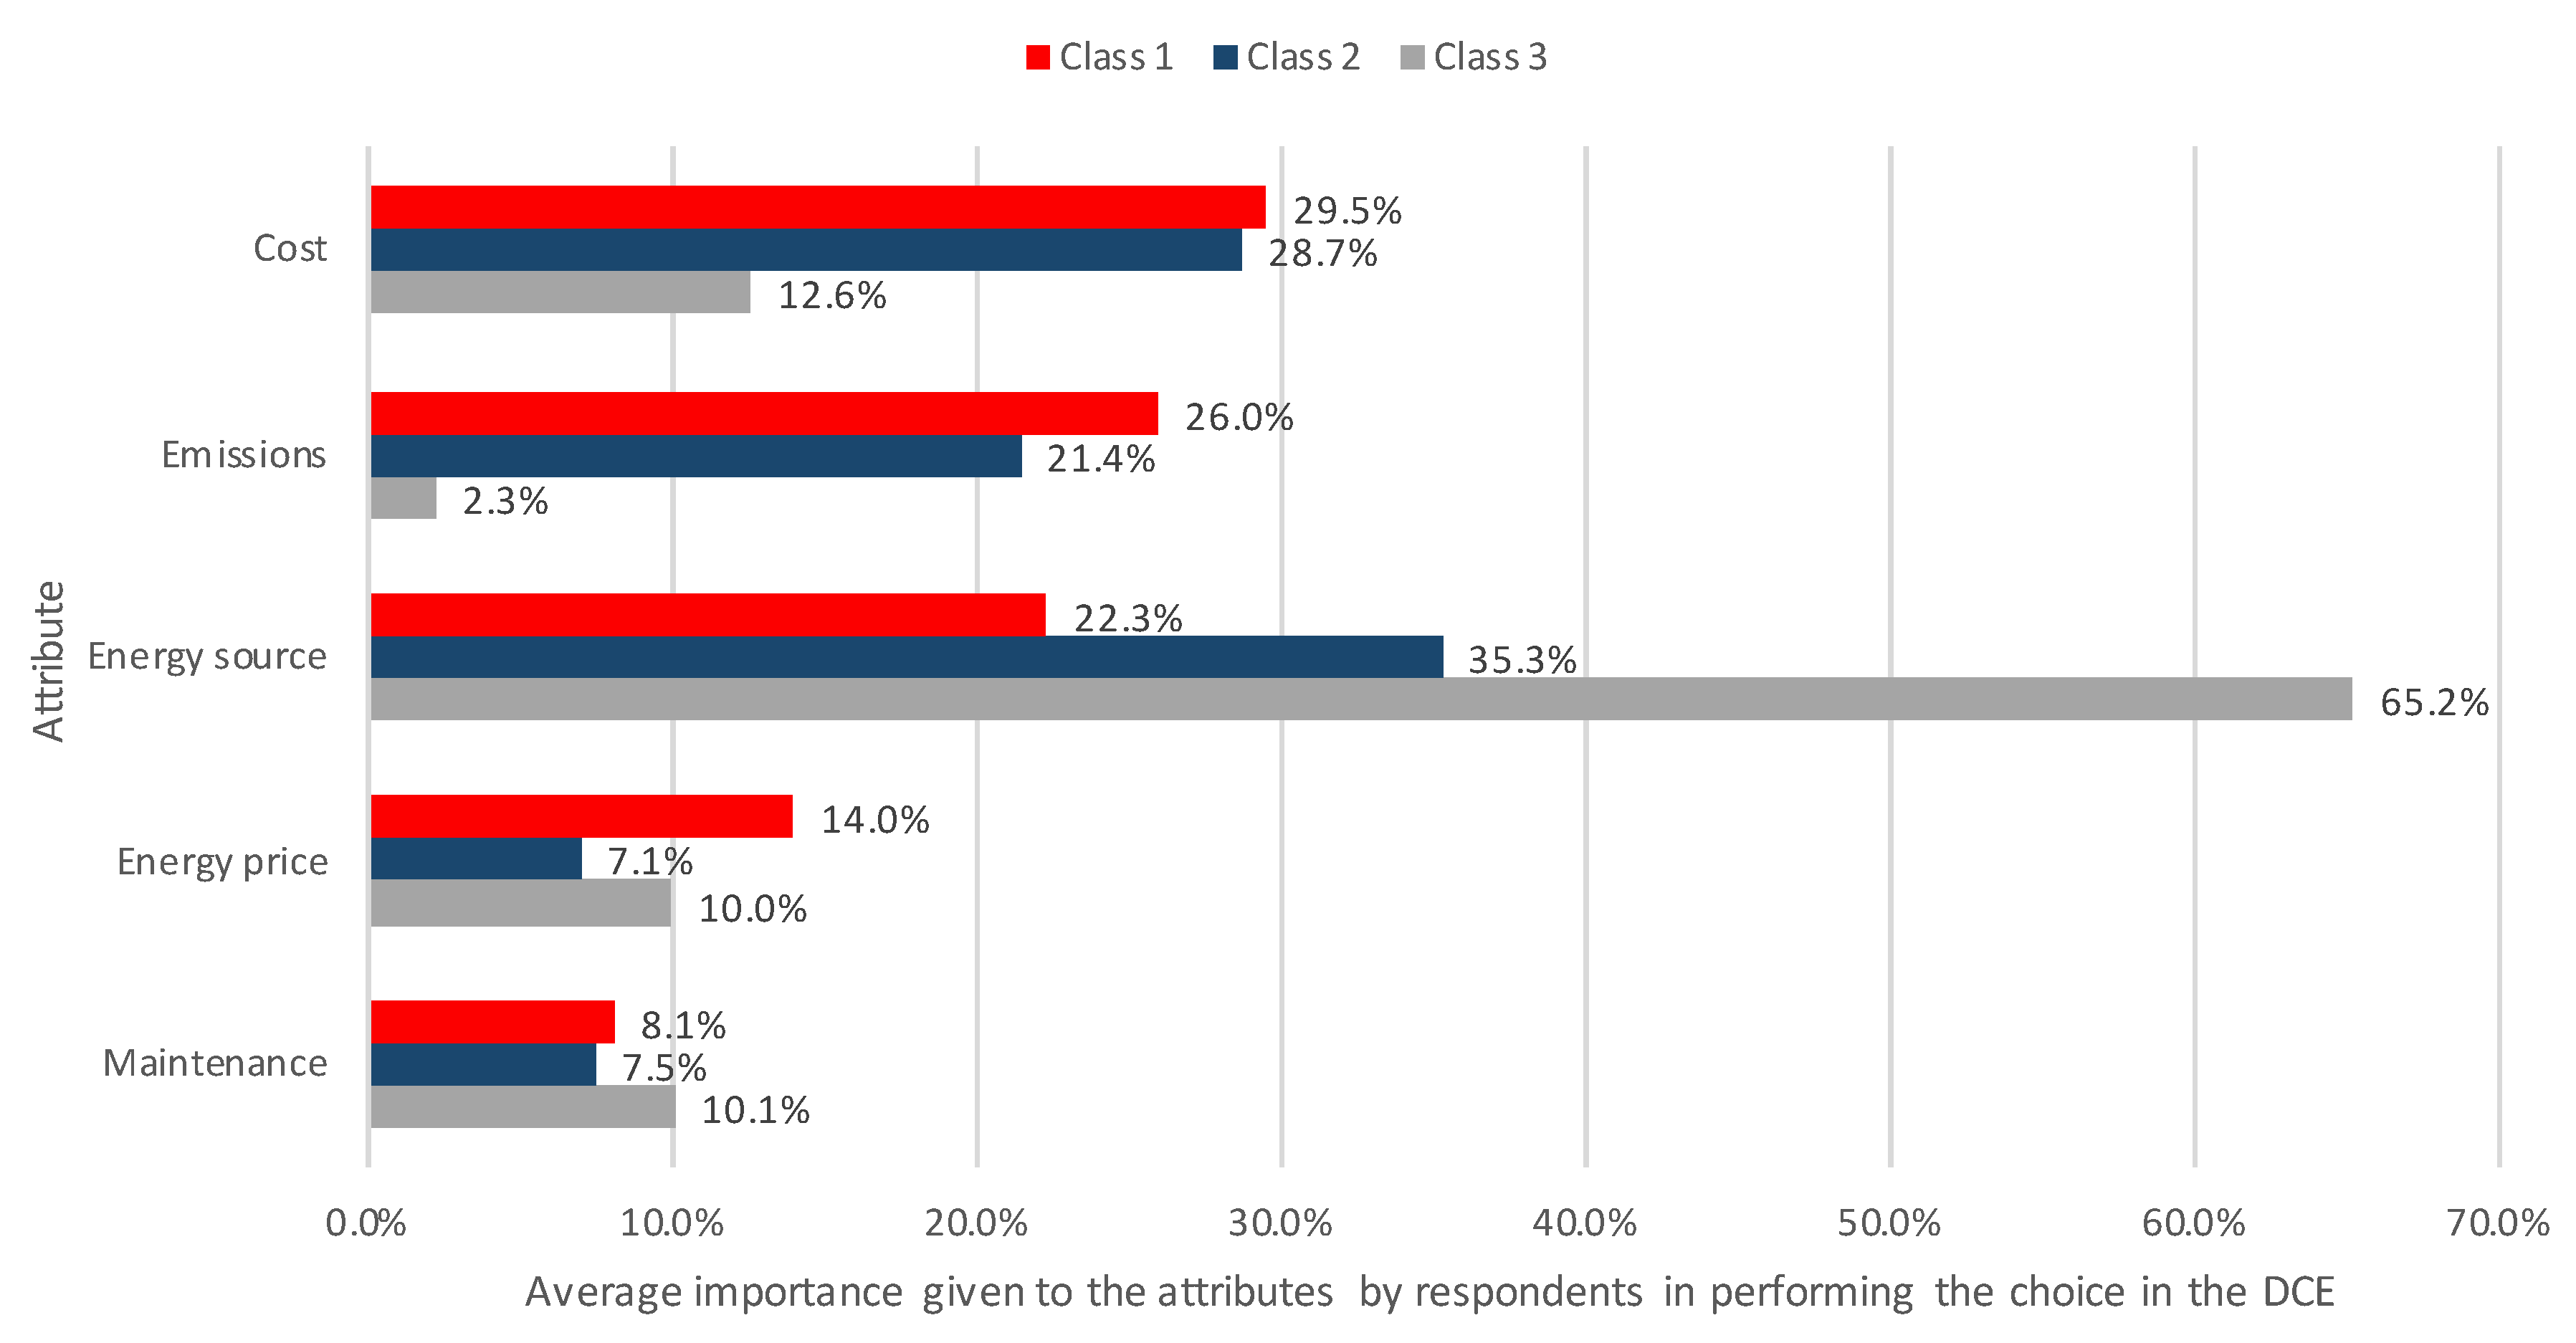
From the analysis of the relative importance given to the DCE attributes (Figure 5), it emerges that the three classes are quite different in terms of preferences. Members of class 1 give nearly the same importance to the system cost (29.5%) and the C O 2 emissions (26%), followed by the energy source (22.3%). The energy price (14%) and maintenance costs (8.1%) are given a secondary role in determining the probability of choice. Members of class 2 have a similar structure in relation to the relative importance of attributes: first, they consider the system energy source (35.3%) and then, the system cost (28.7%) and C O 2 emissions (21.4%). Similar to the previous class, the energy (7.1%) and maintenance cost (8.1%) attributes have the least influence when choosing a new energy system. The third class presents quite a distinctive character compared with the previous two. Its members are guided nearly exclusively by the system energy source type (65.2%) when making their choices; all other aspects are given relatively very low attention. The systems cost weight is 12.6%, maintenance and energy costs are about 10%, and C O 2 emissions are nearly neglected (2.3%).
In more detail, members of class one (16%) are particularly keen on a heating system that is environmentally friendly (Low C O 2 emissions), and has low maintenance and energy costs and they are very concerned about the system costs. We can define this class of people as ‘Green and cost conscious’. In terms of energy source, the utility of this group of customers is negatively affected by natural gas and heat pump systems (wood is not statistically significant).
The second class of respondents (‘Incentive driven’), which is the most numerous (63%), has a slight preference for natural gas and heat pump over wood systems, and is careful about C O 2 emissions and all system costs. Compared with members of the first class, members of this class are older, place more importance on public incentives, and less importance on the initial investment cost in driving their choice.
Members of class three (21%) pay particular attention to the energy source, showing a strong preference for wood, followed by natural gas, and finally by heat pump. These people care about maintenance and energy costs, and less about initial system cost. This class of people is not affected by the environmental effect of the system in making their choices and declared to be less affected by environmental concern than members of class one. In terms of age, class three has a higher age than class one and declares that they give more importance to the system cost and the presence of incentives. We can label this class as ‘Wood heaters lovers’.

3.4. Policy Implications

Looking in particular at the effect of a potential label reporting the C O 2 emissions of the heating system, we can conclude that it will have a significant and positive effect on 16% of the sample, a good effect on 63% and no effect on the remaining 21%. A further datum that emerges from our LCM analysis is that 79% of the sample pays great attention to the system’s initial cost, and that 21%, despite being less sensitive to the investment amount, has a very strong preference for wood systems.
This scenario suggests that public subsidies would be useful in driving consumer choices for a future environment-friendly heating system, but that they are not enough to induce consumers to switch to more ‘climate-friendly systems.’ Such economic incentive should be targeted to systems labelled as ‘greenhouse friendly’: the joint application of these measures (subsidy plus green label) should be able to provide a stronger incentive to consumers and have a stronger effect in the long run in terms of lowering the domestic sector climate effect.
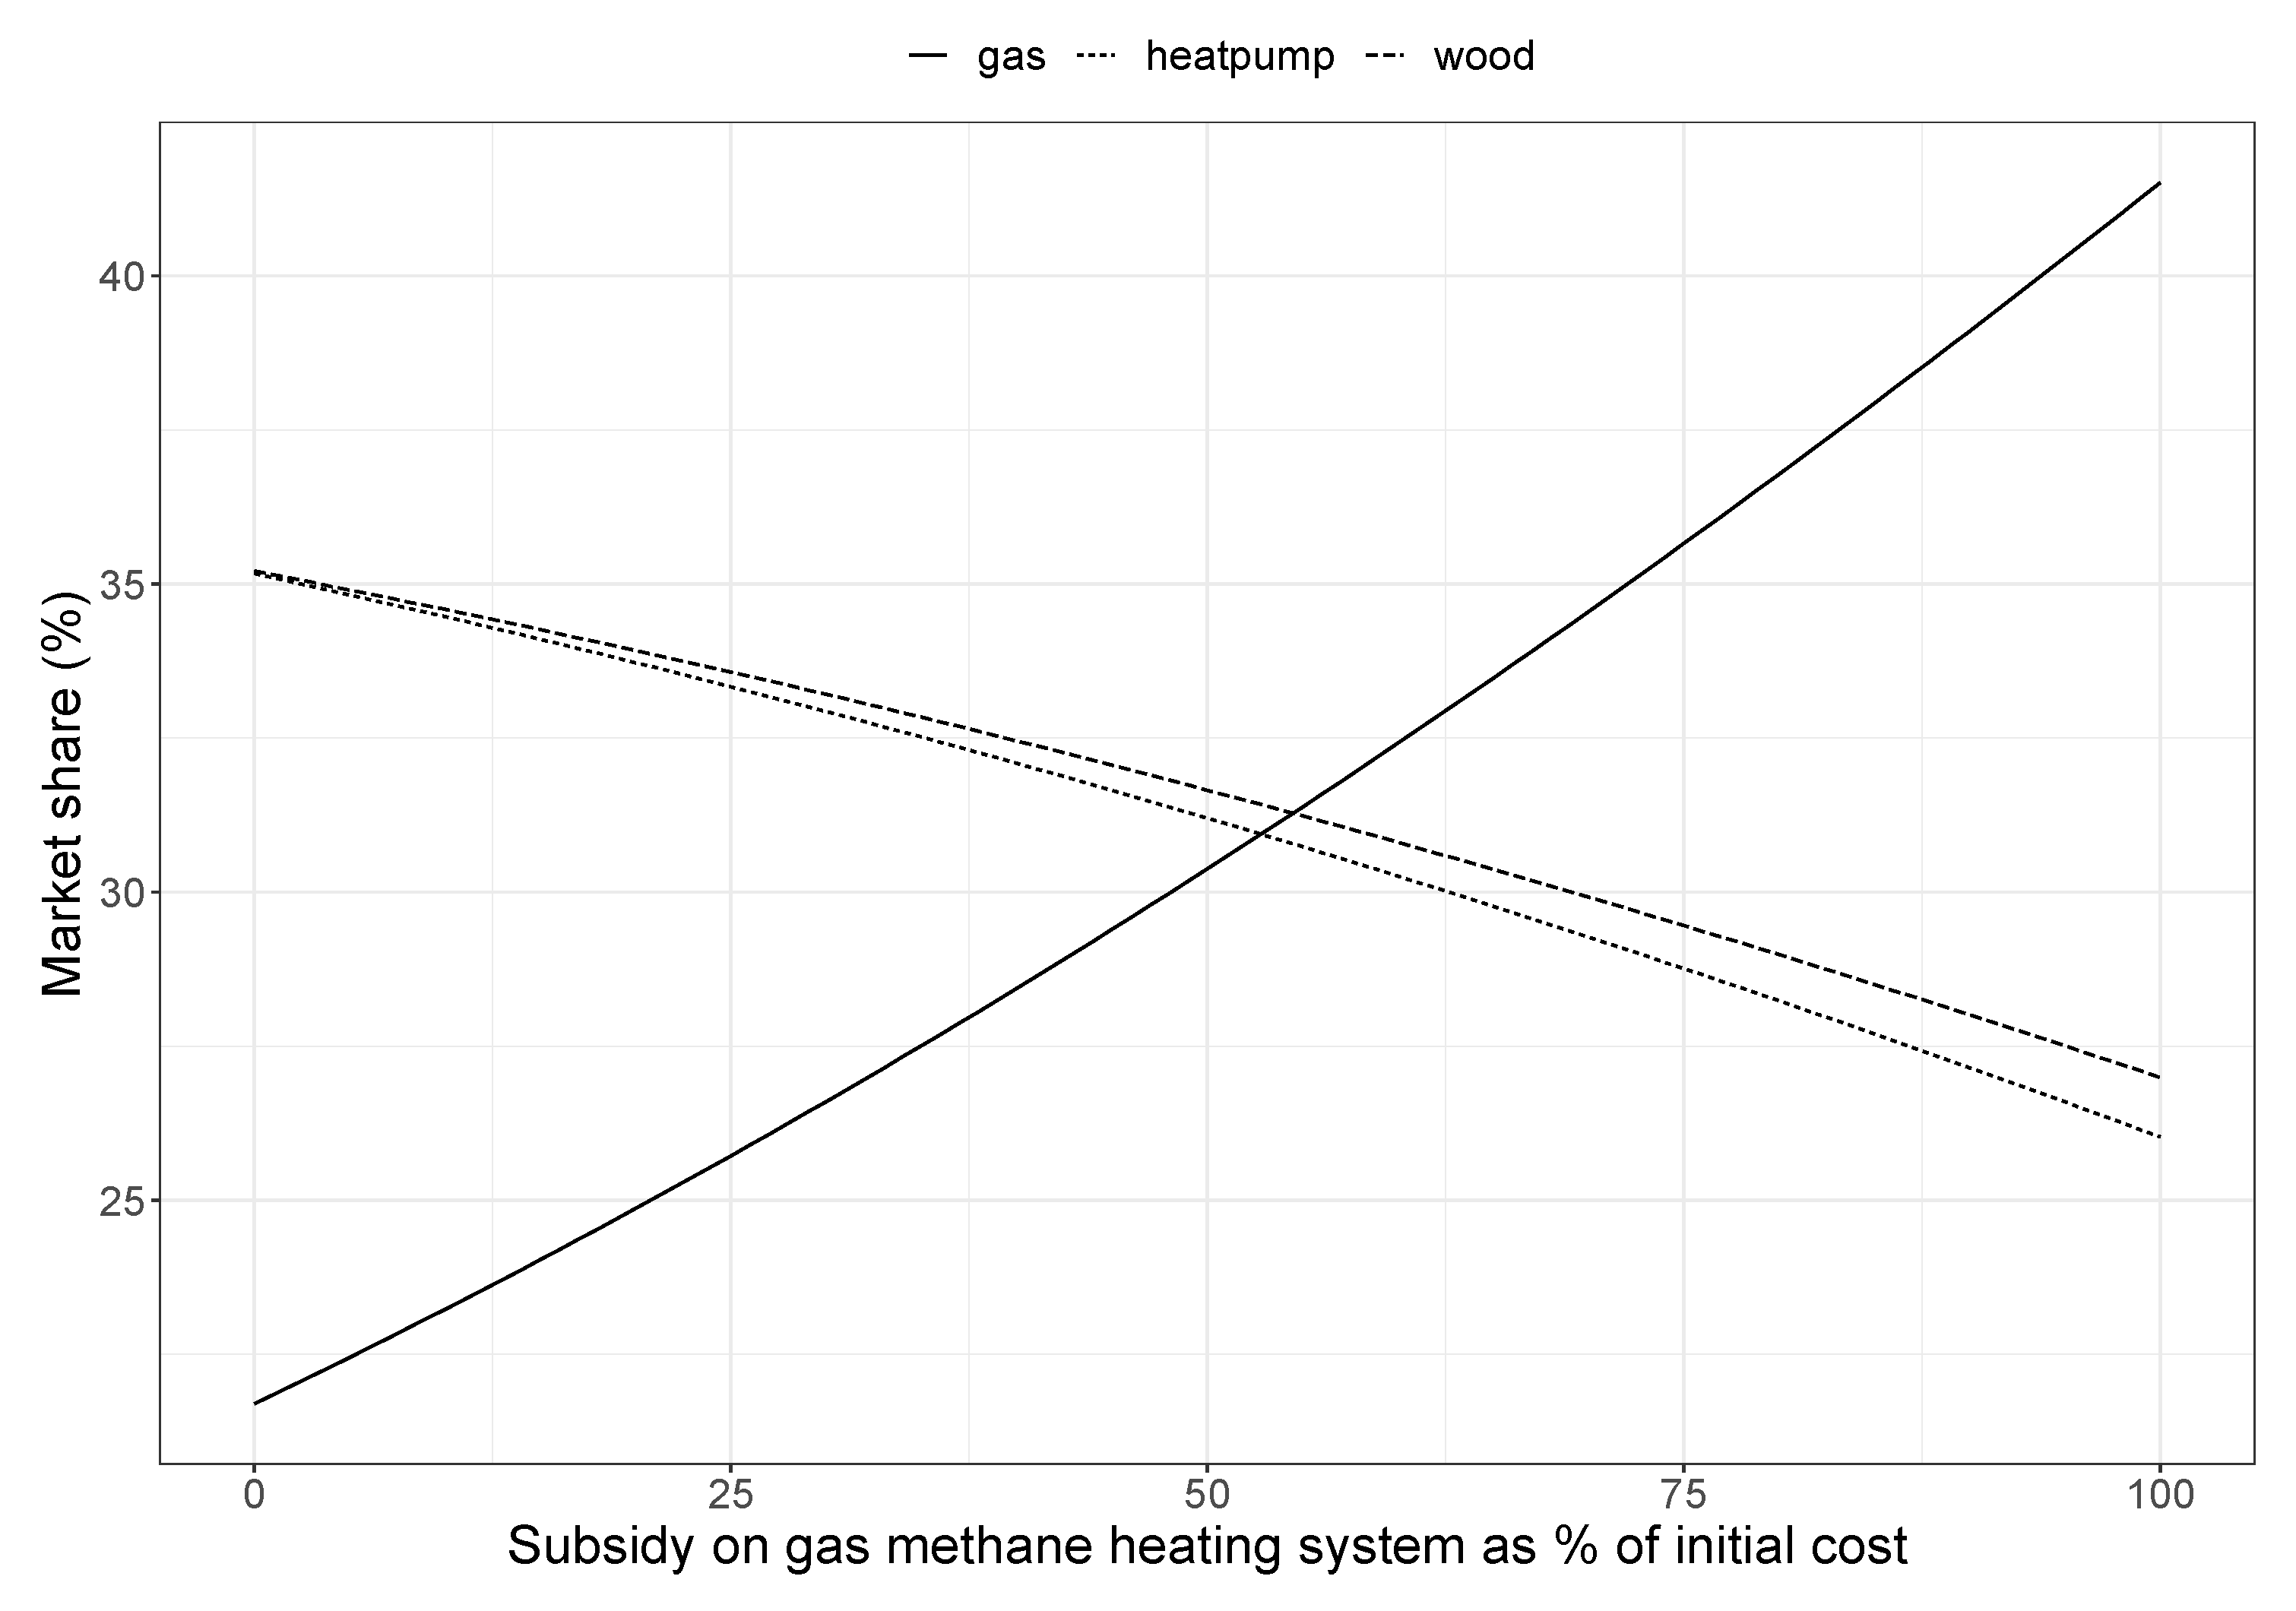
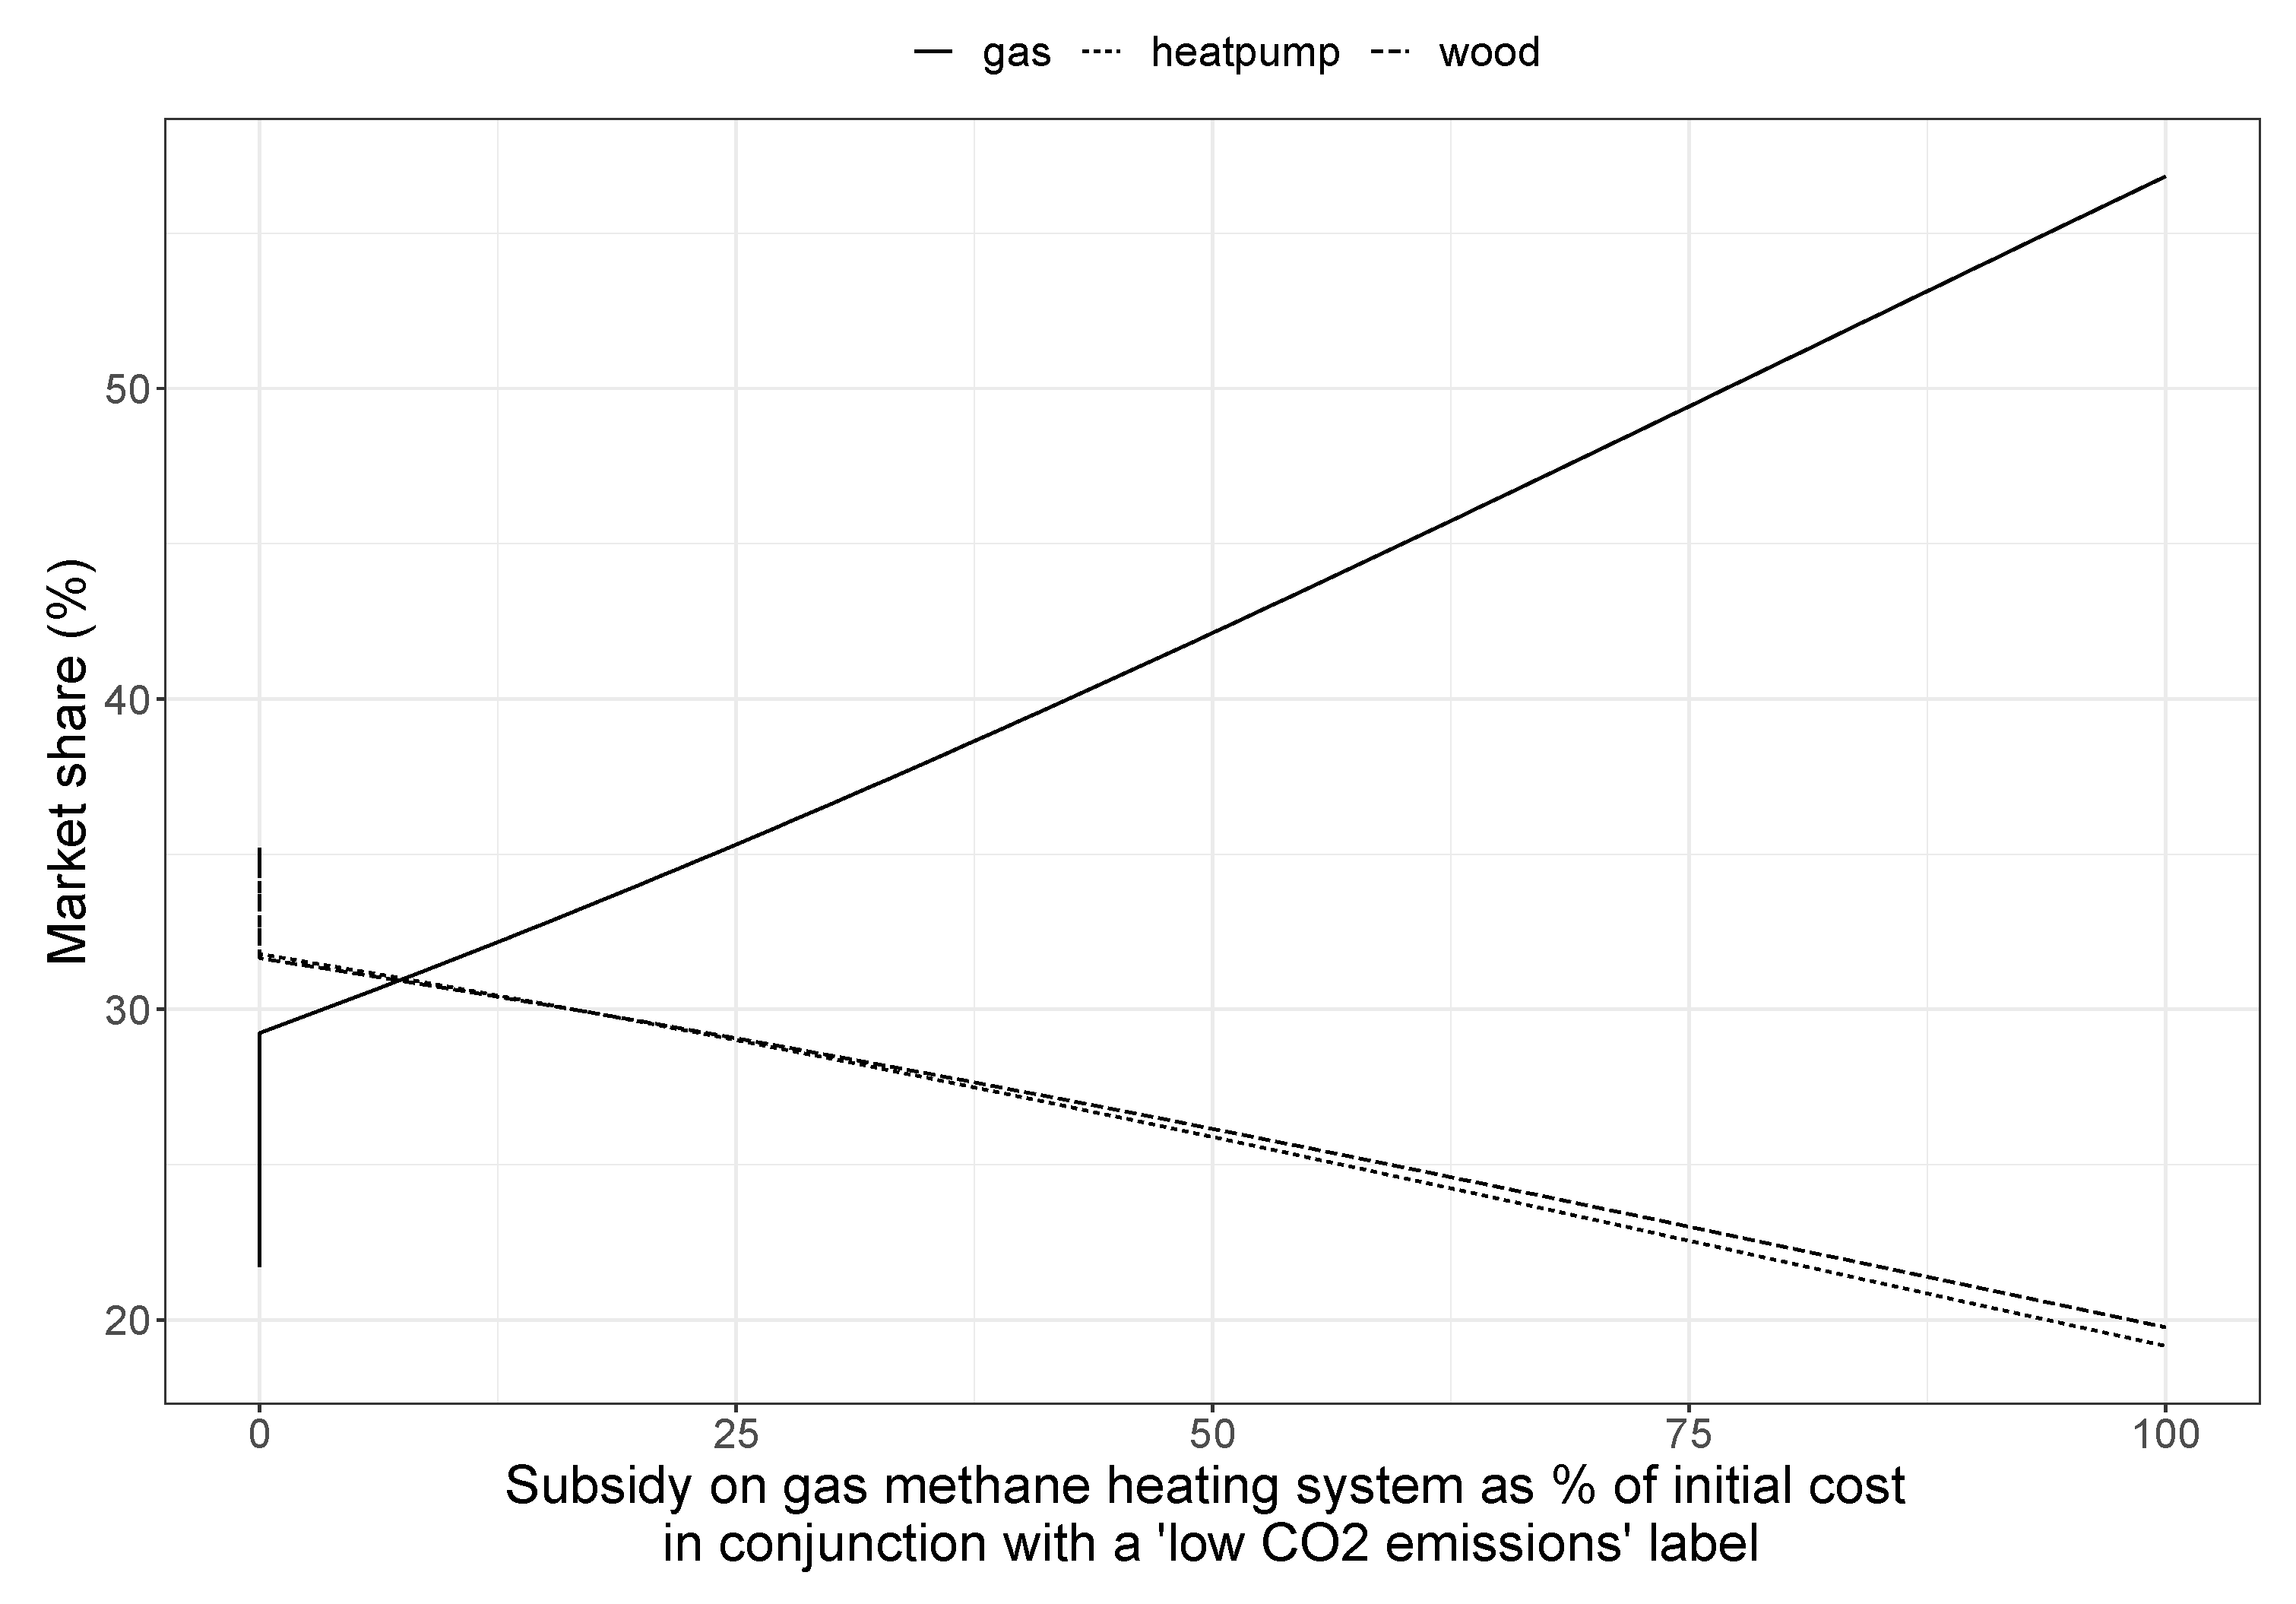
To test this hypothesis we ran some simulations using the MNL model results, in order to check how the market share changes when providing a subsidy and/or a green label on the heating system. In the first simulation (simulation 1), we provided a progressive subsidy from 0% to 100% of the natural gas system initial cost. In the second simulation (simulation 2), we applied the same subsidy and labelled the natural gas choice option as ‘low C O 2 emissions’. Results are displayed in Figure 6 and Figure 7. Before the simulations, the initial market share was 7.93% for the ‘no choice’ option, 21.7% for ‘natural gas’, 35.17% for ‘heat pump’ and 35.2% for ‘wood’.
The first simulation results in an increase in people choosing the natural gas system; with a 100% subsidy, the market share of natural gas grows to 41.5%, an increase of 19.8 percentage points, whereas, with the second simulation at the same subsidy level, the final market share is 56.82% (35.12 percentage points increase). The joint application of the subsidy and ‘low emission label’ results in a market share gain of 35.12 percentage points. It is interesting to notice that the effect of the label without any subsidy brings the market share of natural gas from 21.7% to 29.2%: an increase of 7.5 percentage points. If we compare the two simulations, the effect of the subsidy alone counts for a 19.8 percentage points increase (at a 100% subsidy level—simulation 1), while the combined effect (simulation 2) results in an increase of 35.12 percentage points, that is nearly 15.32 percentage points greater than the two effects taken separately.

4. Discussion and Conclusions

This study investigates the preferences of Italian home-owners when choosing a new domestic heating system. The focus of our analysis was on understanding the relative importance of key attributes that drive consumer choice and, consequently, the role of a potential label certifying the greenhouse effect of the heating system.
We used a DCE to elicit respondents’ preferences, and this study is the first, to our knowledge, that applies this technique to domestic heating system choices to investigate the relative importance of economic vs. green attributes and to simulate the effect on respondents’ preferences of the introduction of ‘green subsidies’ (i.e., a subsidy on the system cost linked to its environmental performance) in Italy.
Whereas the results of our analysis showed that, on average, respondents place primary importance on the initial system cost (36.4% importance), and then on its environmental performance (23.3% importance) and the type of energy source (17.7% importance) (RPL model results), they also highlighted that respondents have quite heterogeneous preferences with regard to the heating system choice. This aspect should be taken into careful consideration when designing policies aiming at C O 2 reduction from the domestic sector. For example, according to the LCM model results, a potential label reporting the C O 2 emissions of the heating system will have a great and positive effect on 16% of the sample, a good effect on 63%, and no effect on the remaining 21%. A further datum that emerges from our LCM analysis is that 79% of the sample (members of clusters 1 and 2) pays great attention to the system’s initial cost, and that 21%, despite being less sensitive to the investment amount, have a very strong preference for the energy source and wood systems in particular.
Although in a number of previous studies [65], environmental concerns seem not to be an important factor in guiding households’ heating system choices, our results suggest that greenhouse gas emission concerns could be a key determining factor in heating system choice across households. On the one hand, respondents consider it important to have heater systems that reduce the emissions into the atmosphere; on the other hand, they place primary importance on the magnitude of the investment in adopting green technology. As also highlighted by Balcombe et al. [66], on the one hand, environmental benefit appears to be a significant motivation to install greener heating systems, but on the other hand, capital costs are the most important barrier to installing these systems. Our results seem to confirm Balcombe et al. [66] findings: it seems that, all things being equal, to encourage Italian people to install heater systems that reduce carbon emissions, it would be better to contribute to the initial cost of the plant than to reduce the management costs. It seems that an incentive-based regulation could influence the willingness of private home-owners and motivate them to renovate their heating systems. Our simulations support the hypothesis that policymakers will achieve greater results in terms of reducing domestic greenhouse gas emissions by applying a combined policy that leverages the importance citizens accord to the different characteristics of the heating system. Our results suggest that the application of a ‘low C O 2 emissions’ label would amplify the effect of a subsidy that reduces the initial system costs. The combined effect of a ‘low C O 2 emissions’ label and a subsidy on the system cost leads to an increase in the market share that is nearly 15.32 percentage points greater than the effect of a subsidy alone (considering a subsidy of 100% of the system cost, while the increase is of 13 percentage points greater with a subsidy of 65% of the system cost alone).
A further aspect that should be considered is the strong role that a specific energy source plays on people’s preferences: for example, in our case 21% of people show a very strong preference for wood systems. This might be because of the regional environment of the person, such as the Alpine mountains with a high availability of wood for heating purposes, or because of a subjective preference for the kind of heat that a system provides, for example, a perceived ‘drier heat’ provided by wood systems. In this respect, policymakers should consider such differences, and design a green-labelling policy/low emissions certification for the different systems. This would also help capture the attention of people that would otherwise stick to an ‘energy source’ specific system, neglecting to consider its greenhouse effect.
These insights could support designing socially acceptable governmental policies and tools, to improve and increase the share of sustainable systems used by residential households for heating.
Given the objective of the survey data, this study might not include all aspects of renewable energy sources. For this reason, it is suggested that future studies should incorporate respondents’ opinions on a larger range of heating systems characteristics. Moreover, it would be interesting to investigate consumers’ preferences in other regions and countries in order to compare our results. Despite its limitations, we believe this study contributes to the existing literature on consumer perceptions about ’climate friendly’ domestic heating systems by identifying the drivers of heating system choices and adding information that may be useful both to marketers and institutional decision makers.

Author Contributions

S.T., F.M. and F.N. conceived the study and oversaw the data collection; D.V. and T.T. developed the DCE experimental design and performed the data analysis; S.T. and F.M. contributed Section 1; S.T. contributed Section 2.1; D.V. contributed Section 2.2; T.T. and F.N. contributed Section 2.3; S.T. contributed Section 3.1 and Section 3.2; D.V. and T.T. contributed Section 3.3; D.V. contributed Section 3.4; S.T. and F.M. contributed Section 4; writing—review and editing, D.V. and S.T.; supervision, F.M. and T.T.

Funding

This research received no external funding.

Conflicts of Interest

The authors declare no conflict of interest.

Abbreviations

The following abbreviations are used in this manuscript:
C O 2 Carbon dioxide
DCEDiscrete Choice Experiment
LCMLatent Class Model
IIAIndependence from Irrelevant Alternatives
MNLMultinomial Logit
RPLRandom Parameter Logit (also known as Mixed Logit)
WTPWillingness to pay

References

  1. IPCC. Summary for Policymakers. In Global Warming of 1.5 °C. An IPCC Special Report on the Impacts of Global Warming of 1.5 °C Above Pre-Industrial Levels and Related Global Greenhouse Gas Emission Pathways, in the Context of Strengthening the Global Response to the Threat of Climate Change, Sustainable Development, and Efforts to Eradicate Poverty; Masson-Delmotte, V., Zhai, P., Pörtner, H.O., Roberts, D., Skea, J., Shukla, P., Pirani, A., Moufouma-Okia, W., Péan, C., Pidcock, R., et al., Eds.; World Meteorological Organization: Geneva, Switzerland, 2018; p. 32. [Google Scholar]
  2. Committee on Climate Change. A Roadmap for Moving to a Competitive Low Carbon Economy in 2050; Technical Report COM(2011) 112 Final; European Commission: Brussels, Belgium, 2011. [Google Scholar]
  3. Muntean, M.; Guizzardi, D.; Schaaf, E.; Crippa, M.; Solazzo, E.; Olivier, J.; Vignati, E. Fossil CO2 Emissions of All World Countries—2018 Report; Technical Report EUR 29433 EN, JRC113738; Publications Office of the European Union: Brussels, Belgium, 2018. [Google Scholar] [CrossRef]
  4. UK National Statistics. 2017 UK Greenhouse Gas Emissions, Provisional Figures; Statistical Release: National Statistics; Department for Business, Energy & Industrial Strategy: London, UK, 2018. [Google Scholar]
  5. ENEA. Energy Efficiency Annual Report 2017 Executive Summary; Technical Report; Italian National Agency for New Technologies, Energy and Sustainable Economic Development: Rome, Italy, 2017. [Google Scholar]
  6. Olsson, L.; Wetterlund, E.; Söderström, M. Assessing the climate impact of district heating systems with combined heat and power production and industrial excess heat. Resour. Conserv. Recycl. 2015, 96, 31–39. [Google Scholar] [CrossRef]
  7. Slini, T.; Giama, E.; Papadopoulos, A. The impact of economic recession on domestic energy consumption. Int. J. Sustain. Energy 2015, 34, 259–270. [Google Scholar] [CrossRef]
  8. Hong, B.; Howarth, R.W. Greenhouse gas emissions from domestic hot water: Heat pumps compared to most commonly used systems. Energy Sci. Eng. 2016, 4, 123–133. [Google Scholar] [CrossRef]
  9. Hensher, D.A. Stated preference analysis of travel choices: The state of practice. Transportation 1994, 21, 107–133. [Google Scholar] [CrossRef]
  10. Bateman, I.J.; Carson, R.T.; Day, B.; Hanemann, M.; Hanley, N.; Hett, T.; Jones-Lee, M.; Loomes, G.; Mourato, S.; Özdemiroglu, E.; et al. Economic Valuation with Stated Preference Techniques: A Manual; Elgar: Cheltenham, UK, 2002; 458p. [Google Scholar]
  11. Brown, T.C. Introduction to Stated Preference Methods. In A Primer on Nonmarket Valuation; Champ, P.A., Boyle, K.J., Brown, T.C., Eds.; Springer Netherlands: Dordrecht, The Netherlands, 2003; pp. 99–110. [Google Scholar] [CrossRef]
  12. Karytsas, S.; Theodoropoulou, H. Public awareness and willingness to adopt ground source heat pumps for domestic heating and cooling. Renew. Sustain. Energy Rev. 2014, 34, 49–57. [Google Scholar] [CrossRef]
  13. Rennings, K.; Brohmann, B.; Nentwich, J.; Schleich, J.; Traber, T.; Wüstenhagen, R. Sustainable Energy Consumption in Residential Buildings; Springer Science & Business Media: Berlin/Heidelberg, Germany, 2012; Volume 44. [Google Scholar] [CrossRef]
  14. Revelt, D.; Train, K. Mixed Logit with Repeated Choices: Households’ Choices of Appliance Efficiency Level. Rev. Econ. Stat. 1998, 80, 647–657. [Google Scholar] [CrossRef]
  15. Cicia, G.; Cembalo, L.; Del Giudice, T.; Palladino, A. Fossil energy versus nuclear, wind, solar and agricultural biomass: Insights from an Italian national survey. Energy Policy 2012, 42, 59–66. [Google Scholar] [CrossRef]
  16. Claudy, M.C.; Michelsen, C.; O’Driscoll, A. The diffusion of microgeneration technologies—Assessing the influence of perceived product characteristics on home owners’ willingness to pay. Energy Policy 2011, 39, 1459–1469. [Google Scholar] [CrossRef]
  17. Kostakis, I.; Sardianou, E. Which factors affect the willingness of tourists to pay for renewable energy? Renew. Energy 2012, 38, 169–172. [Google Scholar] [CrossRef]
  18. Ladenburg, J. Stated public preferences for on-land and offshore wind power generation—A review. Wind Energy 2009, 12, 171–181. [Google Scholar] [CrossRef]
  19. Vecchiato, D.; Tempesta, T. Public preferences for electricity contracts including renewable energy: A marketing analysis with choice experiments. Energy 2015, 88, 168–179. [Google Scholar] [CrossRef]
  20. Lim, S.Y.; Yoo, S.H. Will South Korean Residential Consumers Accept the Renewable Heat Incentive Scheme? A Stated Preference Approach. Energies 2019, 12, 1910. [Google Scholar] [CrossRef]
  21. Goett, A.A.; Hudson, K.; Train, K.E. Customers’ Choice Among Retail Energy Suppliers: The Willingness-to-Pay for Service Attributes. Energy J. 2000, 21, 1–28. [Google Scholar] [CrossRef]
  22. Jaccard, M.; Dennis, M. Estimating home energy decision parameters for a hybrid energy—Economy policy model. Environ. Model. Assess. 2006, 11, 91–100. [Google Scholar] [CrossRef]
  23. Banfi, S.; Farsi, M.; Filippini, M.; Jakob, M. Willingness to pay for energy-saving measures in residential buildings. Energy Econ. 2008, 30, 503–516. [Google Scholar] [CrossRef] [Green Version]
  24. Scarpa, R.; Willis, K. Willingness-to-pay for renewable energy: Primary and discretionary choice of British households’ for micro-generation technologies. Energy Econ. 2010, 32, 129–136. [Google Scholar] [CrossRef]
  25. Achtnicht, M. Do environmental benefits matter? Evidence from a choice experiment among house owners in Germany. Ecol. Econ. 2011, 70, 2191–2200. [Google Scholar] [CrossRef]
  26. Takama, T.; Lambe, F.; Johnson, F.X.; Arvidson, A.; Atanassov, B.; Debebe, M.; Nilsson, L.; Tella, P.; Tsephel, S. Will African Consumers Buy Cleaner Fuels and Stoves? A Household Energy Economic Analysis Model for the Market Introduction of Bio-Ethanol Cooking Stoves in Ethiopia, Tanzania, and Mozambique; Technical report; Stockholm Environment Institute: Stockholm, Sweden, 2011. [Google Scholar]
  27. Willis, K.; Scarpa, R.; Gilroy, R.; Hamza, N. Renewable energy adoption in an ageing population: Heterogeneity in preferences for micro-generation technology adoption. Energy Policy 2011, 39, 6021–6029. [Google Scholar] [CrossRef]
  28. Zorić, J.; Hrovatin, N. Household willingness to pay for green electricity in Slovenia. Energy Policy 2012, 47, 180–187. [Google Scholar] [CrossRef]
  29. Rouvinen, S.; Matero, J. Stated preferences of Finnish private homeowners for residential heating systems: A discrete choice experiment. Biomass Bioenergy 2013, 57, 22–32. [Google Scholar] [CrossRef]
  30. Ruokamo, E. Household preferences of hybrid home heating systems—A choice experiment application. Energy Policy 2016, 95, 224–237. [Google Scholar] [CrossRef]
  31. Salm, S.; Hille, S.L.; Wüstenhagen, R. What are retail investors’ risk-return preferences towards renewable energy projects? A choice experiment in Germany. Energy Policy 2016, 97, 310–320. [Google Scholar] [CrossRef]
  32. Franceschinis, C.; Scarpa, R.; Thiene, M.; Rose, J.; Moretto, M.; Cavalli, R. Exploring the Spatial Heterogeneity of Individual Preferences for Ambient Heating Systems. Energies 2016, 9, 407. [Google Scholar] [CrossRef]
  33. Franceschinis, C.; Thiene, M.; Scarpa, R.; Rose, J.; Moretto, M.; Cavalli, R. Adoption of renewable heating systems: An empirical test of the diffusion of innovation theory. Energy 2017, 125, 313–326. [Google Scholar] [CrossRef] [Green Version]
  34. Sagebiel, J. Preference heterogeneity in energy discrete choice experiments: A review on methods for model selection. Renew. Sustain. Energy Rev. 2017, 69, 804–811. [Google Scholar] [CrossRef]
  35. Ozcan, M. Factors influencing the electricity generation preferences of Turkish citizens: Citizens’ attitudes and policy recommendations in the context of climate change and environmental impact. Renew. Energy 2019, 132, 381–393. [Google Scholar] [CrossRef]
  36. Jia, J.J.; Xu, J.H.; Fan, Y. Public acceptance of household energy-saving measures in Beijing: Heterogeneous preferences and policy implications. Energy Policy 2018, 113, 487–499. [Google Scholar] [CrossRef]
  37. Curtis, J.; McCoy, D.; Aravena Novielli, C. Determinants of Residential Heating System Choice: An Analysis of Irish Households; Working Paper 576; The Economic and Social Research Institute (ESRI): Dublin, Ireland, 2017. [Google Scholar]
  38. Bollino, C.A. The Willingness to Pay for Renewable Energy Sources: The Case of Italy with Socio-demographic Determinants. Energy J. 2009, 30, 81–96. [Google Scholar]
  39. Strazzera, E.; Mura, M.; Contu, D. Combining choice experiments with psychometric scales to assess the social acceptability of wind energy projects: A latent class approach. Energy Policy 2012, 48, 334–347. [Google Scholar] [CrossRef]
  40. Strazzera, E.; Mura, M.; Statzu, V. Powering the change: A Contingent Valuation study on the determinants of demand for green vs. brown energy. J. Environ. Econ. Policy 2012, 1, 146–173. [Google Scholar] [CrossRef]
  41. Bigerna, S.; Polinori, P. Italian households’ willingness to pay for green electricity. Renew. Sustain. Energy Rev. 2014, 34, 110–121. [Google Scholar] [CrossRef]
  42. Caporale, D.; De Lucia, C. Social acceptance of on-shore wind energy in Apulia Region (Southern Italy). Renew. Sustain. Energy Rev. 2015, 52, 1378–1390. [Google Scholar] [CrossRef]
  43. Vecchiato, D. How do you like wind farms? Understanding people’s preferences about new energy landscapes with choice experiments. AESTIMUM 2014, 64, 15–37. [Google Scholar] [CrossRef]
  44. Hensher, D.A.; Rose, J.M.; Greene, W.H. Applied Choice Analysis: A Primer; Cambridge University Press: Cambridge, UK, 2005. [Google Scholar]
  45. Hauber, A.B.; González, J.M.; Groothuis-Oudshoorn, C.G.; Prior, T.; Marshall, D.A.; Cunningham, C.; IJzerman, M.J.; Bridges, J.F. Statistical Methods for the Analysis of Discrete Choice Experiments: A Report of the ISPOR Conjoint Analysis Good Research Practices Task Force. Value Health 2016, 19, 300–315. [Google Scholar] [CrossRef] [PubMed] [Green Version]
  46. Ben-Akiva, M.; McFadden, D.; Train, K. Foundations of Stated Preference Elicitation: Consumer Behavior and Choice-based Conjoint Analysis. Found. Trends Econ. 2019, 10, 1–144. [Google Scholar] [CrossRef] [Green Version]
  47. Hanley, N.; Wright, R.; Adamowicz, V. Using Choice Experiments to Value the Environment. Environ. Resour. Econ. 1998, 11, 413–428. [Google Scholar] [CrossRef]
  48. Thurstone, L.L. A law of comparative judgment. Psychol. Rev. 1927, 34, 273–286. [Google Scholar] [CrossRef]
  49. Luce, R.D. Individual Choice Behavior: A Theoretical Analysis; Wiley: New York, NY, USA, 1959. [Google Scholar]
  50. McFadden, D. Conditional Logit Analysis of Qualitative Choice Behavior. In Frontiers in Econometrics; Zarembka, P., Ed.; Academic Press: New York, NY, USA, 1974; pp. 105–142. [Google Scholar]
  51. Greene, W.; Hensher, D. A latent class model for discrete choice analysis: Contrasts with mixed logit. Transp. Res. Part B Methodol. 2003, 37, 681–698. [Google Scholar] [CrossRef]
  52. McFadden, D.; Train, K. Mixed MNL models for discrete response. J. Appl. Econ. 2000, 15, 447–470. [Google Scholar] [CrossRef]
  53. Train, K. Discrete Choice Methods with Simulation, 2nd ed.; Cambridge University Press: Cambridge, UK, 2009; ISBN 0-521-74738-4. [Google Scholar]
  54. Swait, J. A structural equation model of latent segmentation and product choice for cross-sectional revealed preference choice data. J. Retail. Consum. Serv. 1994, 1, 77–89. [Google Scholar] [CrossRef]
  55. R Core Team. R: A Language and Environment for Statistical Computing; R Foundation for Statistical Computing: Vienna, Austria, 2018. [Google Scholar]
  56. Sarrias, M.; Daziano, R. Multinomial Logit Models with Continuous and Discrete Individual Heterogeneity in R: The gmnl Package. J. Stat. Softw. Artic. 2017, 79, 1–46. [Google Scholar] [CrossRef]
  57. Croissant, Y. Estimation of Multinomial Logit Models in R: The Mlogit Packages. R Package Vignette, Version 0.4-2. 2019. Available online: https://CRAN.R-project.org/package=mlogit (accessed on 3 July 2019).
  58. Kuhfeld, W.F. Conjoint analysis. SAS Tech. Pap. MRH 2010, 2010, 681–801. [Google Scholar]
  59. Ku, S.J.; Yoo, S.H. Willingness to pay for renewable energy investment in Korea: A choice experiment study. Renew. Sustain. Energy Rev. 2010, 14, 2196–2201. [Google Scholar] [CrossRef]
  60. García-Maroto, I.; García-Maraver, A.; Muñoz-Leiva, F.; Zamorano, M. Consumer knowledge, information sources used and predisposition towards the adoption of wood pellets in domestic heating systems. Renew. Sustain. Energy Rev. 2015, 43, 207–215. [Google Scholar] [CrossRef]
  61. Mahapatra, K.; Gustavsson, L. An adopter-centric approach to analyze the diffusion patterns of innovative residential heating systems in Sweden. Energy Policy 2008, 36, 577–590. [Google Scholar] [CrossRef]
  62. Nair, G.; Gustavsson, L.; Mahapatra, K. Factors influencing energy efficiency investments in existing Swedish residential buildings. Energy Policy 2010, 38, 2956–2963. [Google Scholar] [CrossRef]
  63. Boone, H.N.; Boone, D.A. Analyzing likert data. J. Ext. 2012, 50, 1–5. [Google Scholar]
  64. Louviere, J.J.; Hensher, D.A.; Swait, J.D. Stated Choice Methods: Analysis and Applications; Cambridge University Press: Cambridge, UK, 2000. [Google Scholar]
  65. Zhang, L.; Wu, J.; Liu, H. Turning green into gold: A review on the economics of green buildings. J. Clean. Prod. 2018, 172, 2234–2245. [Google Scholar] [CrossRef]
  66. Balcombe, P.; Rigby, D.; Azapagic, A. Motivations and barriers associated with adopting microgeneration energy technologies in the UK. Renew. Sustain. Energy Rev. 2013, 22, 655–666. [Google Scholar] [CrossRef]
Figure 1. One of the DCE choice cards presented to respondents.
Energies 12 02632 g001
Figure 2. Comparison of the DCE, Multinomial logit (MNL) and random parameter logit (RPL) models’ estimated coefficients.
Energies 12 02632 g002
Figure 3. DCE: MNL and RPL models’ estimated relative importance of attributes.
Energies 12 02632 g003
Figure 4. Kernel density functions of individual parameters distribution for RPL model.
Energies 12 02632 g004aEnergies 12 02632 g004b
Figure 5. The Latent Class model (LCM)’s estimated relative importance of attributes.
Energies 12 02632 g005
Figure 6. Simulation 1: MNL simulation on market share change providing only a subsidy to natural gas.
Energies 12 02632 g006
Figure 7. Simulation 2: MNL simulation on market share change providing a subsidy and a ‘climate friendly’ label to natural gas.
Energies 12 02632 g007
Table 1. Choice experiment attributes and their corresponding levels.
AttributeLevels
Energy price (€/kWh)0.03; 0.06; 0.09
Technologywood heating; heat pump; natural gas heating
Greenhouse gas emissionsLow; High
Annual maintenance costLow; High
Initial system cost (€)3000; 7000; 10,000
Table 2. Respondents socio-economic characteristics.
VariableRespondents’ MeanItalian Population (Census Data-2011)
Age (years)37.431.4
Gender‘men’ 53%48%
Educational level‘High’ 77%29%
Employment position‘Employed’ 42%57%
Family members:‘3–4’ 59%41%
Environmental assoc. membership:‘No’ 94%/
Table 3. Respondents’ general opinion on energy sources. Likert scale ranging from 1 (disagreement) to 5 (agreement).
VariableMeanModeMedianMinMaxStd.Err.95% CI
I prefer:
- Solar4.5755050.026[4.52; 4.62]
- Wind4.0254050.039[3.95; 4.10]
- Geothermal3.8554050.040[3.77; 3.93]
- Hydropower3.8544050.036[3.78; 3.92]
- Wood3.3844050.044[3.29; 3.46]
- Natural gas3.3733050.036[3.30; 3.44]
- Oil2.2812050.040[2.20; 2.36]
- Nuclear1.9611050.042[1.88; 2.04]
- Coal1.6711050.033[1.61; 1.74]
When I choose an energy source I pay special attention to:
- low environmental impacts4.2854.5150.031[4.22; 4.35]
- the presence of a public incentive3.9454150.037[3.87; 4.02]
- low cost sources3.7854150.038[3.71; 3.86]
Table 4. DCE models’ estimates.
MNLRPL
n a t u r a l   g a s 🟉 1.175  ***1.280  ***
[0.92,1.43][0.92,1.64]
h e a t   p u m p 🟉 0.852  ***0.688  ***
[0.65,1.06][0.40,0.97]
w o o d 🟉 1.255  ***1.346  ***
[1.06,1.45][1.05,1.64]
e m i s s i o n s - L o w 🟉 1.024  ***1.765  ***
[0.89,1.16][1.54,1.99]
m a i n t e n a n c e - L o w 🟉 0.510  ***0.792  ***
[0.36,0.66][0.57,1.02]
e n . p r i c e 0.03 e / k W h 🟉 0.514  ***0.923  ***
[0.43,0.60][0.79,1.06]
e n . p r i c e 0.06 e / k W h 🟉 0.199  ***0.516  ***
[0.10,0.30][0.37,0.66]
cost (1000 €)−0.153  ***−0.276  ***
[−0.18,−0.13][−0.31,−0.24]
Standard deviation of random parameters distributions
gas 1.603  ***
[1.39,1.82]
heat pump 1.403  ***
[1.20,1.61]
wood 1.791  ***
[1.58,2.01]
emissions low 1.328  ***
[1.13,1.52]
maintenance low 0.982  ***
[0.82,1.15]
en. price 0.03 €/kWh 0.739  ***
[0.56,0.92]
en. price 0.06 €/kWh 0.083
[−0.41,0.58]
Subjects818818
Choices49084908
Log-likelihood−5297.103−4734.918
McFadden Pseudo R 2 0.2210.304
BIC10,662.1949597.316
AIC10,610.2059499.837
🟉 random parameter in the RPL model assumed normally distributed 95% confidence intervals in brackets. * * * p < 0.001 .
Table 5. Latent Class model results.
Class 1Class 2Class 3
Class Shares16%63%21%
natural gas−1.339 **2.678 ***3.525 ***
(0.431)(0.495)(0.597)
heat pump−1.798 ***2.577 ***1.568 **
(0.374)(0.451)(0.582)
wood−0.6412.175 ***3.906 ***
(0.349)(0.432)(0.559)
emissions-Low2.104 ***1.625 ***0.129
(0.258)(0.182)(0.162)
maintenance-Low0.663 *0.571 **0.603 **
(0.268)(0.179)(0.212)
en. price 0.03 €/kWh1.130 ***0.537 ***0.595 ***
(0.143)(0.088)(0.131)
en. price 0.06 €/kWh0.466 *0.476 ***0.167
(0.188)(0.112)(0.119)
cost 1000−0.241 ***−0.217 ***−0.075 *
(0.044)(0.027)(0.033)
sex −0.0830.174
(0.090)(0.102)
age 16–29 −0.629 ***−1.345 ***
(0.162)(0.168)
age 30–39 −0.194−1.133 ***
(0.190)(0.201)
age 40–49 −0.194−0.742 ***
(0.193)(0.202)
age 50–59 0.427 *−0.092
(0.199)(0.206)
imp. incentive 0.162 ***0.132 *
(0.047)(0.054)
imp. cost −0.168 ***0.228 ***
(0.046)(0.052)
imp. emissions −0.067−0.239 ***
(0.054)(0.060)
Subjects818
Choices4908
Log-likelihood−4774.927
McFadden Pseudo-R 2 0.298
BIC9906.795
AIC9633.853
Std. Error in parentheses. * p < 0.05 , * * p < 0.01 , * * * p < 0.001 .

