1. Introduction
Smart buildings are characterized by the presence of sensors, actuators, and smart devices that give the opportunity to monitor and remotely control key equipment within buildings [
1]. This is the concept behind Smart Building Energy and Comfort Management (BECM) systems [
2,
3]. In such an intelligent scenario, one of the major goals is to provide decision-support tools that support users in making cost-effective decisions in terms of energy consumption [
4]. As a matter of fact, domestic electricity usage accounts for about 40% of the global energy consumption and contributes over 30% of total greenhouse gas emissions [
5]. Nevertheless, user comfort is crucial when policies of Demand-Side Management (DSM) are put in place [
6]. Indeed, a system that optimizes energy consumption without considering user preferences and habits about appliance usage quickly leads to user disaffection from the system and abandonment of it. Currently, most of the literature considers user comfort as a set of hard constraints on appliance usage, which are a priori set considering general statistics [
7,
8]. This approach neglects the fact that users are likely not only to have different subjective requirements with respect to the others, but they also dynamically change over time.
In this paper, user preferences and habits about appliance usage are inferred by monitoring them using sensors deployed inside the reference buildings. The first phase consists of analyzing the correlation between the information gathered from sensors and users’ activities. The approach proposed in this paper is based on the classifier presented by Krishnan and Cook in [
9], which recognizes activities based on sequences of sensor events. Nevertheless, as it will be better explained in the following, in order to improve accuracy, the classifier included in the proposed framework is enhanced with other significant information provided by statistics related to the monitored events. Accordingly, a profile specific to the monitored user is created, which enables early recognition of activities after only 10 sensor events with an accuracy of
. Furthermore, the correlation between activities can be used to predict the next activity with an accuracy of about
.
The main contributions provided by this paper can be summarized as follows:
an analysis is performed to study the correlation not only between users’ activities and sensor events, but also between sensor events and other components that describe the context, and the mutual correlation of activities;
an activity recognition algorithm is proposed. The correlation between sensor events and components describing the context is used in the classifier to improve the accuracy of the activity recognition algorithm;
based on the results of the activity recognition algorithm and statistics about mutual correlation of activities, subsequent activities can be predicted;
a framework that uses activity recognition and prediction as the main component of a BECM system is described.
The remainder of the paper is organized as follows.
Section 2 presents past works and the required background. In
Section 3 an overview of the considered system model is provided.
Section 4 presents in detail the activity recognition algorithm that enables the early detection and prediction of users’ activities.
Section 5 describes the reference use case considered to test the performance of the system. Finally, in
Section 6 a performance analysis is provided, and conclusions and final remarks are drawn in
Section 7.
2. Background
2.1. Smart Building Energy and Comfort Management Systems
Smart technologies can be used in all kinds of different buildings (i.e., residential, office, and retail sectors) to improve the comfort and the safety of people in their home, concerning various topic, from healthcare and providing living assistance, to environmental monitoring and ensuring energy saving. Accordingly, BECM systems have the objective of combining power consumption minimization while preserving user comfort [
2,
10]. This issue has been addressed by researchers from many different perspectives. In [
11] a system for intelligent energy management in buildings is proposed. It presents semantic modeling that integrates all the entities that constitute the environment of a Smart Building exploiting Internet of Thing (IoT) paradigm. The IoT-based system integrates different systems and makes use of various types of real-time data from different sources to achieve the common objective of the intelligent management of the building. In [
12] a tool that provides effective automation and control of heating/cooling, ventilation/air conditioning and lighting and that uses optimization techniques to minimize energy consumption is proposed. The interactive system presented achieves a significant decrease in the operating cost of A/C system in a tertiary sector building, while maintaining desirable comfort taking into account two different time periods (peak hours and non-peak hours), a number of different zones and the end-user’s preferences. The authors in [
13] propose a multi-agent control system for integrated buildings and microgrids, which exploits Renewable Energy Sources (RES) efficiently among the agents. In [
7], an algorithm for Distributed Energy Resources (DER) management is proposed to shave peak demand and increase energy efficiency in smart home environments. Customer comfort is considered to be a constraint on time preference ranges to run their appliances. A similar approach was presented in [
8], where user preferences are expressed also in terms of indoor temperature and lightning. Furthermore, dynamic pricing is considered to optimize DSM. The authors in [
2], after a review of control systems for energy management and comfort in buildings, also present the architecture of a multi-agent control system that manages the user’s preferences for thermal and lighting comfort, indoor air quality, and energy conservation. The system is based on a master-slave coordination mechanism to perform different tasks. In [
14], an algorithm for thermostatically controlled household loads based on price and consumption forecasts of grid energy is presented. The optimization by means of the algorithm proposed in [
14] takes into account the trade-off between customer comfort and cost of energy, by setting minimum and maximum boundaries for the thermal comfort. These boundaries are taken as hard constraints for a priori setting but a background on customer comfort profiling lacks. Collotta and Pau propose a BECM system in [
15], where the management is based on a Fuzzy Logic Controller (FLC) which adaptively adjusts appliance starting times based on users’ feedback. The issue of scheduling appliances according to user preferences was also addressed by [
4], where Quality of Experience (QoE) is measured as a function of the interval between the preferred and proposed appliance starting time for switching controlled loads (e.g., washing machines and clothes dryers), and as a function of the interval between the preferred and proposed temperature for thermostatically controlled loads (e.g., Heating, Ventilation and Air Conditioning (HVAC) and water heaters). The system takes into account both dynamic pricing and RES production.
It is evident that user preferences and habits severely affect results of BECM systems. Indeed, BECM systems that only consider energy cost minimization may switch appliances on/off too early or too late. This is the case, for example, of a dishwasher that does not finish its cycle before dinnertime, or an HVAC that is switched off earlier than what the user considers thermal comfort. For this reason, in recent years researchers have started to observe users’ behavior, in order to infer their habits and preferences.
2.2. Activity Recognition in Smart Buildings
As discussed in the previous subsection, BECM systems should be able to discover and predict users’ habits and course of actions. The monitoring of activities of people in their home can be done by analyzing data that can be gathered with different technologies. Given the rapid development of sensor technology, wireless transmission technology, network communication technology, cloud computing, and smart mobile devices, large amounts of digitized information have been accumulated and the volume of data is growing rapidly with increasingly complex structures and forms [
16]. The energy big data provides a new way to analyze and understand individuals’ energy consumption behavior, improve energy efficiency, and promote energy conservation. Integration of big data technologies will help make the grid more efficient and it will fundamentally change the way in which regulators, utilities, grid operators, and end-users would interact [
17,
18].
In many cases, cameras and wearable sensors are used to collect all the information of interest and to understand what someone is doing [
19]. These solutions present some problems because people are often not inclined to accept those devices [
20]. Some studies are based on the data that are provided by phone accelerometer and gyroscope to understand repetitive body motions (walking, running, sitting) [
21]. This solution is not very practical in home scenarios, where residents do not always take their phone with them. To monitor what activities people are performing in their house, non-intrusive sensors are often preferred: typical devices that are installed in the environment are motion sensors, door sensors or temperature and pressure sensors [
22,
23].
The authors in [
24] propose the use of 3D depth sensors to detect user occupancy and profile their habits. The aim of the paper is to use this information to control HVAC and lighting, according to occupants’ usual behavior. The relation between occupancy, energy consumption and users’ comfort is also investigated in [
25], where the Multi-Agent Comfort and Energy Management System is proposed. Along with building devices, MACES also considers occupants as active participants in the building energy reduction strategy and attempts to implement more energy conscious occupant planning. This occupant planning is carried out using multi-objective Markov-Decision Problems (MDPs) to model the uncertainty of agent decisions and interactions.
An interesting approach for energy-consuming activity recognition is proposed in [
26], where social media posts are analyzed to automatically extract information and describe energy-consuming activities.
In [
27] the authors focus on the activity discovering problem, proposing an approach to build a model under the form of Hidden Markov Model (HMM), from a training database of observed events emitted by binary sensors, without the knowledge of actions really performed during the learning period. The discovering problem is presented also in [
28,
29], where a Discontinuous Varied-Order Sequential Miner (DVSM) algorithm is used to discover frequent activities that are continuously recorded in a smart environment and combined with a clustering algorithm to find frequent occurrences of activities and cluster familiar patterns together.
In [
9], 4 algorithms that can identify the activities while they are being performed are proposed. In this work, activities are recognized even if they are done in an interleaved and concurrent manner. The models used in the proposed algorithms are a Naïve Bayes Classifier, an HMM with a time window, a frequency-based HMM with a sliding window and a frequency-based HMM with a shifting window. These algorithms have been later used in [
30] to predict activities with the aim of controlling buildings to reduce energy consumption.
The problem of multi-resident activity recognition based on the use of non-intrusive sensors, along with smartphone-based sensed data, is also addressed in [
31]. The approach used in this paper aims to exploit body-worn smartphone sensors to infer person-specific context that can be correlated with activity detected from ambient sensors. Other models for multi-resident activity recognition based on the use of non-intrusive sensors are proposed in [
32]. In this paper the authors adopted three different directed graphical models including Poisson HMMs, coupled HMMs, and dynamic Bayesian networks, extended from coupled HMM by adding some vertices, to identify both individual and cooperative activities. A solution for multi-resident environments is given in [
33] too, where they perform the tracking of people and recognition of activities by using different binary sensors and RFID to know the identity of the occupants as they enter or leave the environment.
2.3. Background on Activity Recognition
The data collected from sensors inside resident houses are analyzed using data mining and machine learning techniques to build activity models that are used as the basis of behavioral activity recognition. Feature extraction from the sequence of sensor events is a key step to better modeling and then recognizing human activities. In [
34] four methods used to extract features for online recognition on streamed data are presented. With their approach, the authors can recognize activities while new sensor events are recorded.
A comparison of classification approaches for activity recognition is provided in [
35,
36]. As introduced in the previous subsection, with reference to modeling and classification methods researchers have investigated the recognition of resident activities using a variety of mechanisms, such as naïve Bayes classifiers, Markov models, and dynamic Bayes networks.
The various models and algorithms can give different performance results depending on the input data or on the implemented system. Usually, the results are adequately comparable, with one model giving better results in the recognition of some specific activities or using one specific dataset, and others giving better performance recognizing other activities or analyzing other datasets [
37]. In multiple cases, in spite of its simple design and simplified assumptions, naïve Bayes classifiers often work much better than expected, especially when a specific group of sensors can easily be identified as characteristic of a certain activity [
9].
Starting from the approach presented in [
9] and from the analysis of sequences of sensor events for activity recognition solution, in this paper a system that adds statistics information about the context in which these activities are occurring, in order to improve their own recognition, is proposed. The ultimate goal of the system is to obtain a profile according to users’ habits, which allows gaining personalized management of the whole system. Many systems in the literature propose management strategies focused on energy consumption and consider users’ comfort, but they tend not to evaluate user activities in every daily aspect in order to learn specific habits and behavior and guarantee ad-hoc solutions.
3. System Model
The reference scenario considered in this paper is that of a BECM system that leverages distributed smart home sensor networks to elaborate user profiles that are later used to manage and control buildings. More specifically, sensors are used to make observations, report events that are detected in the building and that can be associated with users’ actions, and learn which sets of detected events can identify specific activities. Therefore, the BECM system can predict users’ activities based on their previous monitored actions, and make appropriate management decisions accordingly.
A fundamental step to achieve energy cost savings is the identification of possible causes of energy waste. The BECM system controls all energy consumption components (electric, gas, water) inside the buildings and plans specific actions aimed at reducing waste. A large number of home devices increase power consumption in two aspects: standby power and normal operation power. When high energy demand is detected, the less important loads, such as standby power mode devices, could be disconnected from the electricity grid. Around
of the total household power is consumed during the standby power mode [
38]. The reduction of standby power is greatly necessary to reduce the electricity cost at home. Thanks to IoT networks, appliances such as washing machines and dishwashers can gather information about different energy prices related to different times of the day, thereby the system can automatically program them for the most convenient times. Air conditioning and heating systems should be monitored to guarantee desirable temperatures in all environments and to avoid unnecessary use. The BECM system records the inhabitants’ preferences adapting itself to their way of life.
A system of this type must also be able to know the users’ habits, in order to make coherent scheduling in the management of equipment and appliances, and because their activities and behavior have a considerable impact on energy consumption.
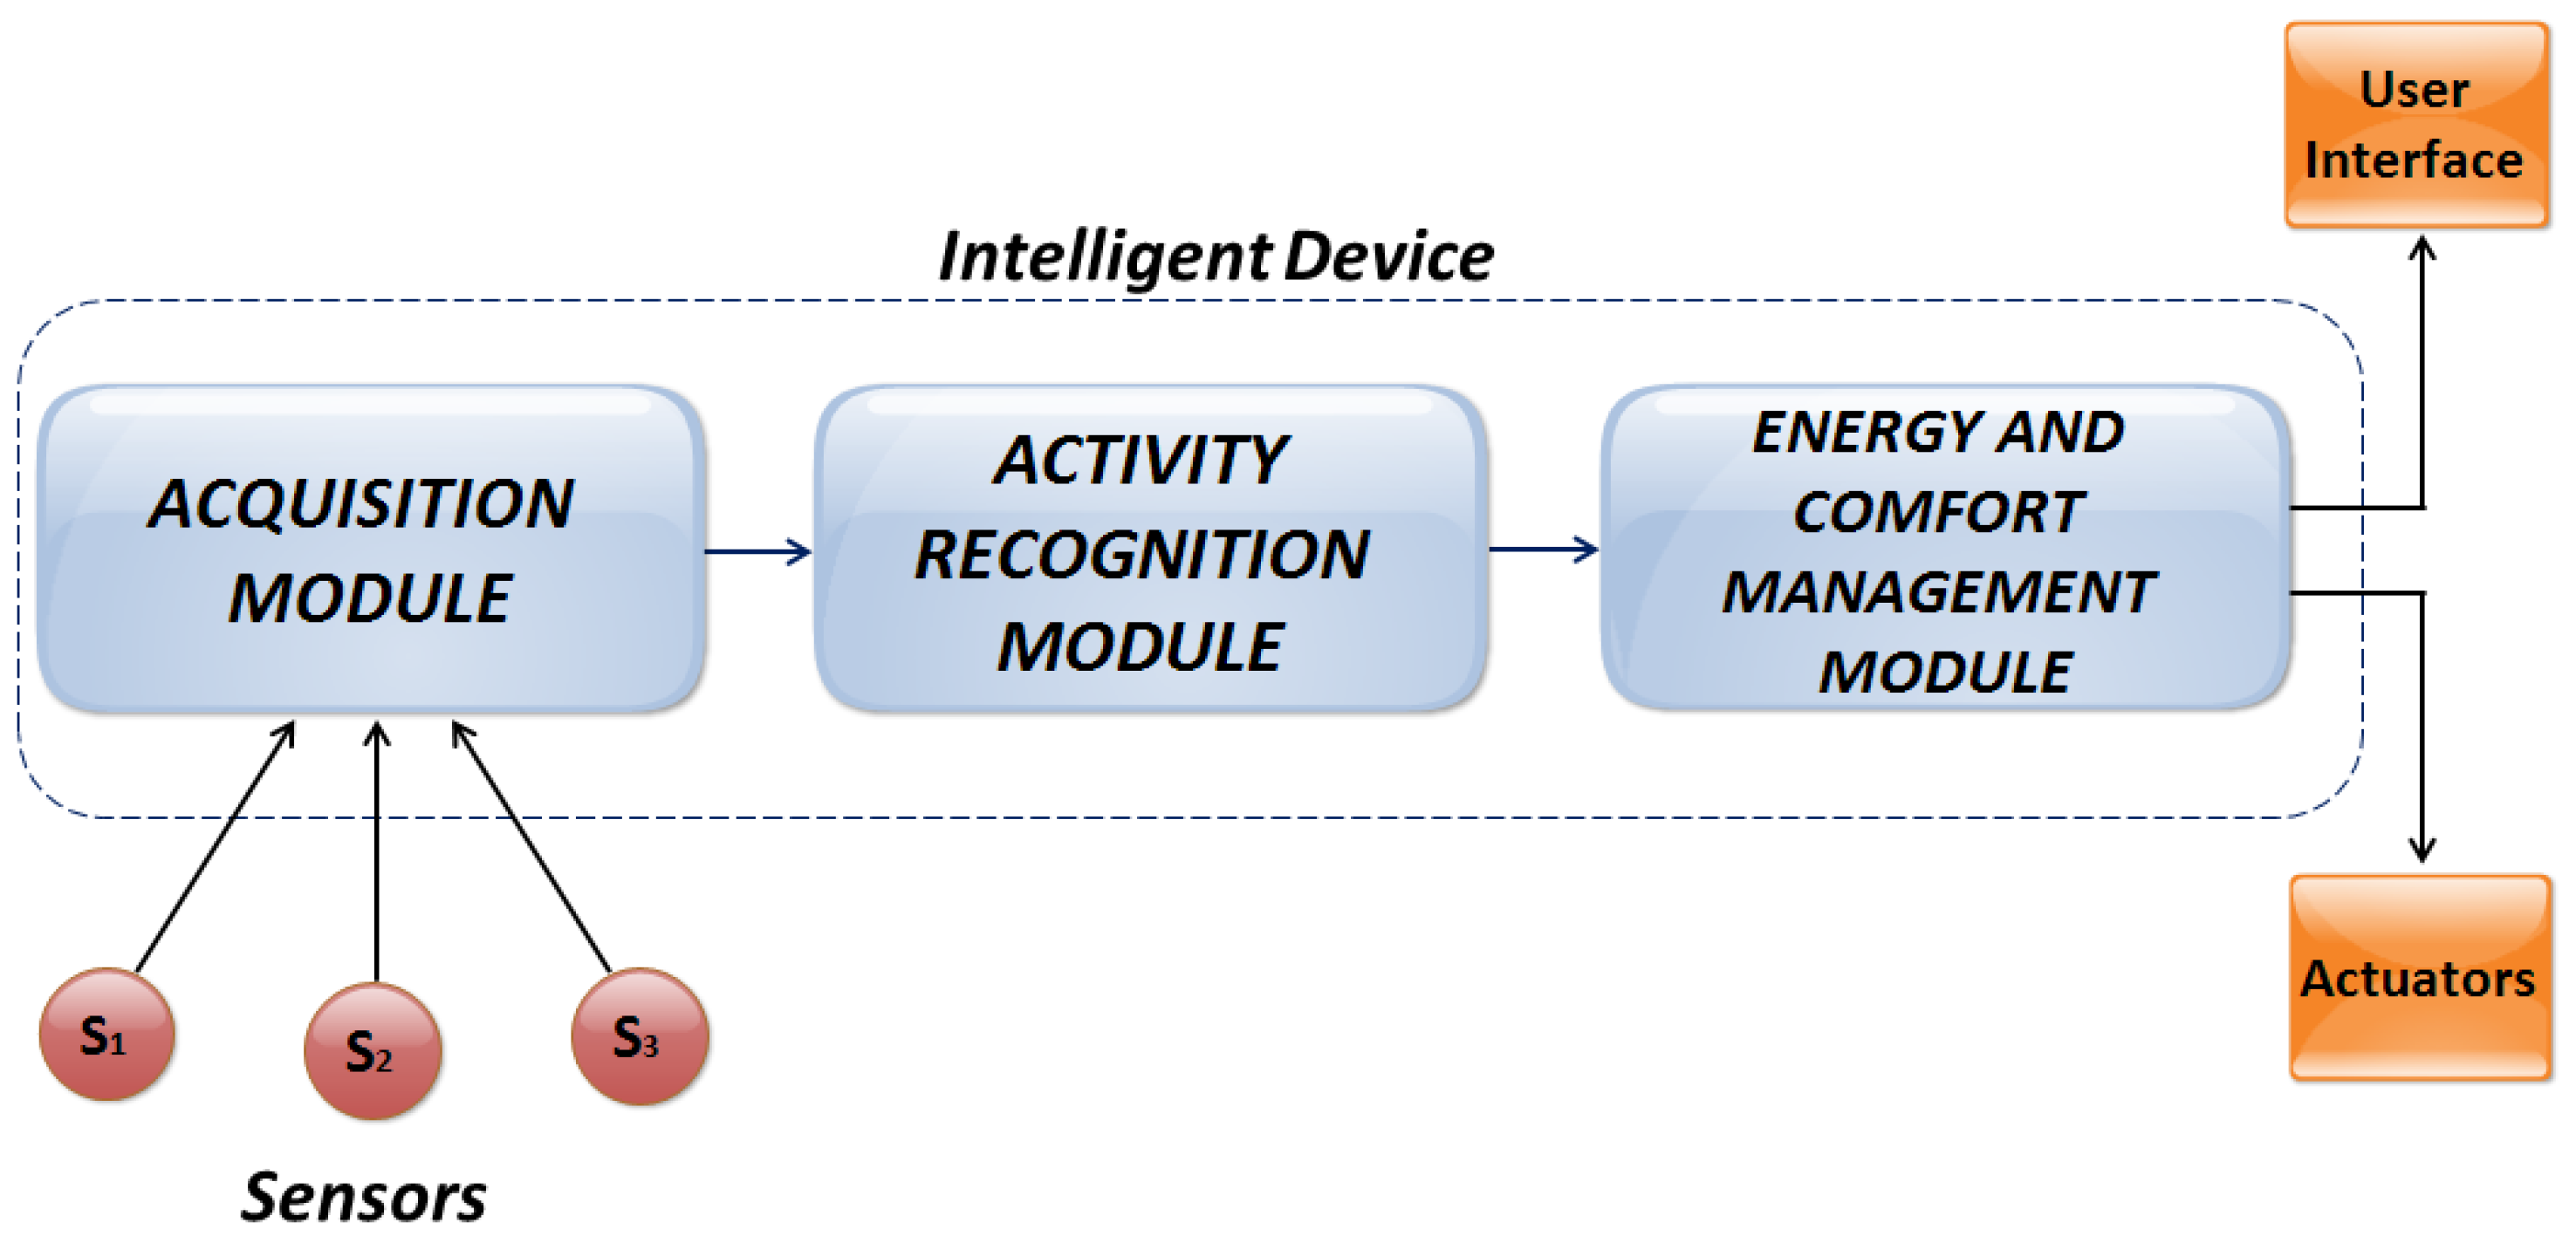
The whole system is therefore divided into several modules, each of them with specific features depending on the different tasks pertaining to them.
Figure 1 shows the overall architecture of the system and how the modules interact with each other.
The “Acquisition Module” is the one that gets raw data from the sensors. The data are stored in a structured database with information about the sensors and their value, as well as the date and time of the relative information. These data are then processed and manipulated by the “Activity Recognition Module”. This module can be organized into two separate tasks. At first, the data are used to understand users’ behavior and to make models of the different activities usually performed; at a later time, the module has to recognize occurring activities based on previously created models. All the information about resident habits and preferences is provided as the output of this module. This information is then used by the “Energy and Comfort Management Module” to monitor and act on appliances and devices according to a precise scheduling algorithm based on user profiles and on activities performed. Indeed, each activity can be associated with a specific set of appliances that are turned on or adjusted accordingly.
Table 1 includes the details of the most typical home appliances, along with their probability to be available at home in Italy [
4]. Based on the activity recognition and/or prediction results, the appliances can be scheduled to improve energy savings and/or users’ comfort [
4]. The decisions taken by this last module can operate on the system automatically, via commands sent to actuators, or they can be translated in useful advice sent to the user through some interface. All the described modules are integrated into an intelligent device that oversees the data storage and the control of the building, either locally or in the cloud [
39,
40].
As an explanatory example, suppose that according to their profile, a user usually wakes up, then has a coffee watching TV, and later takes a shower with the bathroom heater on. Furthermore, suppose that the wake up activity is detected when the turn on the bedroom light event is identified (i.e., the light sensor inside the user bedroom detects some light) after the sleep activity occurred. Since the BECM system knows that the following activities are have a coffee, watch TV and take a shower, it can increase the user’s comfort by: turning on the coffee machine as soon as the user wakes up, turning on the TV right after the coffee is made, and at the same time turning on the water and bathroom heater so that the water and room are warm when the user goes to the bathroom. Alternatively, the BECM system can choose to switch water and bathroom heater on earlier if the energy cost is lower, based on predictions about the usual morning routine of the user.
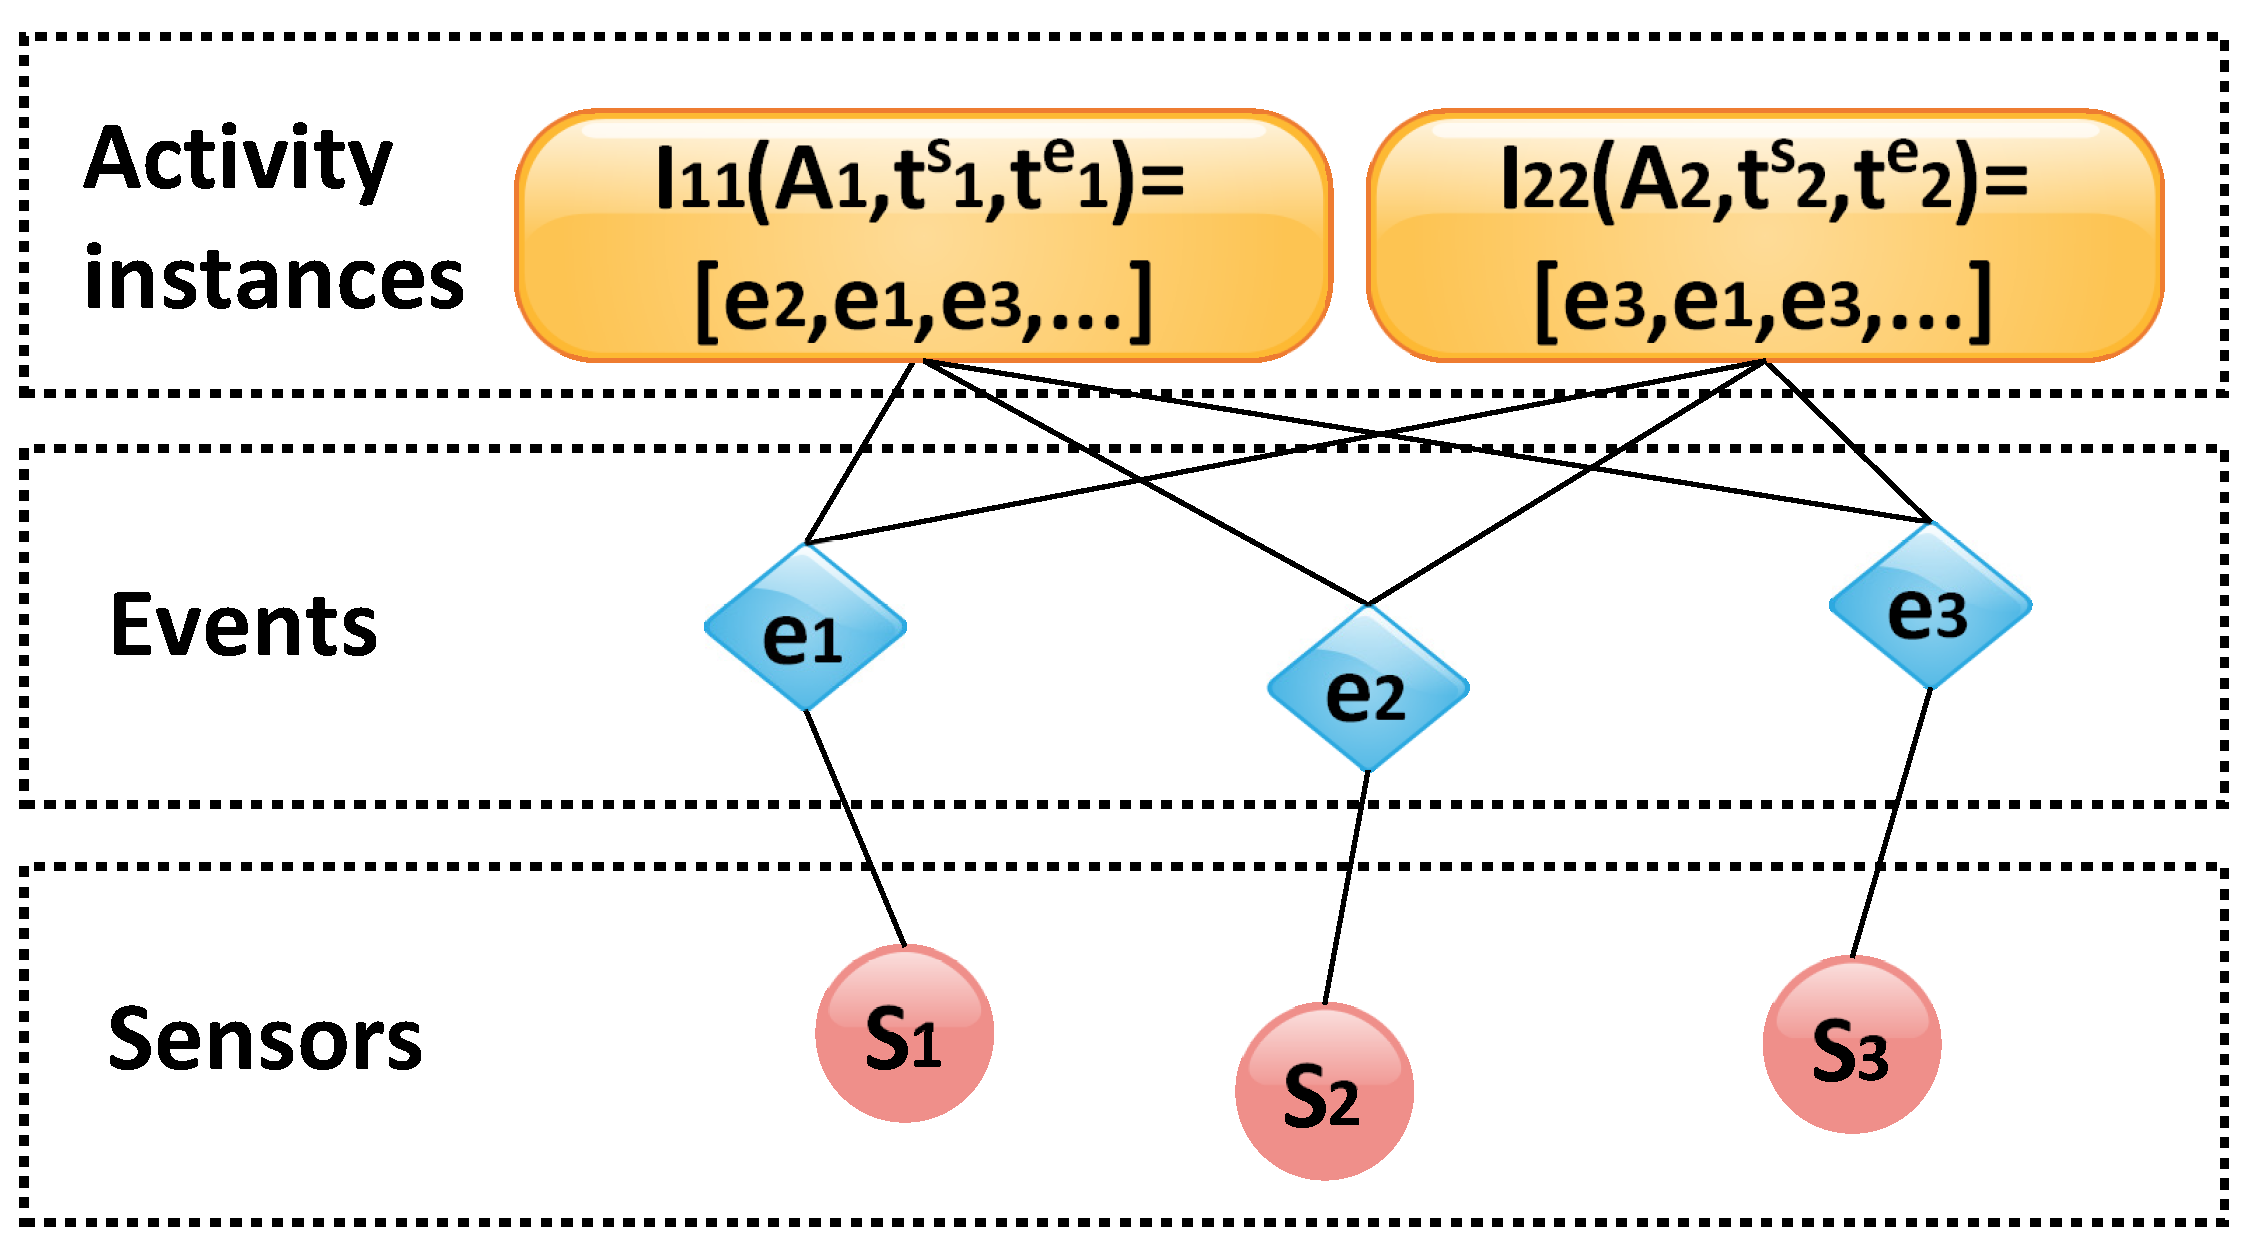
Figure 2 expresses the relationship between sensors, events, and activities. An event corresponds to a change in the state of a sensor. Each sensor has several possible states, depending on the significant values it measures; this is the case, for example, of a contact on a door, which has two different states (e.g.,
OPEN,
CLOSE): an event is registered whenever the contact changes its state from
OPEN to
CLOSE and vice versa. On the other hand, a smart meter monitoring a washing machine can have multiple states: according to the measured power consumption, its related state can correspond to
OFF or to any wash cycle. Accordingly, an event is registered whenever the smart meter changes its state.
Let be the set of events that can be detected by sensors inside a house. An event is then defined as the transition between possible states of the corresponding sensor monitoring that particular situation. According to this vision, activities are composed of several events. Even though the events that characterize an activity remain basically the same, their order may change when considering two different observations of the same activity. For example, when preparing a meal one can open the fridge to take the ingredients and then put a pan on the stove, or the same activity can be done in the opposite order. For this reason, a generic activity is modeled as the set of events that are usually observed when the reference user performs it. Accordingly, an instance of activity is defined as the array of events that are observed from the time the activity started to the time the activity finished. In the following sections, the process used to recognize the activities based on the observed events will be described in detail.
4. Activity Recognition Algorithm
The set of events is the basic set of information needed to understand what users are doing, and as seen previously they are strongly connected to sensors activation. The proposed system is then based on recognizing activities performed in smart environments from sequences of collected sensor readings. The choice of which sensor types to use leads to different models and algorithms for solving activity recognition problems because of different kinds of data, produced according to the type of sensor that has to be manipulated in order to extract important information.
As seen in
Section 2, the solutions for monitoring people in their home include: 1. cameras, 2. wearable sensors and 3. different kinds of ambient sensors. The first solution gives the type of information with the highest accuracy, but it requires the heaviest process to manipulate images and videos. Moreover, some people find problematic the idea of having cameras in their homes. Wearable sensors give information about the physical state of a person, so it is possible to understand simple actions, but it is harder to recognize more complex and complicated activities. Besides, there could be problems if the users forgot to wear them. Ambient sensors produce data with a low level of semantic information, but choosing only non-intrusive binary sensors is a better option for experiments in real life so that there is no need for people to remember to always wear wearable sensors or to be monitored with cameras.
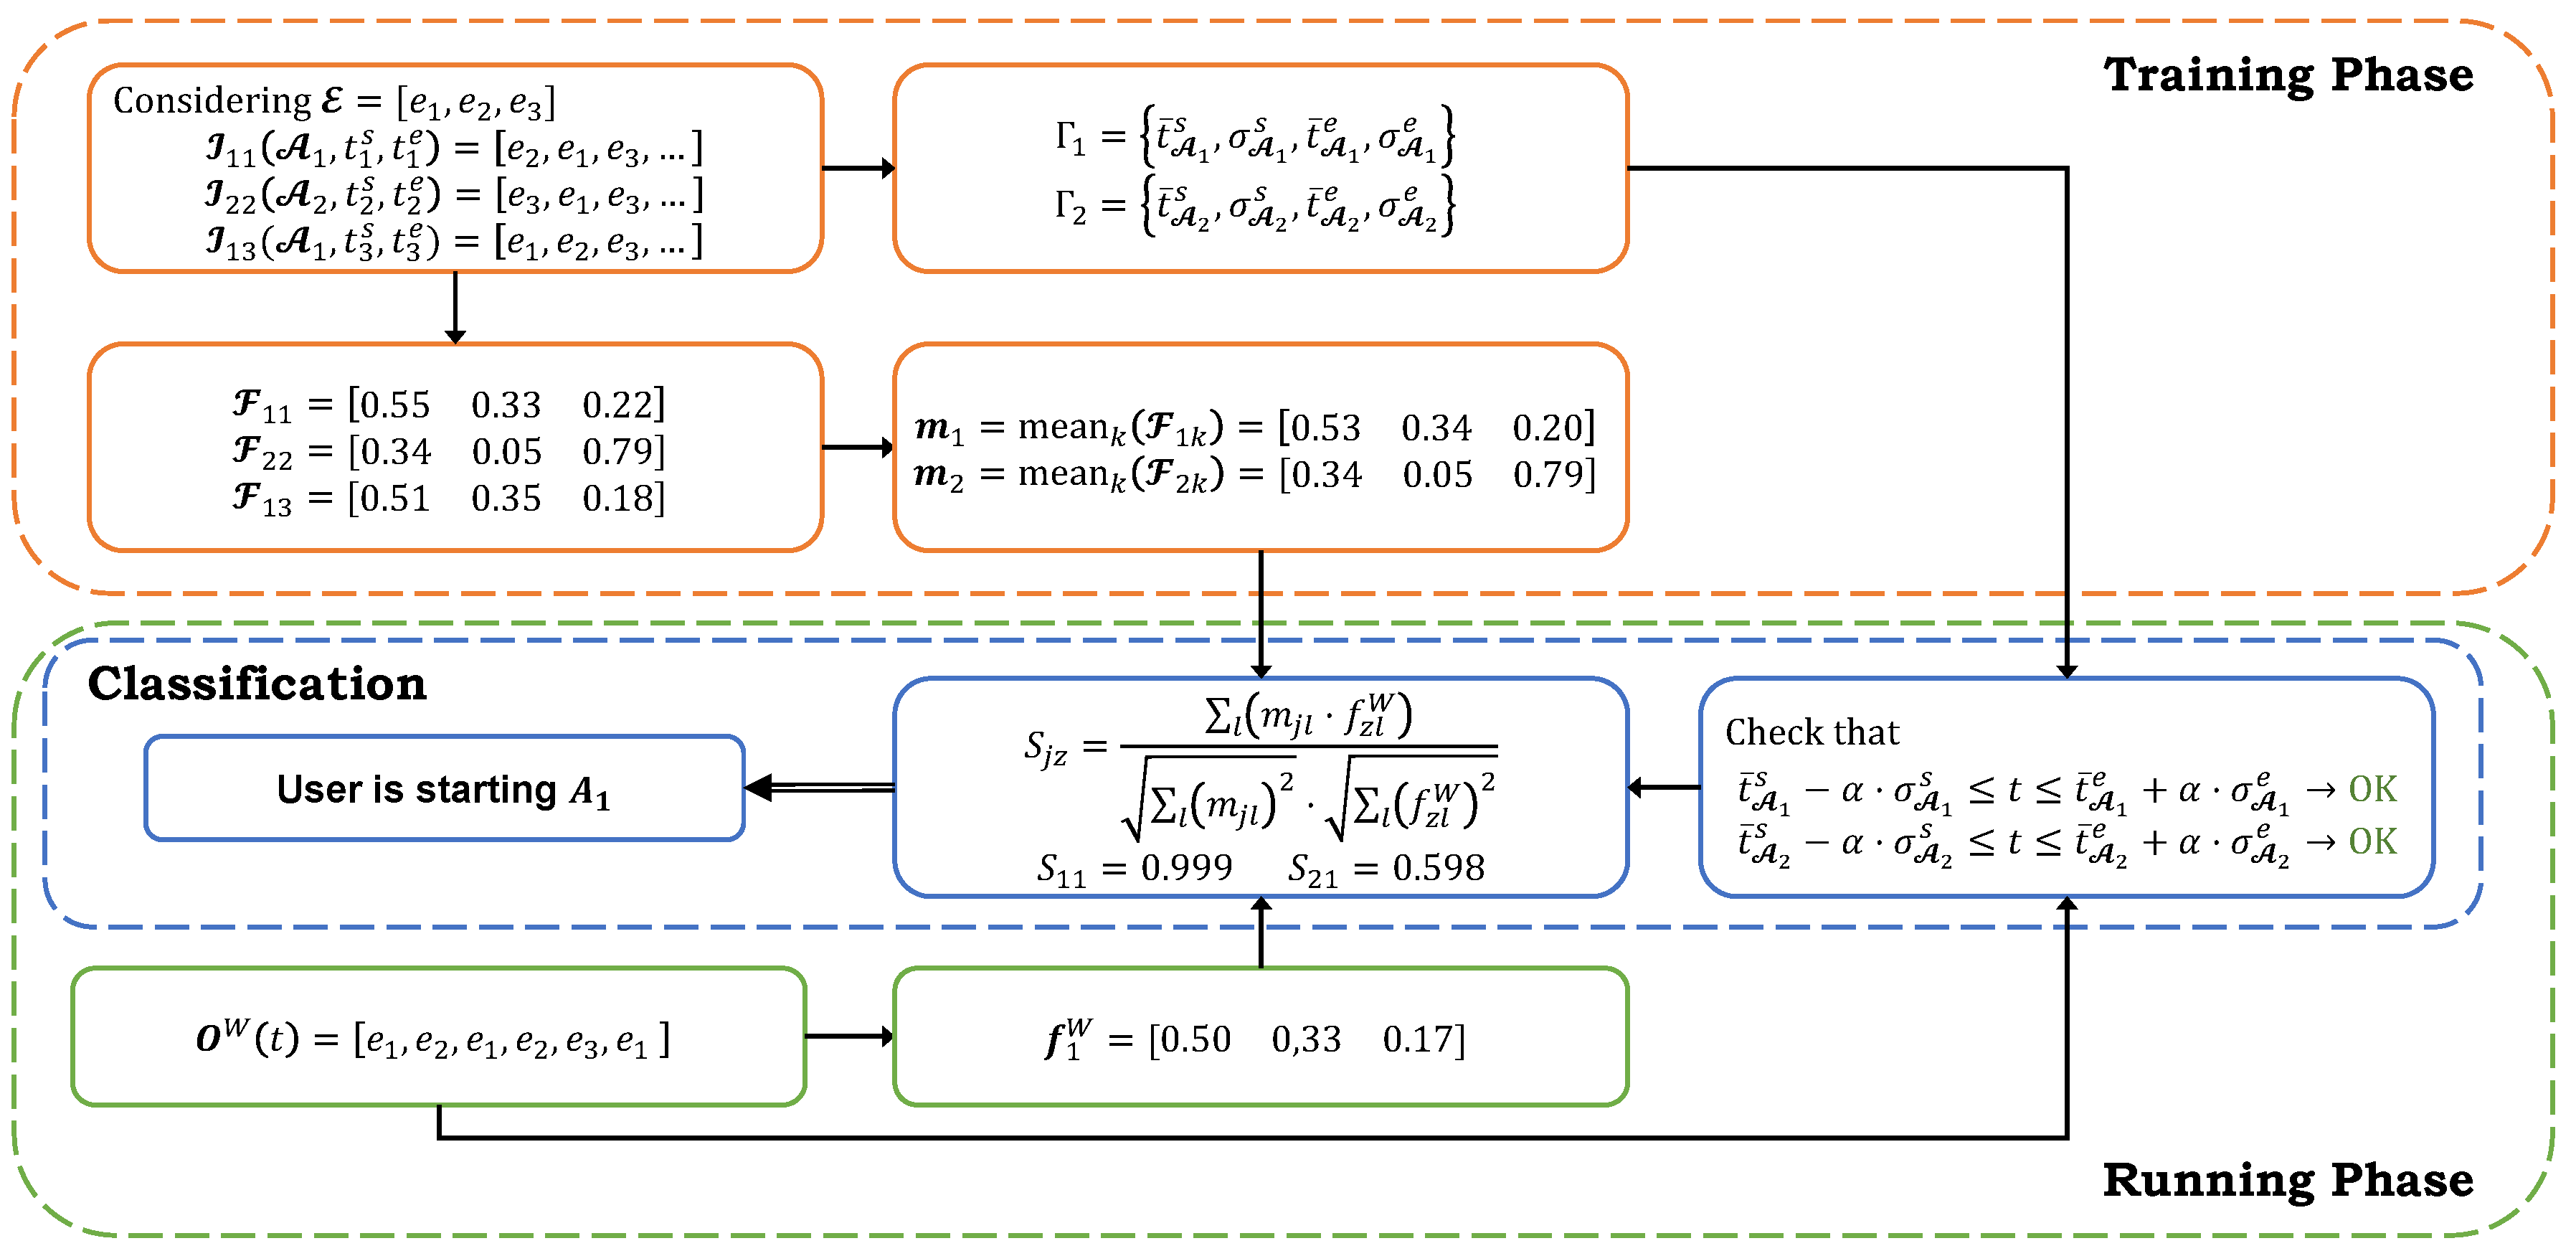
The flowchart in
Figure 3 expresses and clarifies all the steps of the proposed activity recognition algorithm that are described in detail in the following lines. The algorithm is constituted by two main phases: the training phase, during which the characteristics and statistics that describe how the observed user performs the activities are created; the running phase, where the events are observed and processed so that activities can be recognized by the classification module.
4.1. Training Phase
During the training phase, each activity instance is observed within a time window included in and is defined by the sequence of sensor events, i.e., sensors that have changed their state within the considered window. For each observed activity, a feature vector is computed with the rates of event occurrences for each sensor that is the number of events related to one specific sensor with respect to the total number of events observed considering all the sensors within the time window . Then, for each type of activity , a model vector is defined such that the rates of event occurrences of its sensors is the average rate for all the observed instances associated with the same activity. This model vector is representative about the probability that a sensor is connected to every activity. When an event associated with a sensor is counted for a certain number of times during the observed sequence, it is possible to understand which activity is statistically more probable.
From raw data acquired by sensors, feature vectors that can be analyzed to perform classification of activities are constructed. Every activity is strongly connected to a specific group of sensors that change their states during a definite time span, as described in the previous section.
Furthermore, statistics about relevant conditions that can be associated with the performed activity are evaluated and stored by the system. Indeed, activities are often performed within the same time window (e.g., sleeping, preparing meals). Therefore, includes the following statistics about : the average starting and ending times and , and their standard deviations and . If there is more than one time window, statistics are generated for each observed time window.
4.2. Running Phase
After the probabilistic model is obtained, the system must recognize the activities performed by evaluating which the most likely to be happening is. To this aim, a sensor-based windowing implementation is considered [
9]. This approach consists of dividing a sequence of incoming events into subsequences using an observation window
starting at time
t, which contains a certain number of events equal to the size
of the aforesaid window. Another possible approach would have been the time-based windowing, which consists of segmenting the incoming sequence of events using a window of fixed temporal length [
30]. This second approach is mostly used when analyzing data coming from sensors such as gyroscope or accelerometer, because there is a constant amount of data over time, while with binary sensors there could be moments without any sensor readings and some stall phases. Since the proposed system uses this type of binary sensors, a sensor-based window has been chosen. The result is that every sensor is treated as a feature and is associated with a particular activity based on its distribution probability to be in a sequence that is labeled with the name of that activity. This is done by implementing a Naïve Bayes Classifier (NBC) [
41]. This type of classifier is based over the Bayes’ theorem of independence between features, so that the model is constructed to find, for each activity
, the probability
p that given a certain number of features, i.e., the set of events, the class being observed is
:
Accordingly, for each sequence of events observed in the observation window , a feature vector is computed similarly to the previous vector of the training phase.
Finally, in the classification phase, the sequences of observed events are classified based on their probability to belong to a given activity. To this, the possible activities to be associated with the observed sequence of events are first filtered based on statistics
: only the activities that are usually observed within a time window that includes the current observation window’s starting time
t are considered in the following step. Accordingly, the following condition needs to be fulfilled:
where
is a weighting factor that adjusts the time window to be considered. Finally, the cosine similarity
between model vector
and feature vector
is calculated with the equation below over the remaining activities, to evaluate which the more likely to be observed is:
The observed activity is then labeled as the activity that corresponds to the highest cosine similarity.
5. Reference Use Case
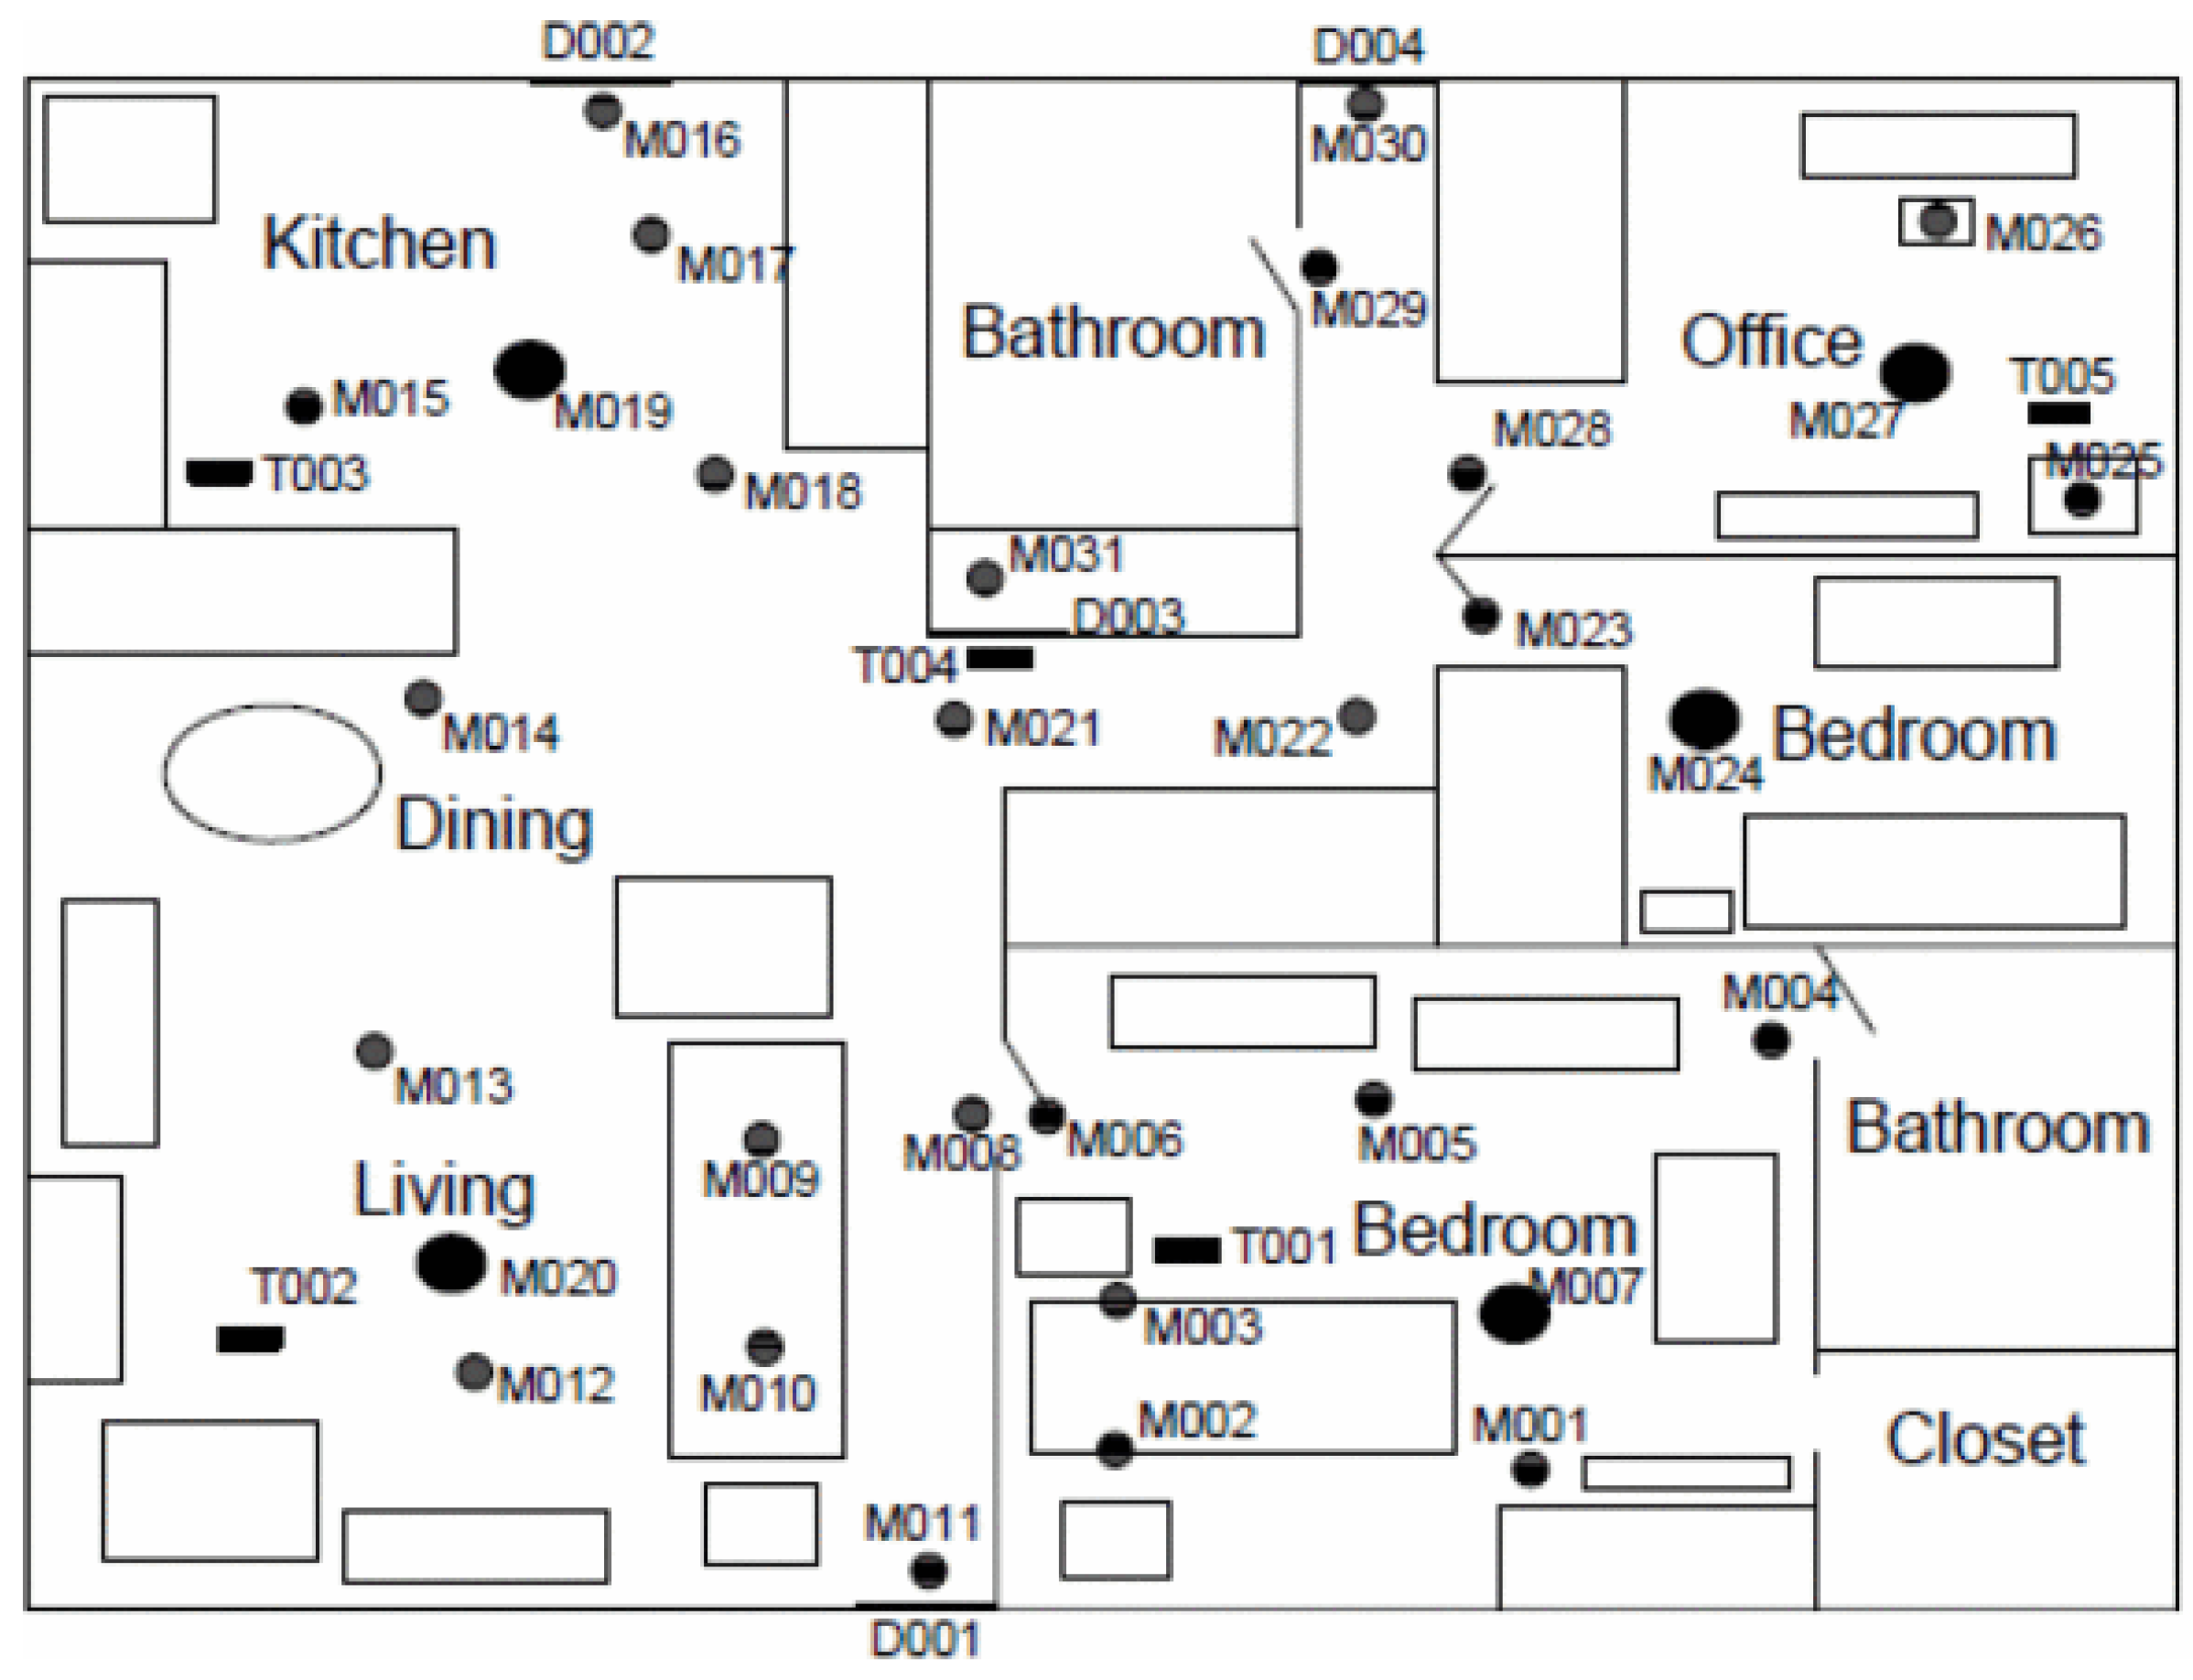
The algorithm for modeling the activities and then discovering what the resident is doing is implemented and tested using the Aruba real-word dataset from the CASAS smart environment project of the Washington State University [
37]. The data were collected from one smart apartment provided with motion sensors, contact sensors in the doors or cabinets and temperature sensors.
Figure 4 shows the house plan of the apartment and the exact position of every sensor in the rooms. The description provided by the CASAS project did not give information about the specifics of the used sensor.
Table 2 explains the number of sensors per type placed in each room. The values provided by motion and contact sensors are Boolean, whereas the ones provided by temperature sensors are numbers. There are two more sensors not listed in this table, one motion sensor and one contact sensor because they are not located in a specific room, but they are linked to the entrance of the house.
To correctly evaluate the correlation between the sets of events and the observed user’s activities, without interference from other people, a dataset with only one resident living in the home was considered. The events decoded by these sensors are significant for recording elementary actions that people are performing, for example, door sensors are easily associated with opening and closing medical cabinet, food storage, or the entrance door, while with motion sensors it is possible to monitor the presence of the resident in one room and the proximity with a specific object or piece of furniture. The aggregation of these elementary actions defines one activity of interest.
The gathered data are presented with information about the date and time of every sensor event registered, the id of the activated sensor with its value and the beginning or end of each activity that is monitored. The dataset has the structure presented in
Table 3. In the dataset, 10 different activities performed by the resident are noted.
Table 4 shows the details of the number of times each activity appears in the dataset, as indicated by the user. The “Relax” activity is the one that the user has denoted as the activity occurring while staying in the living room, and it involves the set of sensors arranged in that room, as shown in the house map (
Figure 4). The “Work” activity is the one performed in the office room and involving the specific group of sensors placed in that area. Lastly, the “Housekeeping” activity involves a great number of all the sensors of the house, due to the intrinsic dynamism of this type of activity. Sensors detect even the activities that are not registered, that correspond to “Other activity” with no label in the dataset. Since they cannot be classified accurately, this has been ignored in the proposed framework.
Part of the dataset has been first used to train the system, whereas another part has been used to test it, by simulating the running phase. Most parts of the monitored activities have a long representation in terms of sequences of events. Only three of them generally are concluded in less than 15 sensor events, and they are the activities of “Enter Home”, “Leave Home” and “Bed to Toilet Transition”. The others are more variable and can last longer. Because of this variability, it is difficult to find a common size to consider for the observation window . The size of this window is essential because for the activity recognition problem the algorithm evaluates the sensors’ events that occur within this window. Based on that, the most probable activity being performed is found by searching for the minimum distance between the modeled feature vector and the new instances that are happening at the moment and that has to be classified, as defined in the previous Section.
6. Performance Evaluation
To evaluate the algorithm, an assessment of the classification accuracy that shows the percentage of correctly classified sequences of events for each class is used. The accuracy is obtained by observing the number of times an activity is correctly labeled, compared to all the occurrences of that activity in the dataset. Accordingly, the accuracy for activity
l is expressed by
where
and
are respectively the number of times the activity was correctly and erroneously labeled.
The test is performed considering a training time of 2 months, one week of test data from the dataset and taking a window of
sensor events as the sequence that must be classified. The choice of the window is done by taking into account that there are three activities among those indicated in
Table 4 that are shorter than the others. These activities often last for several events included between 5 and 15. Furthermore, it is preferable that activities are recognized as early as possible so that relevant management actions can be promptly started. Nevertheless, choosing a window that is too small could lead to errors when longer activities, which are the most numerous, are being performed, because the algorithm frequently confuses possible activities that are similar.
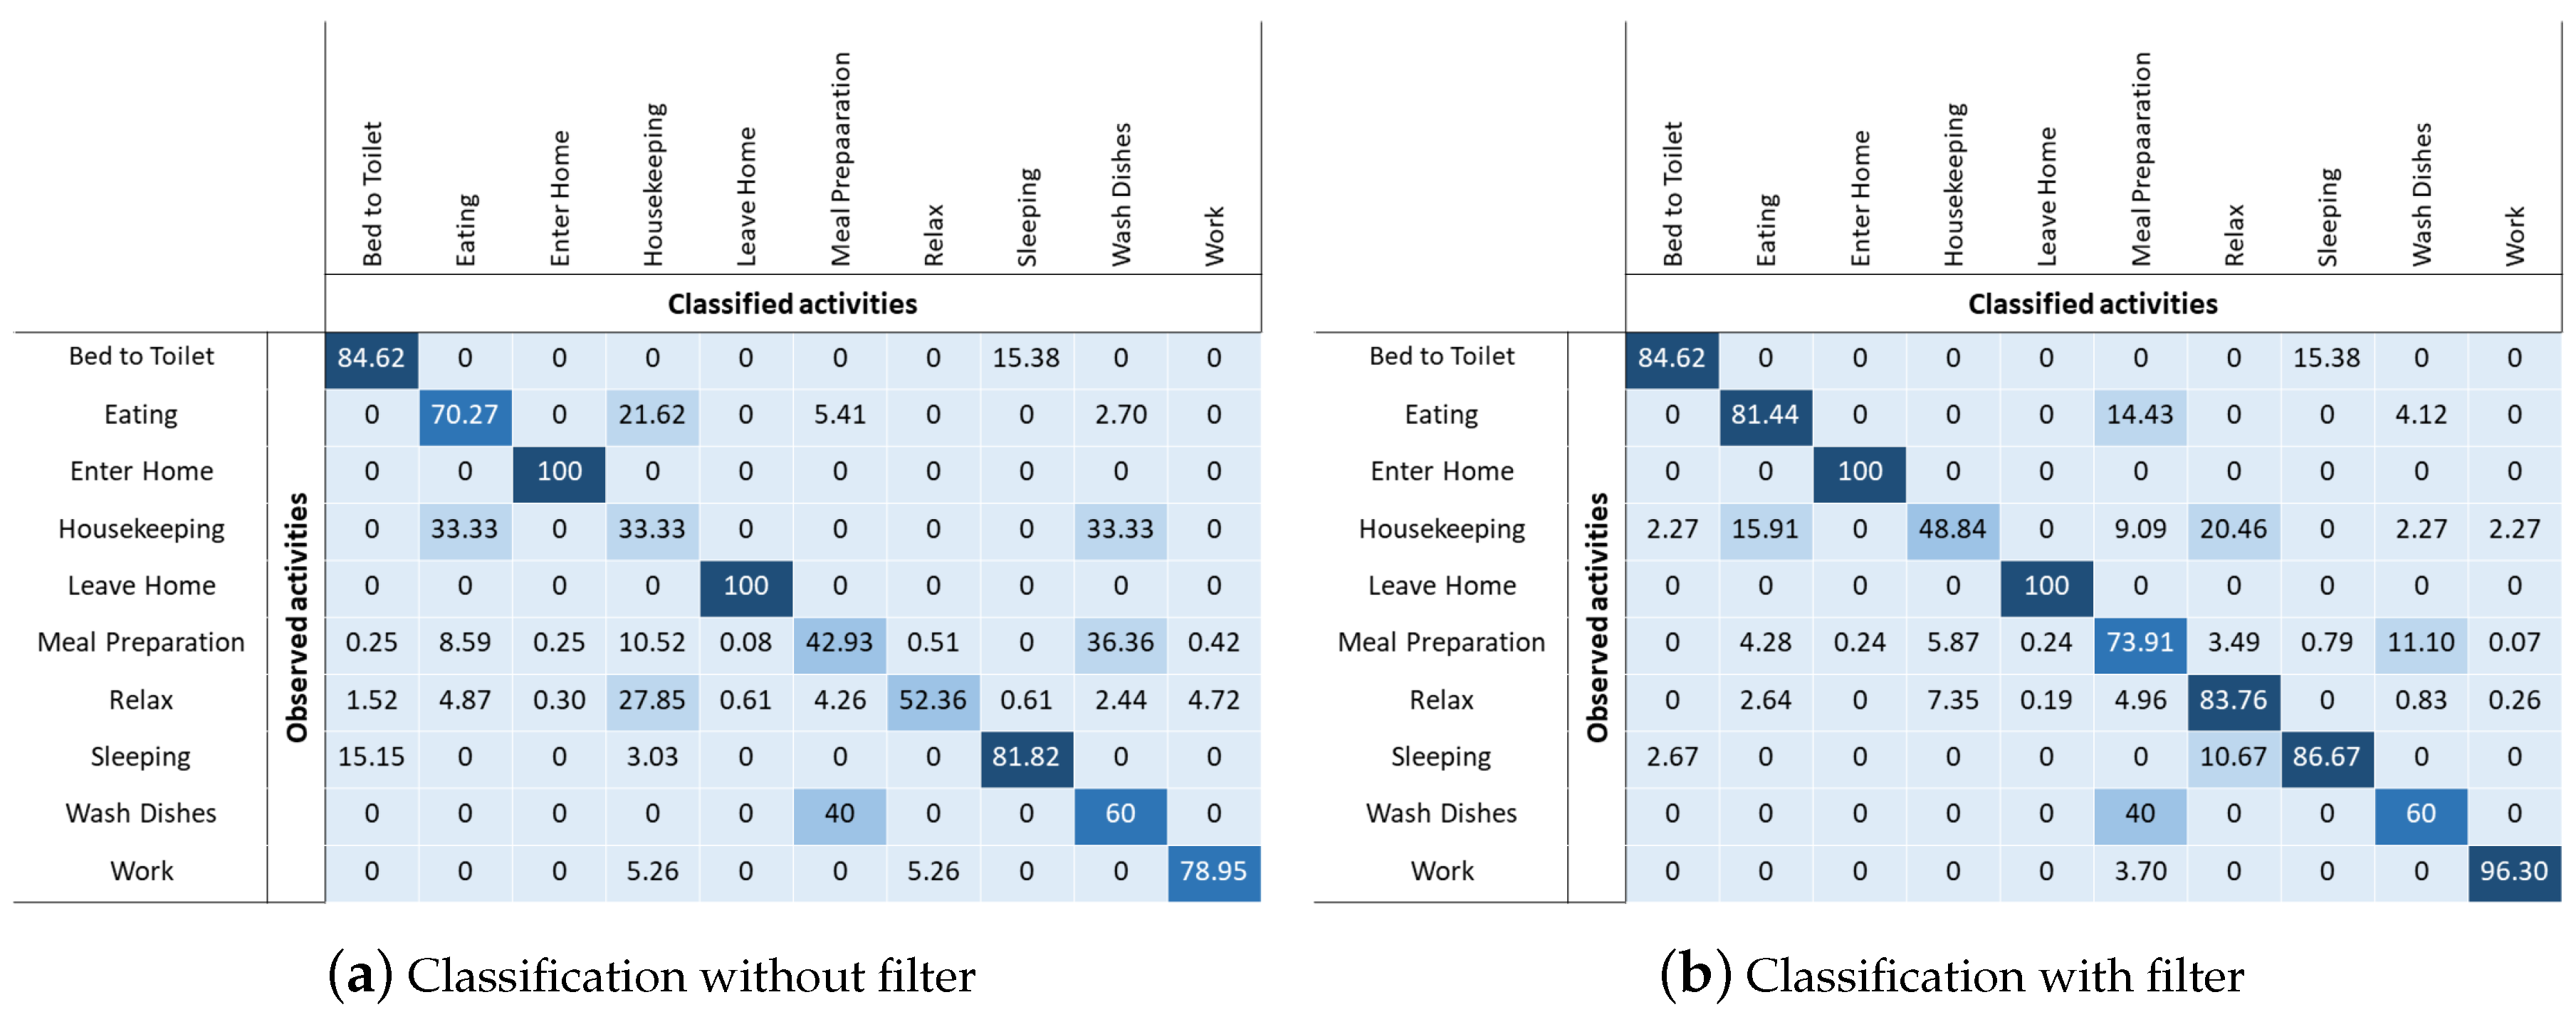
6.1. Accuracy of the Activity Recognition Algorithm
To first evaluate the accuracy of the recognition algorithm by itself, the system was first run excluding the filtering with respect to the
statistics, as it is proposed in [
9]. With the current choices, simulation results achieve an average accuracy of
. The results are presented in
Figure 5a where the confusion matrix with the accuracy percentages of the classification for all the activities is presented.
It is evident that almost half of the times there are errors discerning the “Meal Preparation” activity from the “Wash Dishes” activity. This is due to the fact that both activities are performed in the kitchen and involve the same sensors. The reason for the frequent errors between the “Relax” and “Housekeeping” activities is explainable remembering how this second activity was described in the previous
Section 5. Due to the fact that in several cases the sensors involved are the ones placed in the living room, the algorithm often confuses the two activities.
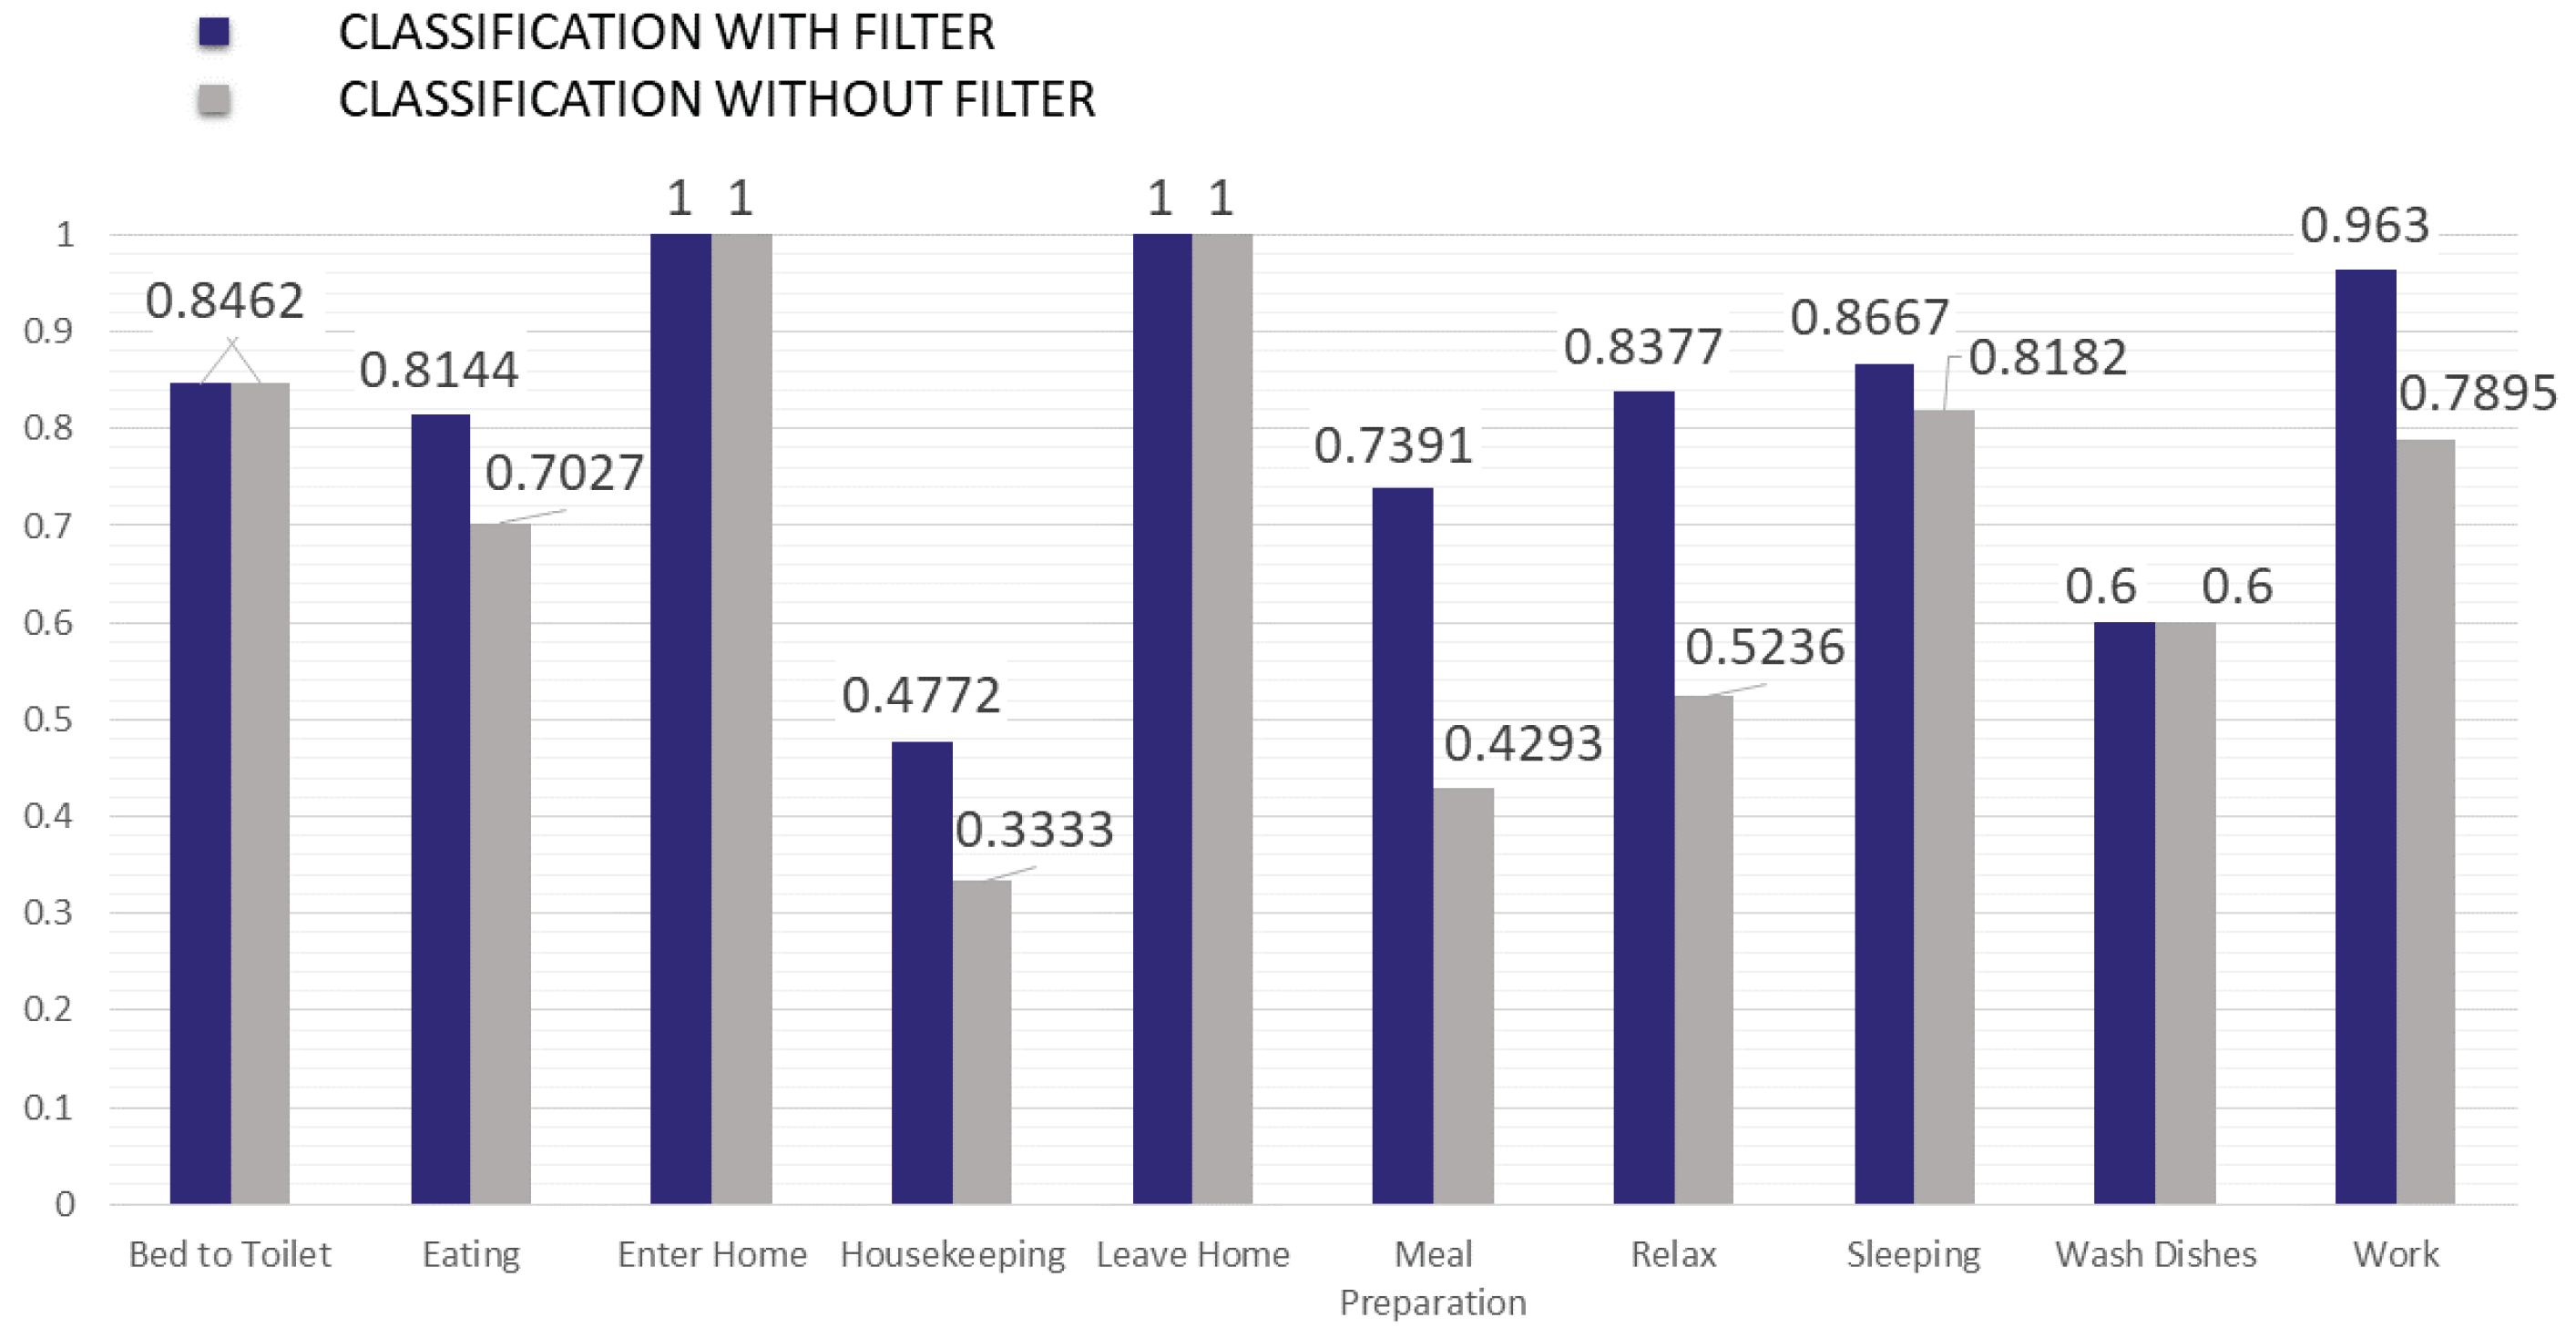
Results improve consistently when adding the filter before the cosine similarity calculation, as it is shown in
Figure 5b. Indeed, in this second case, the algorithm gave an average accuracy of
and it is possible to observe how all the activities are better recognized. This is even more evident in
Figure 6, where the comparison of the percentage accuracy for every class between the two examined cases is presented.
6.2. Accuracy Results for Different Sizes of the Observation Window
Table 5 shows the accuracy results for the different sizes
of the observation window with the indication of the 95% confidence interval for the three examined cases. Changing the size of the observation window to 15 and 20 consecutive sensor events, the performance of the algorithm are quite better, giving results of average accuracy equal to 87.02% and 84.09% respectively, making the choice of the size window of 15 sensor events the preferable one. This is due to the reason explicated before, for which longer activities are more easily observed with bigger windows while shorter activities are usually less frequent and affect the performance less significantly. Results also confirm that performance shrinks when considering observation windows that are longer than the shortest activities, i.e., those that have less than 15 events as mentioned at the beginning of this Section. The confidence interval is narrower for smaller windows than for bigger windows, because in these cases there is a greater number of samples, due to the fact that the same instance is divided into more parts compared to the use of a bigger window.
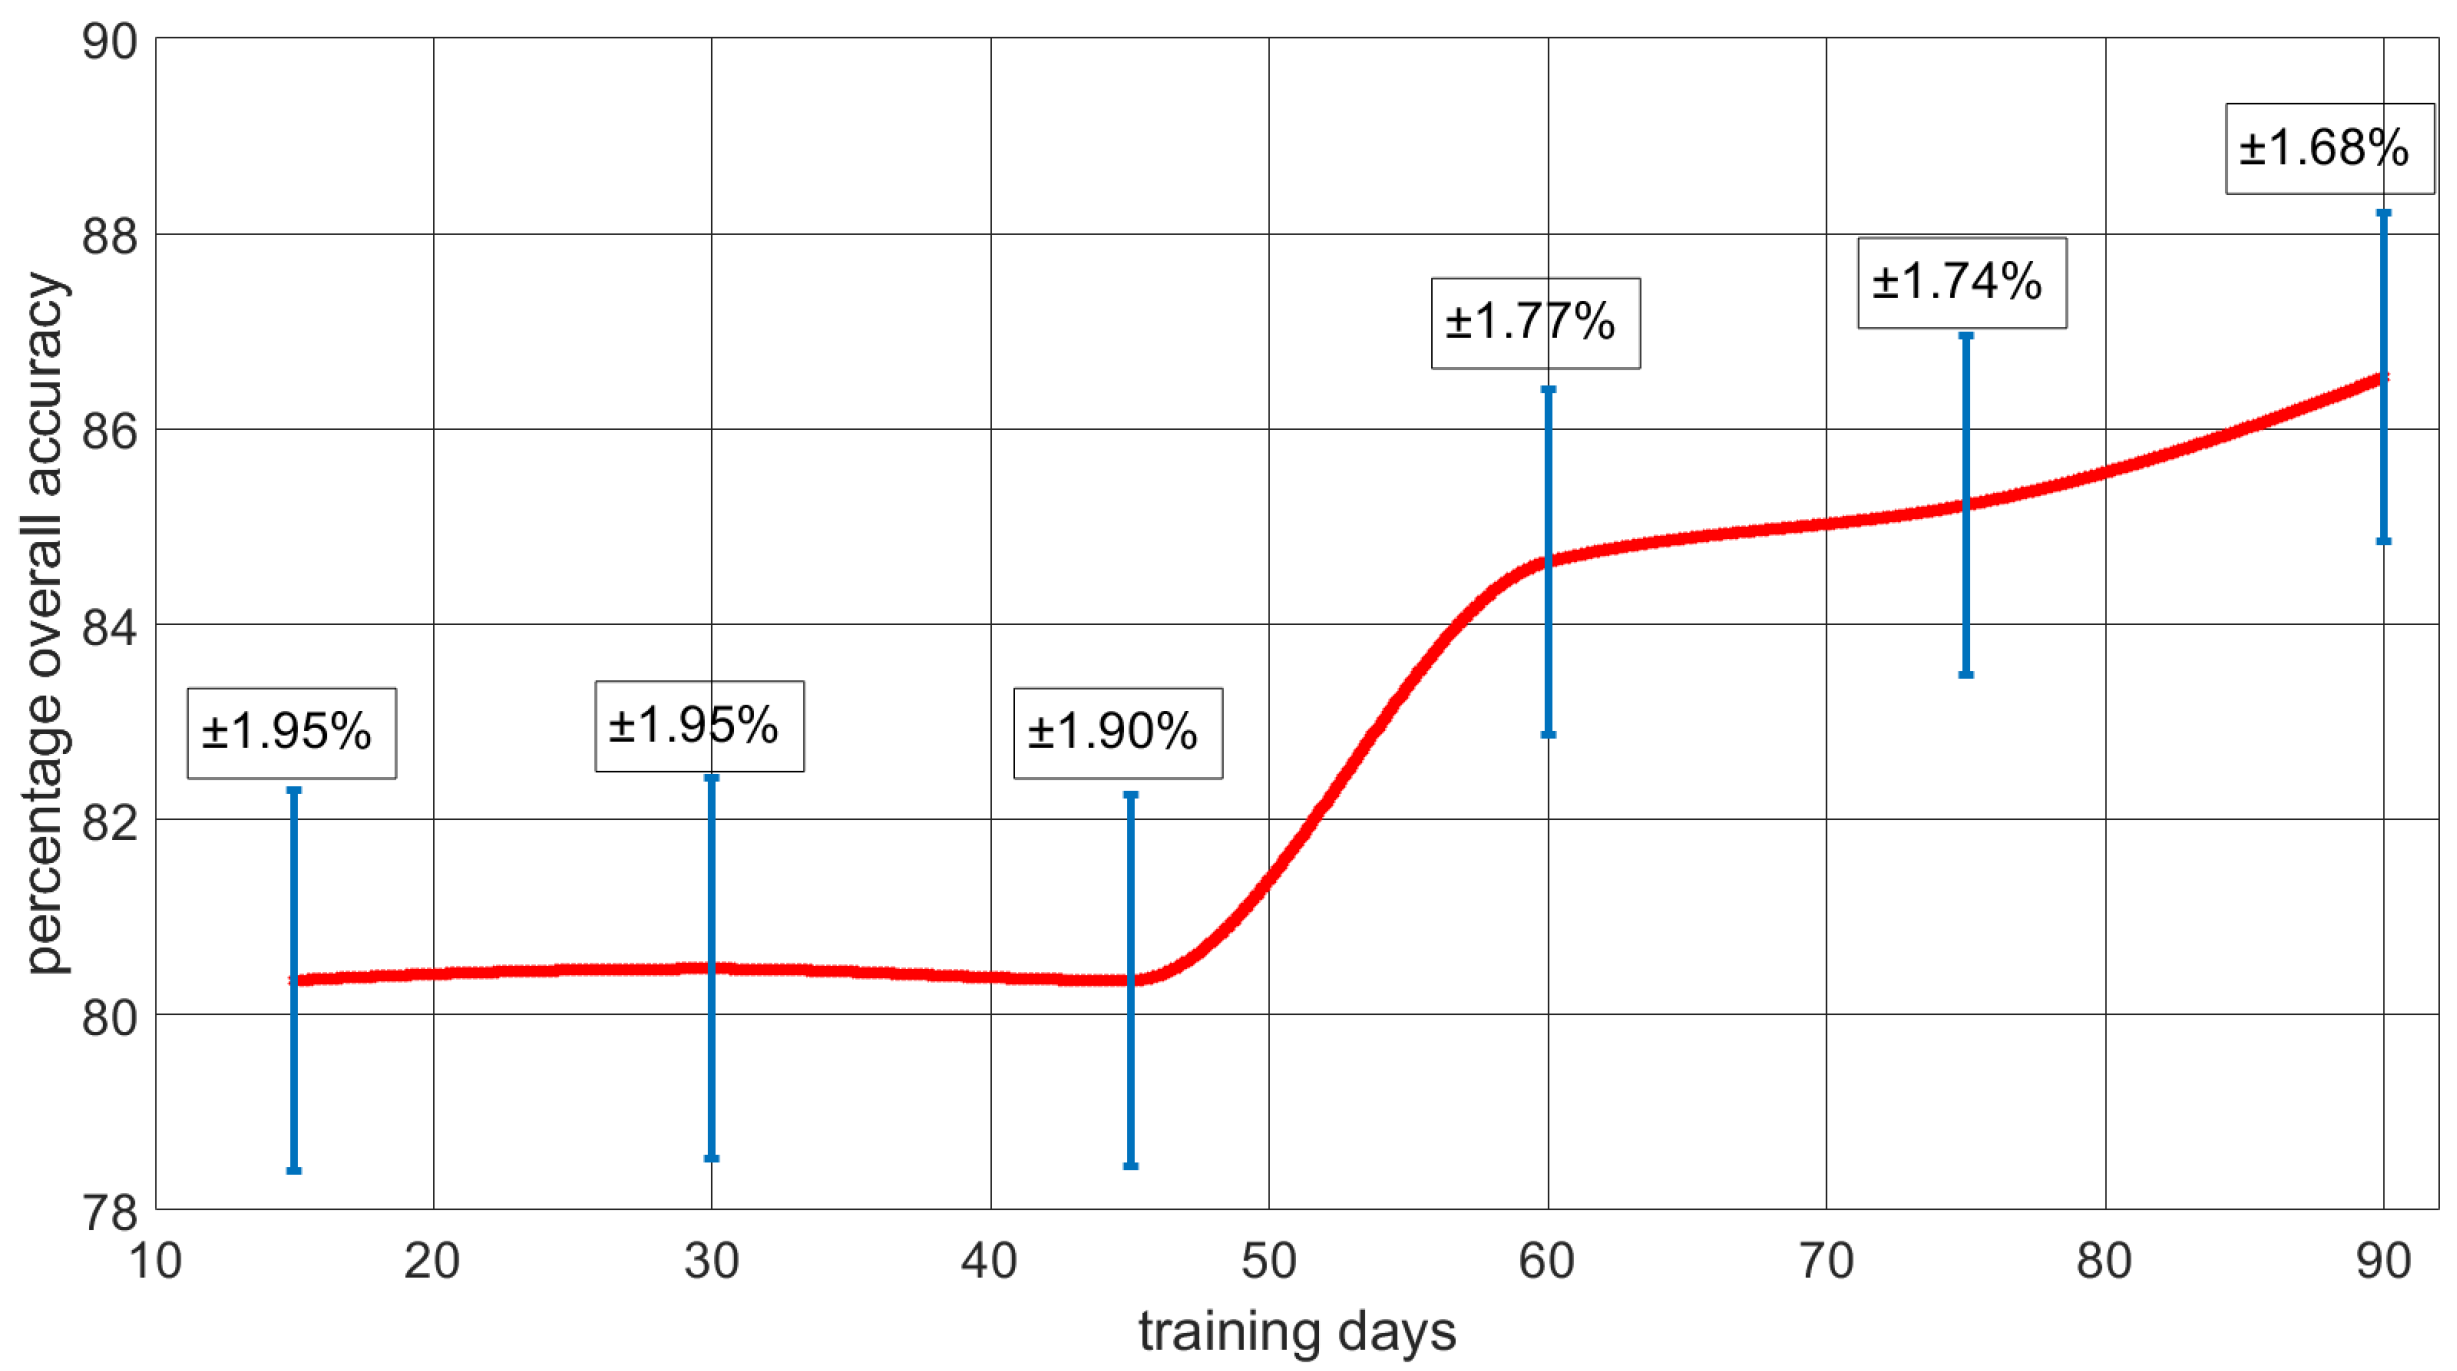
6.3. Accuracy Results for Different Training Periods
In
Figure 7 the different overall accuracy values obtained with increasing training days, from 2 weeks to 3 months, are presented. The horizontal bars represent the 95% confidence interval with values that go from
for 2 weeks of training to
for 3 months of training.
The increase in the performance from 2 months to 3 months is not as prominent as the increasing noticed during fewer days of training. Analyzing this result, the conclusion is that it is probably better to have a training phase that does not last too long so that is not necessary to wait a long time period to get results. Instead, it is more important to evaluate the need for a new training phase after a while, in order to check if there have been changes in the habits of the user after some time. Furthermore, the various activities under consideration are not carried out with the same frequency every day or every week. This explains why, with a training set of a few days, the accuracy obtained is so stable and low, due to the fact that during that time some activities have only a few samples that could be used for making the models, making it harder to recognize those same activities later in the running phase.
6.4. Prediction Results for Subsequent Activities
The current activity can be used to predict the activities that are going to be performed in the next future. For this purpose, an evaluation of the probability of transition from an activity in a column to an activity in a row is reported in
Table 6, whereas
Table 7 shows the probabilities that the activity “C” is happening given the fact that activities “A” and “B” occurred. In the last table, only some of the results are presented, i.e., the ones with the greatest probability value for each combination of the first two activities. When two consecutive activities indicated in the tables turn out to be the same repeated activity, it is due to the fact that between these two instances of the same activities there was a gap in which the user performed some actions that were unknown and that were part of the “Other activity” group that was not considered during these tests as it was specified in
Section 5. The last column reports the average time duration expressed in minutes of the sequence of the 3 activities indicated as activity “A”, “B” and “C”. This information could be useful for future works for making prediction and consideration of possible sequences of activities over a long time.
7. Conclusions and Future Works
This paper focuses on the problem of users’ activity recognition inside Smart Buildings to support BECM systems, by exploiting the acquisitions made by sensors deployed inside the building. To this aim, a system that analyses the user behavior to profile it and later perform early recognition and prediction of users’ activities is presented. The proposed system is a sensor-based activity recognition system that analyzing raw data from binary sensors arranged in an apartment can model users’ activities and understand known behaviors. In addition to the data collected by sensors, other significant information, provided by statistics related to relevant external conditions that have been observed to be correlated (e.g., time of the day), are incorporated in the system, allowing the obtaining of better results than the simple analysis case of sensors data. The system is proved to enable activity recognition with an accuracy of more than after only 10 sensor events are registered. Furthermore, the prediction of the following activity is achieved with an accuracy of about .
It should be mentioned, however, that there are some limitations to the proposed method. As already highlighted explaining the obtained results, there are some problems related to the fixed size of the observation window, which hold the performance of the algorithm depending on the activity examined. A wider window is better to recognize long activities but, on the other hand, a longer time is required to start the assignment of an activity. Another important aspect concerns the period of the training phase. A longer time span gives better accuracy results, with more available samples to better model each activity, but it leads to exaggerated waiting times to first get any results. Lastly, this approach was thought and tested only for consecutive activities performed by a single user. Some changes must be evaluated for an extension to more than one resident and for recognize concurrent and interleaved activities.
Future works will be focused on improving the system accuracy by including statistics of other relevant external conditions that can be correlated, such as the weather, or the fact that it is a working day or not. Furthermore, other devices, such as smartphones, will be included to enlarge the number of sensors available for the analysis. The introduction of measurements coming from personal devices is expected to provide a more thorough insight into users’ habits. Moreover, the system will be expanded to consider cases with more residents and to recognize different contemporary actions. Finally, the proposed system will be first tested using commercial software, to be later included on a real BECM system scenario, so that the actual convenience on energy cost savings and the quality of experience perceived by users can be assessed.
Author Contributions
Conceptualization, F.M., V.P.; validation: F.M.; writing–draft preparation, F.M., V.P., D.G.; writing–review and editing, F.M., V.P., D.G.
Funding
This work was partially supported by MIUR, within the Smart Cities framework (Project CagliariPort2020, ID: SCN 00281), by the Italian Ministry of Economic Development (MiSE, Project INSIEME, HORIZON 2020, PON 2014/2020 POS. 395), by “Fondazione di Sardegna” within the research project “SUM2GRIDS—Solutions by mUltidisciplinary approach for intelligent Monitoring and Management of power distribution GRIDS”—Convenzione triennale tra la Fondazione di Sardegna e gli Atenei Sardi, Regione Sardegna—L.R. 7/2007 annuity 2017—DGR 28/21 of 17 May 2015, within the project Design and Implementation of a Novel Hybrid Energy Storage System for Microgrids, which is funded by the Sardinian Regional Government (Regional Law no. 7, 7 August 2007) under the Grant Agreement no. 68 (Annuity 2015), and within the project LEAPH – anaLytics and data Enrichment plAtform for Pharma and pHarmacy owner, funded by the Sardinian Regional Government under the Sardinian POR FESR 2014-2020 (ID: RICERCA_1C-124).
Conflicts of Interest
The authors declare no conflicts of interest.
References
- Minoli, D.; Sohraby, K.; Occhiogrosso, B. IoT considerations, requirements, and architectures for smart buildings—Energy optimization and next-generation building management systems. IEEE Int. Things J. 2017, 4, 269–283. [Google Scholar] [CrossRef]
- Dounis, A.I.; Caraiscos, C. Advanced control systems engineering for energy and comfort management in a building environment—A review. Renew. Sustain. Energy Rev. 2009, 13, 1246–1261. [Google Scholar] [CrossRef]
- Shafie-Khah, M.; Siano, P. A stochastic home energy management system considering satisfaction cost and response fatigue. IEEE Trans. Ind. Inf. 2017, 14, 629–638. [Google Scholar] [CrossRef]
- Pilloni, V.; Floris, A.; Meloni, A.; Atzori, L. Smart home energy management including renewable sources: A qoe-driven approach. IEEE Trans. Smart Grid 2016, 9, 2006–2018. [Google Scholar] [CrossRef]
- Yang, L.; Yan, H.; Lam, J.C. Thermal comfort and building energy consumption implications—A review. Appl. Energy 2014, 115, 164–173. [Google Scholar] [CrossRef]
- Shoreh, M.H.; Siano, P.; Shafie-Khah, M.; Loia, V.; Catalão, J.P. A survey of industrial applications of Demand Response. Electr. Power Syst. Res. 2016, 141, 31–49. [Google Scholar] [CrossRef]
- Pooranian, Z.; Abawajy, J.; Conti, M. Scheduling distributed energy resource operation and daily power consumption for a smart building to optimize economic and environmental parameters. Energies 2018, 11, 1348. [Google Scholar] [CrossRef]
- Rasheed, M.; Javaid, N.; Ahmad, A.; Khan, Z.; Qasim, U.; Alrajeh, N. An efficient power scheduling scheme for residential load management in smart homes. Appl. Sci. 2015, 5, 1134–1163. [Google Scholar] [CrossRef]
- Krishnan, N.C.; Cook, D.J. Activity recognition on streaming sensor data. Pervasive Mob. Comput. 2014, 10, 138–154. [Google Scholar] [CrossRef] [PubMed]
- Shaikh, P.H.; Nor, N.B.M.; Nallagownden, P.; Elamvazuthi, I.; Ibrahim, T. A review on optimized control systems for building energy and comfort management of smart sustainable buildings. Renew. Sustain. Energy Rev. 2014, 34, 409–429. [Google Scholar] [CrossRef]
- Marinakis, V.; Doukas, H. An advanced IoT-based system for intelligent energy management in buildings. Sensors 2018, 18, 610. [Google Scholar] [CrossRef] [PubMed]
- Marinakis, V.; Doukas, H.; Karakosta, C.; Psarras, J. An integrated system for buildings’ energy-efficient automation: Application in the tertiary sector. Appl. Energy 2013, 101, 6–14. [Google Scholar] [CrossRef]
- Wang, L.; Wang, Z.; Yang, R. Intelligent multiagent control system for energy and comfort management in smart and sustainable buildings. IEEE Trans. Smart Grid 2012, 3, 605–617. [Google Scholar] [CrossRef]
- Du, P.; Lu, N. Appliance commitment for household load scheduling. IEEE Trans. Smart Grid 2011, 2, 411–419. [Google Scholar] [CrossRef]
- Collotta, M.; Pau, G. Bluetooth for Internet of Things: A fuzzy approach to improve power management in smart homes. Comput. Electr. Eng. 2015, 44, 137–152. [Google Scholar] [CrossRef]
- Koseleva, N.; Ropaite, G. Big data in building energy efficiency: Understanding of big data and main challenges. Procedia Eng. 2017, 172, 544–549. [Google Scholar] [CrossRef]
- Stimmel, C.L. Big Data Analytics Strategies for the Smart Grid; Auerbach Publications: New York, NY, USA, 2016. [Google Scholar]
- Al Nuaimi, E.; Al Neyadi, H.; Mohamed, N.; Al-Jaroodi, J. Applications of big data to smart cities. J. Int. Serv. Appl. 2015, 6, 25. [Google Scholar] [CrossRef] [Green Version]
- Attal, F.; Mohammed, S.; Dedabrishvili, M.; Chamroukhi, F.; Oukhellou, L.; Amirat, Y. Physical human activity recognition using wearable sensors. Sensors 2015, 15, 31314–31338. [Google Scholar] [CrossRef]
- Nitti, M.; Stelea, G.A.; Popescu, V.; Fadda, M. When Social Networks Meet D2D Communications: A Survey. Sensors 2019, 19, 396. [Google Scholar] [CrossRef]
- Lu, Y.; Wei, Y.; Liu, L.; Zhong, J.; Sun, L.; Liu, Y. Towards unsupervised physical activity recognition using smartphone accelerometers. Multimed. Tools Appl. 2017, 76, 10701–10719. [Google Scholar] [CrossRef]
- Liu, Y.; Nie, L.; Liu, L.; Rosenblum, D.S. From action to activity: Sensor-based activity recognition. Neurocomputing 2016, 181, 108–115. [Google Scholar] [CrossRef]
- Nitti, M.; Popescu, V.; Fadda, M. Using an IoT platform for trustworthy D2D communications in a real indoor environment. IEEE Trans. Netw. Serv. Manag. 2019, 16, 234–245. [Google Scholar] [CrossRef]
- Diraco, G.; Leone, A.; Siciliano, P. People occupancy detection and profiling with 3D depth sensors for building energy management. Energy Build. 2015, 92, 246–266. [Google Scholar] [CrossRef]
- Klein, L.; Kwak, J.Y.; Kavulya, G.; Jazizadeh, F.; Becerik-Gerber, B.; Varakantham, P.; Tambe, M. Coordinating occupant behavior for building energy and comfort management using multi-agent systems. Autom. Constr. 2012, 22, 525–536. [Google Scholar] [CrossRef]
- De Kok, R.; Mauri, A.; Bozzon, A. Automatic Processing of User-Generated Content for the Description of Energy-Consuming Activities at Individual and Group Level. Energies 2019, 12, 15. [Google Scholar] [CrossRef]
- Viard, K.; Fanti, M.P.; Faraut, G.; Lesage, J.J. An event-based approach for discovering activities of daily living by hidden Markov models. In Proceedings of the 2016 15th International Conference on Ubiquitous Computing and Communications and 2016 International Symposium on Cyberspace and Security (IUCC-CSS), Granada, Spain, 14–16 December 2016; pp. 85–92. [Google Scholar]
- Rohini, P.; RajKumar, R. A New Approach to Behavioral Reasoning in Smart Homes using DVSM Algorithm. Int. J. Adv. Res. Comput. Sci. Softw. Eng. 2014, 4, 334–341. [Google Scholar]
- Rashidi, P.; Cook, D.J.; Holder, L.B.; Schmitter-Edgecombe, M. Discovering activities to recognize and track in a smart environment. IEEE Trans. Knowl. Data Eng. 2011, 23, 527–539. [Google Scholar] [CrossRef] [PubMed]
- Thomas, B.L.; Cook, D.J. Activity-aware energy-efficient automation of smart buildings. Energies 2016, 9, 624. [Google Scholar] [CrossRef]
- Roy, N.; Misra, A.; Cook, D. Ambient and smartphone sensor assisted ADL recognition in multi-inhabitant smart environments. J. Ambient Intell. Humaniz. Comput. 2016, 7, 1–19. [Google Scholar] [CrossRef]
- Chiang, Y.T.; Hsu, K.C.; Lu, C.H.; Fu, L.C.; Hsu, J.Y.J. Interaction models for multiple-resident activity recognition in a smart home. In Proceedings of the 2010 IEEE/RSJ International Conference on Intelligent Robots and Systems, Taipei, Taiwan, 18–22 October 2010; pp. 3753–3758. [Google Scholar]
- Wilson, D.H.; Atkeson, C. Simultaneous tracking and activity recognition (STAR) using many anonymous, binary sensors. In International Conference on Pervasive Computing; Springer: Berlin/Heidelberg, Germany, 2005; pp. 62–79. [Google Scholar]
- Yala, N.; Fergani, B.; Fleury, A. Feature extraction for human activity recognition on streaming data. In Proceedings of the 2015 International Symposium on Innovations in Intelligent SysTems and Applications (INISTA), Madrid, Spain, 2–4 September 2015; pp. 1–6. [Google Scholar]
- Shoaib, M.; Bosch, S.; Incel, O.D.; Scholten, H.; Havinga, P.J. Complex human activity recognition using smartphone and wrist-worn motion sensors. Sensors 2016, 16, 426. [Google Scholar] [CrossRef]
- Nef, T.; Urwyler, P.; Büchler, M.; Tarnanas, I.; Stucki, R.; Cazzoli, D.; Müri, R.; Mosimann, U. Evaluation of three state-of-the-art classifiers for recognition of activities of daily living from smart home ambient data. Sensors 2015, 15, 11725–11740. [Google Scholar] [CrossRef] [PubMed]
- Cook, D.J. Learning setting-generalized activity models for smart spaces. IEEE Intell. Syst. 2010, 27, 32–38. [Google Scholar] [CrossRef] [PubMed]
- Han, J.; Choi, C.S.; Lee, I. More efficient home energy management system based on ZigBee communication and infrared remote controls. IEEE Trans. Consum. Electron. 2011, 57, 85–89. [Google Scholar] [Green Version]
- Botta, A.; De Donato, W.; Persico, V.; Pescapé, A. Integration of cloud computing and internet of things: A survey. Future Gener. Comput. Syst. 2016, 56, 684–700. [Google Scholar] [CrossRef]
- Josep, A.D.; Katz, R.; Konwinski, A.; Gunho, L.; Patterson, D.; Rabkin, A. A view of cloud computing. Commun. ACM 2010, 53, 50–58. [Google Scholar] [Green Version]
- Kaur, G.; Oberai, E.N. A review article on Naive Bayes classifier with various smoothing techniques. Int. J. Comput. Sci. Mob. Comput. 2014, 3, 864–868. [Google Scholar]
© 2019 by the authors. Licensee MDPI, Basel, Switzerland. This article is an open access article distributed under the terms and conditions of the Creative Commons Attribution (CC BY) license (http://creativecommons.org/licenses/by/4.0/).


