Article

A Two-Step Framework for Energy Local Area Network Scheduling Problem with Electric Vehicles Based on Global–Local Optimization Method

1
School of Energy and Power Engineering, Wuhan University of Technology, Wuhan 430063, China
2
State Grid Beijing Electric Power Company, Beijing 100031, China
3
School of Electrical Engineering and Automation, Wuhan University, Wuhan 430072, China
4
College of Informatics, Huazhong Agricultural University, Wuhan 430070, China
*
Author to whom correspondence should be addressed.
Energies 2019, 12(1), 195; https://doi.org/10.3390/en12010195
Submission received: 27 November 2018 / Revised: 23 December 2018 / Accepted: 1 January 2019 / Published: 8 January 2019

Abstract

:
To reduce the fluctuation of renewable energy (RE) supply and improve the economic efficiency of the power grid, the energy local area network (ELAN), which is a subnetwork of the energy internet (EI), plays an important role in specific regions. Electric vehicles (EVs), as virtual energy storage (VES) in ELANs, are helpful to decrease the fluctuations of RE supply. However, how to use EVs in ELANs is a complex issue, considering the uncertainties of EVs’ charging demand, the forecast data errors of RE sources, etc. In this paper, a typical ELAN structure is established, taking into account RE sources, load response system, and a distributed energy storage (DES) system including EVs. A two-step optimization framework for ELAN scheduling problem is proposed. A global optimization model based on forecast data is built to maximize the income of ELAN, and an online local optimization model is introduced to minimize the correction cost utilizing prior knowledge. Finally, the proposed two-step optimization framework is applied to a series of real-world ELAN scheduling problems. The results show that DES system with EVs can reduce the volatility of RE supply evidently, and the proposed method is able to maximize the income of the ELAN efficiently.

1. Introduction

The increasing depletion of fossil energy and deteriorating global environment have led to the development and utilization of renewable energy (RE) [1,2,3,4]. To improve the utilization efficiency of these increased intermittent renewable sources and promote economic development, the energy internet (EI) has gradually evolved into a new energy structure based on smart grid technologies, which contain RE sources, and distributed energy storage (DES) systems and load [5,6]. To decrease the dependence on the main grid and take full advantage of the distributed energy resources (DERs) in specific regions, EI is usually divided into several small-scale energy local area networks (ELANs), which have a far-reaching impact on the demand side [7,8].
In view of the development of EI and ELAN, the application of advanced communication technologies in the power grid and the popularity of electric vehicles (EVs) in major cities, the concept of virtual energy storage (VES) has been rapidly developed [9,10]. VES is an energy management method, by which the energy of the system is balanced in the time dimension, utilizing the non-energy storage devices and scheduling strategies, thus showing the characteristics of energy storage [11,12,13]. With the improvement of battery technologies, the scale of the EVs continually expands, and EVs will play a key role in the ELAN [14]. Therefore, making proper use of the EVs in ELAN can not only promote the development of EVs, but also reduce the severe fluctuations of the RE. However, how to use EVs in ELANs is a complex issue that covers methodologies of energy management, analysis of virtual storage capacity of EVs, and coordinated scheduling and optimization of EVs and other types of energy sources, which suffers from various kinds of effects. To solve these kind of problems, it is necessary to design the energy management system (EMS) for the ELAN, study the characteristics of the EVs as virtual energy storage devices, and coordinate as well as optimize the operation of the distributed energy sources, such as the EVs and the RE sources, from the perspective of energy management [15,16,17].
To reduce the volatility of renewable energy and promote economic development of the ELAN, many researchers have investigated the design methodologies of the ELAN structure and scheduling strategies based on EMS. Reference [18] proposes a day-ahead optimal strategy for supplying required energy in an ELAN by the means of a hybrid energy system. The results illustrate that the proposed hybrid system is capable of meeting the electricity demand of the ELAN. The study of [19] presents an energy management strategy based on a frequency approach, using the wind/load’s fluctuating power sharing between the ultracapacitors and the battery according to their electrical performances. The experimental results show that the design of hybrid energy ELAN based on using energy storage systems to support renewable sources is more effective. The authors of [20] point out that the scheduling of heating, ventilation, and air conditioning, and EVs, is able to shave the peak load during critical periods and handle RE volatility. Also, they argue that a dynamic or online scheduling strategy is better than the day-ahead one in dealing with the uncertainties in ELANs. In recently years, there are also many studies focusing on the contributions of EVs or VES systems on reducing the operating cost of the ELANs with RE. Reference [9] proposes a dynamic economic dispatch model of a hybrid energy ELAN including EVs for daily operating cost reduction. Numerical studies demonstrate that the proposed dispatch method effectively minimizes the operating cost by making full use of the available capacity of VES system. The study of [21] suggests a stochastic expert framework to investigate the charging effect of plug-in EVs on the optimal operation of ELANs. The uncertainties are considered to be associated with the forecast error in the charging demand of EVs, hourly load consumption, energy price, and RE sources’ output power. The simulation results on a renewable ELAN, including different types of DERs and EVs, show the satisfying performance of the proposed intelligent framework. Reference [22] develops a modeling and control framework for robust renewable power tracking using plug-in EVs and examines the model using real driving data and Monte Carlo simulations. The results show that the strategy is able to achieve precise tracking of real wind power trajectory despite its severe fluctuations. Besides, Reference [23,24,25,26,27,28] also study the impact of the EVs or VES systems on the operation of ELAN and the scheduling strategies.
According to the above studies, conclusions can be drawn as follows:
  • The application of EVs as VES devices is helpful to reduce the renewable energy volatility in the ELANs and the operating cost. However, the uncertainties of EVs’ charging demand may lead to unavailability of the scheduling plans, which may decrease the utilization efficiency of the renewable energy and the reliability of the ELAN.
  • Currently, most scheduling strategies of the ELANs in both industry and academia are designed using forecast data, and the day-ahead dispatch approaches are usually proposed based on global optimization. The goal of global optimization is to find the maximum income of ELAN by formulating a scheduling strategy. If the forecast data utilized is accurate, it is evident that the global optimization method is more efficient than a local optimization one, since it can take all the factors into account from the time dimension, such as the power balance constraints and energy storage state constraints mentioned in this paper. However, the day-ahead forecast data cannot always be exactly the same as the practical data. Therefore, the online local optimization is introduced by some researchers to minimize the income in the current time interval. However, the online local optimization method can only obtain a local optimum solution, which may not consider the effects of the current strategy on the next time intervals. Hence, the total income will not be better than the one by global optimization.
In view of this, designing of an optimization framework, to meet the practical demand as well as utilize prior knowledge obtained by day-ahead global optimization, needs to be investigated. The purpose of this paper is to establish a two-step framework for ELAN scheduling with VES devices based on global-local optimization method. Instead of maximizing the income of each time interval directly, the online local optimization minimizes the correction cost, which means not only the practical data is used but also the prior knowledge obtained by day-ahead global optimization is considered. By designing the global-local optimization models, a bridge is built between the application global optimization and local optimization, which can solve the problem of forecast errors and the local optimum solutions. Thus, the algorithm can avoid trapping within a local optimum and get a solution that adapts the industrial demand.
In remainder of this paper, the ELAN-EMS is described, and a two-step optimization framework is proposed in Section 2. Then, the global optimization model based on forecast data is built and, according to this model, the online local optimization model is designed to minimize the forecast errors. Thereafter, the proposed two-step optimization framework is applied to solve several real-world ELAN scheduling problems and the economic efficiency is analyzed in Section 4. Finally, conclusions are drawn.

2. ELAN Scheduling Problem

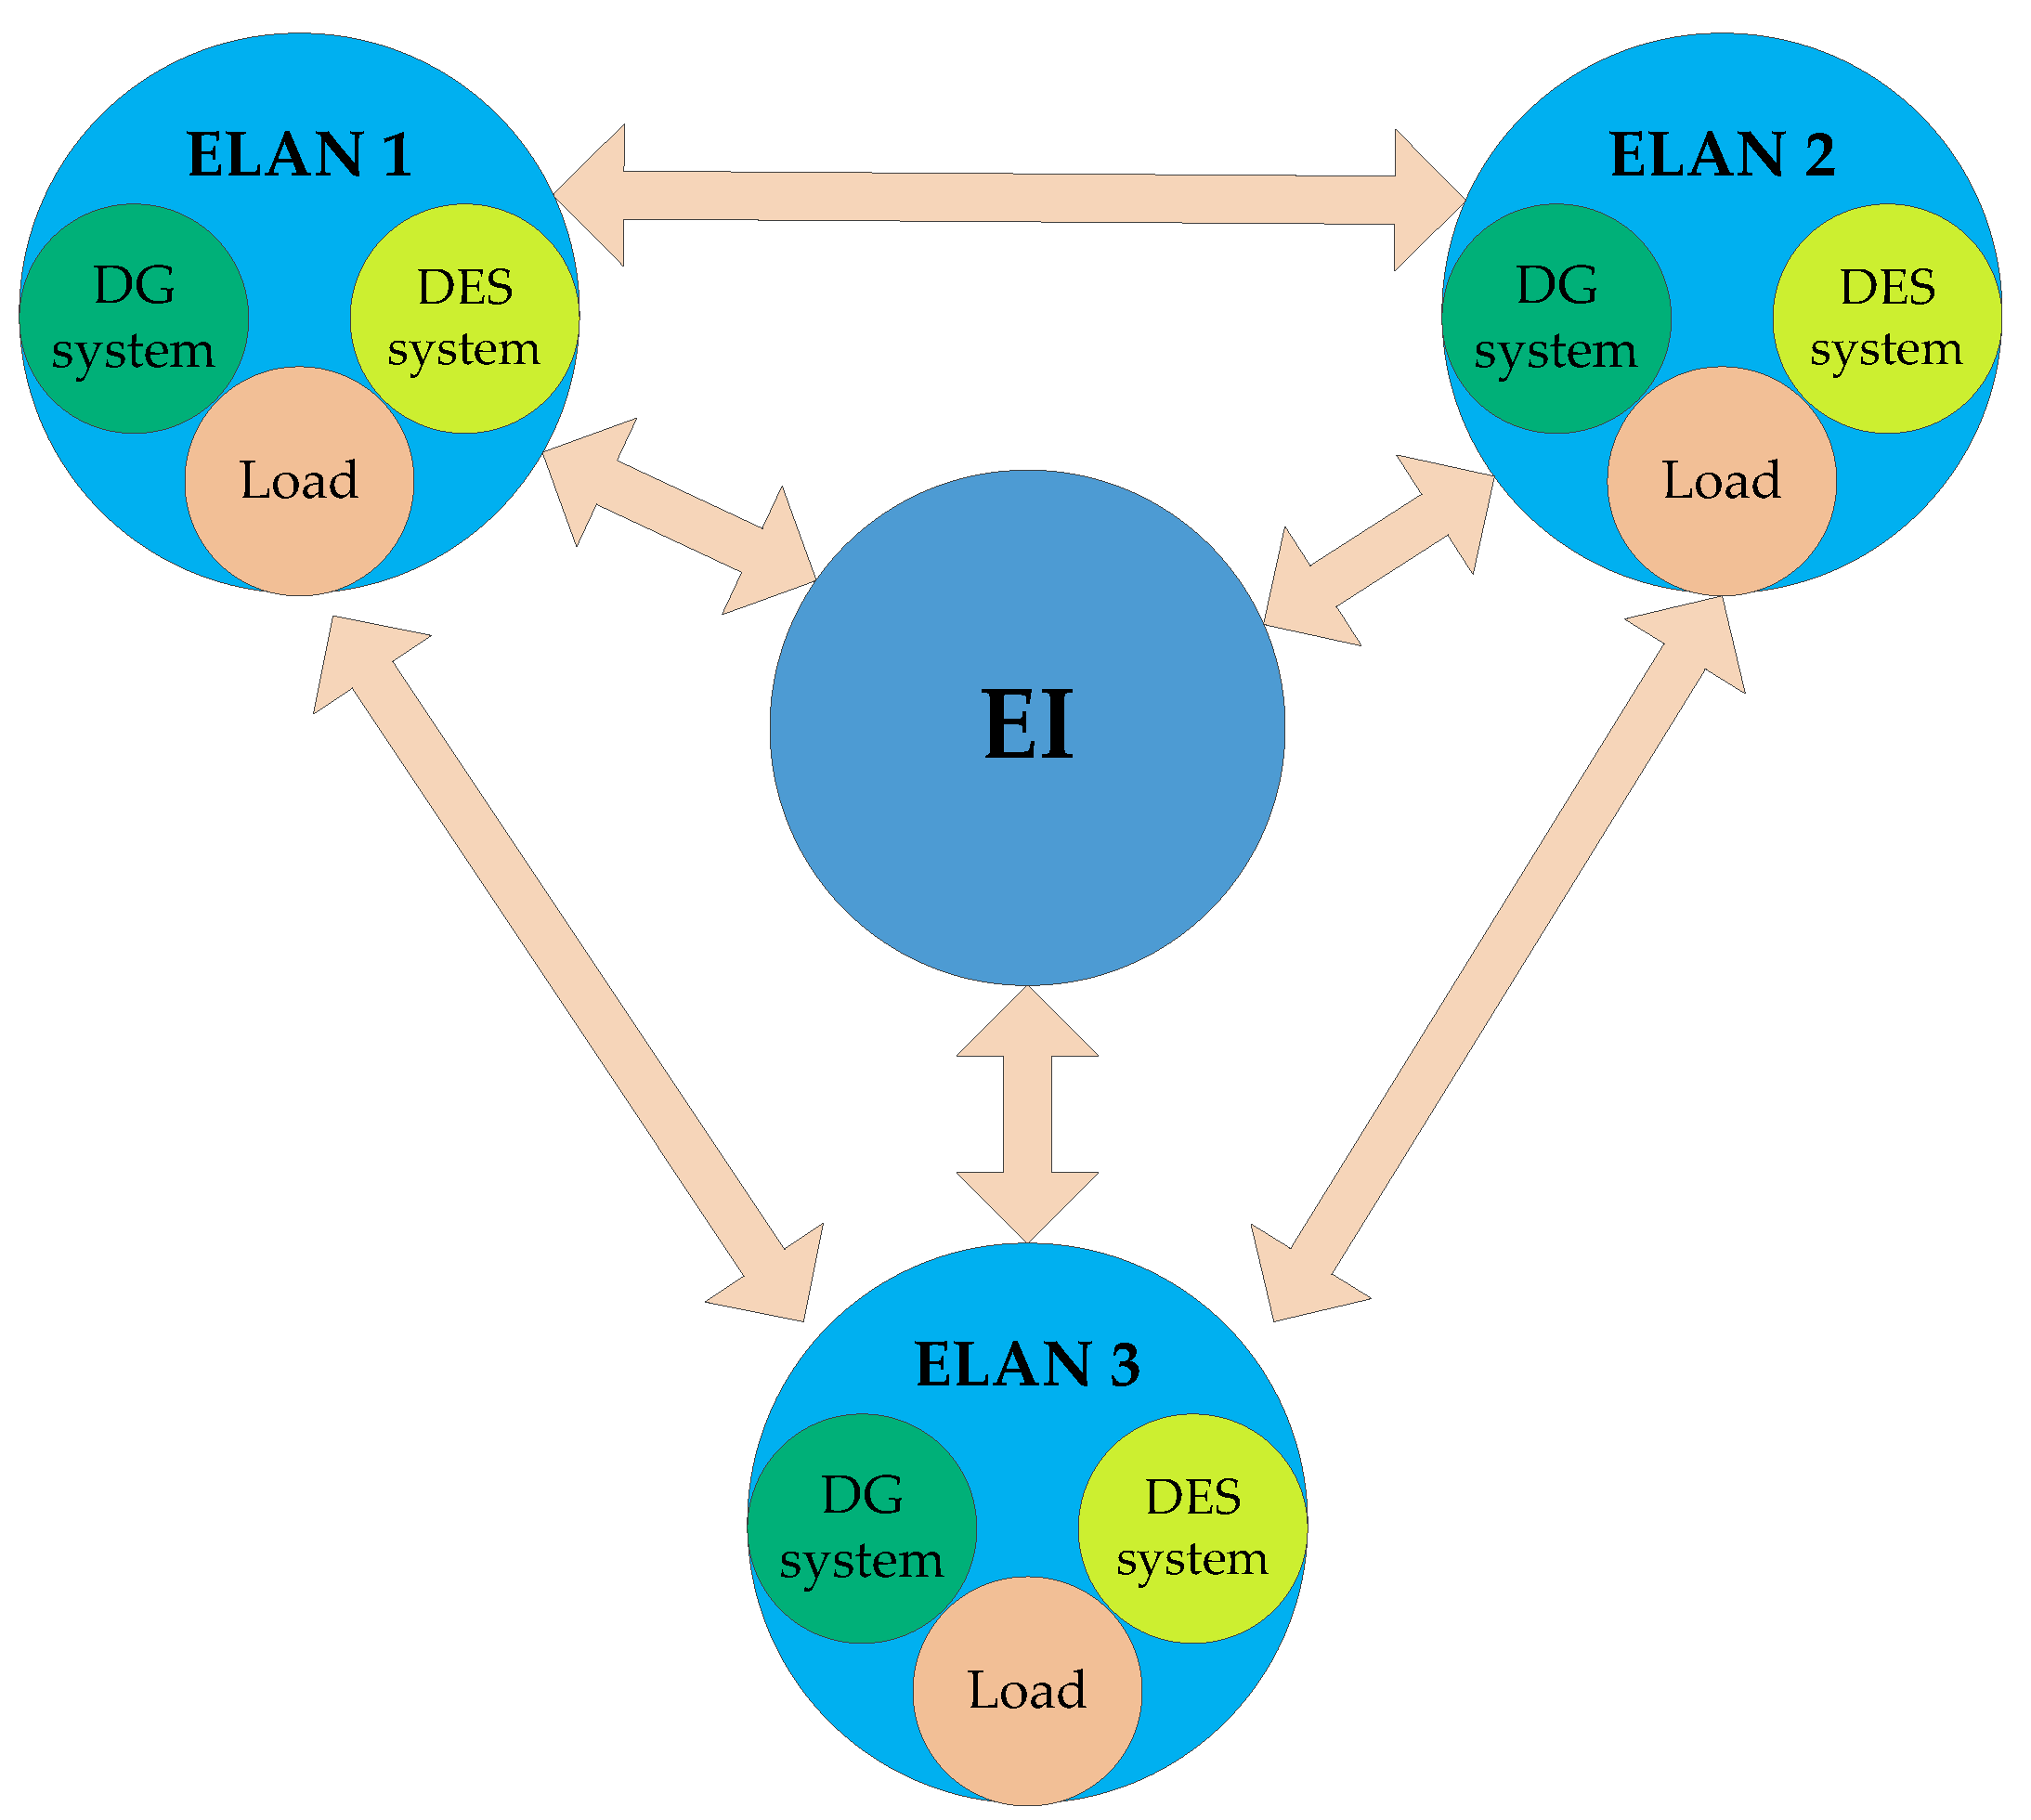
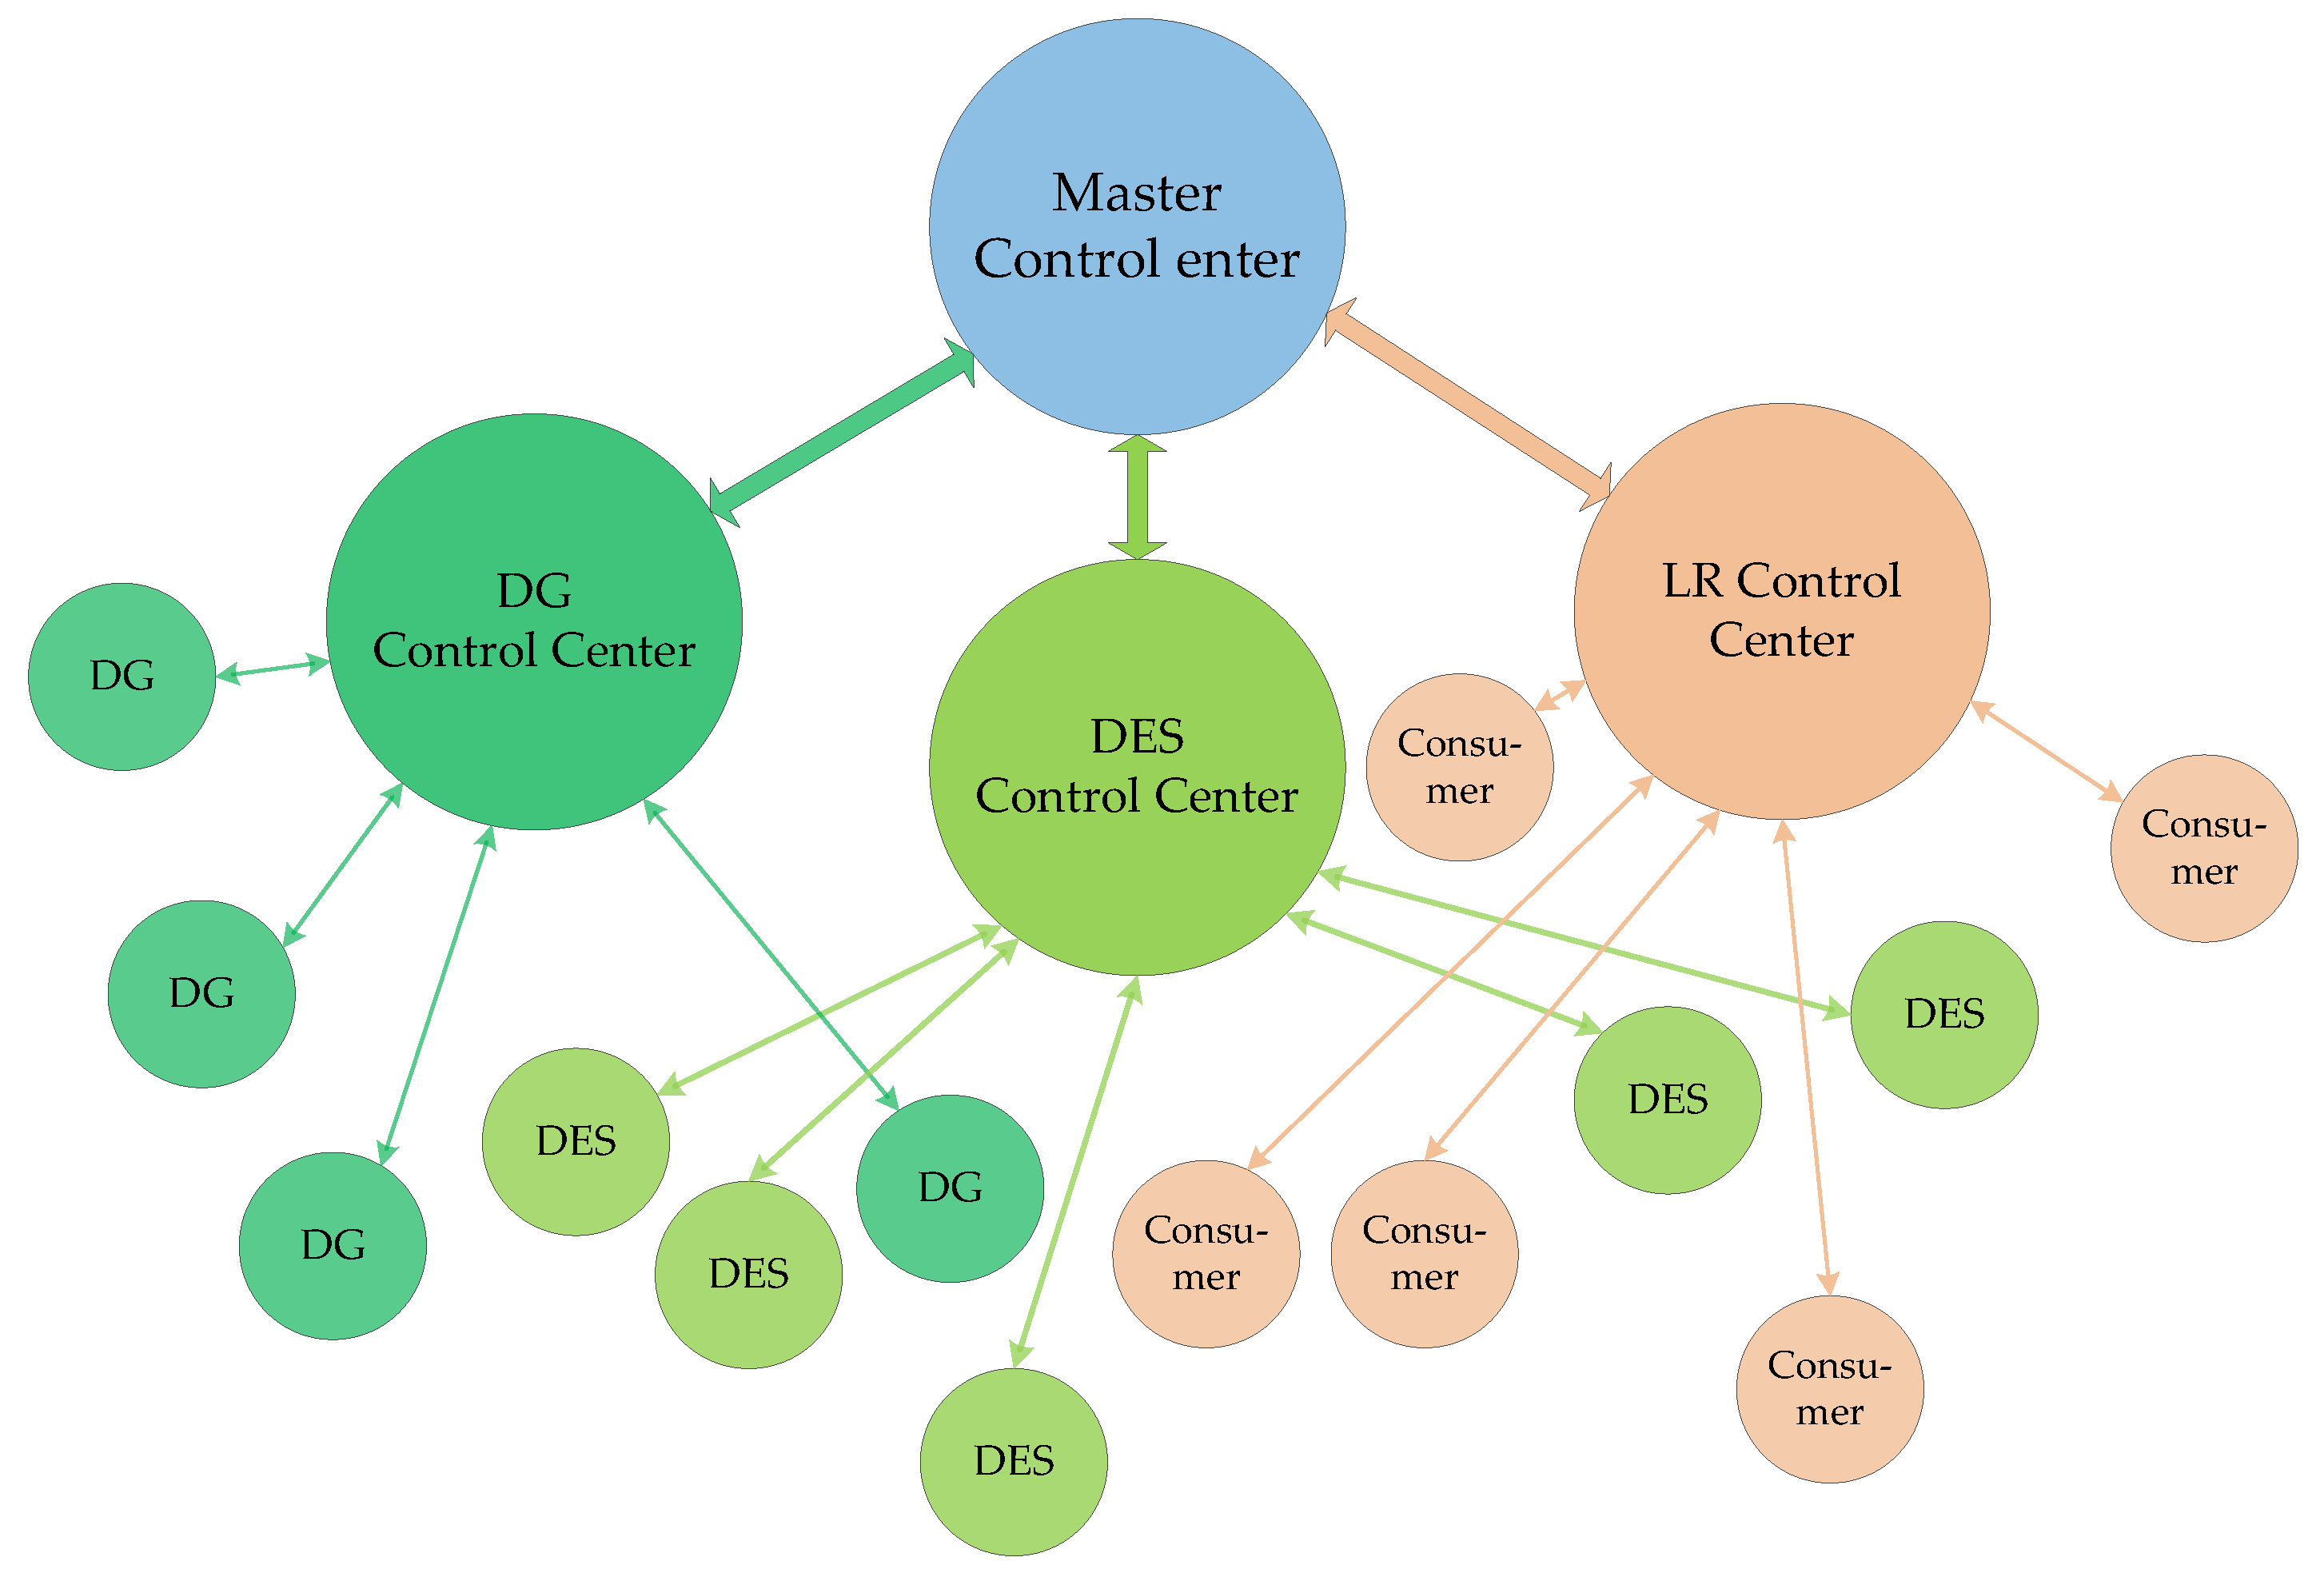
2.1. Description of ELAN-EMS

To meet the load demand without prejudice to any constraints, an EMS is needed in the ELAN for the coordination of the DERs allocation. If the demand and supply cannot be balanced, the ELAN will exchange electricity with superior EI or the neighboring ELANs. The process is described in Figure 1 below.
Generally, the ELAN-EMS has a hierarchical control structure, consisting of a master control center and several distributed control centers. The distributed control centers control the controllers of the DERs and exchange information with the master control center through the ELAN’s information network. Based on this, the master control center is able to allocate the output of every DER coordinately. With the abovementioned control method, the data transmission efficiency and the scalability of the system can be improved. The details are shown in Figure 2.
From Figure 2, it can be seen that, with development of communication technology, the physical boundaries of the terminals in the ELAN are broken and the terminals are classified according to their functions. According to the hierarchical control mode, the framework of ELAN-EMS in this paper can be described in Figure 3.
The ELAN-EMS mainly includes three parts, namely DG system, DES system, and LR system. In the DG system, photovoltaic cells (PVs) and wind turbines (WTs) are included. In the DES system, a number of EVs are introduced as virtual energy storage devices, in addition to the batteries being treated as traditional energy storage devices. In the LR system, consumers’ load response is considered.

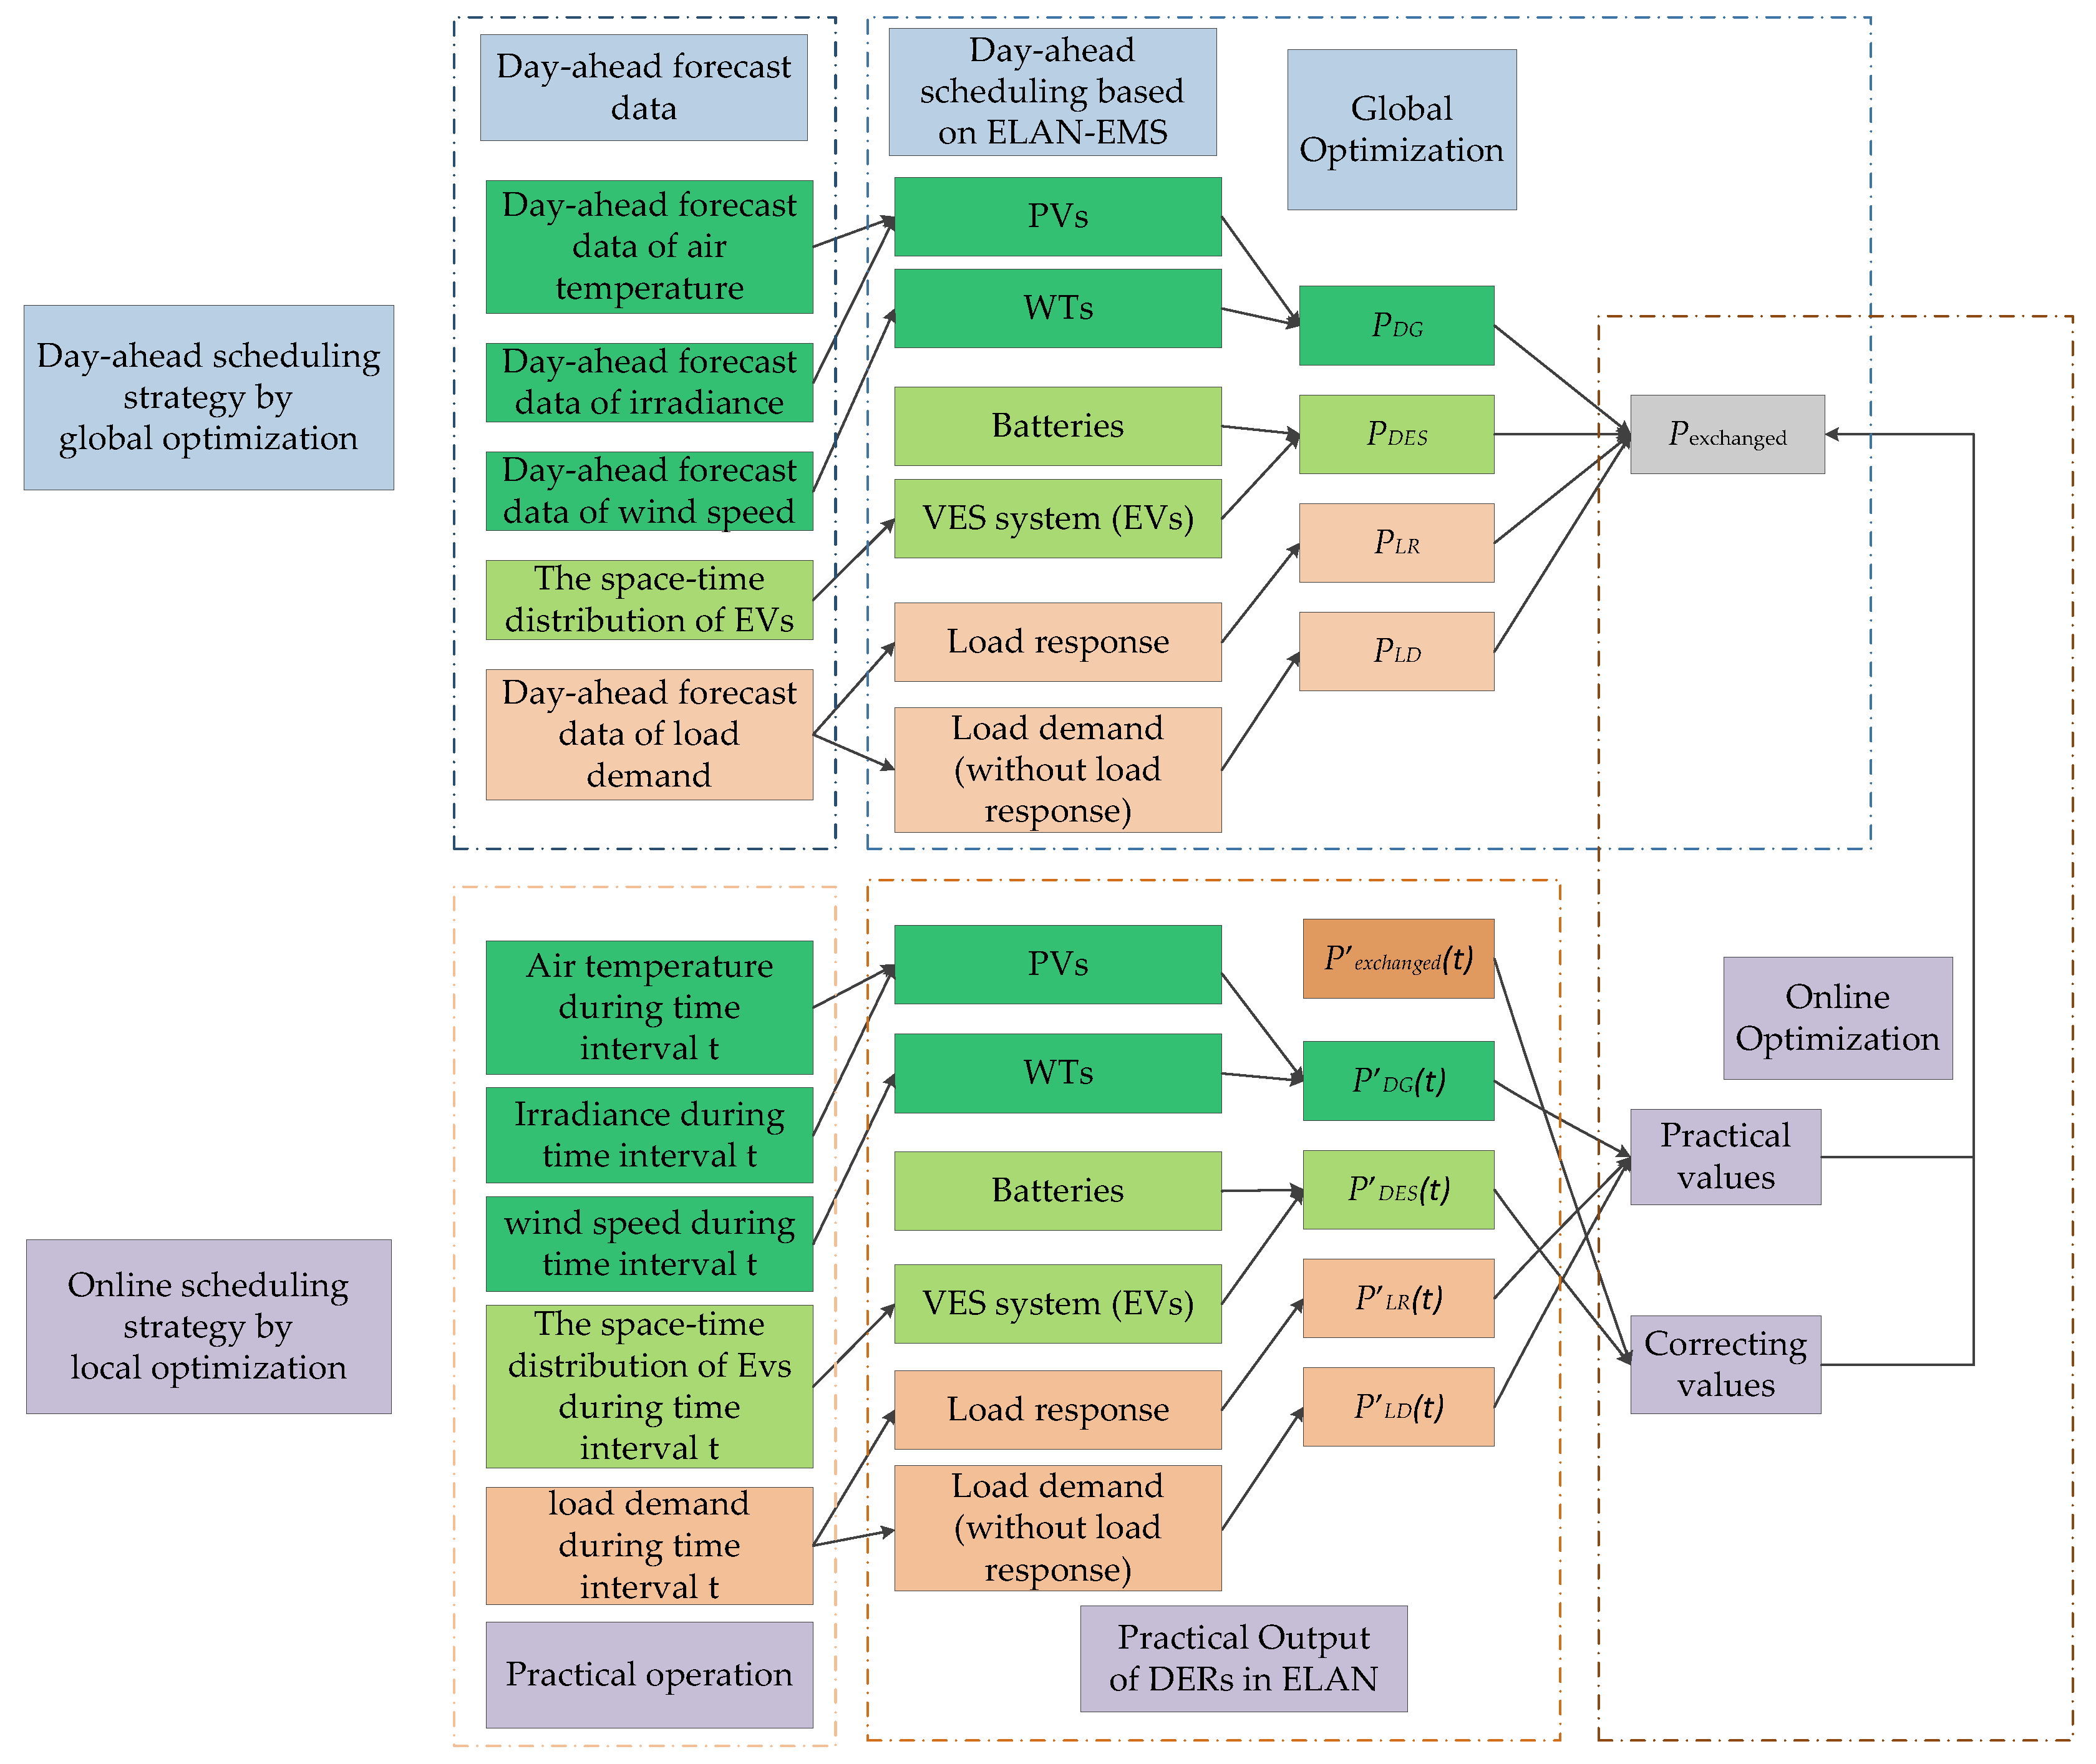
2.2. Two-Step Optimization Framework for ELAN Scheduling Problem

In order to maximize the income of ELAN, the ELAN-EMS firstly figures out the output of the DGs using RE, which are uncontrollable, and then adjusts the load demand by electricity tariffs according to customers’ load response. Then, the output/input of VES system is obtained by the results of the load response. Generally, the ELAN scheduling strategies can be described as follows:
(1) In the ELAN, the power from DGs, namely the PVs and WTs, should take priority with regard to being utilized to meet the demand of consumers. Thereafter, the electricity consumption will be controlled indirectly by electricity tariffs incentive mechanism according to consumers’ load response.
(2) If Strategy (1) cannot achieve balance between the supply and demand in the ELAN, the VES will be used to determine the charge/discharge power to achieve the goal.
(3) If Strategy (2) still cannot achieve balance between the supply and demand in the ELAN, external factors should be involved. If the demand of consumers exceeds the supply, the ELAN should purchase electricity from a neighboring ELAN or EI; otherwise, the ELAN sells electricity to a neighboring ELAN or EI.
Based on the strategies above, a two-step optimization framework is developed in this paper to control the distributed control centers, in which a day-ahead global optimization process is made, firstly, according to the forecast results, and an online local optimization method is utilized afterwards to correct the errors during the practical operation.
The flowchart of the two-step optimization framework is shown in Figure 4. It can be seen that the power output generated by RE in the ELAN is calculated by EMS using forecast data during the global optimization process. The VES and LR are also taken into consideration to form the global optimization scheduling strategy. However, in actual applications, the output of the DGs and the consumers’ load may deviate from forecasts, which means the scheduling strategy of each subsystem should be corrected locally using online optimization.

3. Optimization Modeling Based on ELAN-EMS

3.1. Global Optimization Model Based on Forecast Data

3.1.1. Objective Function: Maximization of the ELAN’s Income

The global optimization aims at formulating a scheduling strategy for maximizing the income of ELAN for the day ahead. The forecast data is utilized to obtain the output/input power of the DERs in each time interval of the whole day. The objective function can be described as follows:
Max   Income = C e x c h a n g e d C D G C L R C D E S
In the objective function, C D G can be obtained by the following expression:
C D G = t = 1 T ( i = 1 W C W T , i ( t ) + j = 1 P C P V , j ( t ) ) ,
where C W T , i ( t ) and C P V , j ( t ) can be expressed as
C W T , i ( t ) = K W T , i P W T , i ( t ) ,
C P V , j ( t ) = K P V , j P P V , j ( t ) ,
where the model functions of P W T , i ( t ) and P P V , j ( t ) can be found in [29]; K W T , i and K P V , j are set to be 0.11 ¥/kWh and 0.08 ¥/kWh, respectively [30].
In (1), C L R is obtained by the formula below:
C L R = t = 1 T m = 1 M T a r i f f t o c o n s ( t ) L R m ( t ) t = 1 T m = 1 M ( T a r i f f t o c o n s ( t ) Δ T a r i f f t o c o n s ( t ) ) ( L R m ( t ) + Δ L R m ( t ) ) .
Formula (5) can be simplified as
C L R = Δ T a r i f f t o c o n s ( t ) L R ( t ) T a r i f f t o c o n s ( t ) Δ L R ( t ) + Δ T a r i f f t o c o n s ( t ) Δ L R ( t ) ,
where
Δ T a r i f f t o c o n s = Δ L R ε L R T a r i f f t o c o n s ,
Δ L R ( t ) = m = 1 M ( L R m ( t ) L R m , 0 ( t ) ) b r , m ( t ) ,
where the value of ε is −0.22 [31].
In addition, the cost of DES system C D E S can be expressed as
C D E S = t = 1 T n = 1 N C E V , n ( t ) + C b a t t e r y .

3.1.2. Constraints Description

(a) Power balance constraint
The ELAN should meet the power balance constraint in every moment, which means the sum of the output of all the DGs and DES, the power of the load response, and the power from EI should be exactly equal to that of the load demand and purchased power. The constraint can be described as
P L D ( t ) = P D G ( t ) + P D E S ( t ) + P L R ( t ) + P e x c h a n g e d ( t ) .
(b) Output power constraint
In this paper, the ELAN includes WTs and PVs, which are two typical randomness and intermittent energies. Their outputs are significantly influenced by the environment. In addition, the VES output power of EVs is affected by the environment and the operation state of the VES devices in the present and last time intervals. Therefore, Each DG or VES device has a rated power limit, which is shown as
P k , m i n < P k ( t ) < P k , m a x .
(c) Energy storage state constraint of the power battery
Since the life of the batteries in the VES devices should always be taken into account, the state of charge (SOC) should be limited, which can be expressed as
S O C e v . m i n < S O C e v < S O C e v . m a x ,
where S O C e v . m a x is usually 100%, while the value of S O C e v . m i n depends on the type of the battery. In this paper, the commonly used lithium battery is considered, of which S O C e v . m i n is 20% [32].
(d) Basic power consumption constraint of EV on next day
Due to the randomness and uncertainty of the EVs, the remaining power of the battery should be limited for emergency use when taking part in VES system. Specifically, the battery remaining capacity of every EV should meet the demand of the next day at least. The constraint can be described as
W j , i W j , i 0 > 0 .
(e) Charging power constraint of EV
The charging power of a charging point is fixed. To make sure that all the batteries of the EVs are fully charged before leaving, the ELAN-EMS should guarantee that the charging points have the capability to fully charge the rest of the EVs during the remaining time intervals. It can be described by
S E V , l , r S E V , l t t 0 < P E V L .
The constraint above indicates that the difference between the sum of the rated electric power and the current remaining capacity of all the EVs’ batteries, namely, the sum of the electric power needed by the EVs before leaving the charging points must be no more than the total electricity amount that can be provided by the charging points in the ELAN during the remaining time intervals.
(f) Electric quantity constraint of load response
According to the long-term historical statistics of electricity consumption, the maximum electricity consumption of consumers should be less than their electricity load response, which can be expressed as:
0 Δ L R m ( t ) < L R m ( t ) .
(g) Tariff constraint of load response
As mentioned above, the load response of consumers is incentivized by electricity tariffs. However, the electricity purchased from EI will be cheaper than that from the consumers when the incentive is too much, resulting in the electricity tariffs mechanism losing effectiveness. Therefore, a constraint for tariff incentive is needed, which can be described by
T a r i f f f r o m E I T a r i f f t o E I < Δ p .

3.2. Online Local Optimization Model during Practical Operation

3.2.1. Objective Function: Minimization of Local Correction Cost

During the practical operation, the output of the DGs and the consumers’ load may deviate from forecasts, so the scheduling strategies in each time interval may be corrected, which leads to more cost. Therefore, the objective function, the purpose of which is to minimize the local correction cost, can be formulated based on the results obtained by global optimization and the practical outputs of the DERs. It can be described as
M i n Δ C ( t ) = Δ C L R ( t ) + Δ C e x c h a n g e d ( t ) + Δ C D G ( t ) .
It is obvious that the devices in VES system, such as EVs, have strong local constraints and global limits. Therefore, the power from VES system cannot be adjusted when there is a difference between the actual output and the planned output. In this case, other strategies, such as purchasing electricity from EI or neighboring ELANs, and compensating electricity from other control centers, will be introduced. In this way, the output of VES can always stay in global optimum state.

3.2.2. Constraints Description

(a) Power balance constraint after correction
When correcting the scheduling outputs during the practical operation, the power balance constraint still cannot be violated. The actual outputs and the changes should satisfy the equation below:
P D G ( t ) + P D E S ( t ) + P L R ( t ) + P e x c h a n g e d ( t ) + P L D ( t ) + Δ P D ( t ) = 0 ,
where Δ P D ( t ) is expressed as
Δ P D ( t ) = Δ P D G ( t ) + Δ P L D ( t ) + Δ P L R ( t ) .
(b) Other constraints
Besides the power balance constraint, the other constraints of the local optimization problem are the same as those in the global optimization model.

4. Simulations and Discussion

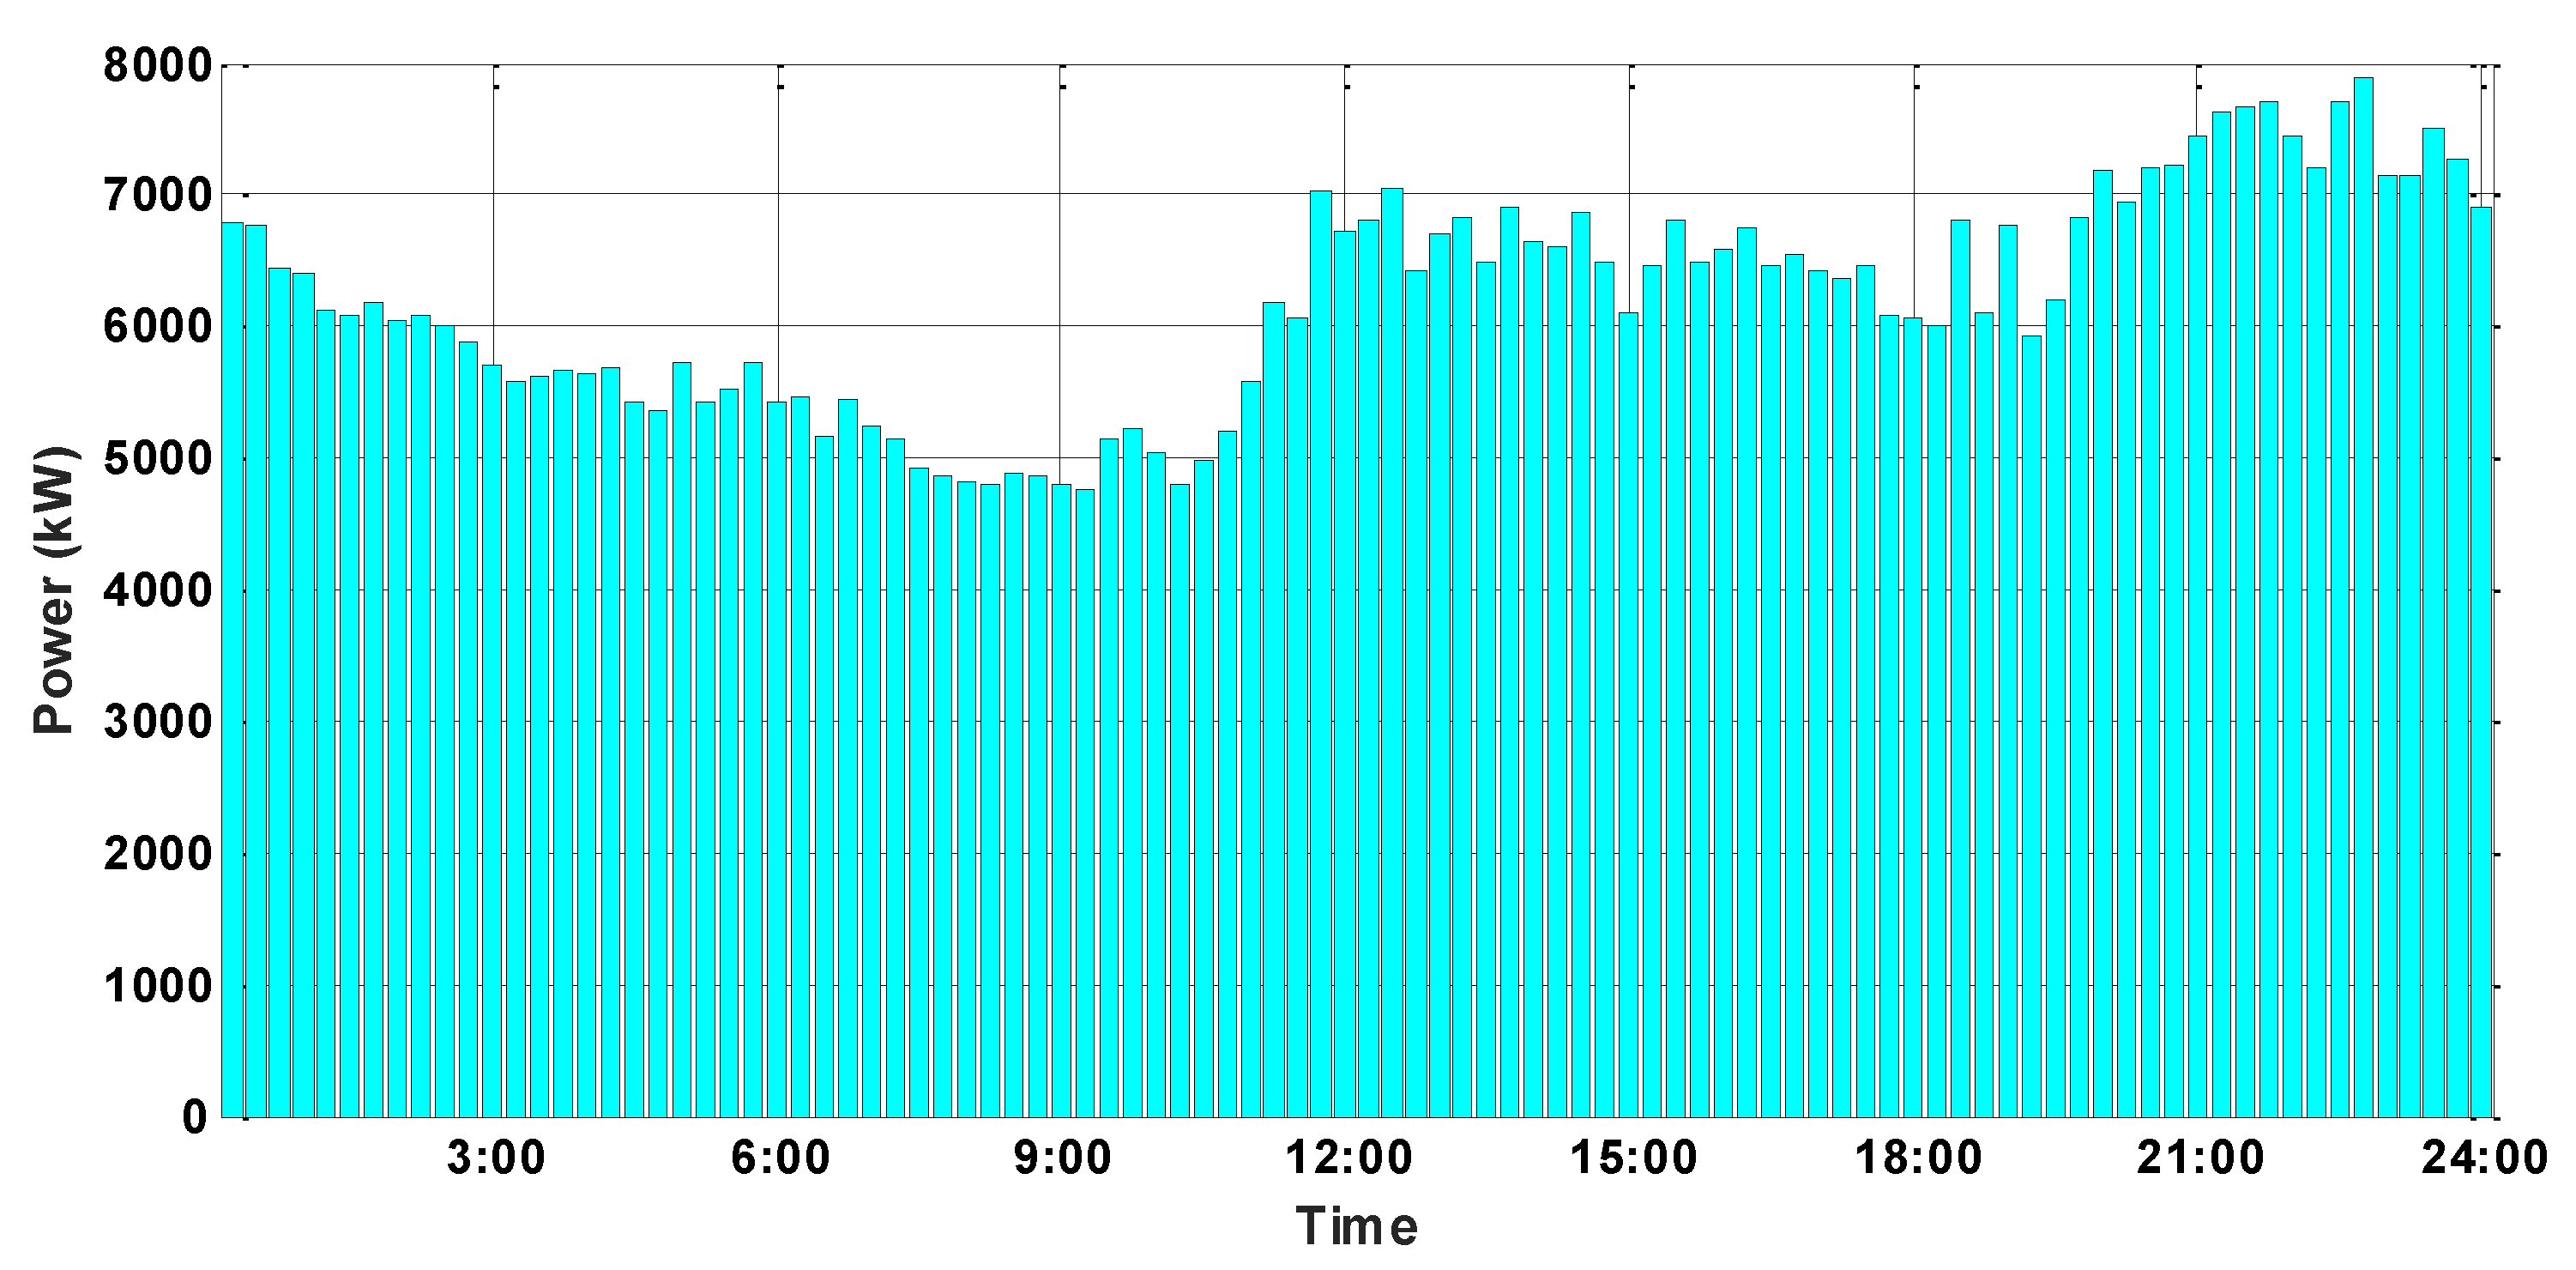
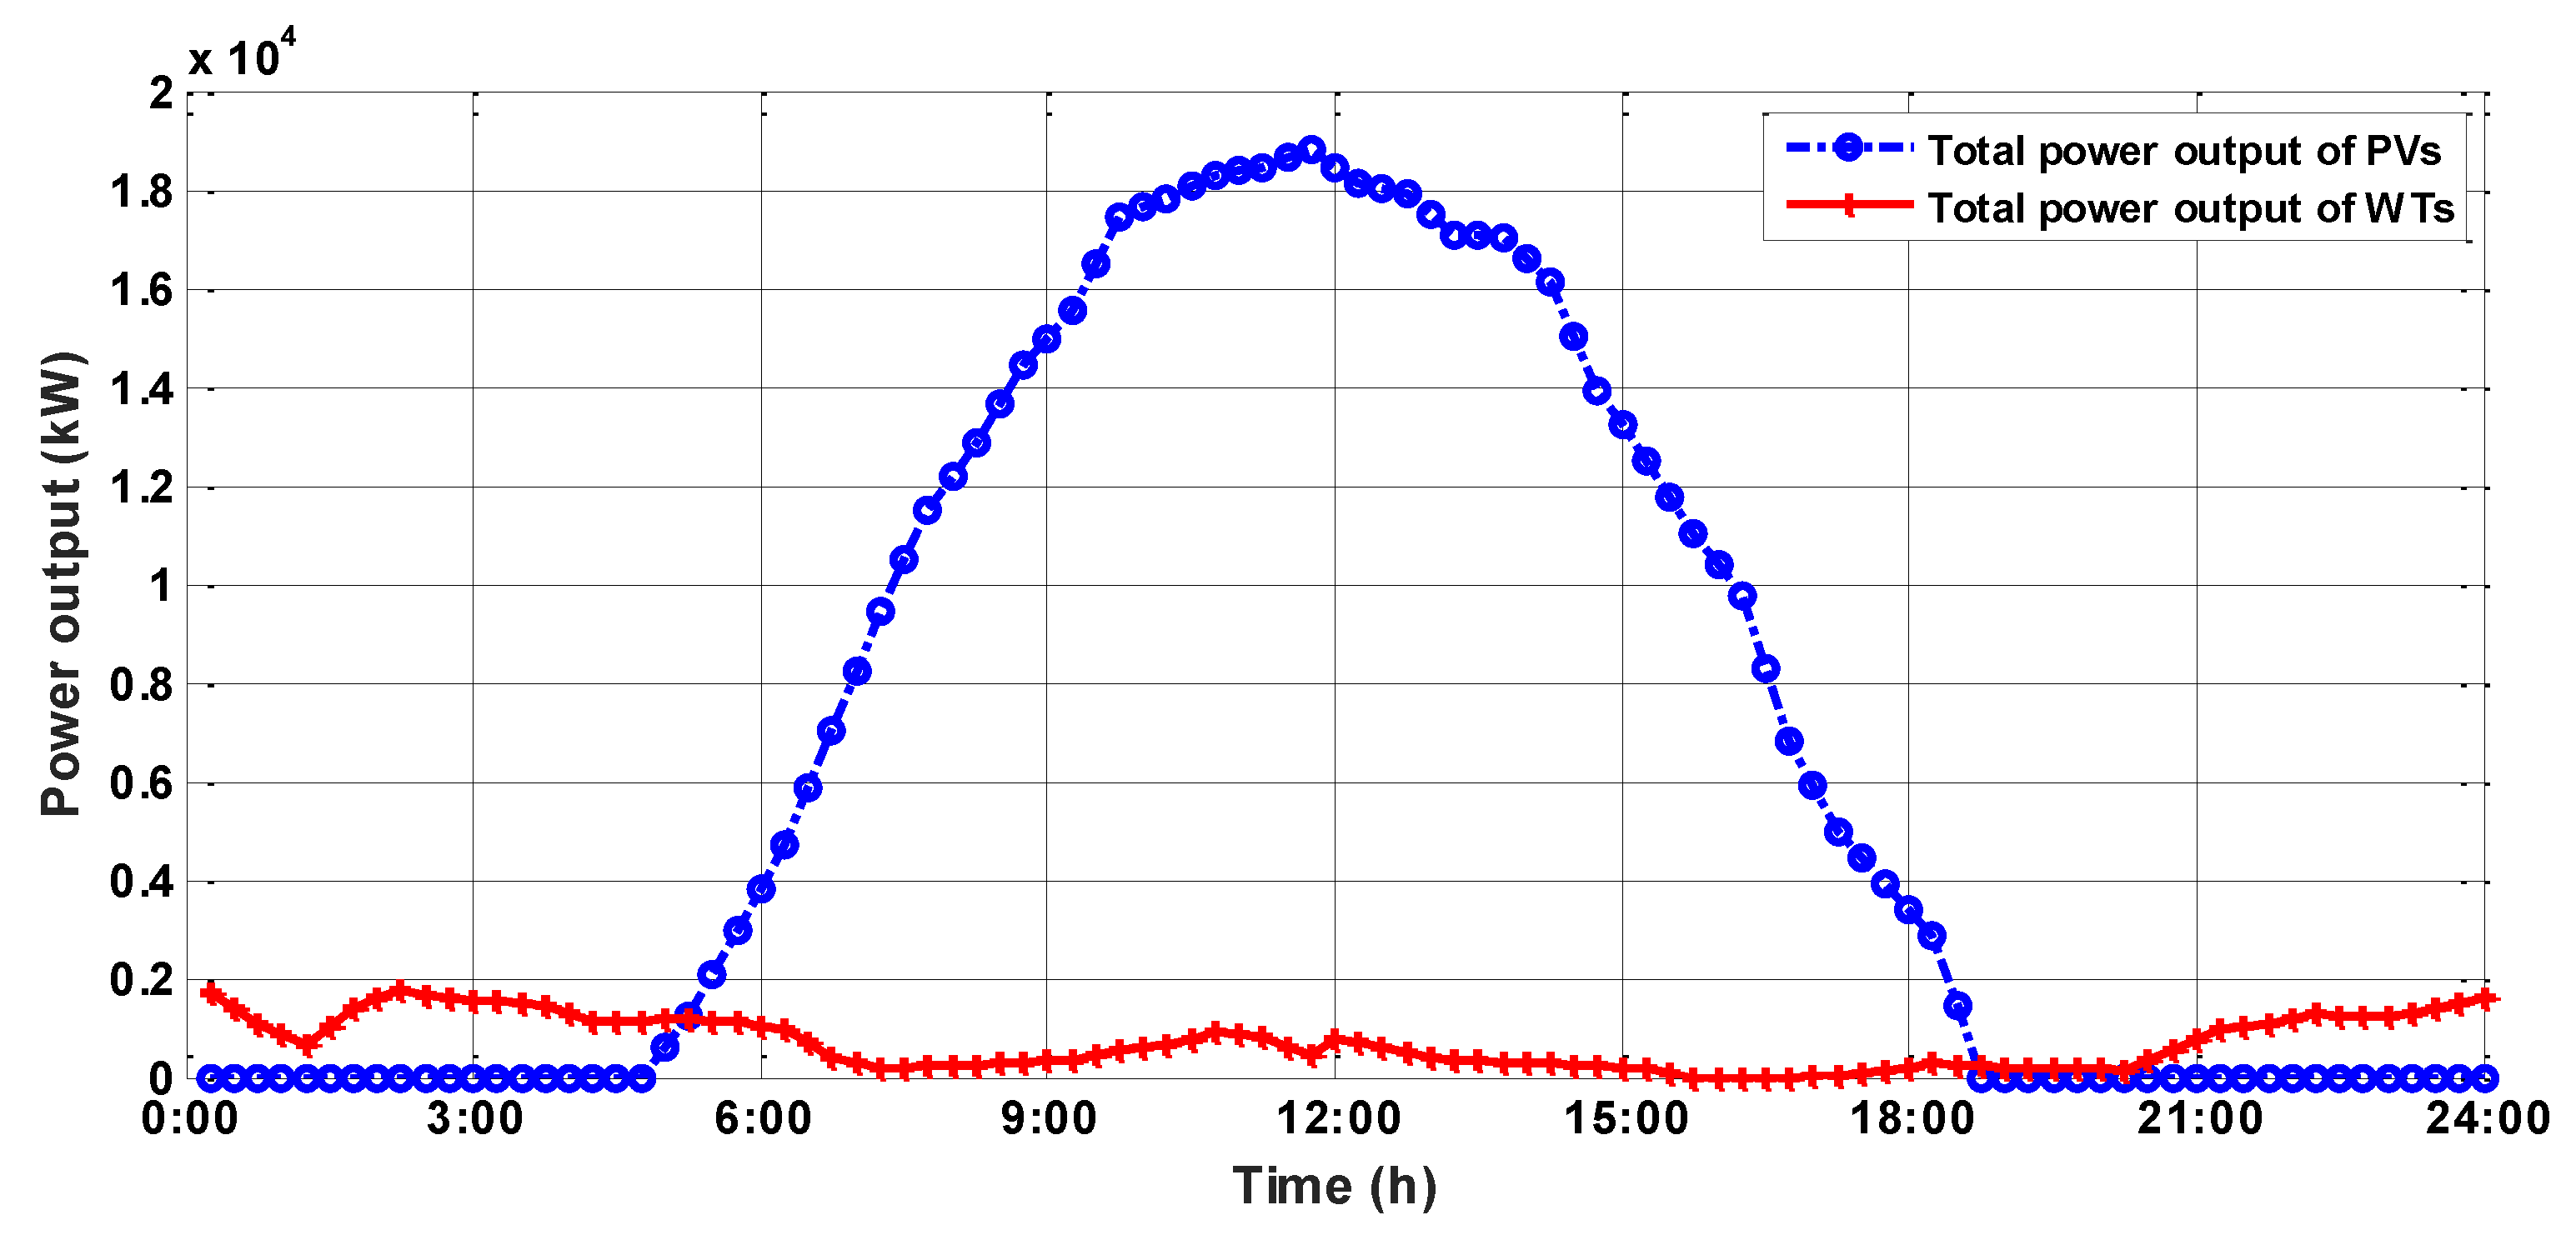
4.1. Data and Parameter Settings

In this paper, a newly built town near Beijing, where the DERs in ELAN have been applied, is taken as a case study. The EMS established in this paper includes 200 WTs, and the installed power of each WT is 10 kW. There are also PVs in the residential area, the total area of which is about 150,000 m2. The installed power of each PV is 10 kW. These parameters can be found in [29]. The income of the PVs is calculated by the surplus PV power sold to the grid. Besides, the DES system contains the VES system and several batteries. The maximum output power of the battery is 100 kWh. For the VES system, the capacity depends on the number and styles of the EVs. By Monte Carlo method, the value of the VES system is obtained, which is 7.027 × 10⁴ kWh in this paper. A total of 3478 EVs can be charged by the distributed charging points, at least in this town [33], the space–time distribution of which are shown in Figure 5. The total number of the EV charging points is 3945. The discharging efficiency of the EVs is 80%. All the consumers in the town are able to contribute to the load response. According to the occupancy rate predicted in 2025, there will be 3300 households in the town. According to the electricity consumption data of the residential areas with similar natural and social conditions, the load demand curve of a typical day in the new town can be obtained, which is shown in Figure 6.
In addition, according to the living standard of the residential area in Beijing, the electricity tariff is 0.7883 ¥/kWh. The prices of charging/discharging are 0.4883 ¥/kWh and 0.6883 ¥/kWh, respectively.
In this paper, the global particle swarm optimization (PSO) algorithm is introduced. The number of the particles and the iterations can be improved, which are set to 100 and 100,000, respectively, and, in the local optimization, the number of the particles and the iterations are set to 50 and 200, respectively. All the experiments are accomplished using MATLAB 2013, by a PC with an Intel Core i7-4810MQ (2.80 GHz) processor under Windows 8.1 using 12 GB of RAM. It can be seen from the global optimization model (with 96 time intervals) that the decision vector is high-dimensional, which may lead to a ‘dimension disaster’. As the global optimization process is based on the forecast data and results, it does not require EMS to figure out the results in a short time. Therefore, the computing efficiency can be sacrificed for better optimization results.

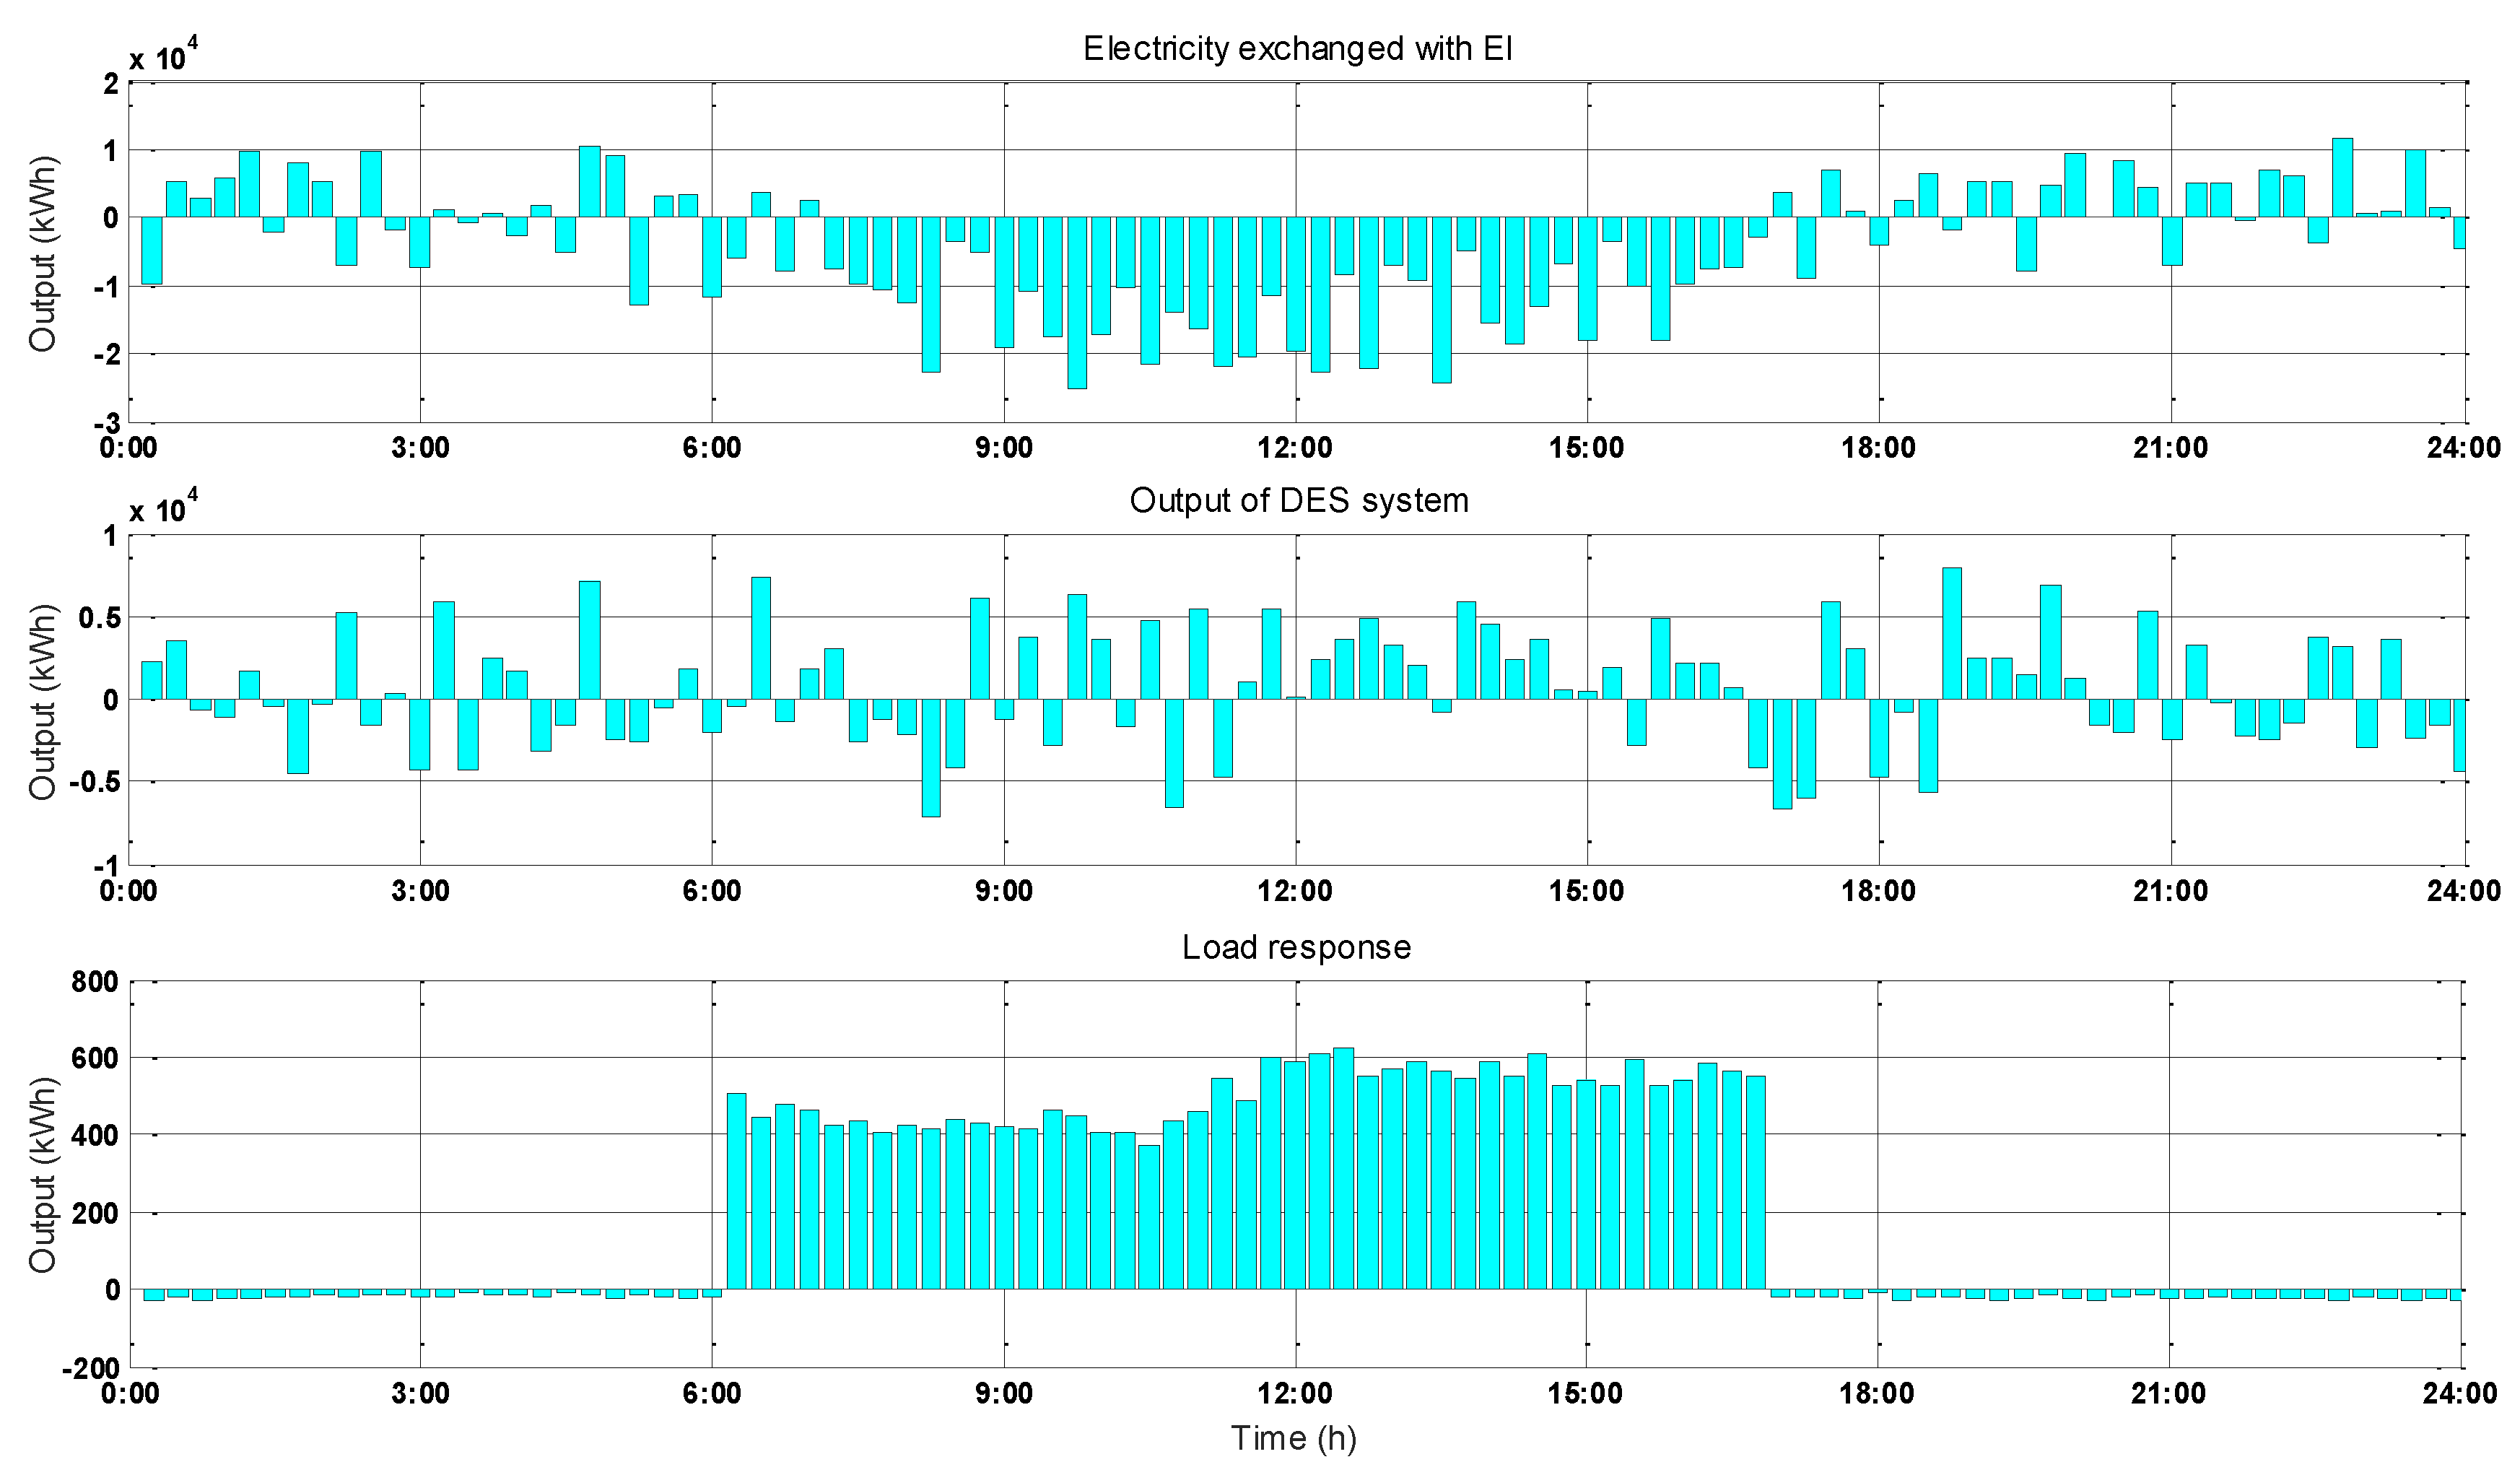
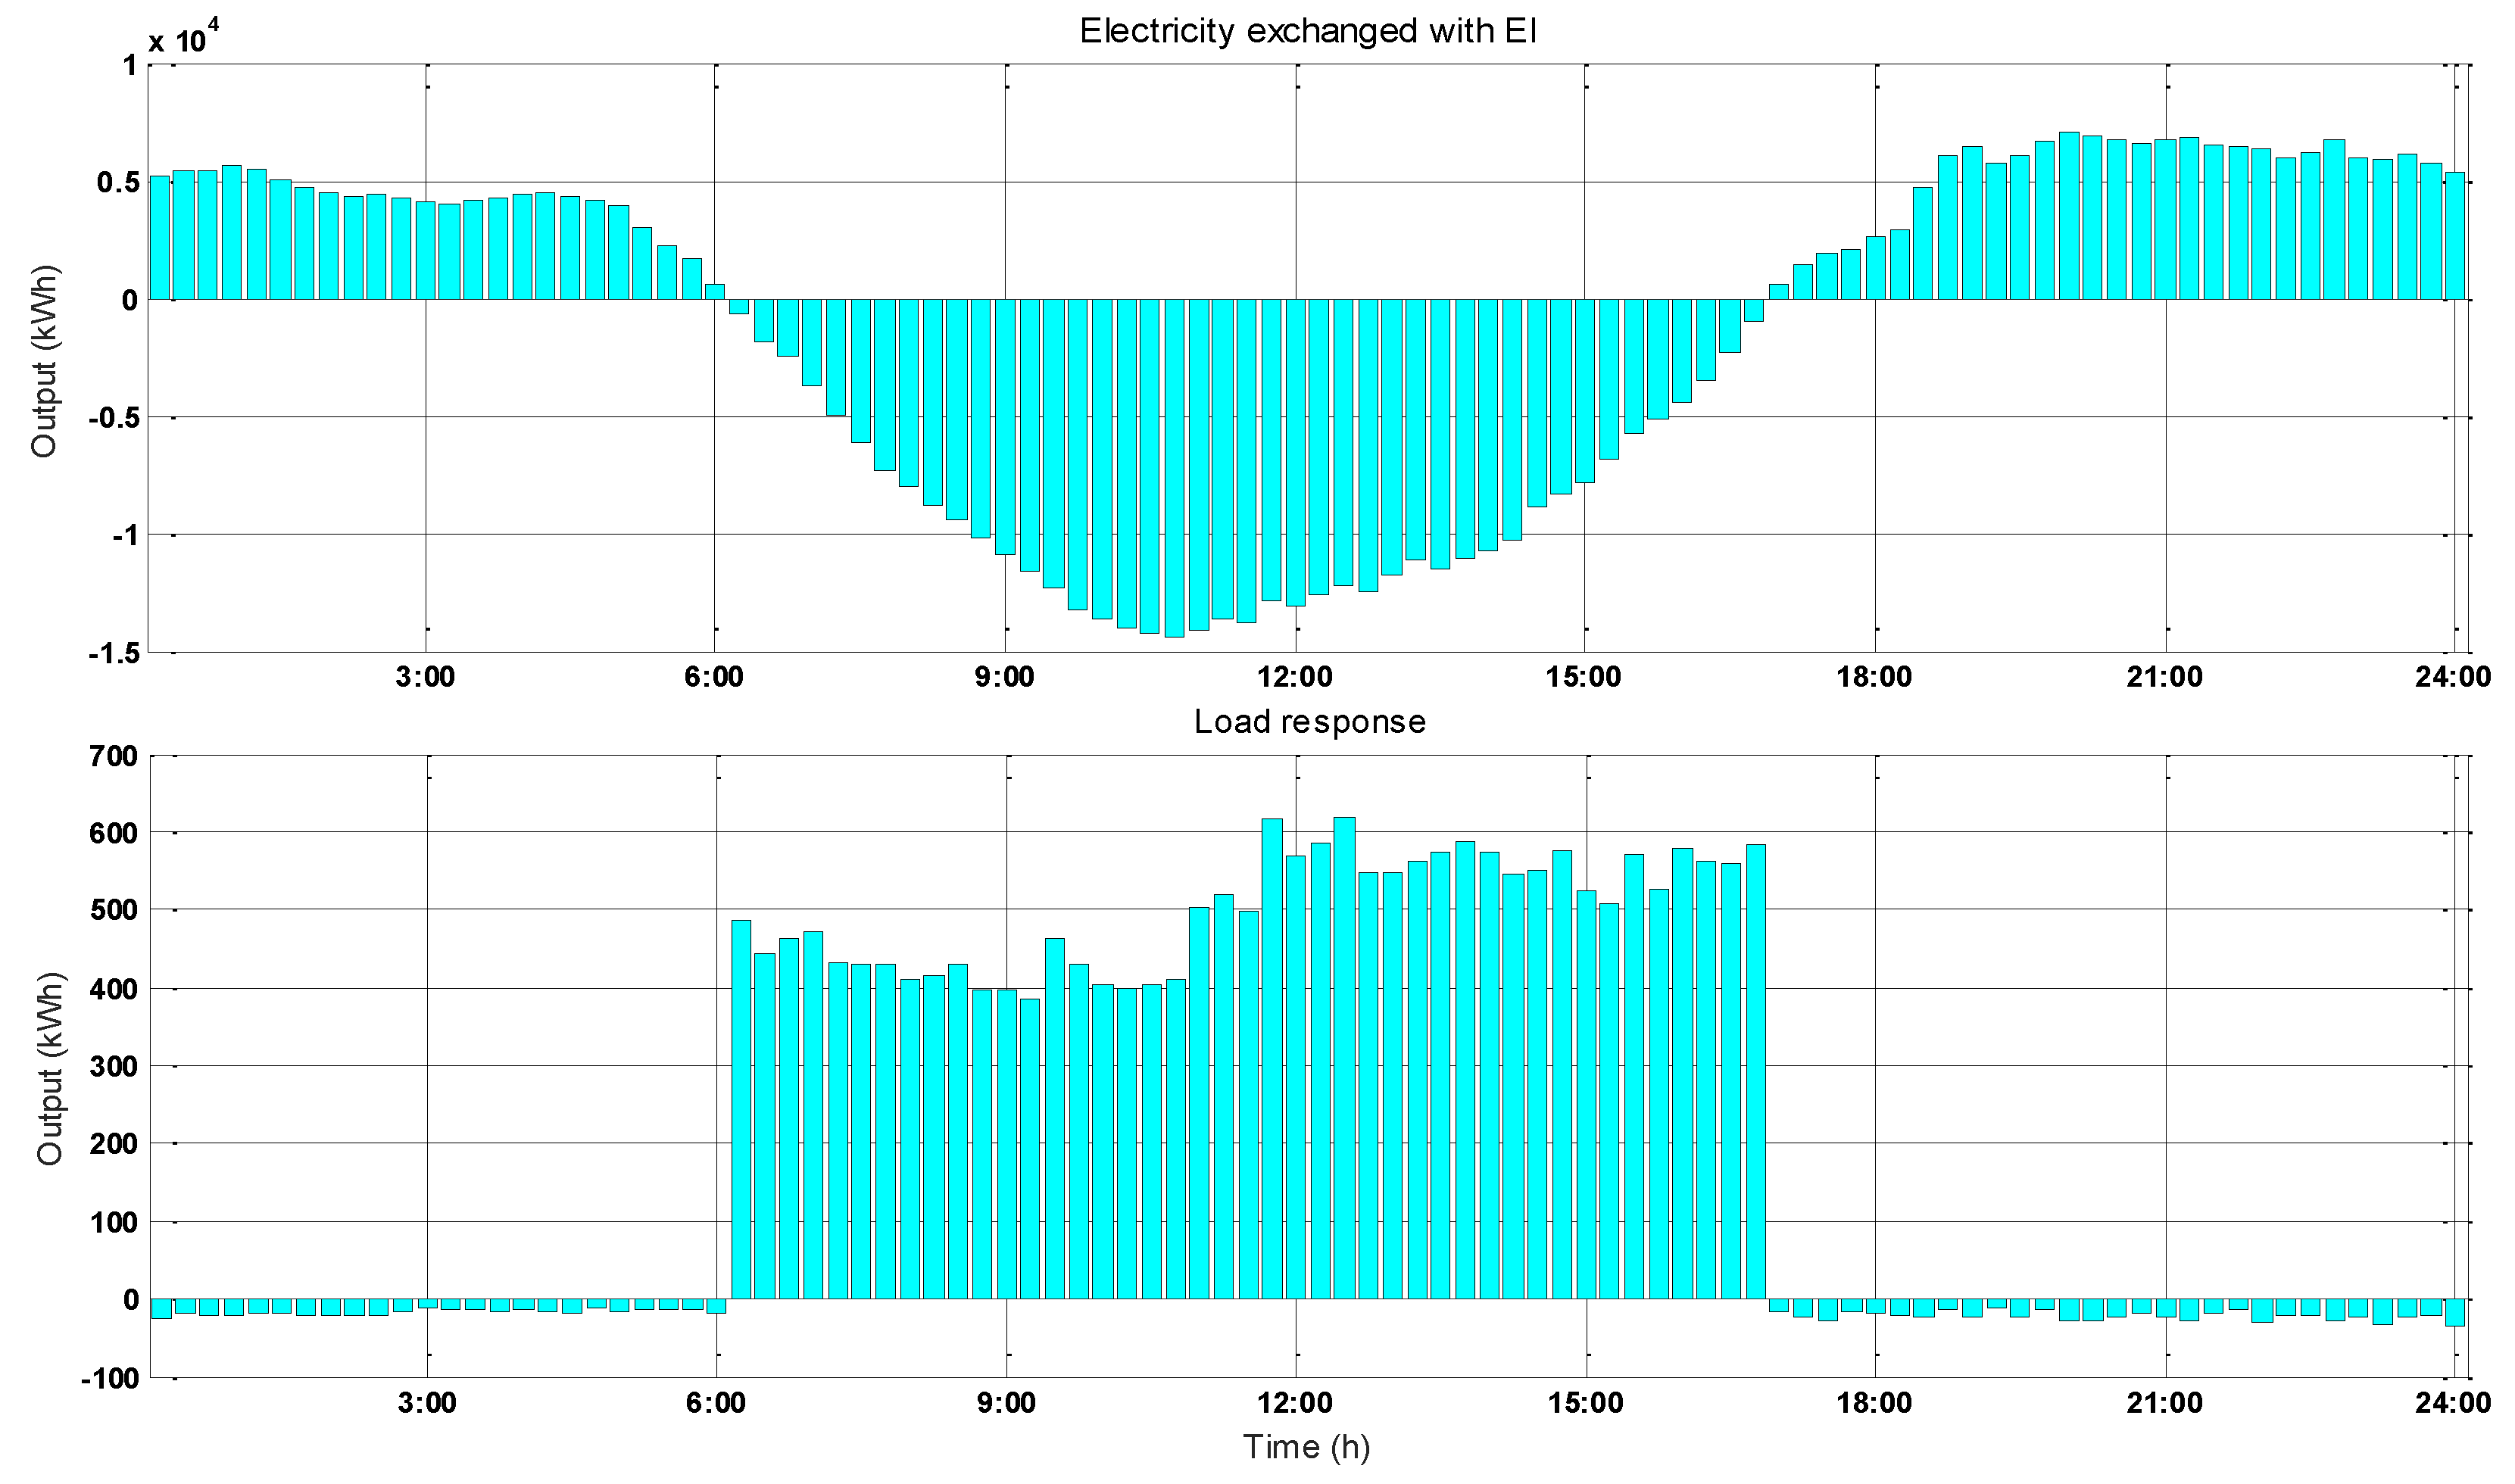
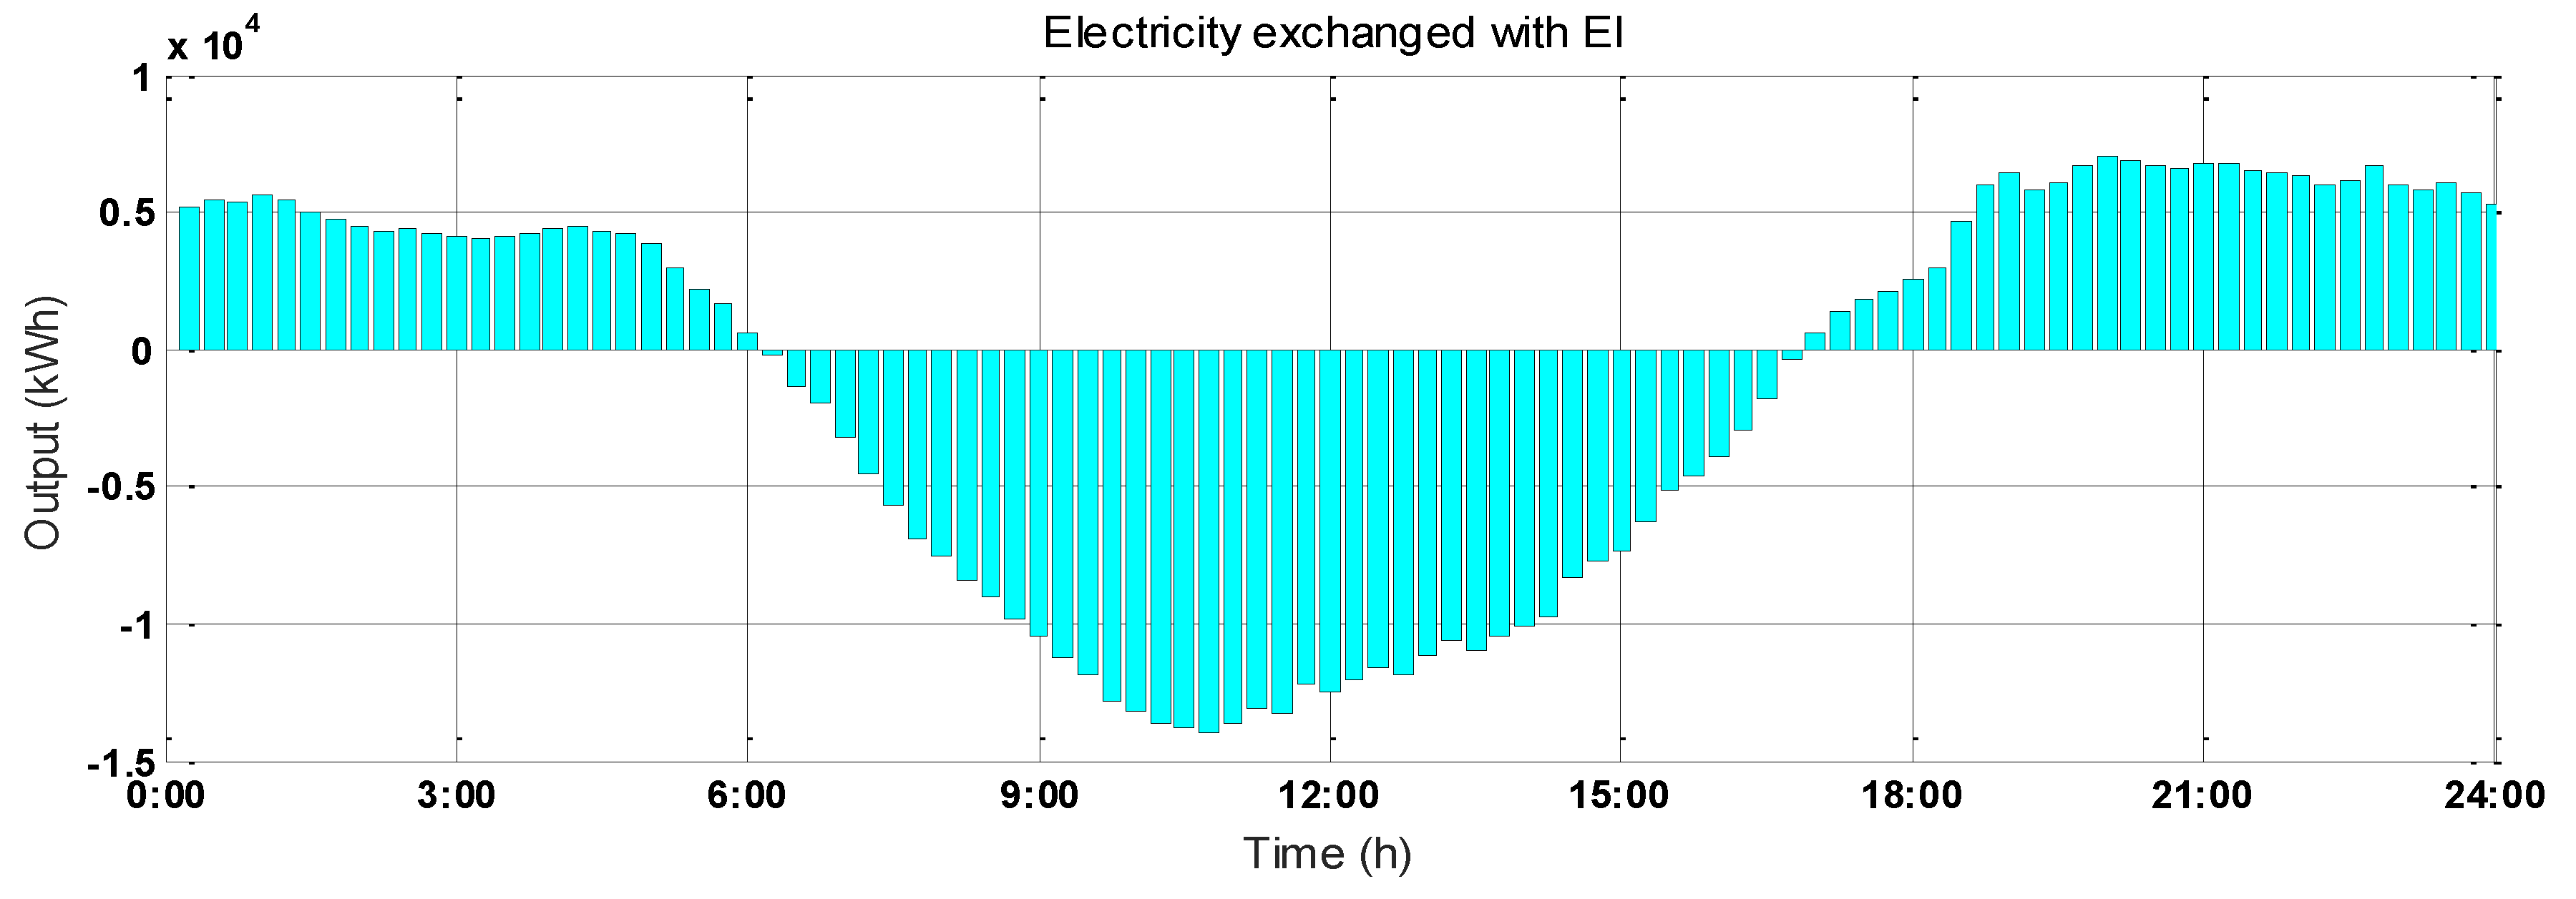
4.2. Global Optimization Results and Analysis

According to the models, parameter settings, and the forecast data of the environment, the output curves of WTs and PVs can be obtained, which are shown in Figure 7.
Since the total income of the ELAN depends on the practical operation, the results of the global optimization do not affect the income directly. In this paper, four operation scenarios with different distributed control centers are considered as follows:
Scenario One: All of the subsystems are taken into account during the global optimization process.
Scenario Two: Only DG system and DS system are considered during the global optimization process.
Scenario Three: Only DG system and LR system are involved during the global optimization process.
Scenario Four: Only DG system is considered during the global optimization process.
The PSO algorithm runs 10 times for every scenario, and the best results are recorded. The output power of the DERs, the LR system, and electricity exchanged with EI in different time intervals are shown in Figure 8, Figure 9, Figure 10 and Figure 11. The income of the ELAN in different scenarios is given in Table 1.
It can be seen from Figure 8, Figure 9, Figure 10 and Figure 11 that the purchased electricity by ELAN from the grid decreases evidently when DES system and LR system are considered during the global optimization process, compared with Scenario Four. Table 1 implies that the income is higher when DES system is introduced, compared with Scenario Three and Scenario Four. This indicates that the DES system can improve the economic efficiency of the ELAN.

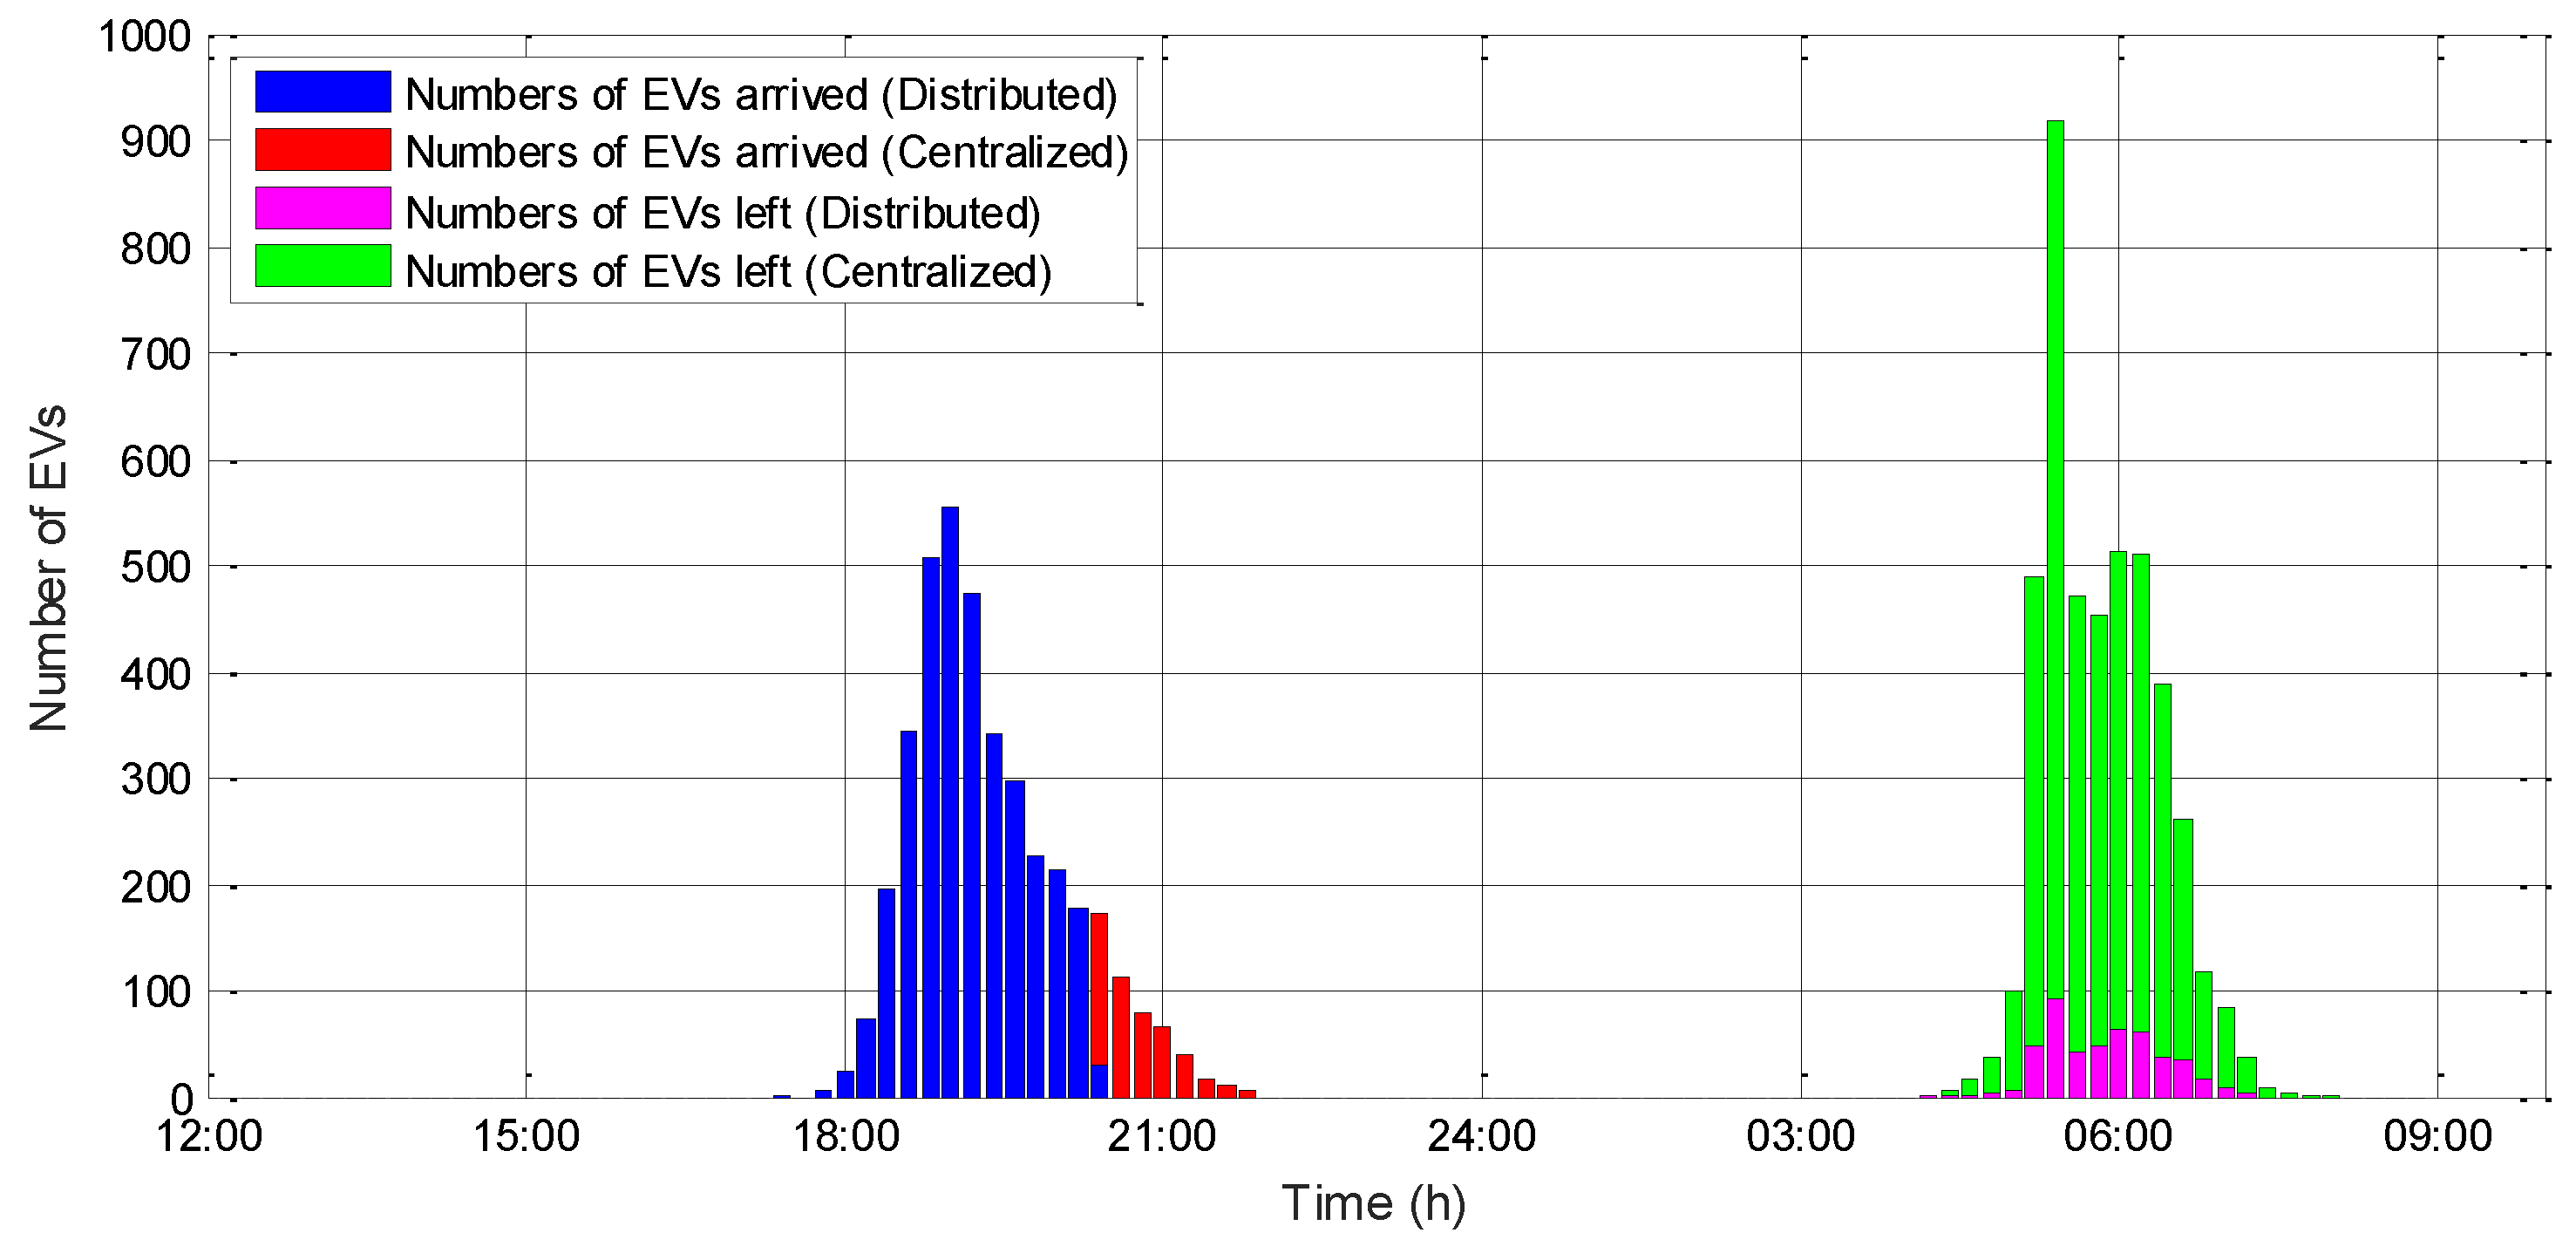
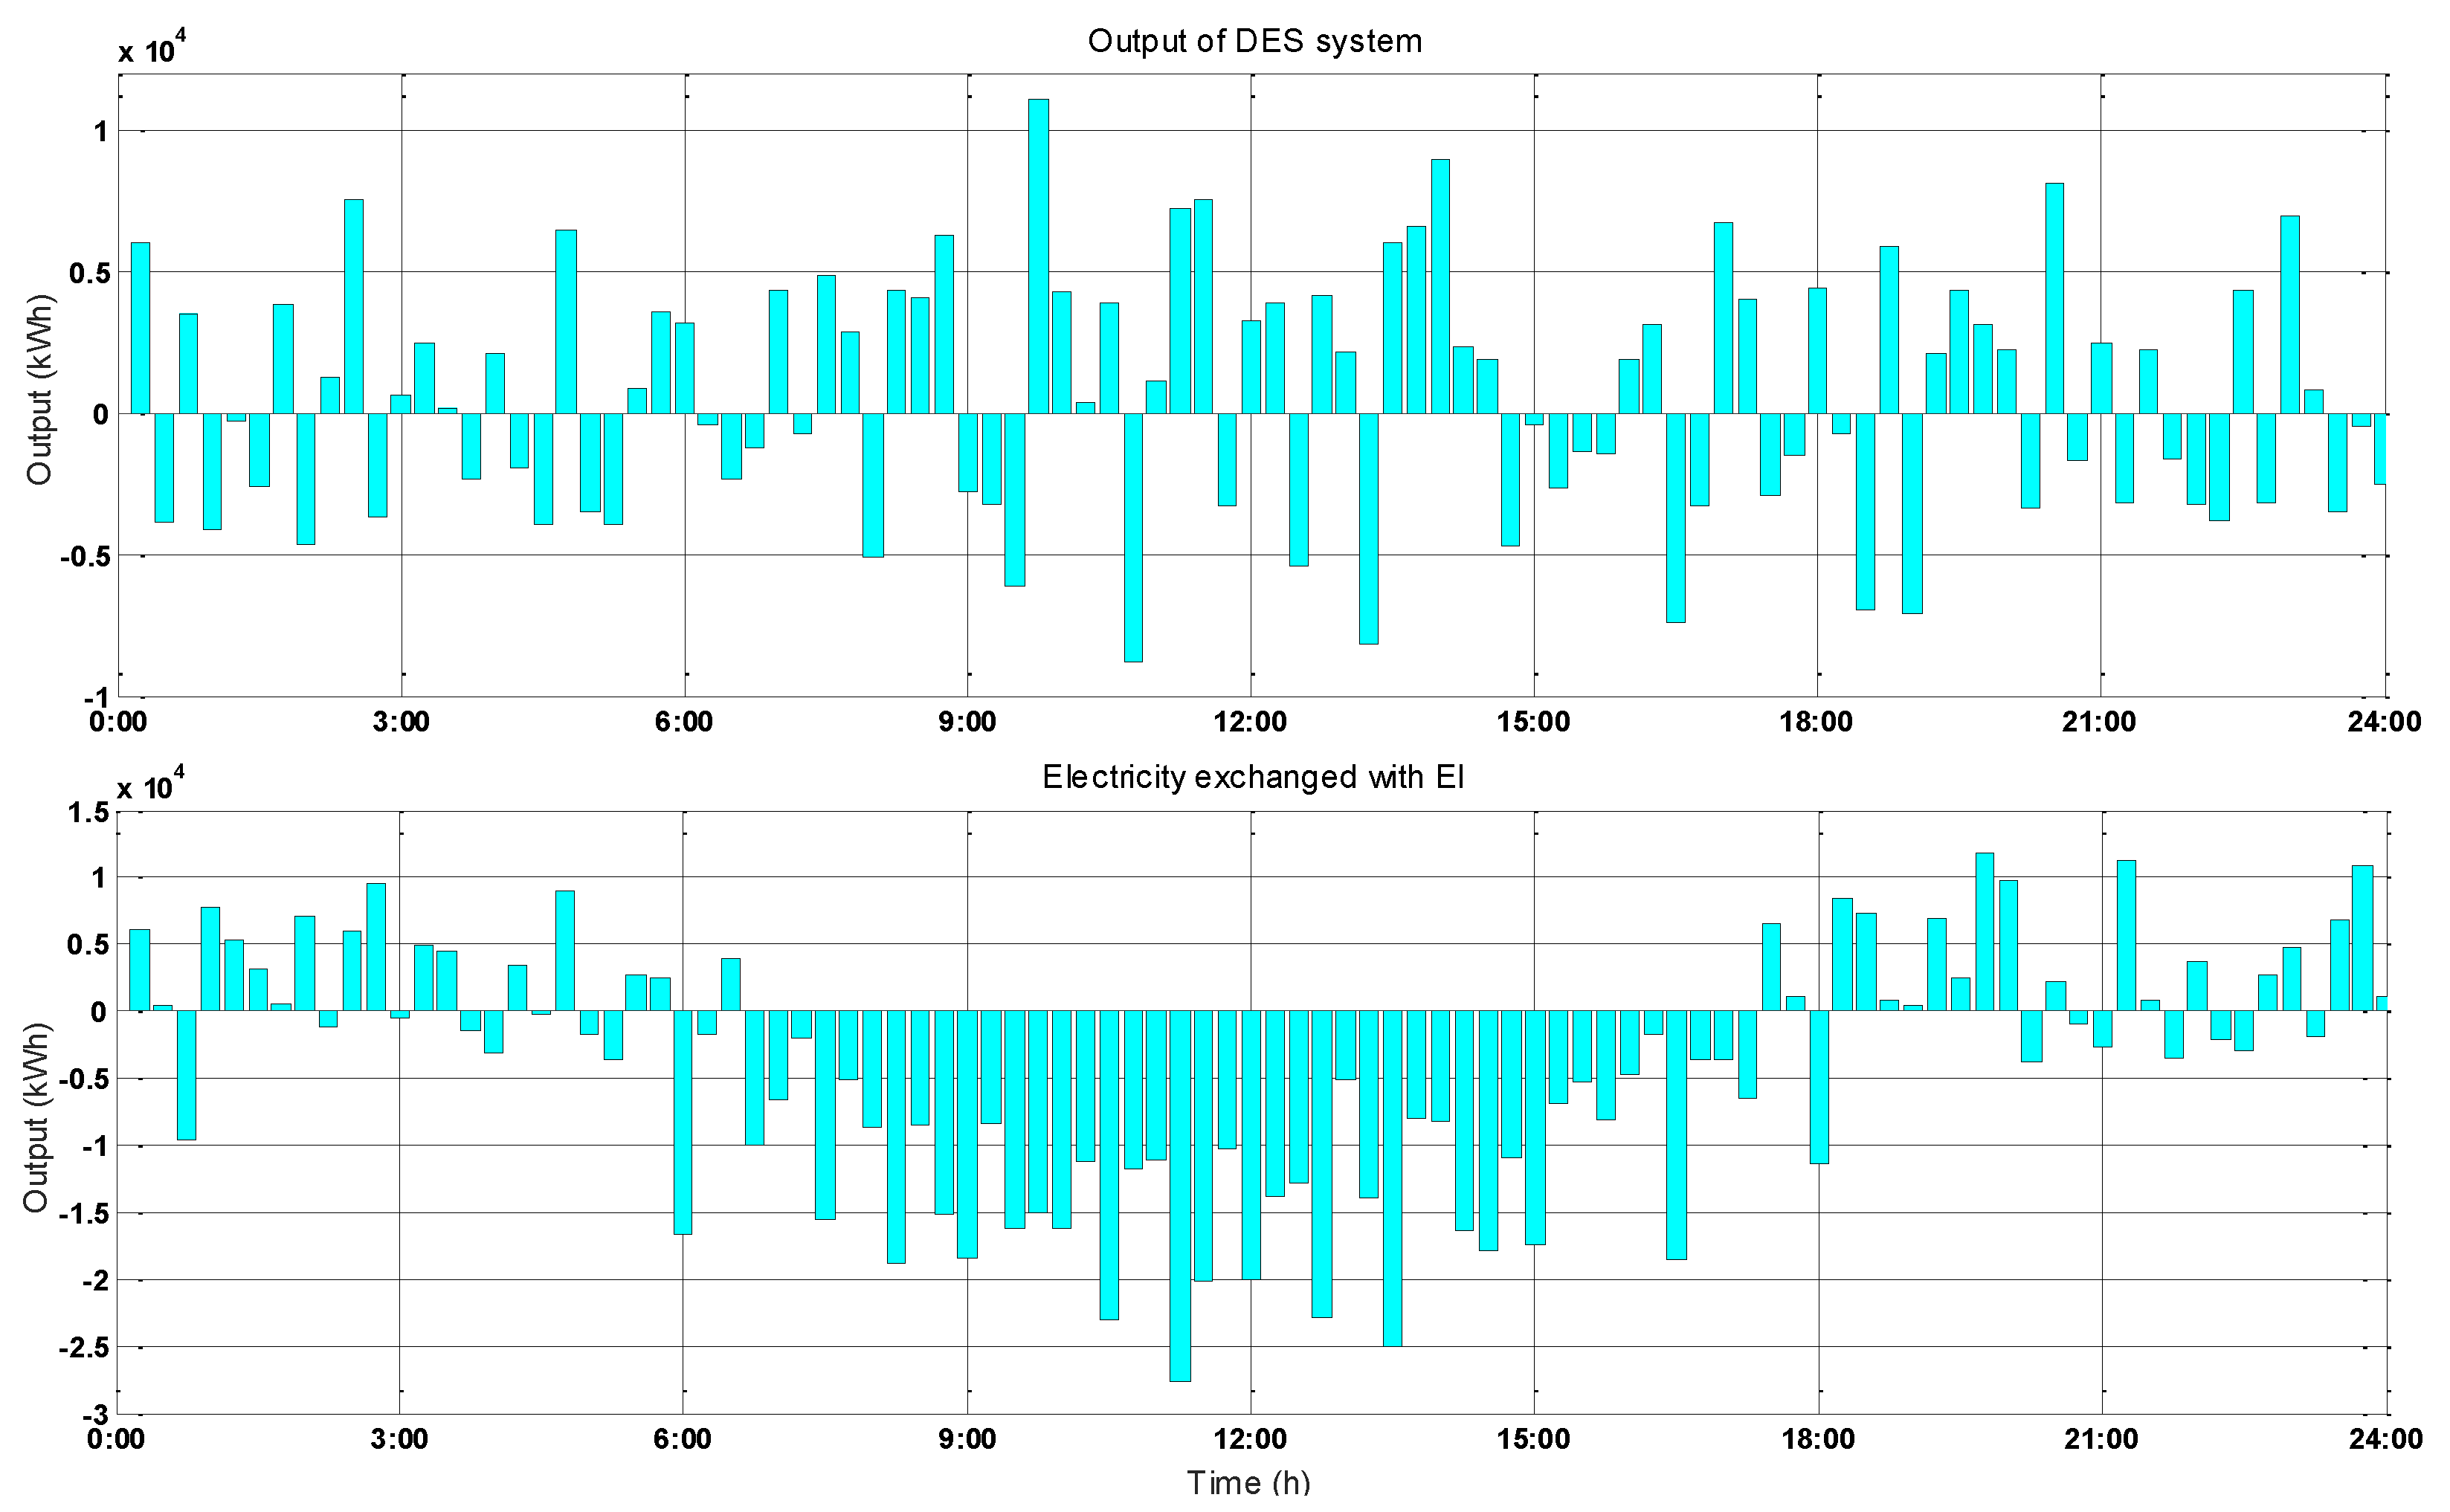
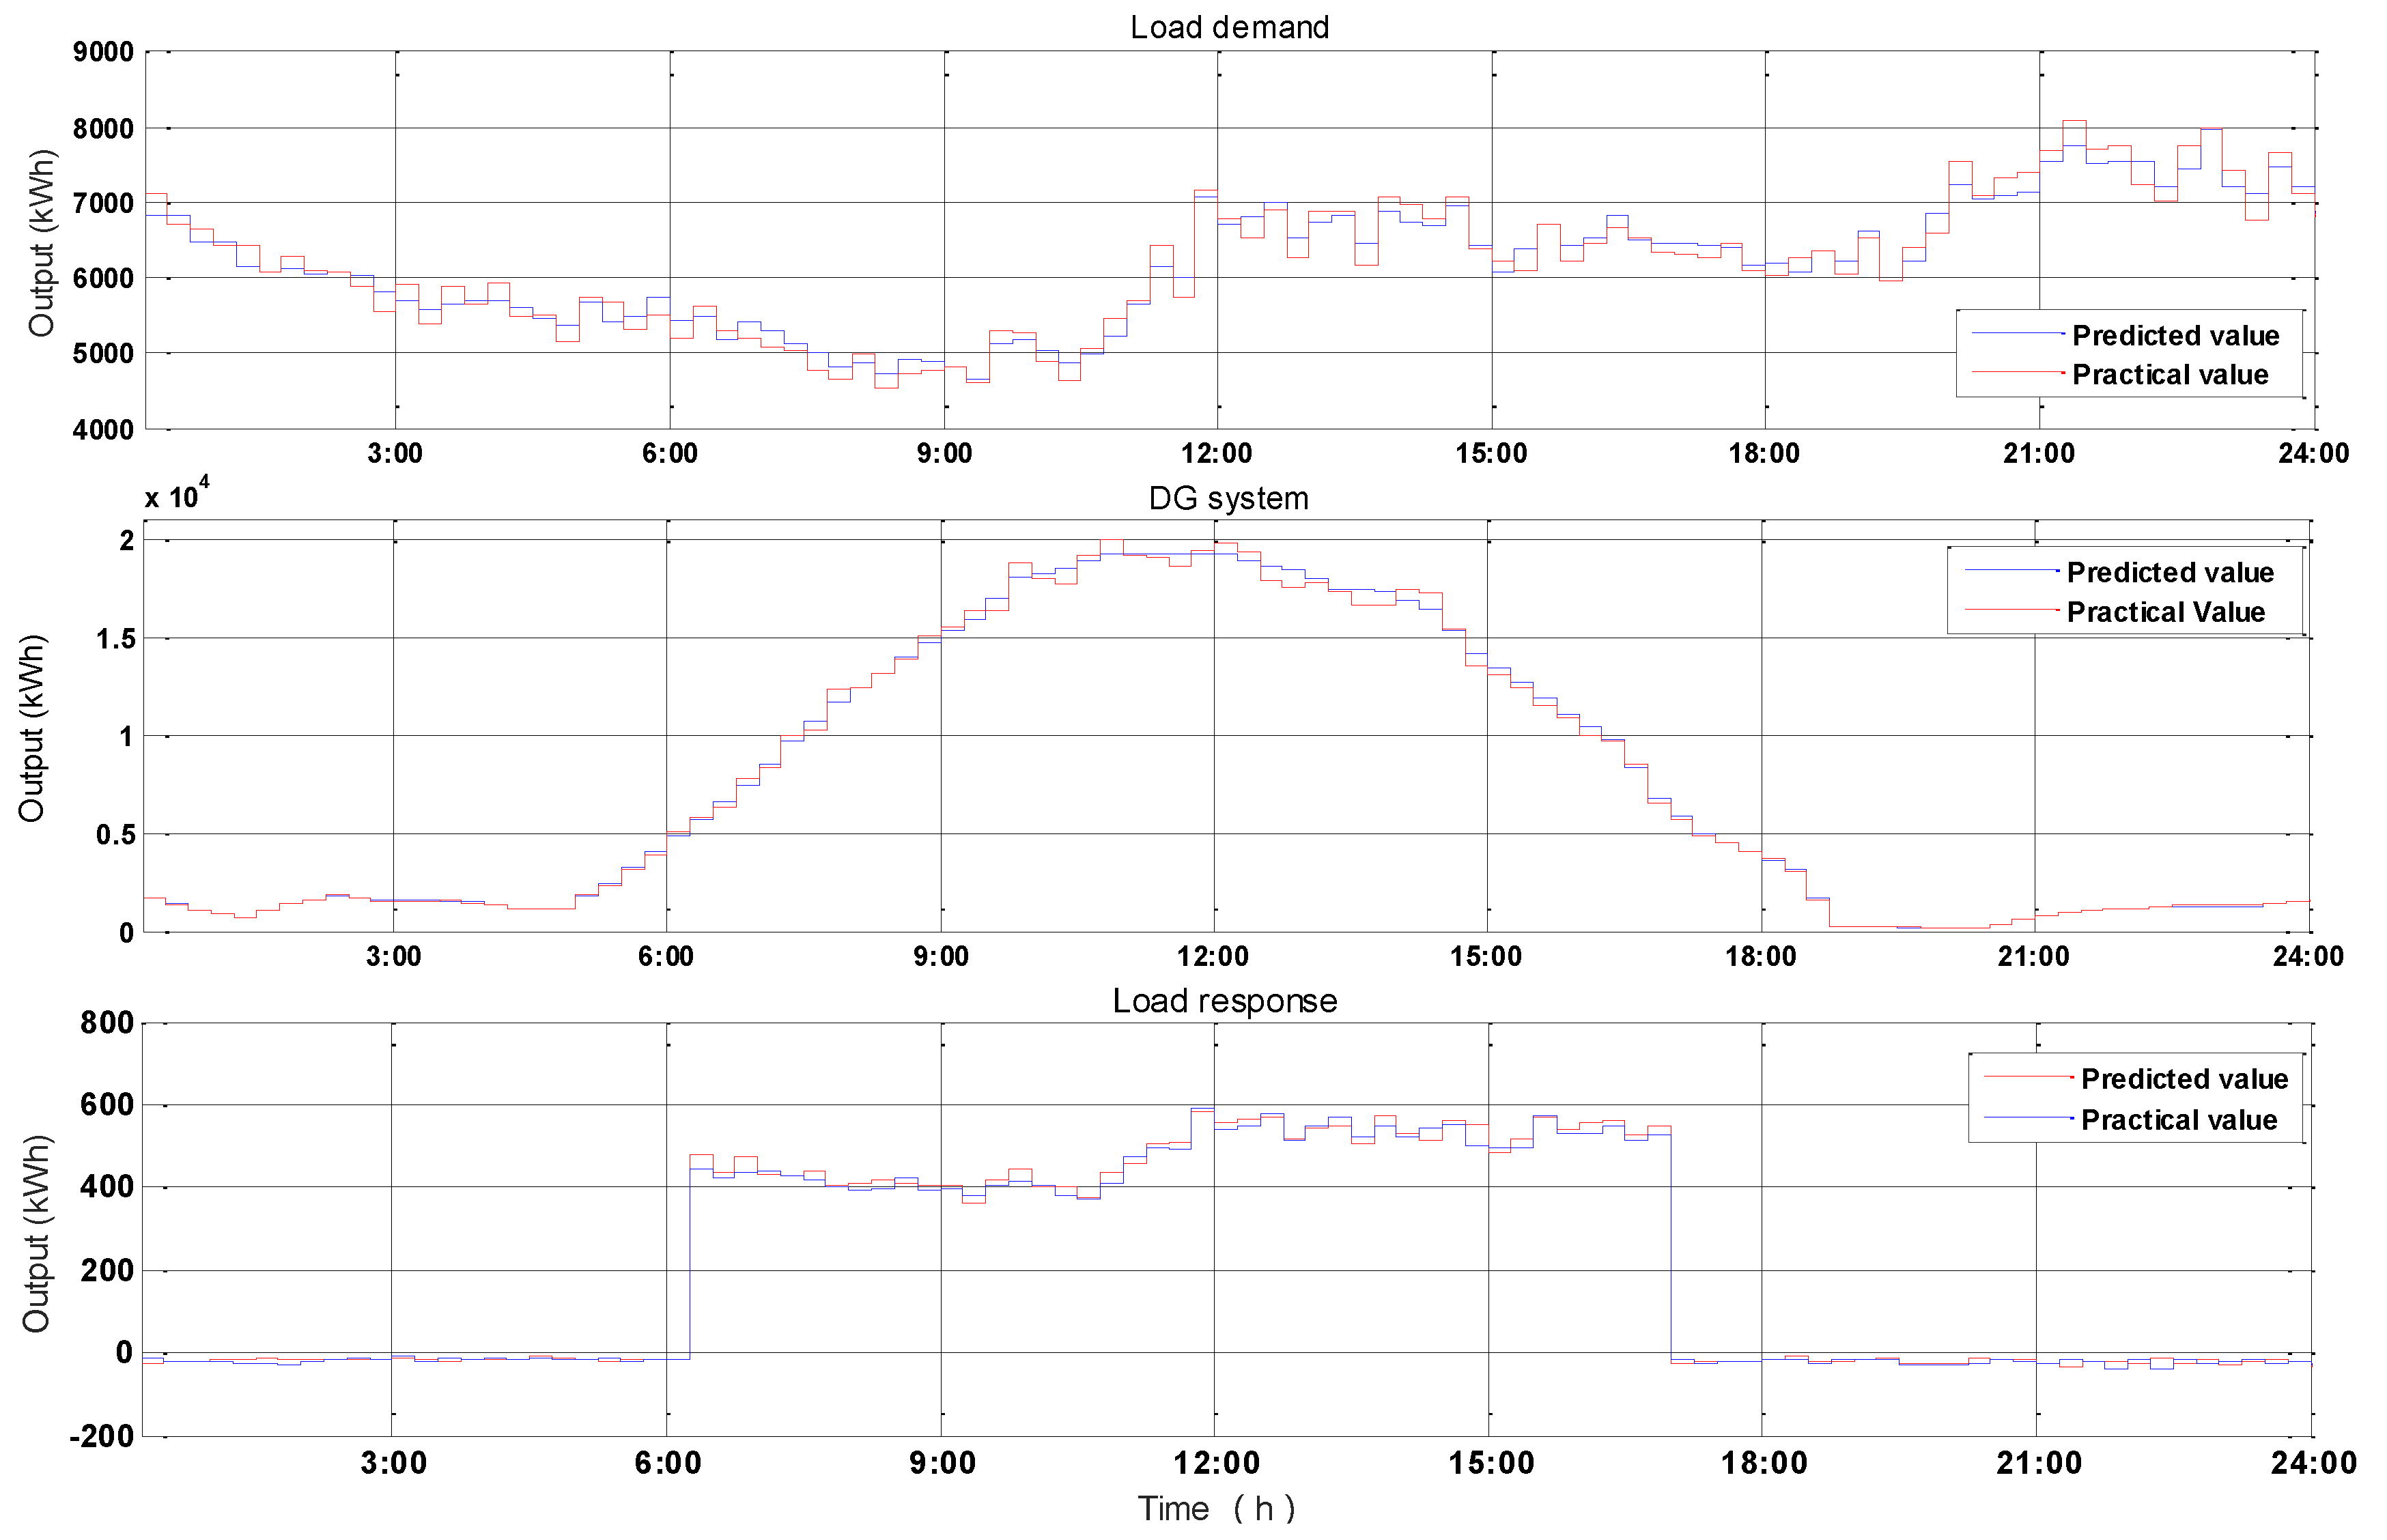
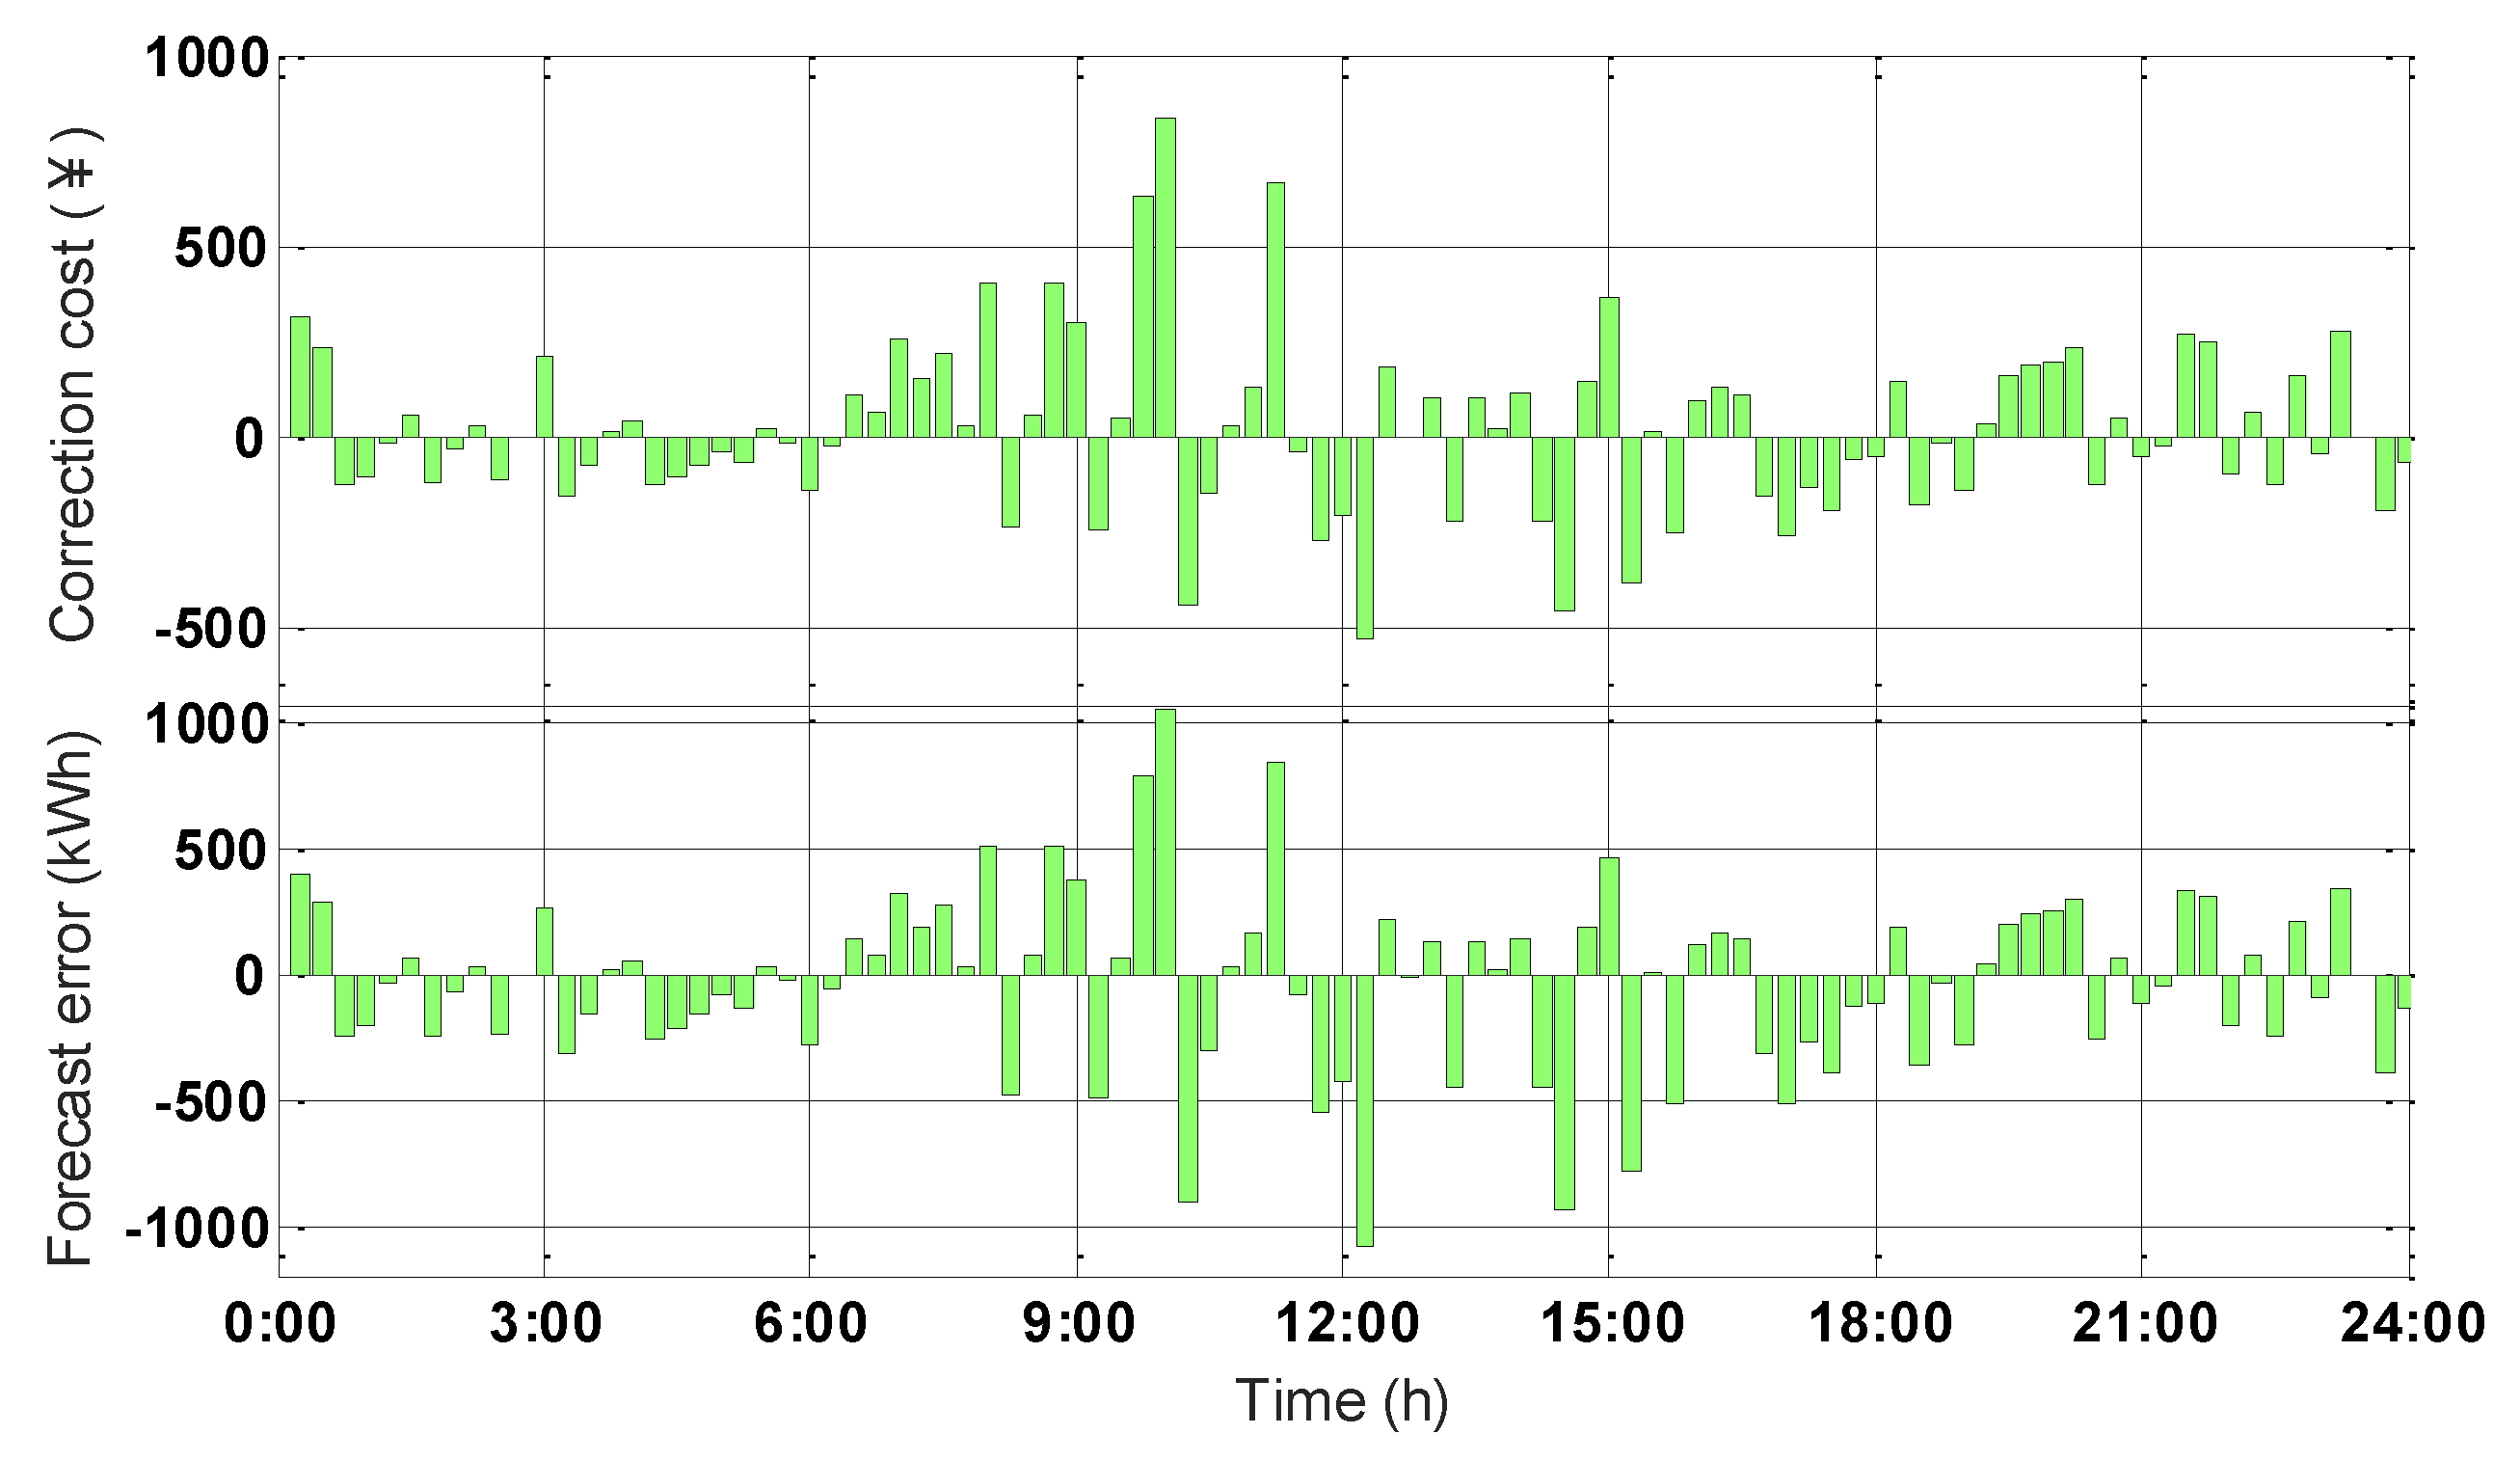
4.3. Online Local Optimization Results and Analysis

Considering that there is a forecast error during the practical operation, the online local optimization is needed in each time interval. This paper takes Scenario One as an example, the optimal results of which are given in Section 4.2. In Scenario One, all of the subsystems, including DG system, DES system, and LR system, are considered in day-ahead global optimization. The results are used during the practical operation, and the errors are corrected by electricity exchanging with the EI. The curves of the actual and forecast daily load demands, response load, and power output by DG system are shown in Figure 12, respectively.
According to Figure 12, the correction costs and the forecast errors during each time interval can be obtained, which are shown in Figure 13 below.
In addition, the global optimal results in Scenario Four are utilized here for online local optimization, taking into account the DES system and LR system in the practical operation. As only DG system in Scenario Four is considered in the day-ahead scheduling, which is based on the forecast data, the global optimization can be seen as “invalid”. Therefore, only the online local optimization process is considered in Scenario Four. The results are shown in Table 2, in which the results in Scenario One are provided for comparison. To compare the results obtained by the global optimization and two-step optimization framework, a new scenario—Scenario Five—is introduced, in which only the online local optimization is used in every time interval, and the objective function and constraints are similar to those in Section 3.1 (but only for one time interval).
In Scenario One, all of the subsystems are taken into account during the global optimization process. Therefore, in the online local optimization process, the forecast power errors of the DG system, the LR system, and the load demand can only be removed by the electricity exchanged with EI. The total forecast error in Figure 13 can be calculated by adding up all the forecast errors in Figure 12. The correction cost includes the cost variation of the DG system, the LR system, and the electricity exchanged with EI. Since all the subsystems are considered in the day-ahead global optimization, the online optimization process only adjusts the value of the electricity exchanged with EI to eliminate the forecast power errors. Therefore, the value of the correction cost is fixed, as shown in Table 2.
In Scenario Four, the DES system and the electricity exchanged with the EI are combined to correct the forecast errors in the online local optimization process, which means the results are related to DES system. Moreover, the energy storage capacity of DES system can increase the utilization of the DGs and the correction cost may be negative, which can be seen in Table 2. That is to say, ELAN may make a profit by DES system during the online local optimization process. Interestingly, it can be seen that the difference between the average and best correction cost is relatively large (¥1400.7), and the best total income obtained is the same as that in Scenario One. This is because, in Scenario Four, two initialization strategies are applied for PSO algorithms and each one is used 5 times. In Strategy One, the solutions are generated using the corresponding value of the variables of the optimum solution obtained by the global optimization method in Scenario One, and the final correction cost is ¥−4421.8. In Strategy Two, the solutions are generated randomly, and the final correction cost is worse than the former. This indicates that it is possible for the online local optimization to reach higher total income with the prior knowledge obtained by day-ahead global optimization.
In Scenario Five, the traditional online local optimization method is used. The average and best correction cost is obviously lower than that with the above methods. It is known that online local optimization method is used for only one time interval. Hence, it cannot consider the total income of ELAN globally. For example, the charge/discharge strategy of the DES system is obviously affected by the optimization methods. Let us suppose that the DES system can be fully discharged in time interval 2 to obtain the global maximum income. However, in time interval 1, the online local optimization method can only obtain the local optimum solution by the current and past information. Maybe the solution tells EMS that the DES system should be fully discharged to obtain the maximum income in time interval 1. However, the DES system cannot be discharged any more in this way due to the SOC constraints (Inequality (12)), which means the total income cannot reach the global optimum.
In Table 2, the total income by global optimization is ¥75,390.2, and the total income by local optimization is ¥71,942.4. The results are obtained by traditional scheduling approaches. It is clear that the globally optimized income is the highest but may not be reached due to the forecast errors. On the other hand, the online local optimization seems more reasonable, since the data used are much closer to the true values. However, as the analysis in Scenario Five, this method can get a local optimum solution which may not consider the effects in the future. Comparing with the two methods, the proposed two-step optimization framework solves the problem by using the prior knowledge obtained through day-ahead global optimization during the online local optimization. According to the conclusion in Scenario Four, the globally optimized income is important for the local optimization, and the output of each subsystem can reduce the correction cost evidently.

5. Conclusions

In this paper, a two-step optimization framework based on global and online models is proposed for solving ELAN-EMS scheduling problems, considering the application of VES systems. A global optimization model based on forecast data is built to maximize the income of the ELAN. Meanwhile, a series of typical constraints concerning the DGs, the EVs, and the load response are described. In addition, an online local optimization model is introduced to minimize the local correction cost during the practical operation. To solve this complex optimization problem with large numbers of constraints, intelligent algorithms are suggested. Thereafter, the proposed two-step optimization framework is applied to several practical ELAN scheduling problems. The global optimization results of day-ahead scheduling are obtained by PSO. Based on the forecast errors, the online local correction costs are calculated in Scenario One and Four during the practical operation, utilizing the prior knowledge obtained by day-ahead global optimization. The total incomes in different scenarios are compared, and the results indicate that the DES systems can improve the economic efficiency of the ELAN. Besides, the final income is improved by applying the day-ahead global optimization model to maximize the income of the ELAN and the online local optimization model to minimize the forecast errors.
It can be seen from this paper that the ELAN’s capacity for renewable energy utilization is evidently enhanced, and the income is improved, by introducing the DES systems. However, there is a contradiction between the traditional day-ahead global optimization strategies and the online local optimization strategies in the scheduling problems when DES systems are applied in an ELAN. Therefore, this paper presents a two-step optimization framework based on the optimum results obtained by global optimization, as well as taking account of the accuracy of online local optimization methods. The final optimized income is between the results by single global optimization and single online local optimization approaches, which can be seen as a tradeoff. This paper only uses a global PSO algorithm, which may not adapt to more complicated models and meet the time limits. More research in designing efficient algorithms for the two-step optimization problems will be done in future.

Author Contributions

X.L. designed the two-step optimization framework; X.Z. collected the data and built the models; Y.F. contributed to the application and provided helpful advice. X.L. wrote the paper and Y.F. reviewed and edited the paper.

Funding

This work was supported by the National Natural Science Foundation of China (Grant No. 51709215); by the Fundamental Research Funds for the Central Universities (WUT: 2018IVA053 and 2662018QD057).

Conflicts of Interest

The authors declare no conflict of interest.

Nomenclature

Abbreviations
RErenewable energy
EIenergy internet
ELANenergy local area network
EMSenergy management system
VESvirtual energy storage
LRload response
DESdistributed energy storage
Mathematical symbols
C D G power generation cost of the DGs by forecast data (¥)
C L R load response cost by day-ahead scheduling (¥)
C D E S cost of the DES systems by day-ahead scheduling (¥)
C e x c h a n g e d cost of the exchanged electricity with EI by day-ahead scheduling (¥)
C W T , i ( t ) / C P V , j ( t ) cost of the i-th WT/j-th PV during time interval t by forecast data (kWh)
W/Pnumber of WTs/PVs
K W T , i / K P V , j maintenance cost coefficient of the i-th WT/j-th PV (¥/kWh)
P W T , i ( t ) / P P V , j ( t ) power output of the i-th WT/j-th PV during time interval t by forecast data (kWh)
Ttotal number of the time intervals
M/Ntotal number of the consumers in LR system/the regions where there are EVs in VES system
T a r i f f t o c o n s electricity tariff sold to consumers (¥/kWh)
Δ T a r i f f t o c o n s adjusting value of electricity tariff sold to consumers (¥/kWh)
L R m ( t ) load of the consumers during time interval t (kWh)
Δ L R m ( t ) electric quantity of the consumers’ load response during time interval t (kWh)
εprice elasticity coefficient
L R m , 0 ( t ) minimum load of the consumers during time interval t according to statistics (kWh)
βr,m(t)probability of the consumers’ response to the load during time interval t
C E V , n ( t ) cost of EVs’ charging/discharging in the n-th region during time interval t (¥)
C b a t t e r y cost of the batteries by day-ahead scheduling (¥)
P E V charged/discharged power rating of the charging points (kW)
Ltotal number of the EVs in VES system
Δ P L R ( t ) variation of load response during time interval t (kW)
DGdistributed generator
PVphotovoltaic
WTwind turbine
EVelectric vehicle
DERdistributed energy resource
SOCstate of charge
PSOparticle swarm optimization
P L R ( t ) power of the consumers’ load response during time interval t (kW)
P e x c h a n g e d ( t ) power exchanged with EI during time interval t (kW)
P D G ( t ) output power of the DGs during time interval t (kW)
P D E S ( t ) input/output power of the DES systems during time interval t (kW)
P k , m i n ( t ) / P k , m a x ( t ) minimum/maximum power output of the k-th device during time interval t (kW)
S O C m i n / S O C m a x minimum/maximum amount of stored energy inside the DES (Ah)
W j , i remaining battery capacity of the j-th EV in the i-th region (Ah)
W j , i 0 minimum daily electricity consumption of the j-th EV in the i-th region (Ah)
S E V , l remaining battery capacity of the l-th EV (Ah)
S E V , l , r rated battery capacity of the l-th EV (Ah)
τtotal time during which the EV stays in the residential area (h)
τ0time the EV has spent in the residential area (h)
T a r i f f f r o m E I tariff of the electricity purchased from EI (¥/kWh)
T a r i f f t o E I tariff of the electricity sold to EI (¥/kWh)
Δ p adjusting value of electricity tariff (¥/kWh)
Δ C D G ( t ) adjusting value of power generation cost of the DGs during time interval t (¥)
Δ C L R ( t ) adjusting value of load response cost during time interval t (¥)
Δ C e x c h a n g e d ( t ) adjusting value of cost of the exchanged electricity with EI during time interval t (¥)
Δ P D ( t ) total power variation during time interval t (kW)
Δ P D G ( t ) power variation of the DGs during time interval t (kW)
Δ P D G ( t ) variation of load demand during time interval t (kW)

References

  1. Sun, Q.; Han, R.; Zhang, H.; Zhou, J.; Guerrero, J.M. A multiagent-based consensus algorithm for distributed coordinated control of distributed generators in the energy internet. IEEE Trans. Smart Grid 2015, 6, 3006–3019. [Google Scholar] [CrossRef]
  2. Bai, H.; Miao, S.H.; Zhang, P.P.; Bai, Z. Reliability evaluation of a distribution network with microgrid based on a combined power generation system. Energies 2015, 8, 1216–1241. [Google Scholar] [CrossRef]
  3. Destek, M.A.; Aslan, A. Renewable and non-renewable energy consumption and economic growth in emerging economies: Evidence from bootstrap panel causality. Renew. Energy 2017, 111, 757–763. [Google Scholar] [CrossRef]
  4. Dragičević, T.; Lu, X.; Vasquez, J.C.; Guerrero, J.M. DC microgrids—Part I: A review of control strategies and stabilization techniques. IEEE Trans. Power Electron. 2016, 31, 4876–4891. [Google Scholar]
  5. Lai, J.; Lu, X.; Yu, X.; Yao, W.; Wen, J.; Cheng, S. Distributed Multi-DER Cooperative Control for Master-Slave-Organized Microgrid Networks with Limited Communication Bandwidth. IEEE Trans. Ind. Inform. 2018. [Google Scholar] [CrossRef]
  6. Tang, R.; Li, X.; Lai, J. A novel optimal energy-management strategy for a maritime hybrid energy system based on large-scale global optimization. Appl. Energy 2018, 228, 254–264. [Google Scholar] [CrossRef]
  7. Wang, R.; Wu, J.; Qian, Z.; Lin, Z.; He, X. A graph theory based energy routing algorithm in energy local area network. IEEE Trans. Ind. Inform. 2017, 13, 3275–3285. [Google Scholar] [CrossRef]
  8. Kouchachvili, L.; Yaïci, W.; Entchev, E. Hybrid battery/supercapacitor energy storage system for the electric vehicles. J. Power Sources 2018, 374, 237–248. [Google Scholar] [CrossRef]
  9. Erdinc, O. Economic impacts of small-scale own generating and storage units, and electric vehicles under different demand response strategies for smart households. Appl. Energy 2014, 126, 142–150. [Google Scholar] [CrossRef]
  10. Yi, P.; Zhu, T.; Jiang, B.; Jin, R.; Wang, B. Deploying Energy Routers in an Energy Internet Based on Electric Vehicles. IEEE Trans. Veh. Technol. 2016, 65, 4714–4725. [Google Scholar] [CrossRef]
  11. Weis, A.; Jaramillo, P.; Michalek, J. Estimating the potential of controlled plug-in hybrid electric vehicle charging to reduce operational and capacity expansion costs for electric power systems with high wind penetration. Appl. Energy 2014, 115, 190–204. [Google Scholar] [CrossRef]
  12. Jin, X.; Mu, Y.; Jia, H.; Wu, J.; Jiang, T.; Yu, X. Dynamic economic dispatch of a hybrid energy microgrid considering building based virtual energy storage system. Appl. Energy 2017, 194, 386–398. [Google Scholar] [CrossRef]
  13. Keirstead, J.; Jennings, M.; Sivakumar, A. A review of urban energy system models: Approaches, challenges and opportunities. Renew. Sustain. Energy Rev. 2012, 16, 3847–3866. [Google Scholar] [CrossRef] [Green Version]
  14. Shao, S.; Pipattanasomporn, M.; Rahman, S. Demand response as a load shaping tool in an intelligent grid with electric vehicles. IEEE Trans. Smart Grid 2011, 2, 624–631. [Google Scholar] [CrossRef]
  15. Lu, X.; Lai, J.; Yu, X.; Wang, Y.; Guerrero, J.M. Distributed coordination of islanded microgrid clusters using a two-layer intermittent communication network. IEEE Trans. Ind. Inform. 2018, 14, 3956–3969. [Google Scholar] [CrossRef]
  16. Coelho, V.N.; Coelho, I.M.; Coelho, B.N.; Cohen, M.W.; Reis, A.J.; Silva, S.M.; Guimarães, F.G. Multi-objective energy storage power dispatching using plug-in vehicles in a smart-microgrid. Renew. Energy 2016, 89, 730–742. [Google Scholar] [CrossRef] [Green Version]
  17. Erdogan, N.; Erden, F.; Kisacikoglu, M. A fast and efficient coordinated vehicle-to-grid discharging control scheme for peak shaving in power distribution system. J. Mod. Power Syst. Clean Energy 2018, 6, 555–566. [Google Scholar] [CrossRef] [Green Version]
  18. Abedini, M.; Moradi, M.H.; Hosseinian, S.M. Optimal management of microgrids including renewable energy scources using GPSO-GM algorithm. Renew. Energy 2016, 90, 430–439. [Google Scholar]
  19. Tani, A.; Camara, M.B.; Dakyo, B. Energy management in the decentralized generation systems based on renewable energy—Ultracapacitors and battery to compensate the wind/load power fluctuations. IEEE Trans. Ind. Appl. 2015, 51, 1817–1827. [Google Scholar] [CrossRef]
  20. Erdinc, O.; Taşcıkaraoğlu, A.; Paterakis, N.G.; Eren, Y.; Catalão, J.P. End-user comfort oriented day-ahead planning for responsive residential HVAC demand aggregation considering weather forecasts. IEEE Trans. Smart Grid 2017, 8, 362–372. [Google Scholar] [CrossRef]
  21. Kavousi-Fard, A.; Abunasri, A.; Zare, A.; Hoseinzadeh, R. Impact of plug-in hybrid electric vehicles charging demand on the optimal energy management of renewable micro-grids. Energy 2014, 78, 904–915. [Google Scholar] [CrossRef]
  22. Bashash, S.; Fathy, H.K. Transport-based load modeling and sliding mode control of plug-in electric vehicles for robust renewable power tracking. IEEE Trans. Smart Grid 2012, 3, 526–534. [Google Scholar] [CrossRef]
  23. Liu, H.; Ji, Y.; Zhuang, H.; Wu, H. Multi-objective dynamic economic dispatch of microgrid systems including vehicle-to-grid. Energies 2015, 8, 4476–4495. [Google Scholar] [CrossRef]
  24. Nefedov, E.; Sierla, S.; Vyatkin, V. Internet of energy approach for sustainable use of electric vehicles as energy storage of prosumer buildings. Energies 2018, 11, 2165. [Google Scholar] [CrossRef]
  25. Peng, C.; Zou, J.; Lian, L.; Li, L. An optimal dispatching strategy for V2G aggregator participating in supplementary frequency regulation considering EV driving demand and aggregator’s benefits. Appl. Energy 2017, 190, 591–599. [Google Scholar] [CrossRef]
  26. Aghajani, S.; Kalantar, M. Operational scheduling of electric vehicles parking lot integrated with renewable generation based on bilevel programming approach. Energy 2017, 139, 422–432. [Google Scholar] [CrossRef]
  27. Tang, R.; Wu, Z.; Li, X. Optimal operation of photovoltaic/battery/diesel/cold-ironing hybrid energy system for maritime application. Energy 2018, 162, 697–714. [Google Scholar] [CrossRef]
  28. Iacobucci, R.; McLellan, B.; Tezuka, T. The Synergies of Shared Autonomous Electric Vehicles with Renewable Energy in a Virtual Power Plant and Microgrid. Energies 2018, 11, 2016. [Google Scholar] [CrossRef]
  29. Li, L. Study of Economic Operation in Microgrid. Master’s Dissertation, North China Electric Power University, Beijing, China, 2011. [Google Scholar]
  30. Jin, X.; Mu, Y.; Jia, H. Optimal scheduling method for a combined cooling, heating and power building microgrid considering virtual storage system at demand side. Proc. CSEE 2017, 37, 581–591. [Google Scholar]
  31. He, Y.; Wang, B. Analysis on response characteristics of residential energy price in Beijing. Mod. Electron. Power 2013, 4, 88–94. [Google Scholar]
  32. Shi, W. Research on Lifespan Factors and Test Methods of Traction Lithium-Ion Batteries. Doctoral Dissertation, Beijing Jiaotong University, Beijing, China, 2014. [Google Scholar]
  33. Zhang, X.; Sun, Y.; Yu, J.; Duan, Q. The method of charging piles planning in parking lot. In Proceedings of the 2016 IEEE International Conference on Power System Technology, Wollongong, Australia, 28 September–1 October 2016; pp. 1–5. [Google Scholar]
Figure 1. Electricity exchange process of the energy local area network (ELAN).
Energies 12 00195 g001
Figure 2. The hierarchical control mode of the ELAN-EMS (energy management system).
Energies 12 00195 g002
Figure 3. The framework of ELAN-EMS.
Energies 12 00195 g003
Figure 4. Flowchart of the two-step optimization framework for scheduling problem based on ELAN-EMS.
Energies 12 00195 g004
Figure 5. The space-time distribution of electrical vehicles.
Energies 12 00195 g005
Figure 6. The consumers’ load demand curve in a typical day in the new town.
Energies 12 00195 g006
Figure 7. The forecast output curves of the DGs in the town.
Energies 12 00195 g007
Figure 8. The electricity exchanged with EI, the output power of the DES system, and the LR system in Scenario One.
Energies 12 00195 g008
Figure 9. The output power of the DES system and electricity exchanged with EI in Scenario Two.
Energies 12 00195 g009
Figure 10. The output power of the electricity exchanged with EI and LR system in Scenario Three.
Energies 12 00195 g010
Figure 11. The power exchange between ELAN and the grid in Scenario Four.
Energies 12 00195 g011
Figure 12. The curves of the actual and forecast daily load demands, response load, and power output by DG system.
Energies 12 00195 g012
Figure 13. The correction cost and forecast error in Scenario One by online local optimization.
Energies 12 00195 g013
Table 1. The income of the ELAN in different scenarios.
ScenariosIncome (¥)ScenariosIncome (¥)
Scenario One75,390.3Scenario Two71,130.8
Scenario Three51,636.1Scenario Four69,102.6
Table 2. The total income in in Scenario One, Four, and Five using the two-step optimization framework.
ScenariosIncome by Day-Ahead Global Optimization (¥)Correction Cost (¥)Total Income (¥)
BestBestAverageBestAverage
Scenario One75,390.21866.21866.273,523.873,523.8
Scenario Four69,102.4−4421.8−3021.173,523.872,123.2
Scenario Five---71,996.171,942.4

