Numerical Simulation Three-Dimensional Nonlinear Seepage in a Pumped-Storage Power Station: Case Study

Abstract
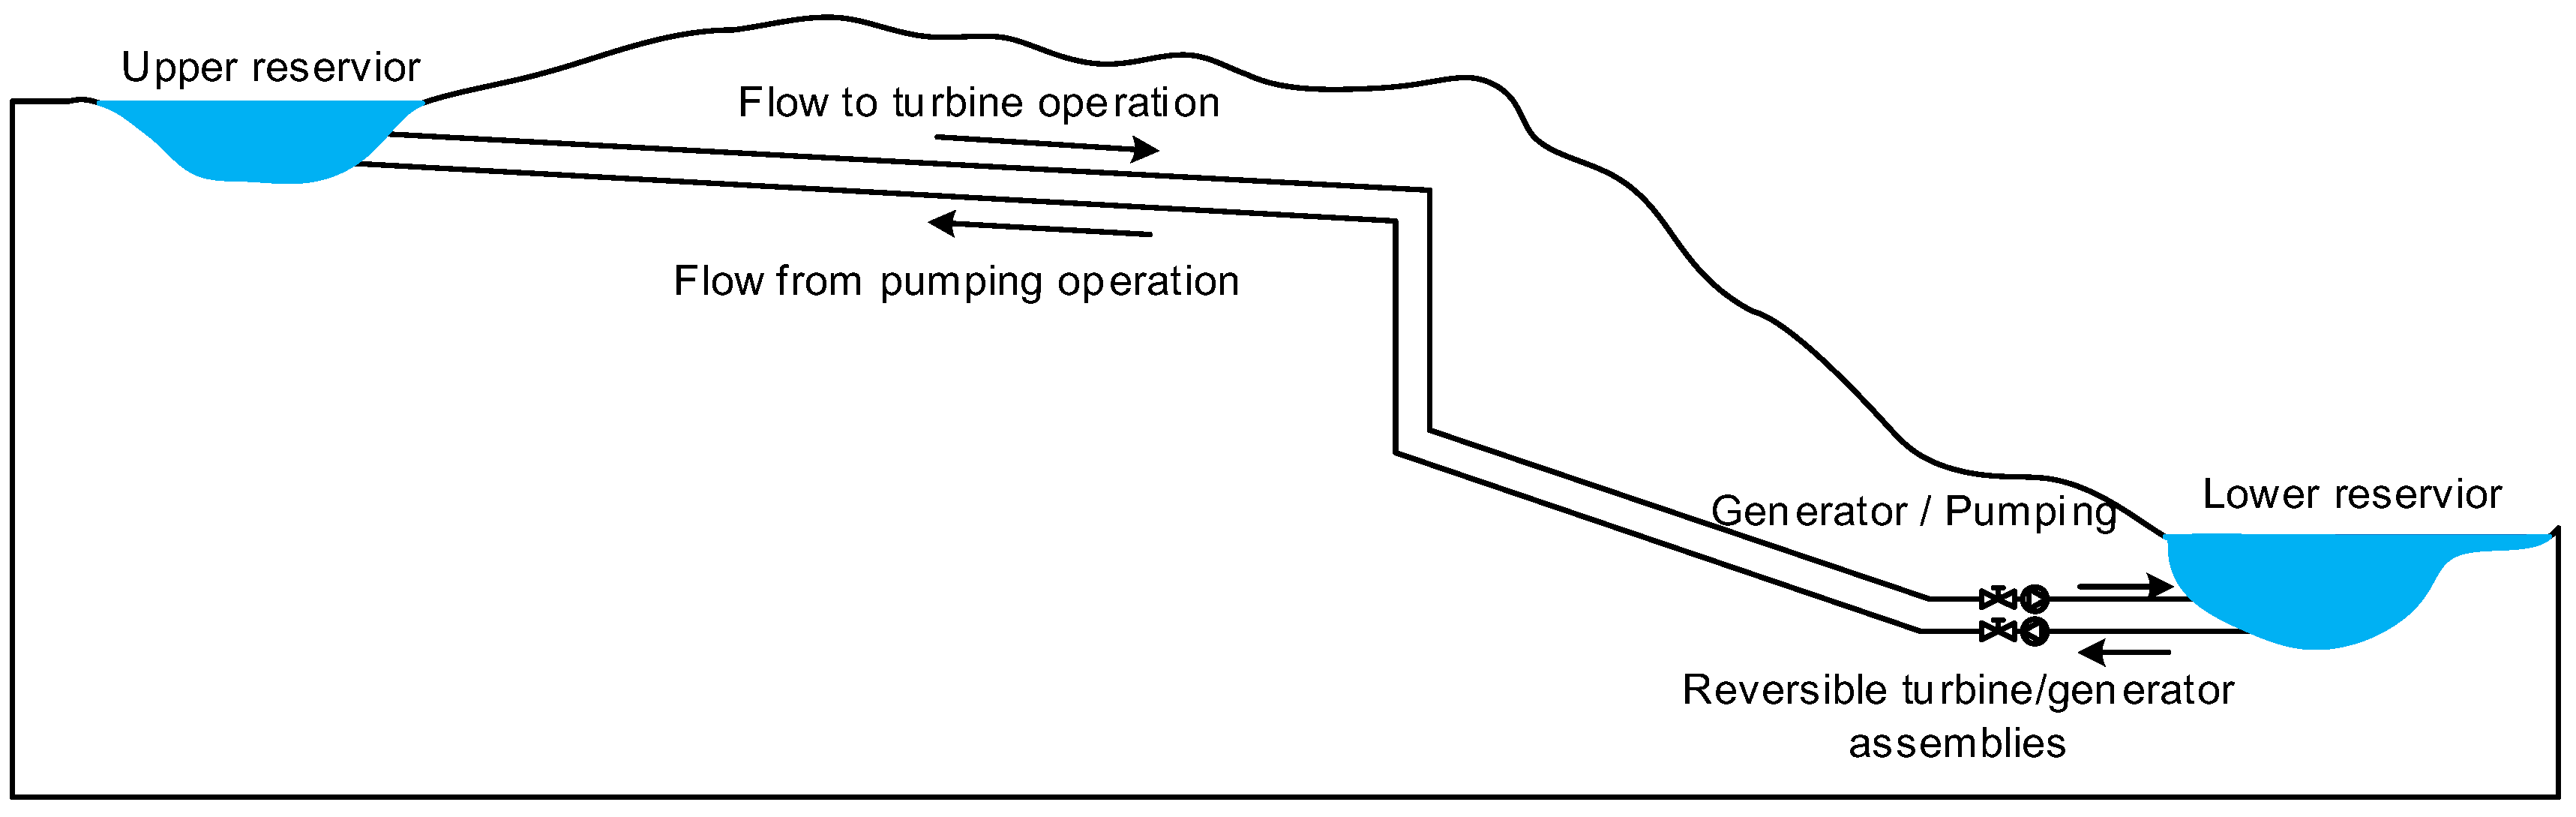
:1. Introduction
2. Establishment of Nonlinear Seepage Mathematical Model
2.1. Governing Equations
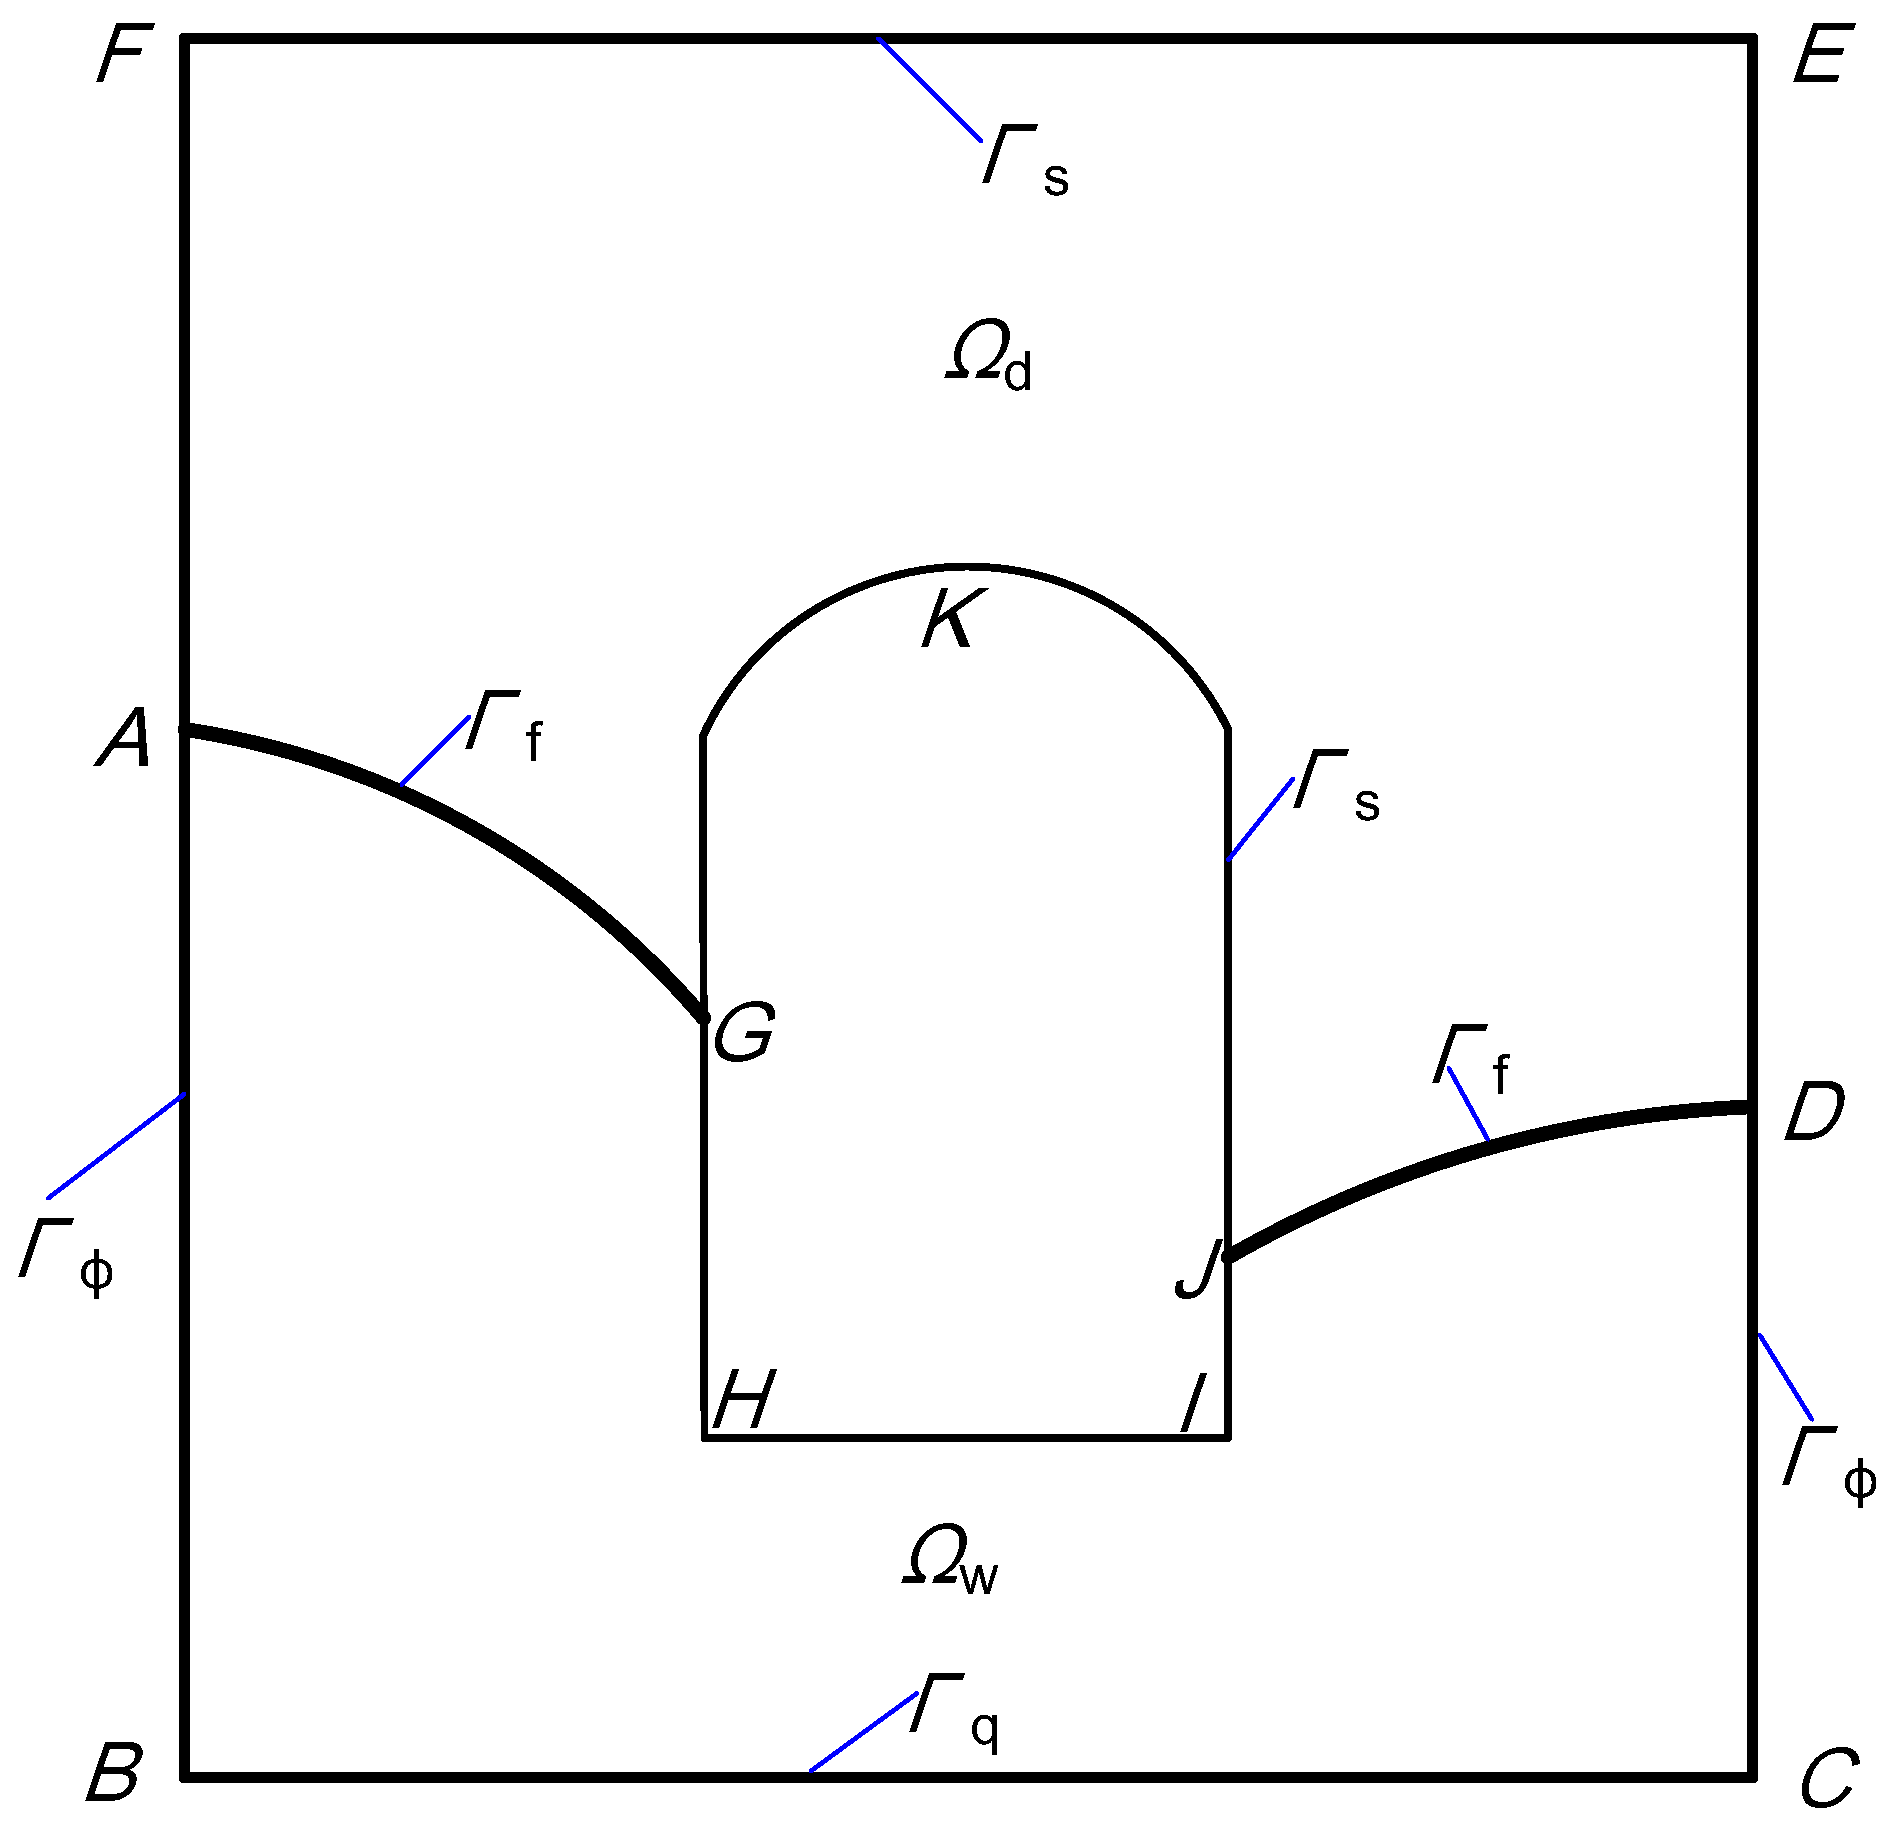
- The water head boundary conditionwhere is the prescribed water head on Γφ, is the total water head, z the vertical coordinate, p the pore water pressure, γw the unit weight of water.
- The flux boundary conditionwhere is the prescribed flux on Γq, and n the outward unit normal vector to the boundary. For an impermeable boundary, .
- The boundary condition of Signorini’s type on the seepage surfacewhere Γs is the potential seepage boundary. Obviously, on section GHIJ, φ = z and qn ≤ 0; while on sections AFED and GKJ, φ < z and qn = 0. φ = z and qn = 0 are satisfied at seepage points G and J.
- The boundary condition on the phreatic surfacewhere Γf ≡ {(x, y, z|φ = z)} is the phreatic surface, an interface between Ωw and Ωd.
2.2. Solution Procedure and Finite Element Numerical Methods
3. Site Characterization of the Yangjiang Pumped-Storage Power Station
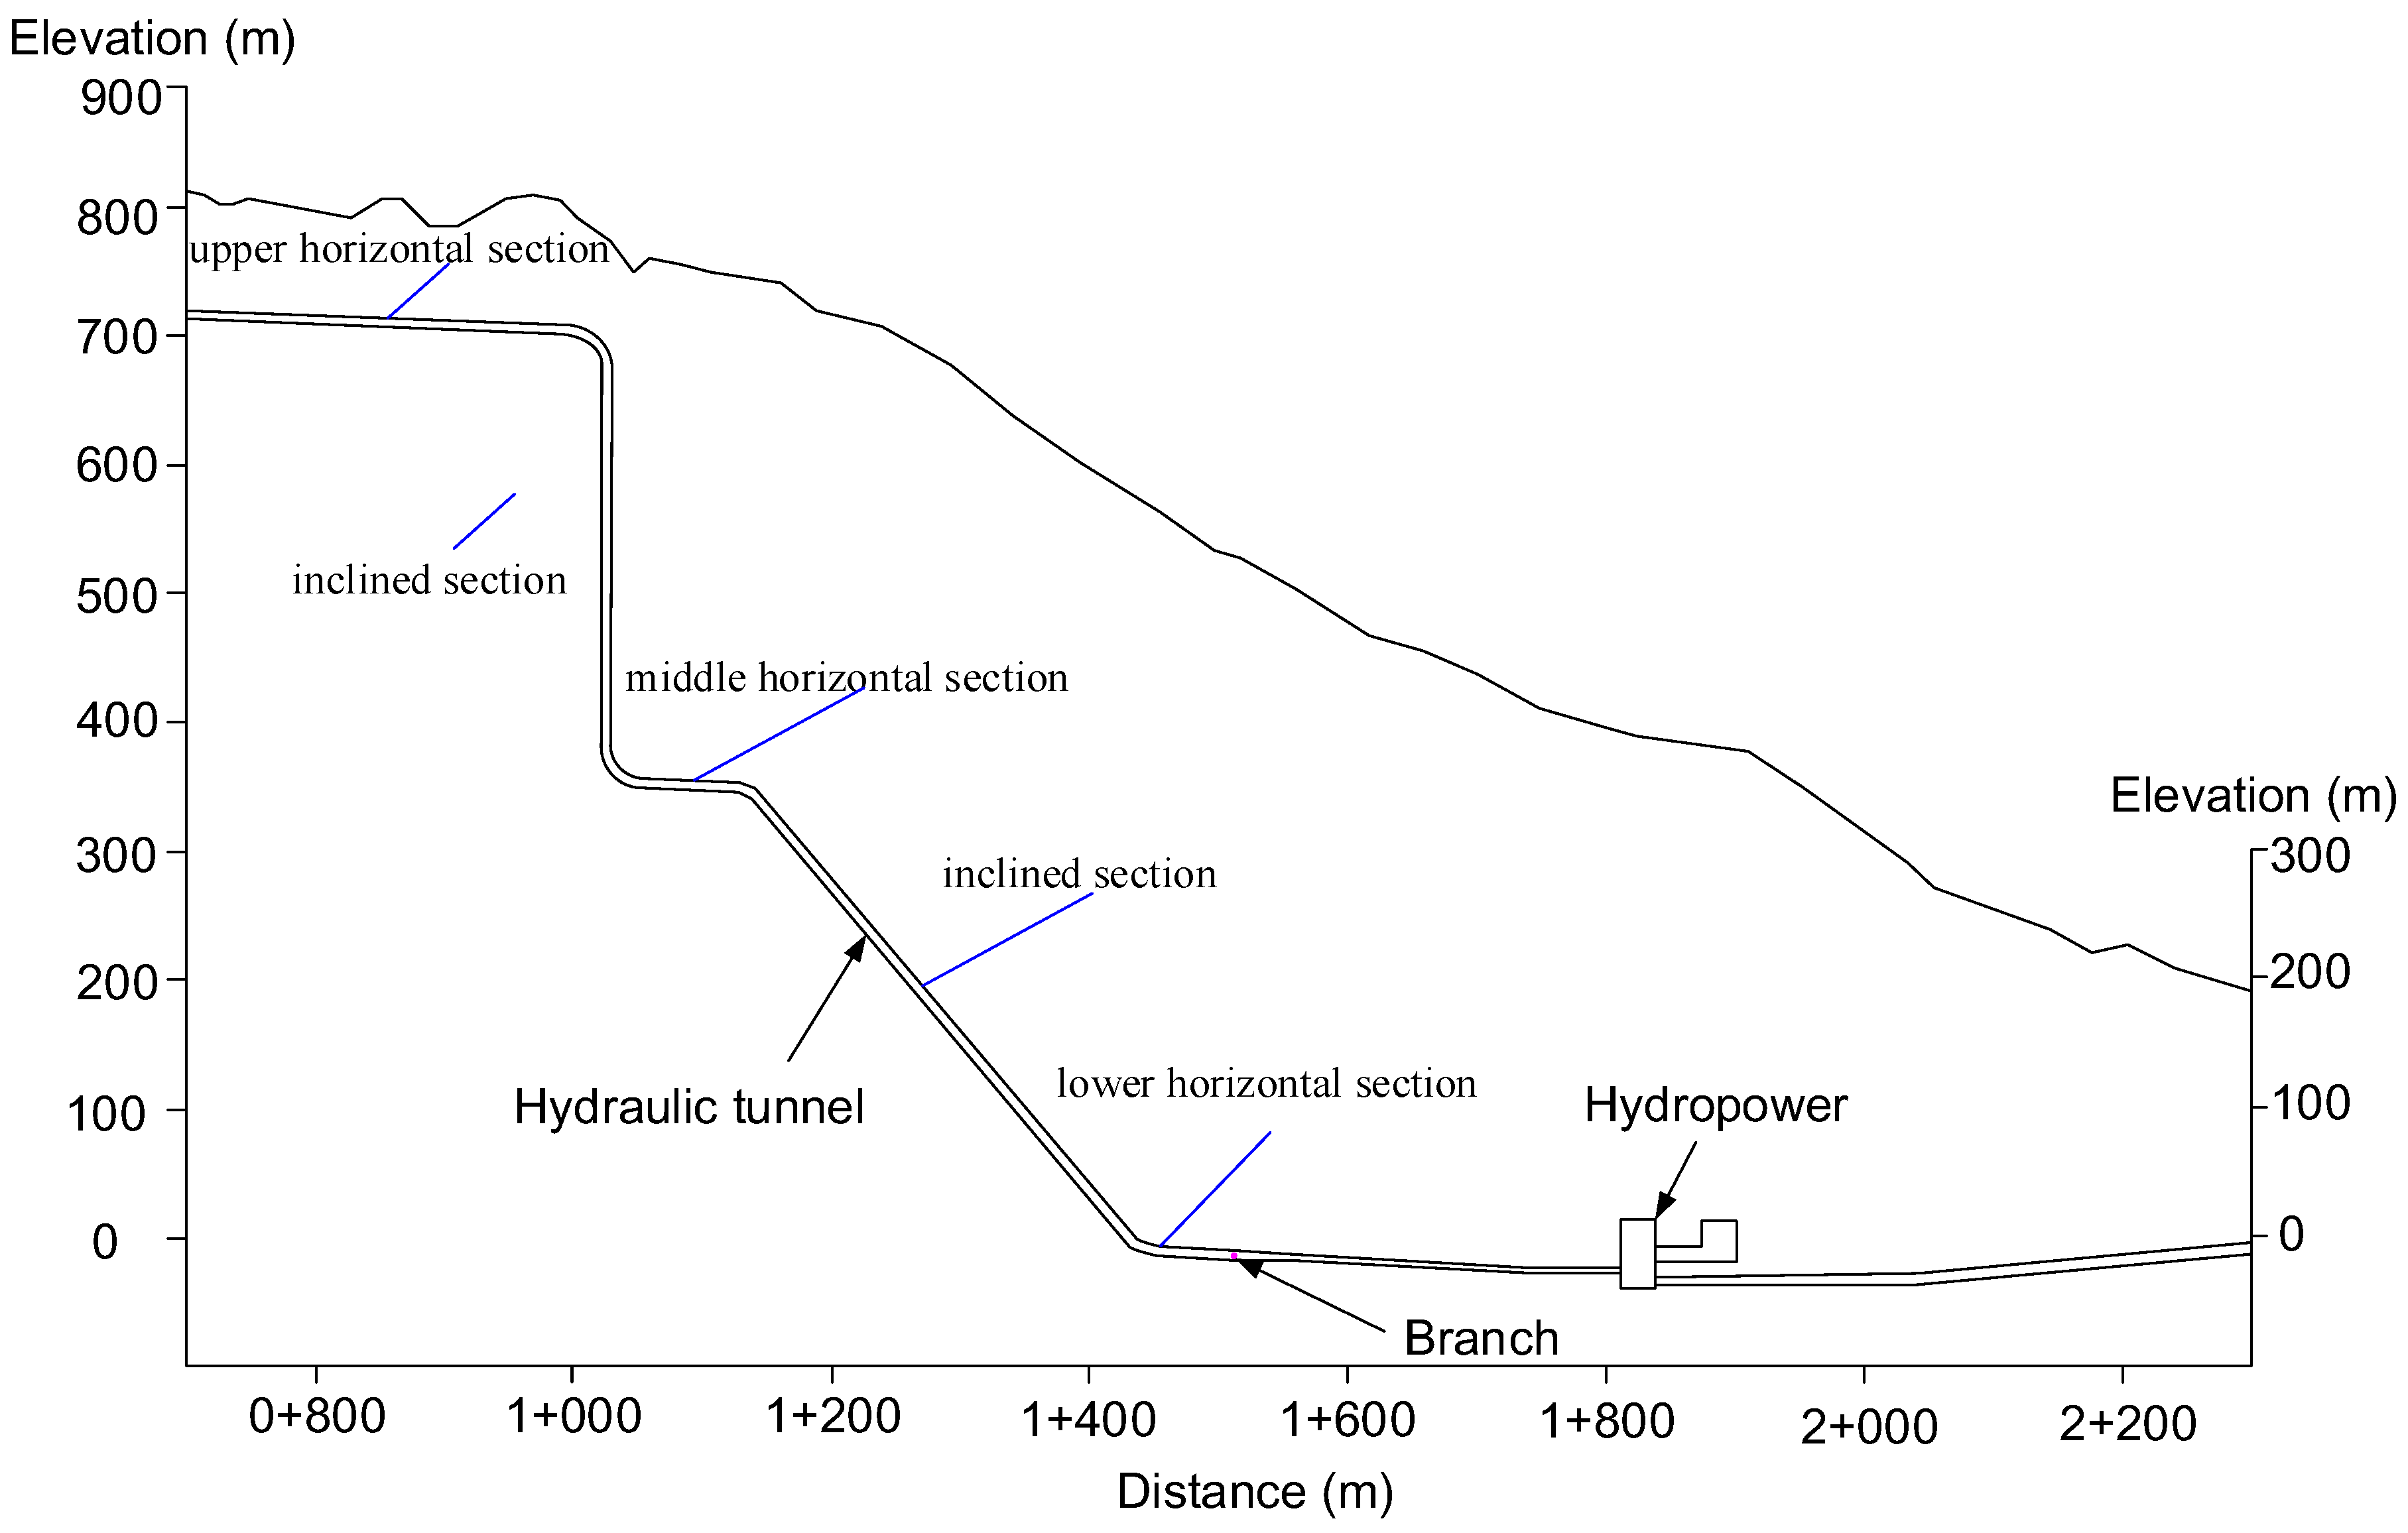
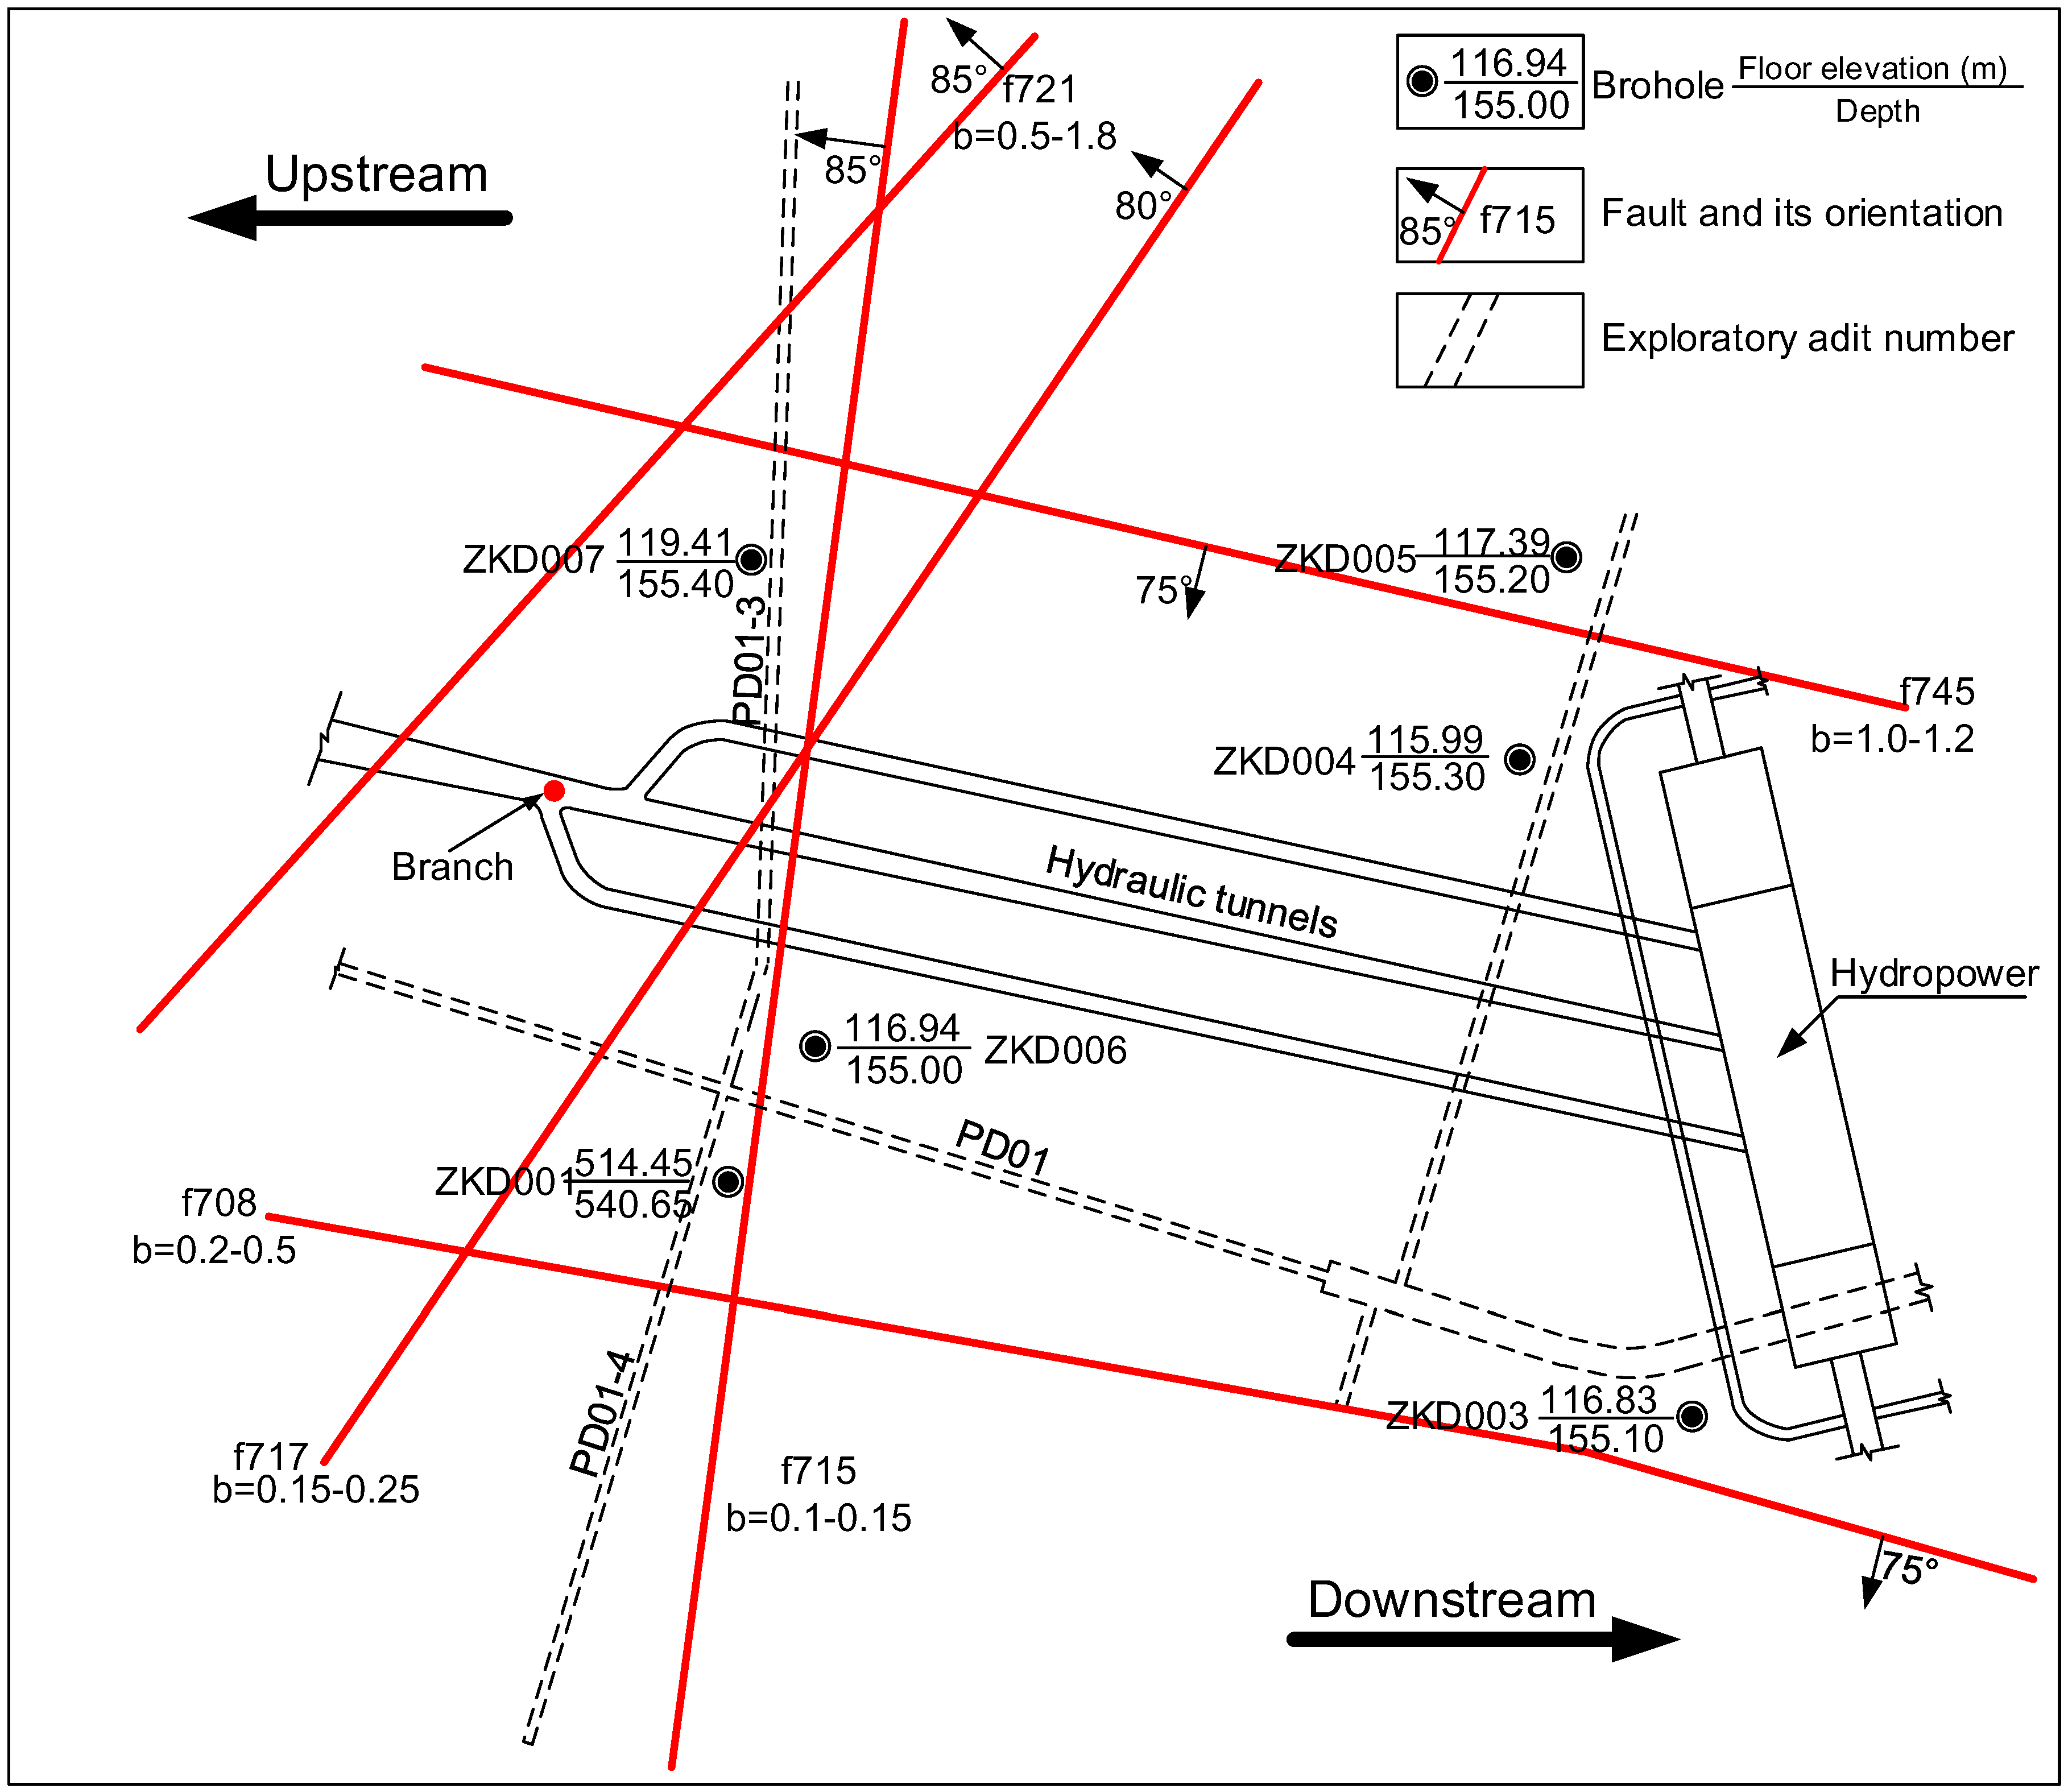
3.1. General Description and Geological Condition
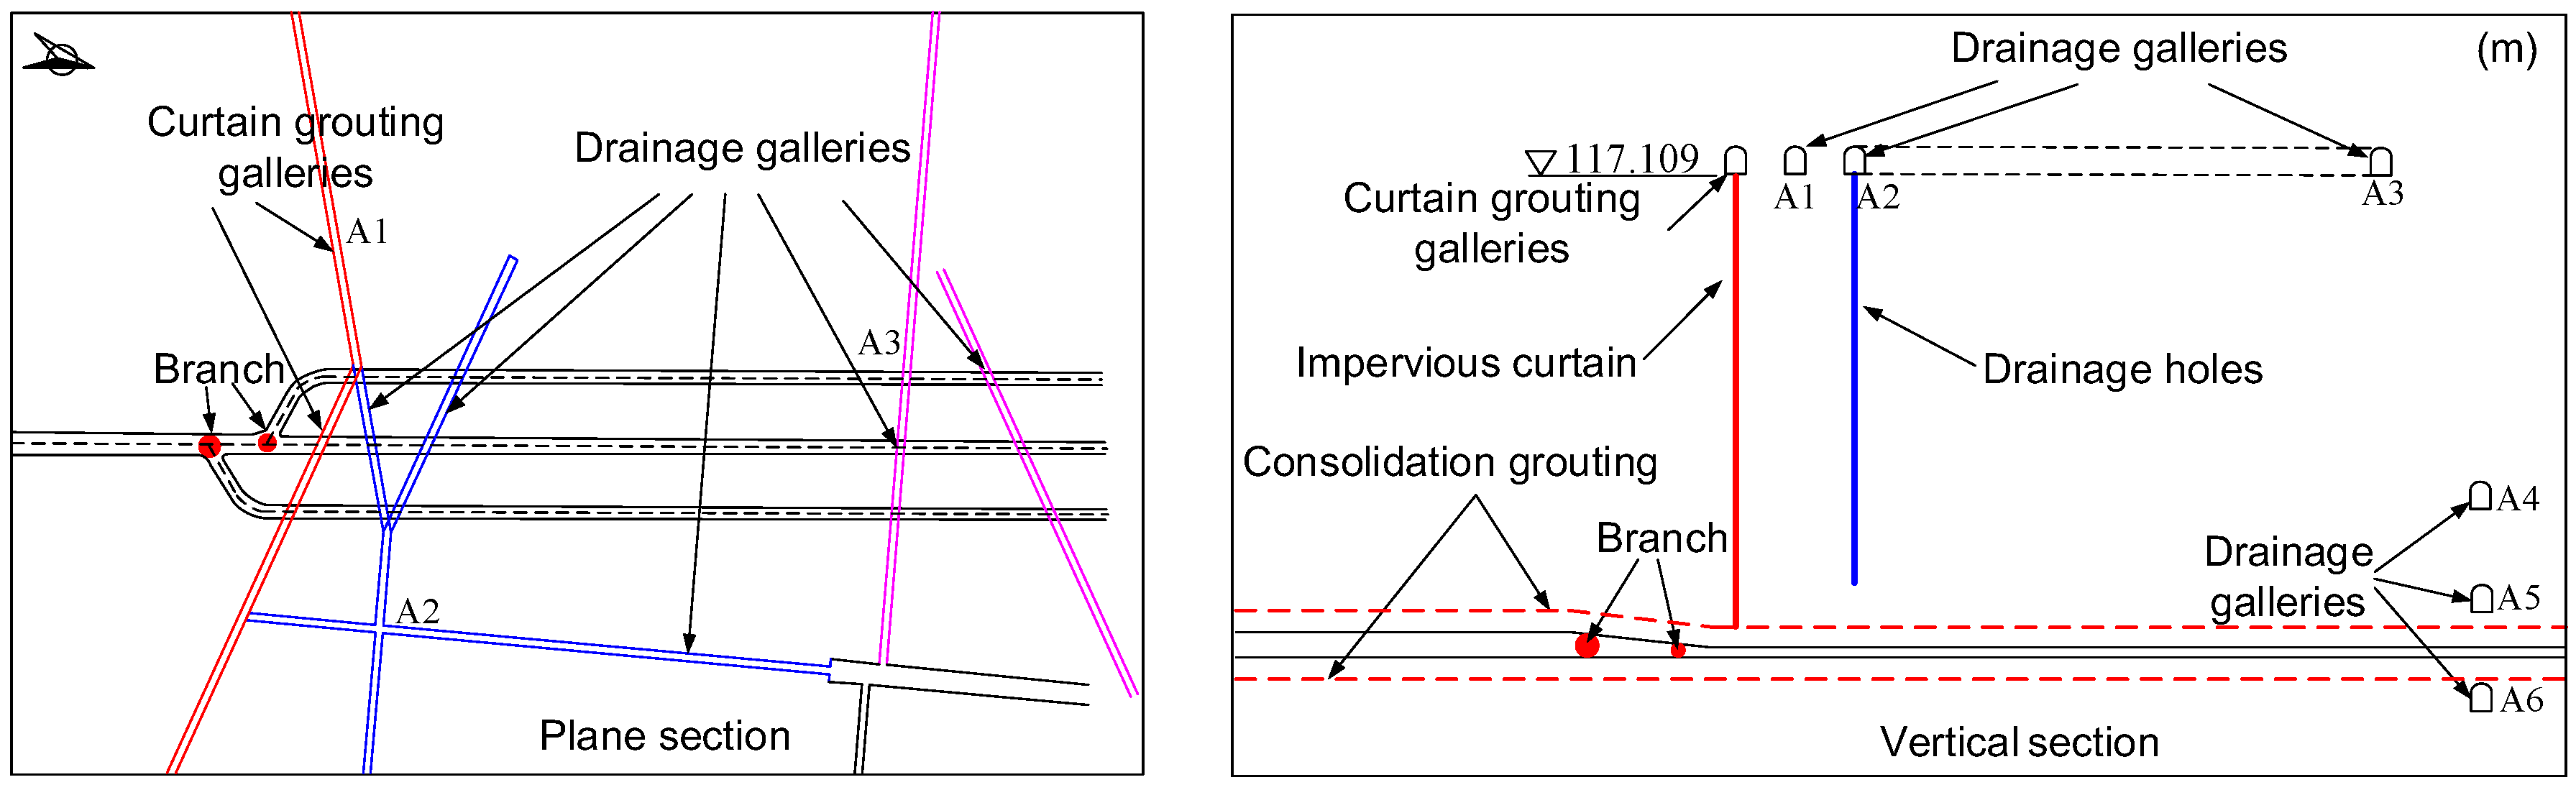
3.2. Proposed Seepage-Control Measures
4. Numerical Modeling of the Nonlinear Seepage in the Yangjiang Pumped-Storage Power Station
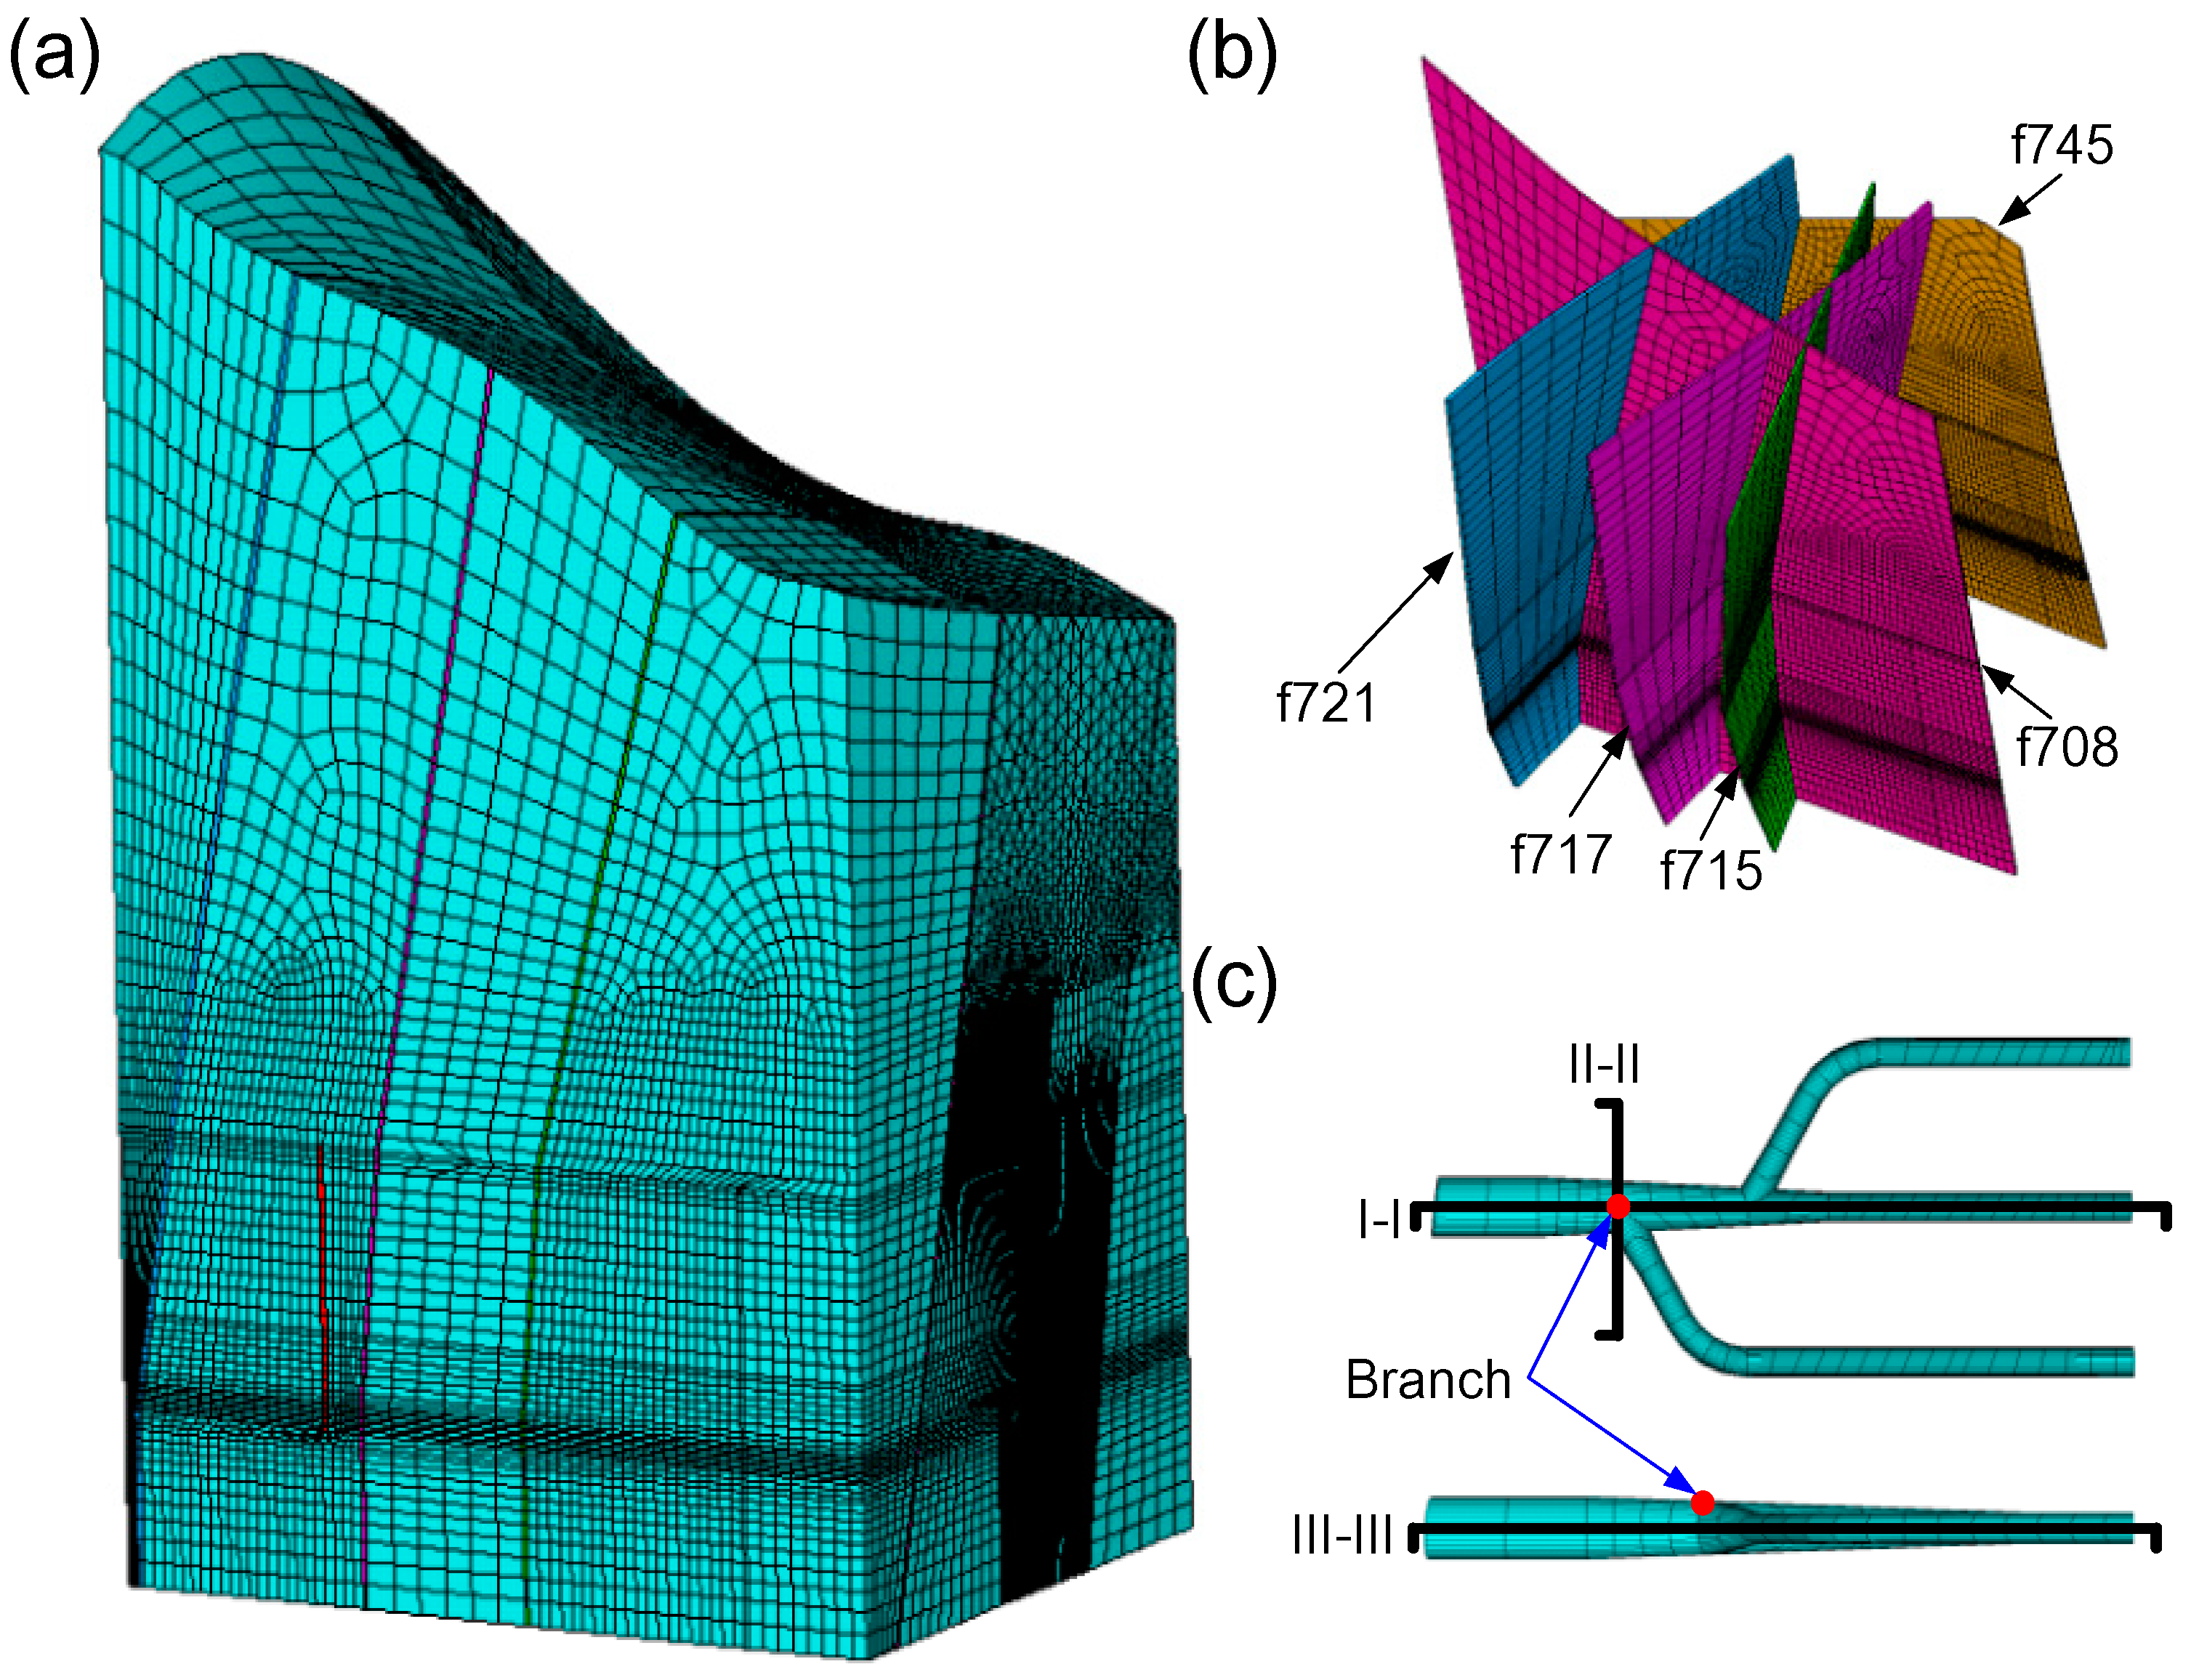
4.1. The Finite Element Model
4.2. The Calculation Parameters
4.3. The Boundary Conditions
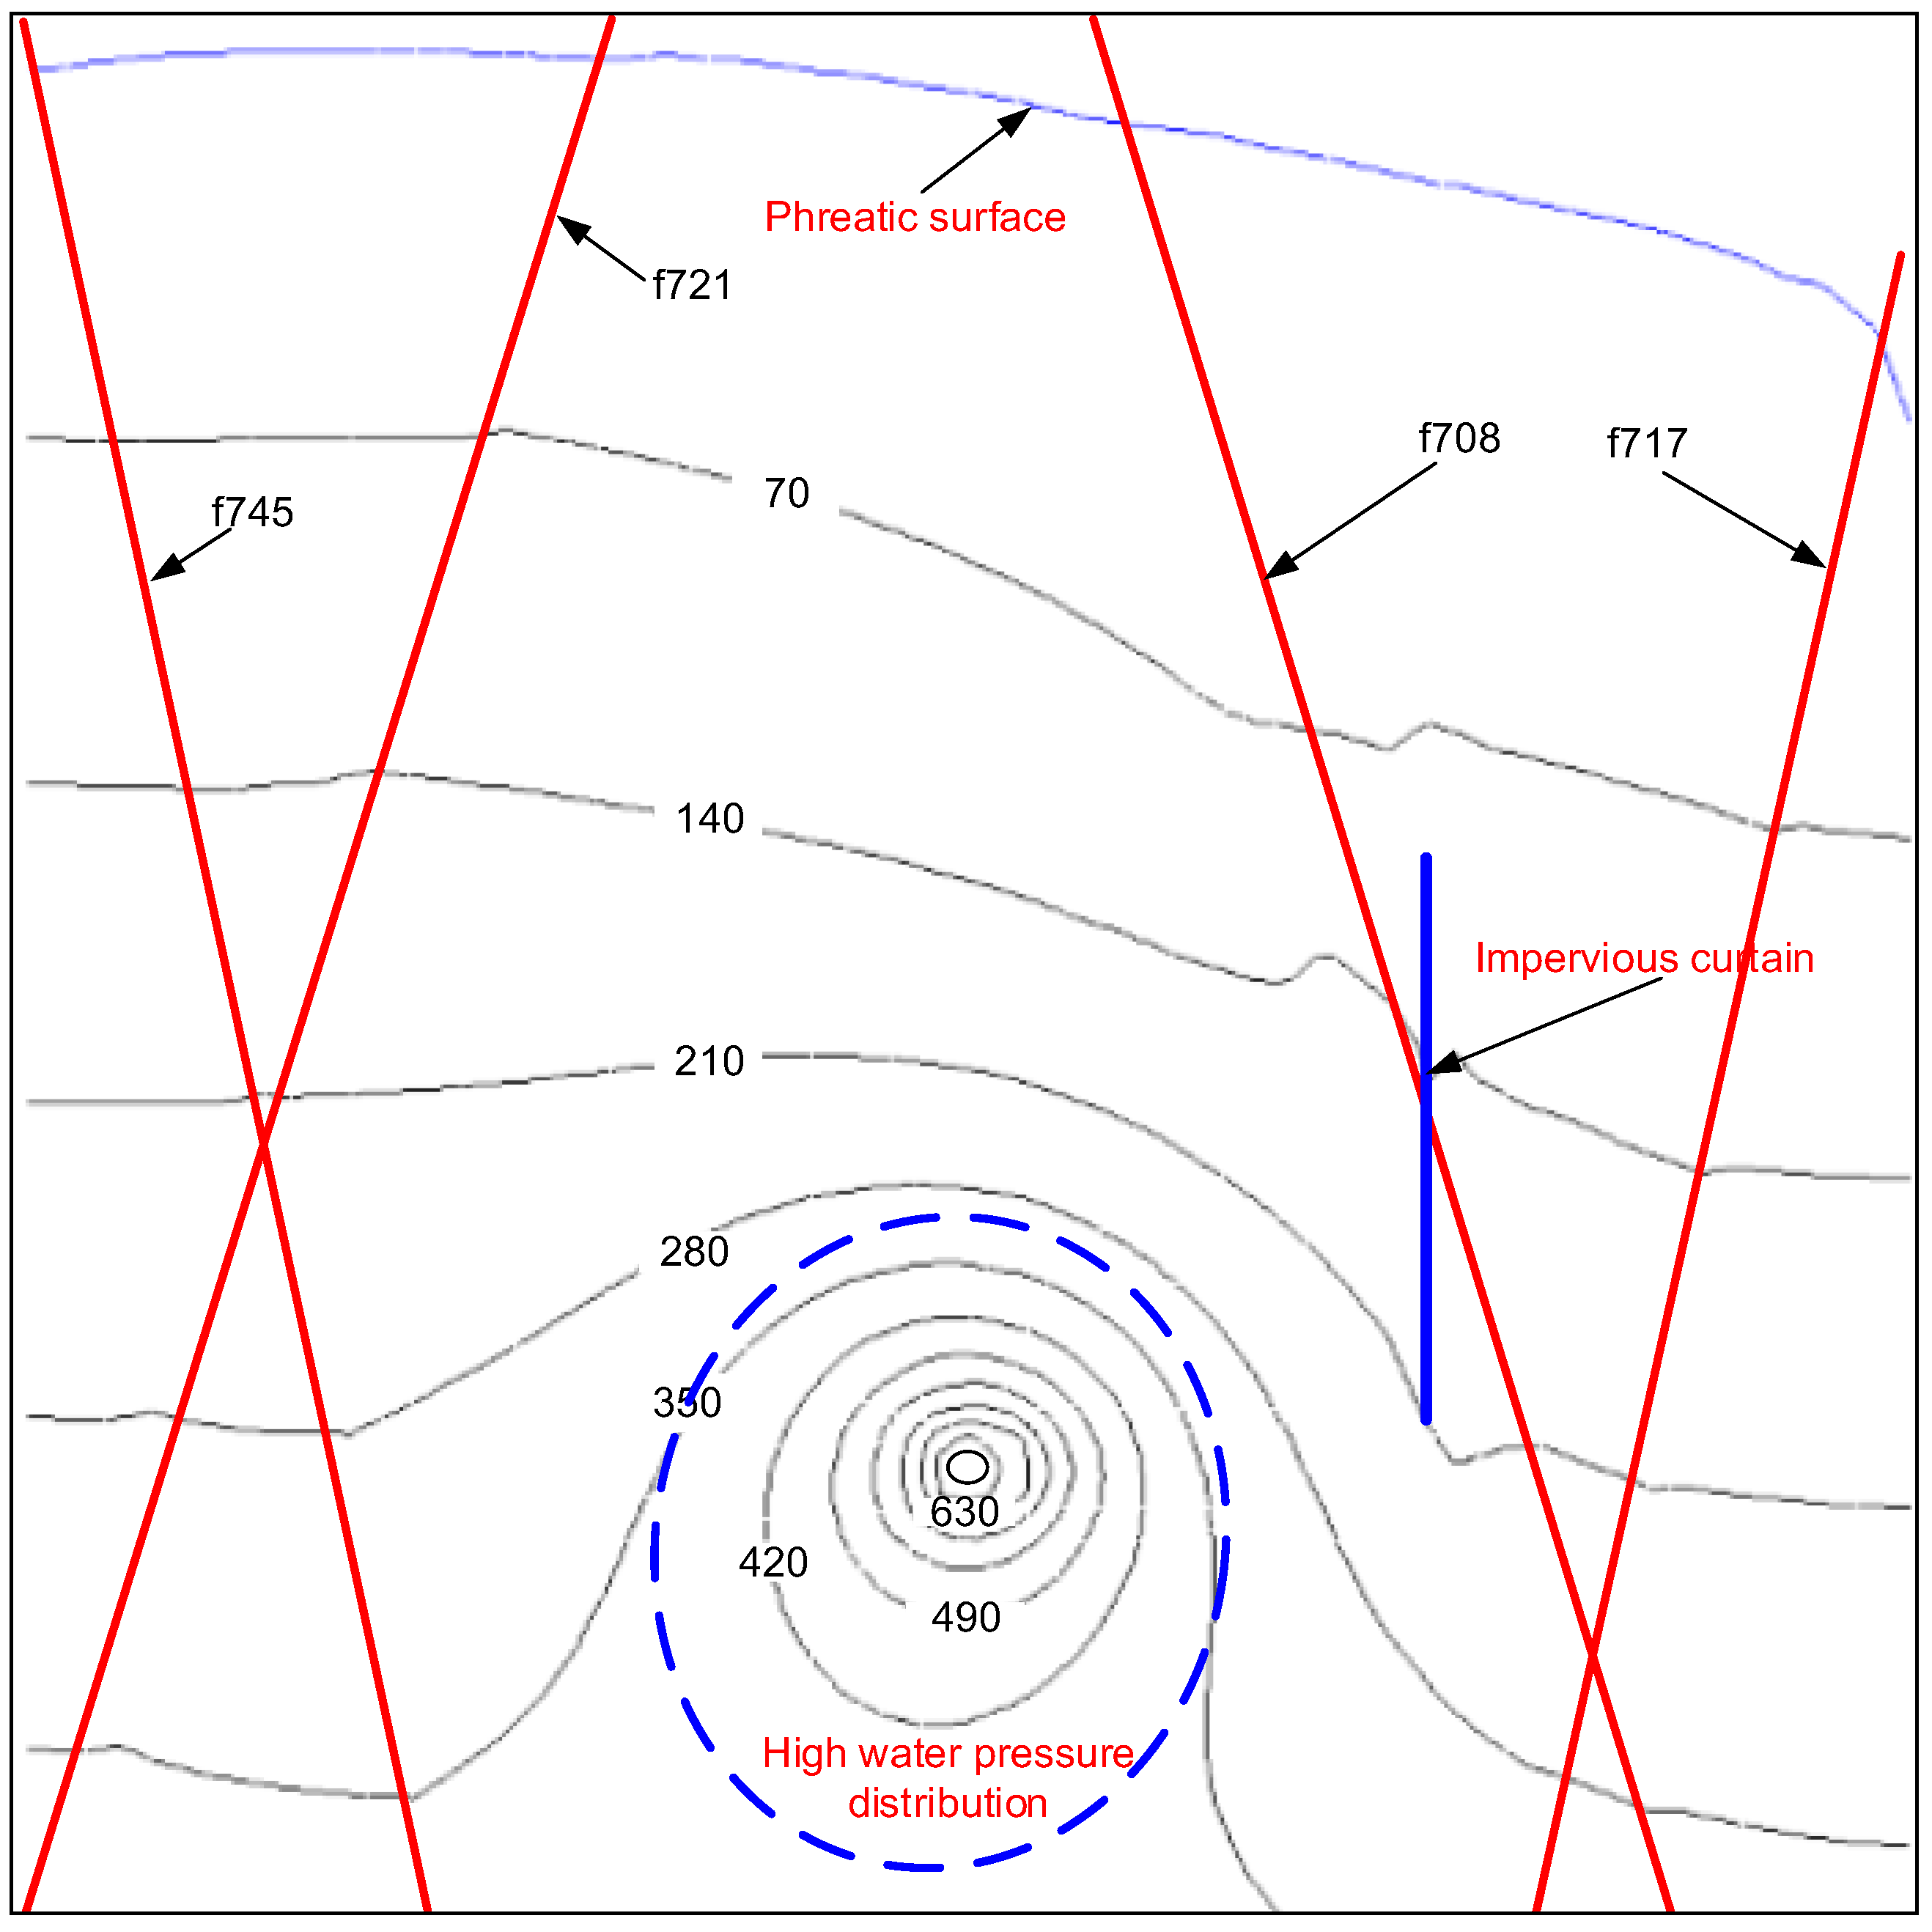
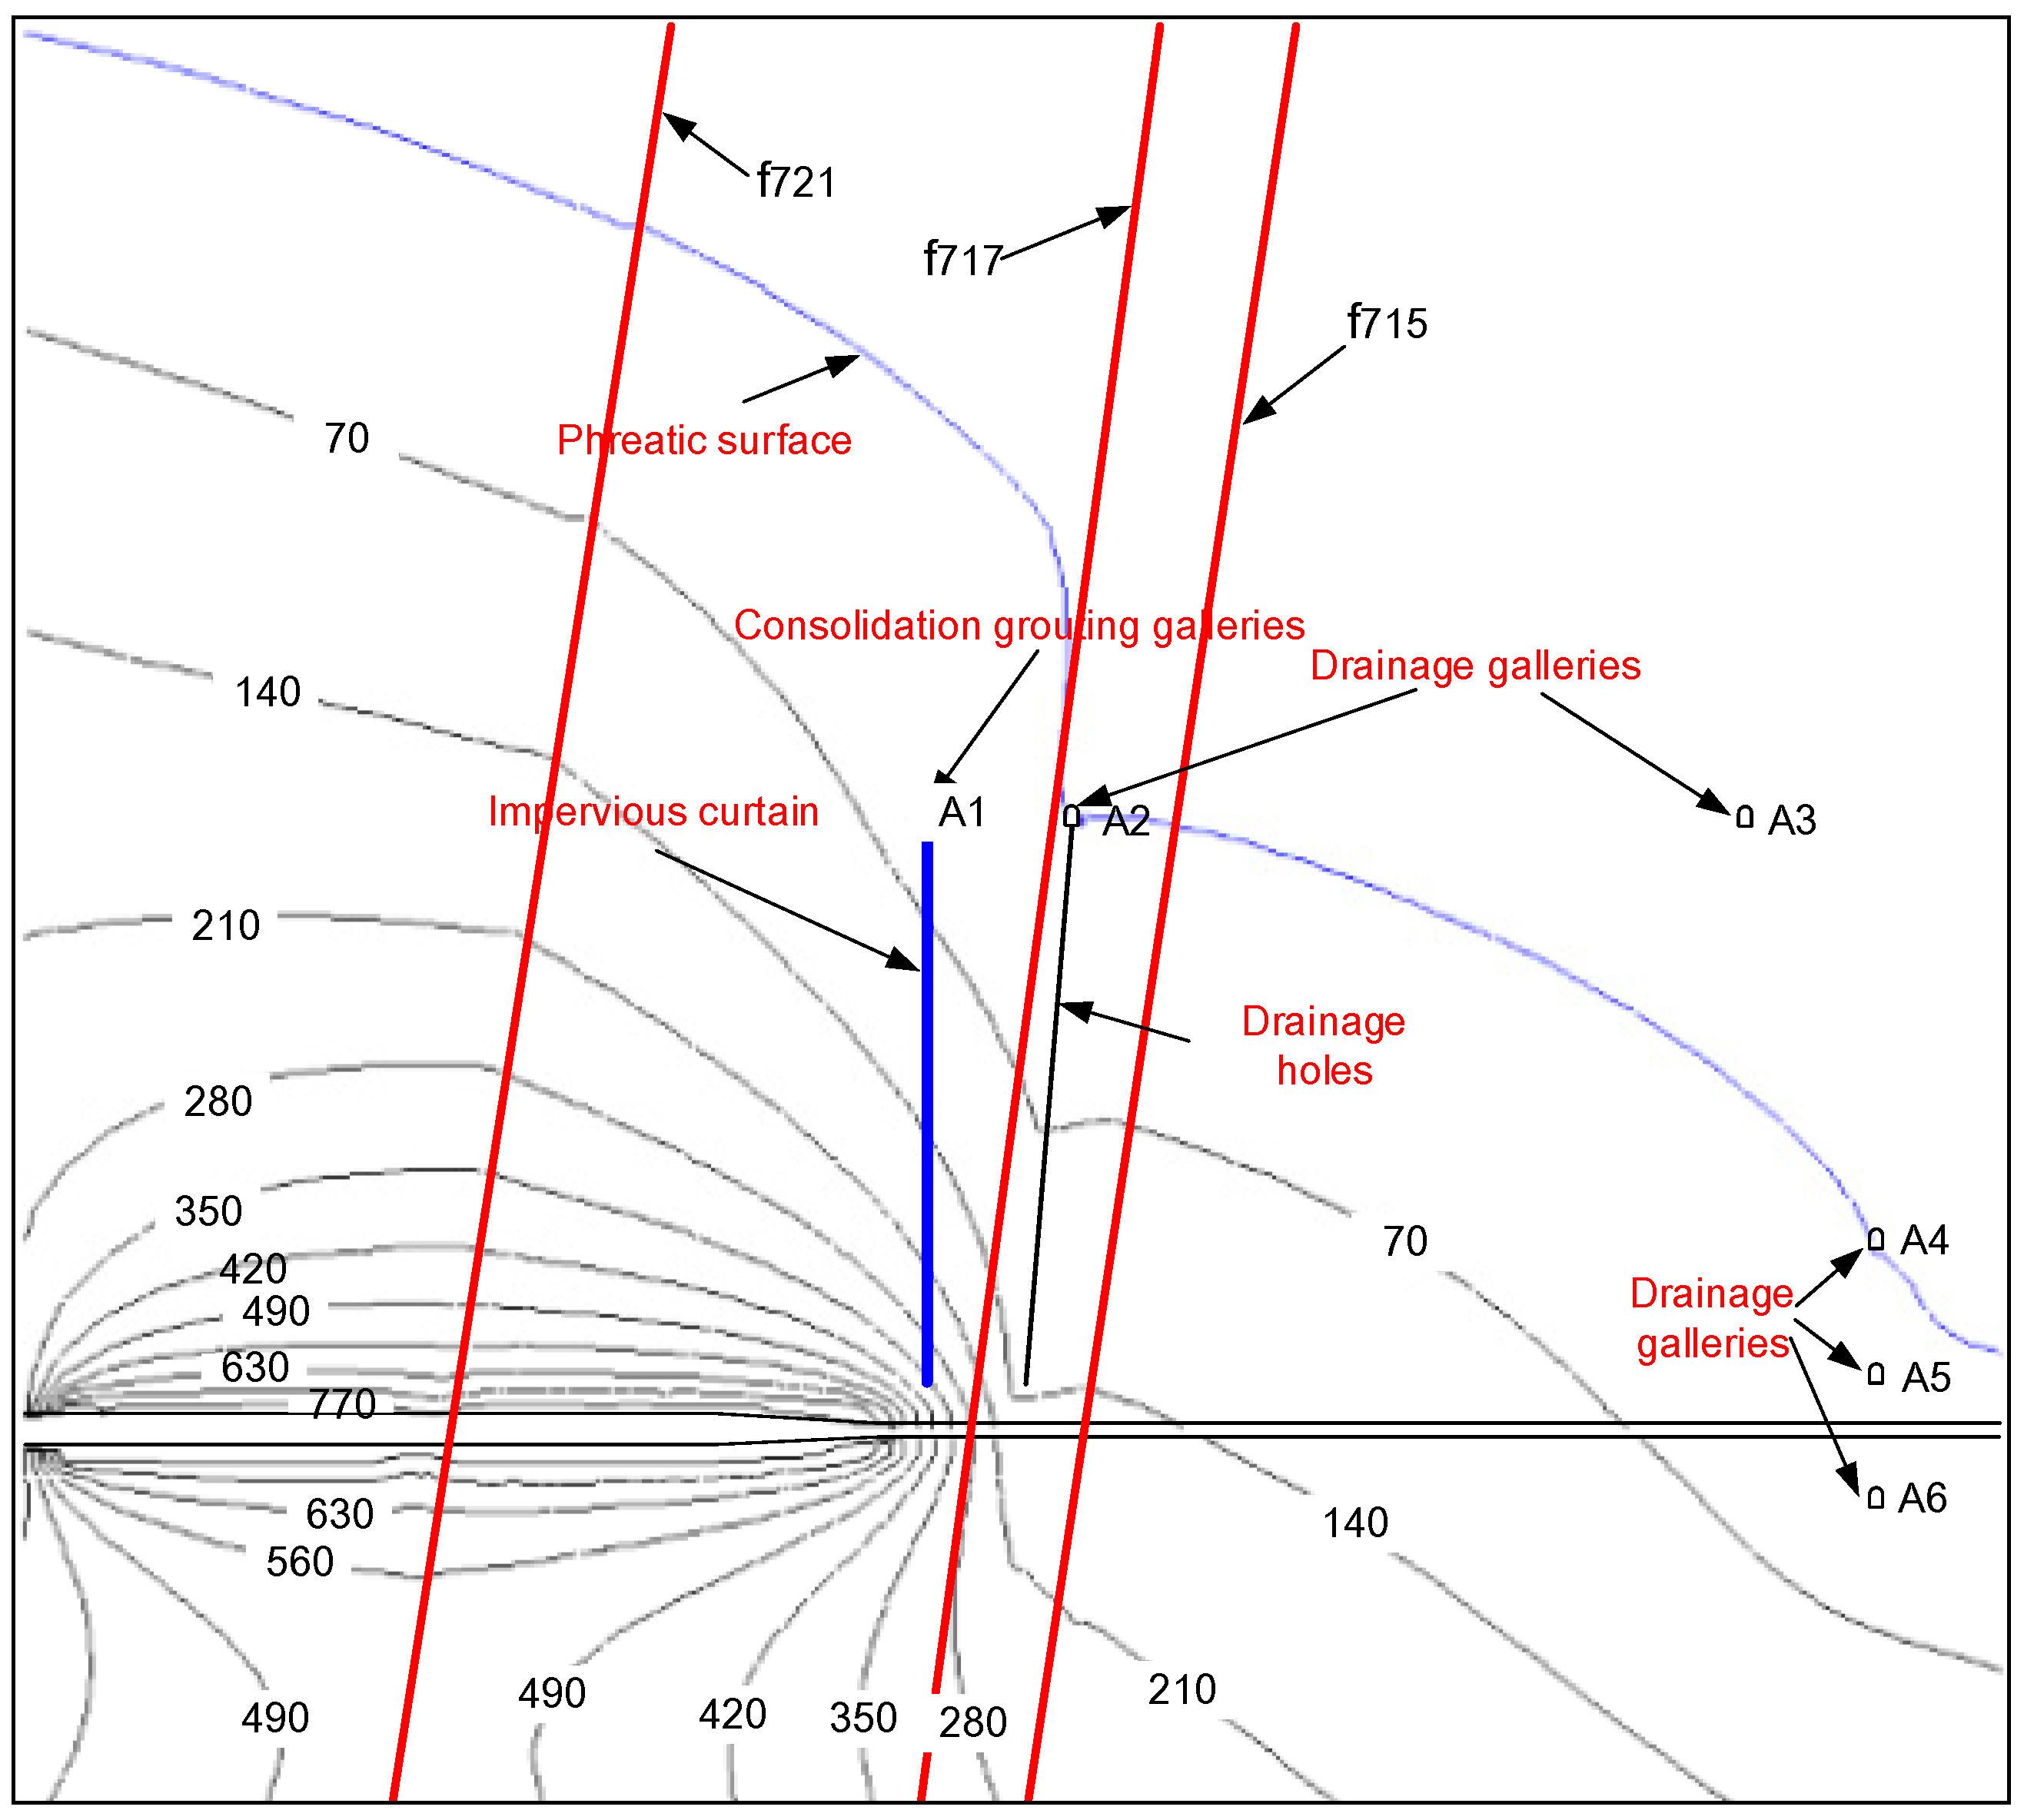
4.4. Performance Assessment of the Seepage-Control Measures
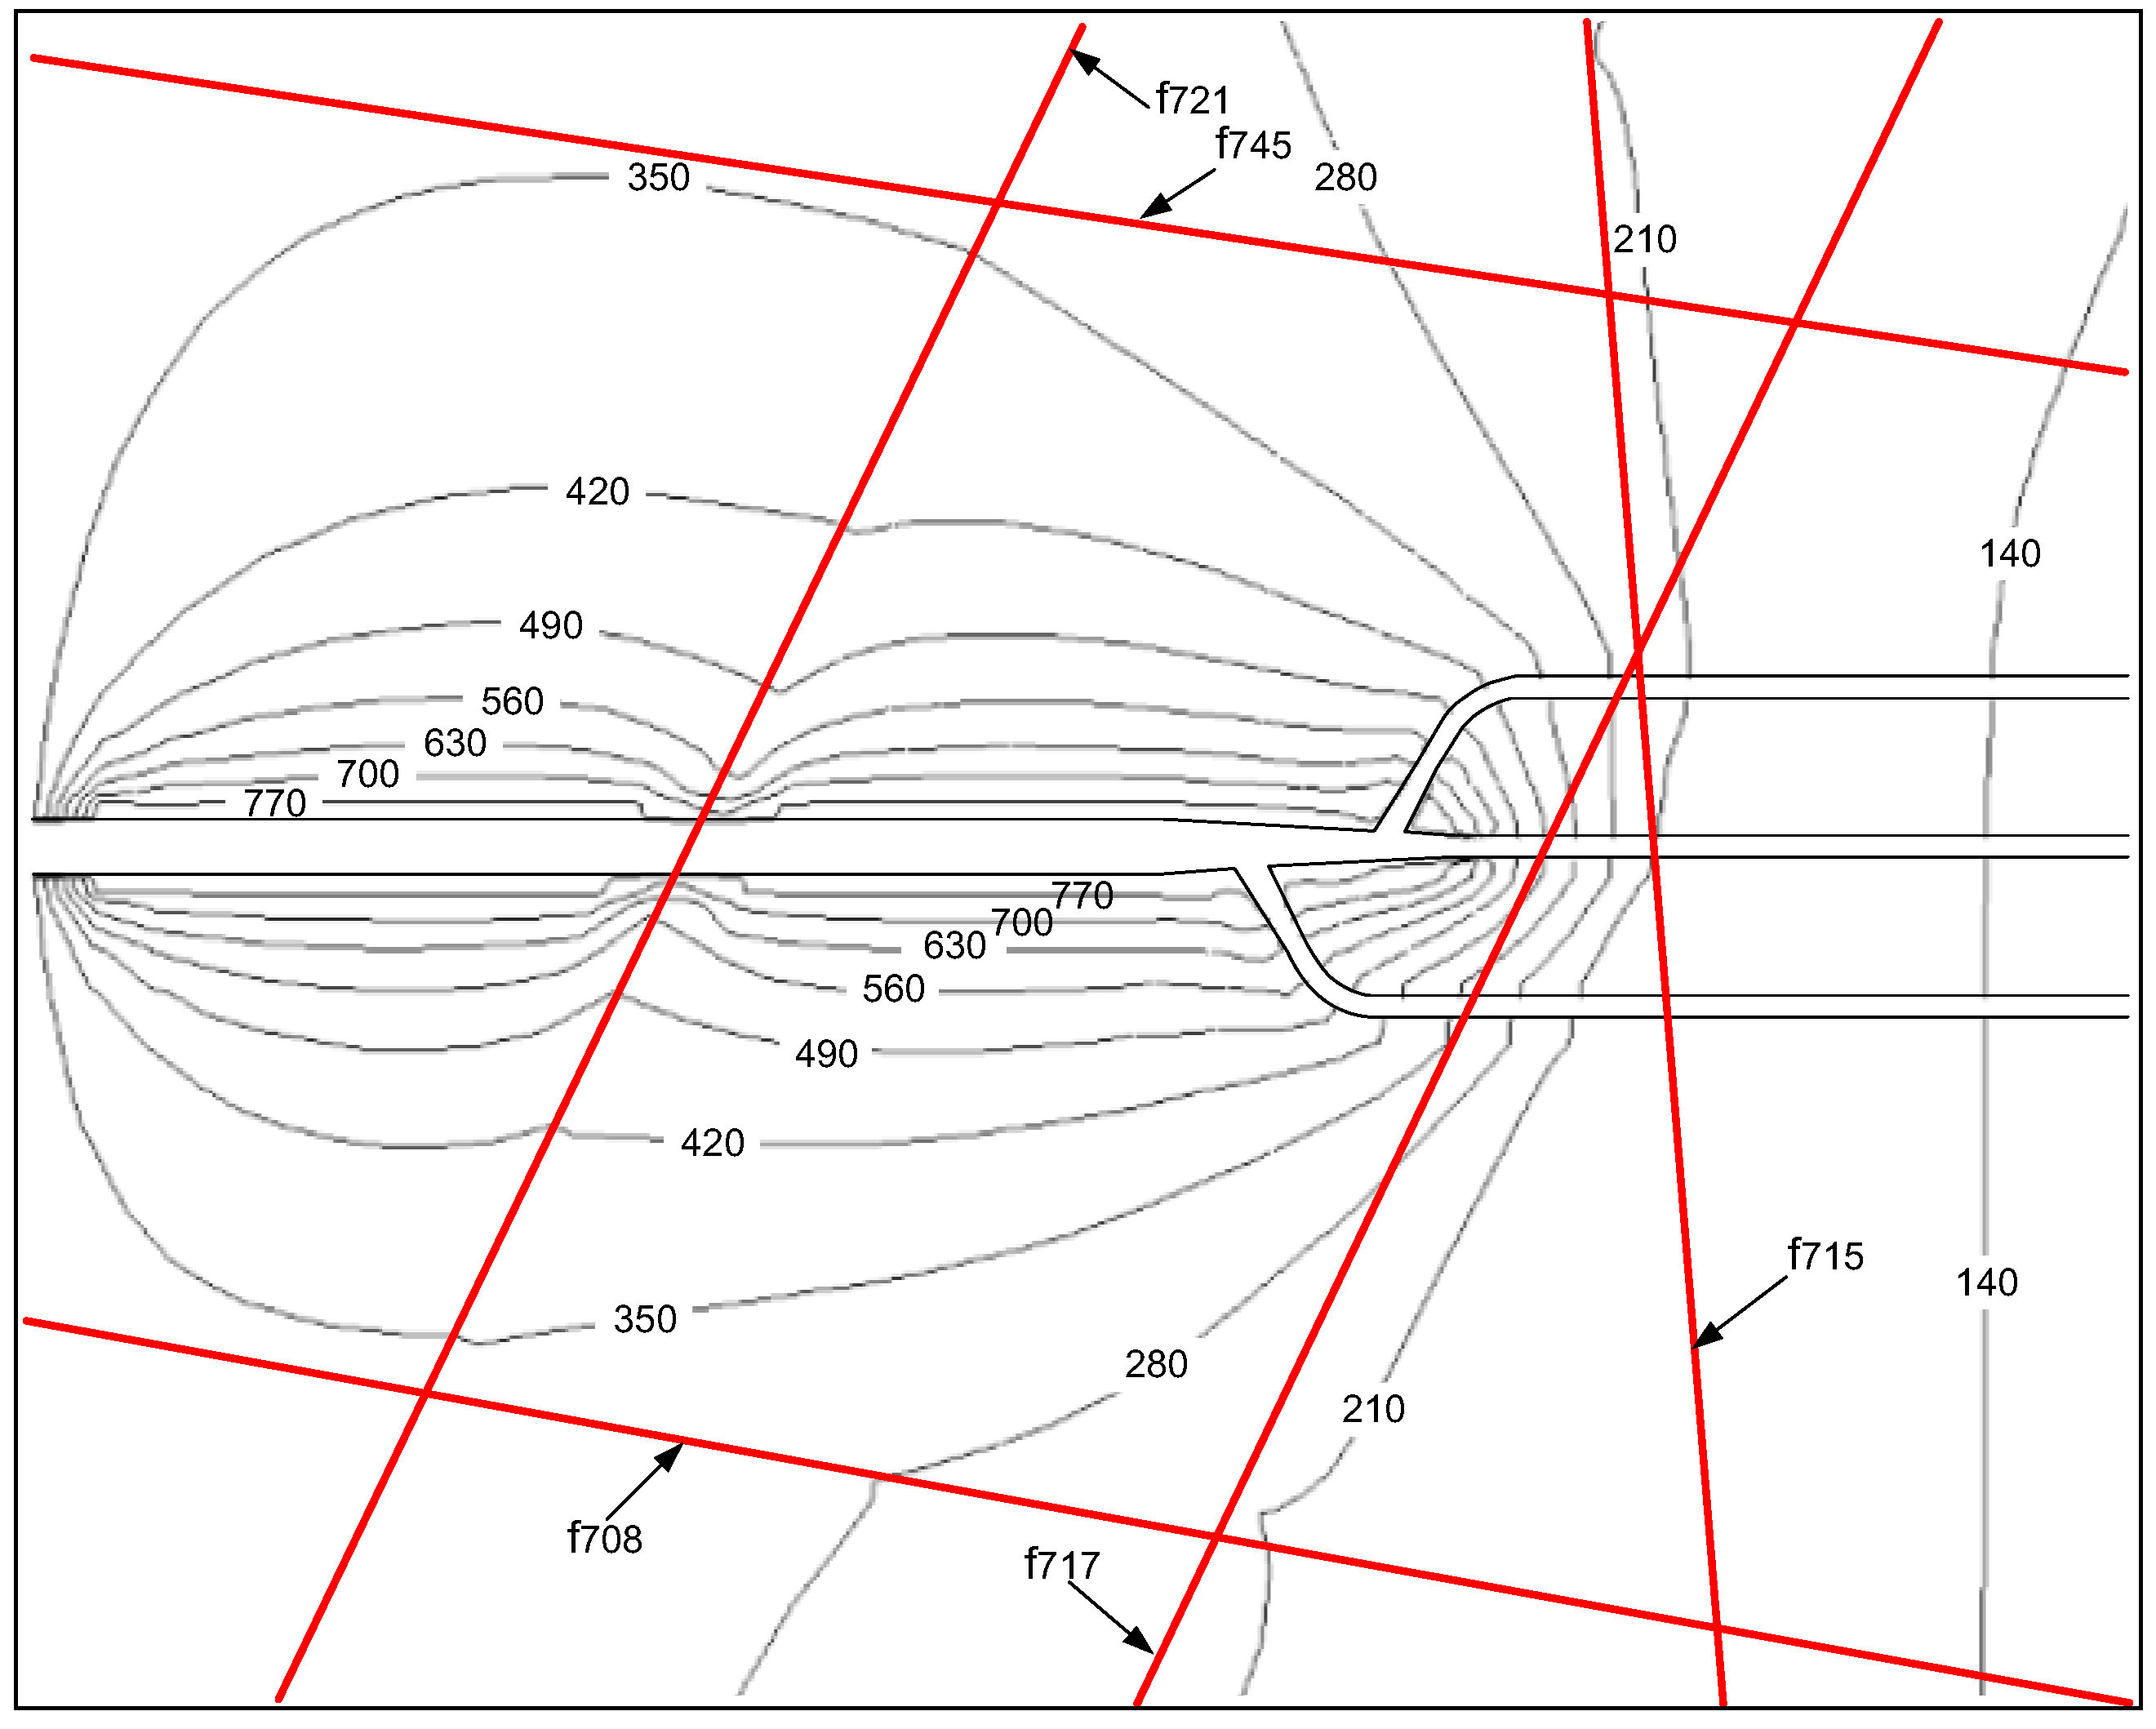
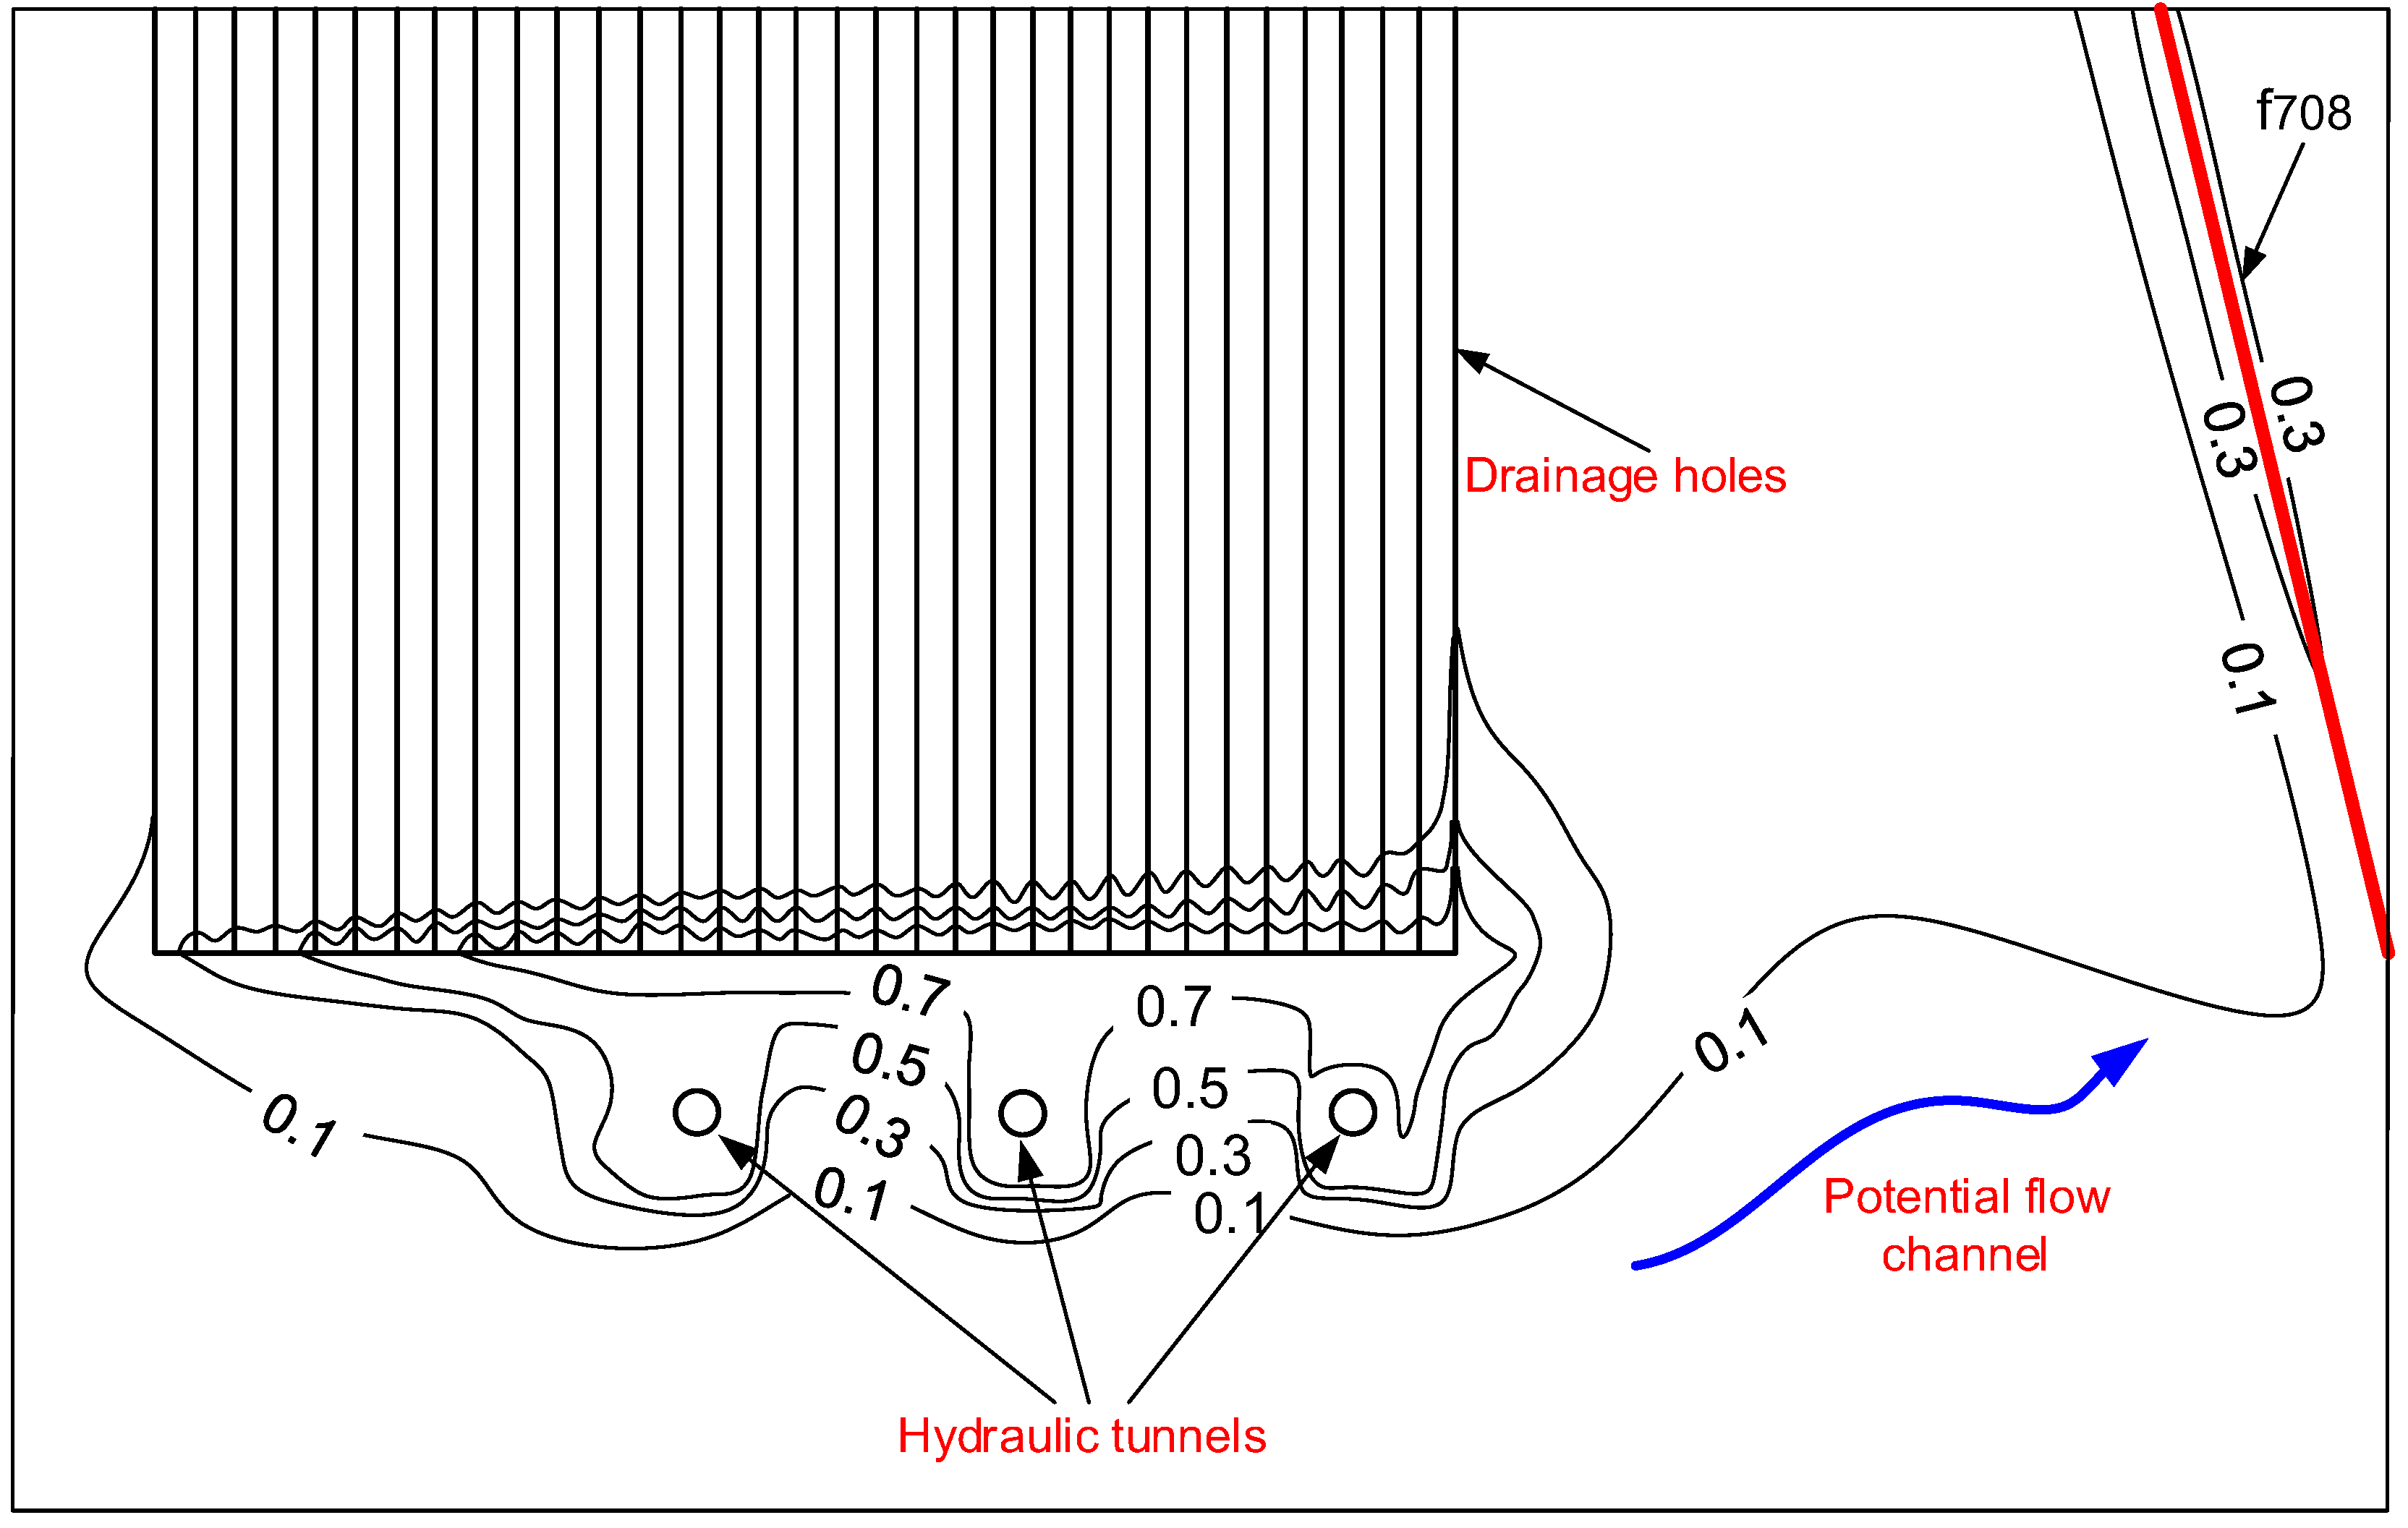
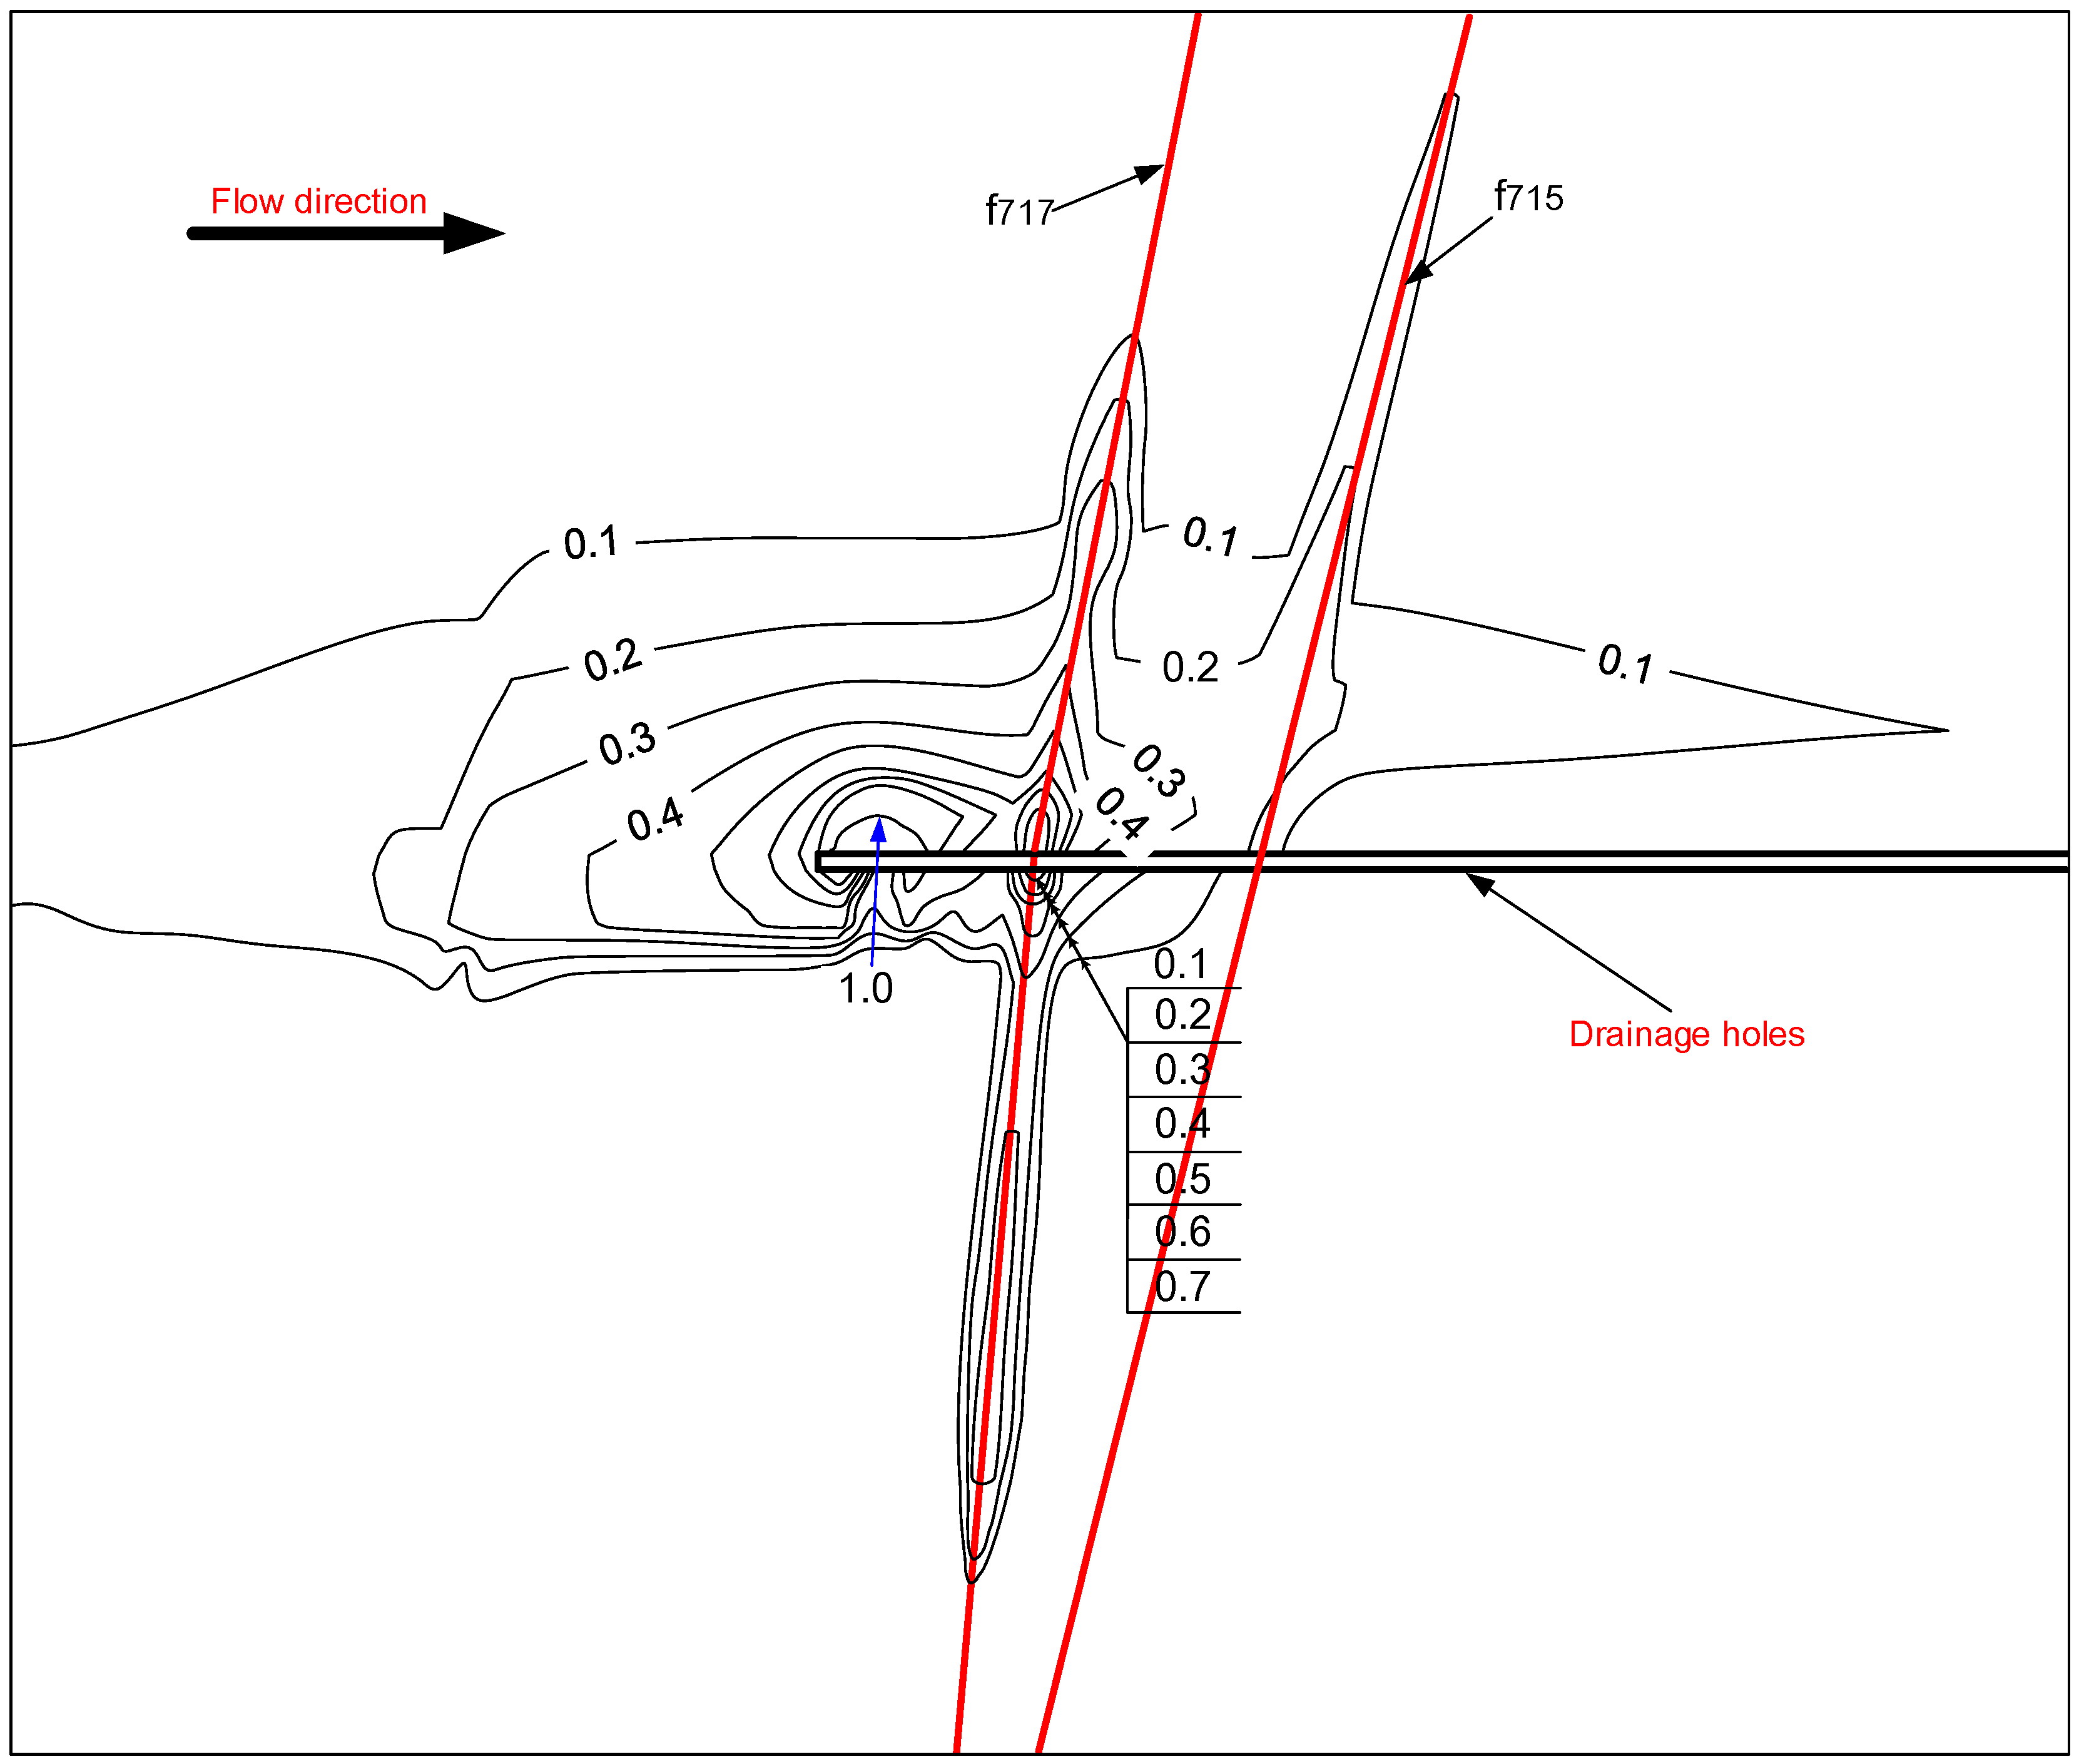
4.5. Nonlinear Seepage Characteristic in the Surrounding Rocks of the High Water Pressure Hydraulic Tunnels
5. Conclusions
Author Contributions
Funding
Conflicts of Interest
References
- Huang, H.; Yan, Z. Present situation and future prospect of hydropower in China. Renew. Sustain. Energy Rev. 2009, 13, 1652–1656. [Google Scholar] [CrossRef]
- Ming, Z.; Song, X.; Mingjuan, M.; Xiaoli, Z. New energy bases and sustainable development in China: A review. Renew. Sustain. Energy Rev. 2013, 20, 169–185. [Google Scholar] [CrossRef]
- Liu, J.; Zang, C.; Tian, S.; Liu, J.; Yang, H.; Jia, S.; You, L.; Liu, B.; Zhang, M. Water conservancy projects in China: Achievements, challenges and way forward. Glob. Environ. Chang. 2013, 23, 633–643. [Google Scholar] [CrossRef] [Green Version]
- Liu, J.; Zuo, J.; Sun, Z.; Zillante, G.; Chen, X. Sustainability in hydropower development—A case study. Renew. Sustain. Energy Rev. 2013, 19, 230–237. [Google Scholar] [CrossRef]
- Luo, X.; Wang, J.; Dooner, M.; Clarke, J. Overview of current development in electrical energy storage technologies and the application potential in power system operation. Appl. Energy 2015, 137, 511–536. [Google Scholar] [CrossRef] [Green Version]
- Zhao, H.; Wu, Q.; Hu, S.; Xu, H.; Nygaard, C. Review of energy storage system for wind power integration support. Appl. Energy 2015, 137, 545–553. [Google Scholar] [CrossRef] [Green Version]
- Chen, H.; Cong, T.N.; Yang, W.; Tan, C.; Li, Y.; Ding, Y. Progress in electrical energy storage system: A critical review. Prog. Nat. Sci. 2009, 19, 291–312. [Google Scholar] [CrossRef]
- Castillo, A.; Gayme, D.F. Grid-scale energy storage applications in renewable energy integration: A survey. Energy Convers. Manag. 2014, 87, 885–894. [Google Scholar] [CrossRef]
- Díaz-gonzález, F.; Sumper, A.; Gomis-bellmunt, O.; Villafáfila-robles, R. A review of energy storage technologies for wind power applications. Renew. Sustain. Energy Rev. 2012, 16, 2154–2171. [Google Scholar] [CrossRef]
- Kousksou, T.; Bruel, P.; Jamil, A.; El Rha, T.; Zeraouli, Y. Energy storage: Applications and challenges. Sol. Energy Mater. Sol. Cells 2014, 120, 59–80. [Google Scholar] [CrossRef]
- Al-hadhrami, L.M.; Alam, M. Pumped hydro energy storage system: A technological review. Renew. Sustain. Energy Rev. 2015, 44, 586–598. [Google Scholar] [CrossRef]
- Punys, P.; Baublys, R.; Kasiulis, E.; Vaisvila, A.; Pelikan, B.; Steller, J. Assessment of renewable electricity generation by pumped storage power plants in EU Member States. Renew. Sustain. Energy Rev. 2013, 26, 190–200. [Google Scholar] [CrossRef]
- Wang, F.; Jiang, J. A novel static frequency converter based on multilevel cascaded H-bridge used for the startup of synchronous motor in pumped-storage power station. Energy Convers. Manag. 2011, 52, 2085–2091. [Google Scholar] [CrossRef]
- Zeng, M.; Zhang, K.; Liu, D. Overall review of pumped-hydro energy storage in China: Status quo, operation mechanism and policy barriers. Renew. Sustain. Energy Rev. 2013, 17, 35–43. [Google Scholar] [CrossRef]
- Ding, H.; Hu, Z.; Song, Y. Stochastic optimization of the daily operation of wind farm and. Renew. Energy 2012, 48, 571–578. [Google Scholar] [CrossRef]
- Zhang, W.; Zheng, J.; Huang, L.; Wang, H. Design review on upstream conduit of Plant A in Huizhou Pumped-Storage Power Station. Water Power 2010, 36, 10–14. [Google Scholar]
- Hu, Y.; Fang, J.; Huang, D.; Feng, S.; Su, X. Coupling analysis of seepage-stress-cracking for inner waterexosmosis of pressure tunnel. J. Beijing Univ. Technol. 2013, 39, 174–179. [Google Scholar]
- Li, X.; Yang, X.; Zhou, J.; Lin, Y. Study on adjacent rock’s stability of diversion tunnel under complicated geology. J. Water Resour. Archit. Eng. 2010, 8, 31–36. [Google Scholar]
- Yun, H.U.; Ong, Z.H.Z.; Dong, H.U.A.N.G.; Shi, F.E.N.G. Selection criteria for lining structure type of pressure tunnel. J. Zhejiang Univ. Sci. 2011, 45, 1314–1318. [Google Scholar]
- Wong, K.L.; Oechsel, R.G.; Wafle, D.T. Bath county pumped storage project tunnel system-Evaluation of remedial measures. In ISRM International Symposium; International Society for Rock Mechanics: Madrid, Spain, 1988; pp. 419–426. [Google Scholar]
- Tondevold, E. Pumped storage in norway, in Pumped Storage Development and Its Environmental Effects. Proceedings 1971, 15, 838. [Google Scholar]
- Cachafeiro, H.; De Arevalo, L.F.; Vinuesa, R.; Goikoetxea, J.; Barriga, J. Impact of Solar Selective Coating Ageing on Energy Cost. Energy Procedia 2015, 69, 299–309. [Google Scholar] [CrossRef] [Green Version]
- Zhang, J.; Xing, H. Numerical modeling of nonlinear flow in near-well region of a geothermal reservoir. Geothermics 2012, 42, 78–86. [Google Scholar] [CrossRef]
- Yang, L. Numerical simulation on three-dimensional nonlinear and unstable seepage of fluid in underground coal gasification. Fuel Process. Technol. 2003, 84, 79–93. [Google Scholar] [CrossRef]
- Quinn, P.M.; Parker, B.L.; Cherry, J.A. Using constant head step tests to determine hydraulic apertures in fractured rock. J. Contam. Hydrol. 2011, 126, 85–99. [Google Scholar] [CrossRef] [PubMed]
- Samanta, A.; Vinuesa, R.; Lashgari, I.; Schlatter, P.; Brandt, L. Enhanced secondary motion of the turbulent flow through a porous square duct. J. Fluid Mech. 2015, 784, 681–693. [Google Scholar] [CrossRef]
- Li, Y.; Chen, Y.; Jiang, Q.; Hu, R.; Zhou, C. Performance assessment and optimization of seepage control system: A numerical case study for Kala underground powerhouse. Comput. Geotech. 2014, 55, 306–315. [Google Scholar] [CrossRef]
- Chen, Y.; Zhou, C.; Zheng, H. A numerical solution to seepage problems with complex drainage systems. Comput. Geotech. 2008, 35, 383–393. [Google Scholar] [CrossRef]
- Chen, Y.; Zhou, C.; Jing, L. Modeling coupled THM processes of geological porous media with multiphase flow: Theory and validation against laboratory and field scale experiments. Comput. Geotech. 2009, 36, 1308–1329. [Google Scholar] [CrossRef]


| No. | Project | Location | Installed Capacity (MW) | Completed Year | Water Head (m) |
|---|---|---|---|---|---|
| 1 | Bailianhe | Hubei | 1200 | 2010 | 195 |
| 2 | Heimifeng | Hunan | 1200 | 2010 | 295 |
| 3 | Pushihe | Liaoning | 1200 | 2011 | 308 |
| 4 | Baoquan | Henan | 1200 | 2011 | 510 |
| 5 | Xiangshuijian | Anhui | 1000 | 2012 | 190 |
| 6 | Xianyou | Fujian | 1200 | 2013 | 640 |
| 7 | Huhehaote | Neimenggu | 1200 | 2015 | 513 |
| 8 | Qingyuan | Guangdong | 1280 | 2016 | 503 |
| 9 | Hongpin | Jiangxi | 1200 | 2016 | 540 |
| 10 | Xianju | Zhejiang | 1500 | 2016 | 440 |
| No. | Project | Country | Installed Capacity (MW) | Water Head (m) | Leakage (L/s) | Power Loss (kW) |
|---|---|---|---|---|---|---|
| 1 | Guangzhou | China | 1200 | 610 | 32 | 1687 |
| 2 | Huizhou | China | 1200 | 624 | 230 | 12,400 |
| 3 | Tianhuangping | China | 1800 | 680 | 11.2 | 658 |
| 4 | Baoquan | China | 1200 | 639.6 | 150 | 8289 |
| 5 | Bath County | U.S. | 2l00 | 385 | 486 | 16,166 |
| 6 | Tafjord | Norway | 440 | 780 | 4 | 270 |
| No. | Occurrence | Width (m) | Fault Characteristic |
|---|---|---|---|
| f721 | N70~75W/SW∠85° | 0.5~2.0 | Silicified cataclastic rock powder, crushed rock, mylonite, partial filling 0.5~1.0 cm Quartz vein, weak cementation generally-well medium silicide, linear leaks, Q = 2~3 L/min. |
| f717 | N75W/SW∠80° | 0.15~0.25 | Silicified cataclasite, cementation general well, impact zone 0.5~1.0 m, Linear strands of leakage, Q = 4~5 L/min. |
| f715 | N85E/SE∠85° | 0.1~0.15 | Silicified cataclasite, fractured fault, mild alteration zone 0.2~0.3 m, Linear leaking, Q = 1 L/min. |
| f708 | N10W/NE∠70~75° | 0.2~0.6 | Cataclasite and breccia, mylonite fault gouge, cementation, quartz vein invasion, linear, form water, Q = 15~20 L/min. |
| f745 | N5~15E/SE∠70~80° | 0.2~1.2 | Cataclastic rock, silicified rock, cementation, permeability drop~linear strip break water, Q = 0.4~0.5 L/min. |
| Strata | Normal Permeability | Tangential Permeability |
|---|---|---|
| Intact surrounding rock | 1.26 × 10⁻⁶ | 1.26 × 10⁻⁶ |
| Relatively intact surrounding rock | 3.68 × 10⁻⁶ | 3.68 × 10⁻⁶ |
| Fractured surrounding rock | 3.84 × 10⁻⁵ | 3.84 × 10⁻⁵ |
| f721 and f745 | 3.68 × 10⁻⁶ | 2.0 × 10⁻⁴ |
| f708, f715 and f717 | 3.68 × 10⁻⁶ | 5.0 × 10⁻⁴ |
| Location | Water Outflow | Water Inflow | ||
|---|---|---|---|---|
| Branch of the Hydraulic Tunnels | A1–A3 Drainage Galleries | Drainage Holes | A4–A6 Drainage Galleries | |
| Linear flow | 40.5 | 17.2 | 12.9 | 1.2 |
| Nonlinear flow | 32.9 | 14.5 | 10.5 | 1.2 |
© 2019 by the authors. Licensee MDPI, Basel, Switzerland. This article is an open access article distributed under the terms and conditions of the Creative Commons Attribution (CC BY) license (http://creativecommons.org/licenses/by/4.0/).
Share and Cite
Hu, S.; Zhou, X.; Luo, Y.; Zhang, G. Numerical Simulation Three-Dimensional Nonlinear Seepage in a Pumped-Storage Power Station: Case Study. Energies 2019, 12, 180. https://doi.org/10.3390/en12010180
Hu S, Zhou X, Luo Y, Zhang G. Numerical Simulation Three-Dimensional Nonlinear Seepage in a Pumped-Storage Power Station: Case Study. Energies. 2019; 12(1):180. https://doi.org/10.3390/en12010180
Chicago/Turabian StyleHu, Shaohua, Xinlong Zhou, Yi Luo, and Guang Zhang. 2019. "Numerical Simulation Three-Dimensional Nonlinear Seepage in a Pumped-Storage Power Station: Case Study" Energies 12, no. 1: 180. https://doi.org/10.3390/en12010180