Article

Optimal Economic Dispatch in Microgrids with Renewable Energy Sources

by
F. Daniel Santillán-Lemus
1,
Hertwin Minor-Popocatl
2,*,
Omar Aguilar-Mejía
2,* and
Ruben Tapia-Olvera
3
1
Postgraduate Department, Polytechnic University of Tulancingo (UPT), Tulancingo 43629, Mexico
2
School Engineering and Business (Postgraduate), Popular Autonomous University of the State of Puebla (UPAEP), Puebla 72410, Mexico
3
Department of Electric Power, National Autonomous University of Mexico (UNAM), CDMX 04510, Mexico
*
Authors to whom correspondence should be addressed.
Energies 2019, 12(1), 181; https://doi.org/10.3390/en12010181
Submission received: 23 November 2018 / Revised: 16 December 2018 / Accepted: 25 December 2018 / Published: 7 January 2019

Abstract

:
Due to the opening of the energy market and agreements for the reduction of pollution emissions, the use of microgrids attracts more attention in the scientific community, but the management of the distribution of electricity has new challenges. This paper considers different distributed generation systems as a main part to design a microgrid and the resources management is defined in a period through proposed dynamic economic dispatch approach. The inputs are obtained by the model predictive control algorithm considering variations of both pattern of consumption and generation systems capacity, including conventional and renewable energy sources. Furthermore, the proposed approach considers a benefits program to customers involving a demand restriction and the costs of regeneration of the pollutants produced by conventional generation systems. The dispatch strategy through a mathematical programming approach seeks to reduce to the minimum the fuel cost of conventional generators, the energy transactions, the regeneration of polluted emissions and, finally, includes the benefit in electricity demand reduction satisfying all restrictions through mathematical programming strategy. The model is implemented in LINGO 17.0 software (Lindo Systems, 1415 North Dayton Street, Chicago, IL, USA). The results exhibit the proposed approach effectiveness through a study case under different considerations.

1. Introduction

Currently, the opening of the energy sector yields a new form of competition and changes of paradigms in the pattern of electricity generation. Then, distributed generation has attracted a great interest for energy contribution in the whole generation of electric power. Today, the concept of microgrids emerges as a natural alternative to the conventional electric power systems, where big synchronous generators in remote sites could be accompanied with smaller generators and shorter transmission lines near to the loads, which provide an effective and sustainable alternative for the integral use of renewable energies. Generation units in microgrids can be conventional generators in the case of thermal generators or diesel engines, in the same way, Renewable Energy Sources (RES) can be included as wind turbines, photovoltaic systems, fuel cells or Battery Energy Storage Systems (BESS). These new technologies offer a feasible electric power system, but its operation is conditioned to consider the particularities and nature of each generation system, combined to the stochastic profile of the primary energy.
It is very important to consider in RES projects that their operation is subject to randomness and interruptions, which makes difficult to find the best dynamic solution in an economic dispatch problem. Thus, the energy management in microgrids seeks to optimize some desired objective function, that defines the cost behavior, reliability and efficiency of the system, as well as the determination of the optimal energy dispatch (economic dispatch), within physical restrictions of conventional and emerge generation systems. Thereby, RES and BESS could meet with complex tasks of interconnection to large power systems, or as a technical alternative to the management of excess/deficiency of generated energy in smaller grids, considering the load variations.
On the other hand, regarding the incentive program for the Electricity Demand Reduction (EDR), it is necessary to investigate and delimit practical scenarios for the incorporation of economic dispatch process in microgrids to meet real customer benefits. In such a way that the reduction of energy consumption should be more reliable than only the possible reduction of generated energy, besides to find the best possible energy schedule that implies not only reduce fuel costs, but also it improves the pattern of energy consumption for any load. Therefore, new trends of economic dispatch imply many variables that must be included in the problem formulation to achieve a flexible and reliable electric power system, considering diverse topologies and including different penetration levels of renewable energy sources.
This paper presents an application of Model Predictive Control (MPC) [1] to define the input values to the economic dispatch algorithm, considering the management of variations for both loads and RES capacity [2]. In addition, the proposed formulation includes a benefits program based on EDR, where costumers obtain economic benefit by reducing their consumption and are adequately compensated depending of the levels of participation in the dynamic economic dispatch (DED) problem [3]. Finally, the treatment cost of the air pollution produced by DG in the microgrid is incorporated, too.

2. Literature Review

In [4] it is considered that the microgrids contemplate the possibility of energy storage by means of devices such as BESS, compressors, accumulation by pumping and can work in the connection mode to the main grid, where the energy transfer can be carried out in the form bidirectional depending on its generation capacity or in isolated mode, where the microgrid is self-sufficient and excess production can be used for storage, in [5] it is described that both cases have advantages to ensure high reliability supply, sustainability, quality of energy and the search to reduce costs due to losses in the electricity, transmission and distribution lines. In [6] it is considered the generating units of the local networks can be of any type. However, recently the Renewable Energy Sources (RES) have become preferred for their use given their environmental benefits in addition to the convenience in generation costs. RES generators can be used individually or grouped in modules in such a way that their efficiency is increased either in acquisition cost or with the optimization approach in operation and control.
In this paper, the Dynamic Economic Dispatch Problem (DED) must meet the operating needs of the system in real time, since it not only looks for the lowest operating cost in a scheduling cycle, but also considers the different distributed generators (DG) during several periods. In [7] various approaches are proposed for microgrids, however the approach proposed in this paper expresses the cost as a function of the power that will supply to the load within the microgrid and includes the costs of regeneration of the gases emitted by the combustion of conventional generators. Since a characteristic of the functioning of some RES is its stochastic nature, in [8] the optimization of costs is studied considering this aspect. A microgrid can include generators that use as primary source; wind, photovoltaic energy, any form of thermal energy generation, various forms of kinetic energy such as hydraulic, with storage in batteries in order to maximize the overall economic benefit of the system and the determination of the optimal conditions of production of the energy sources, while the equilibrium restrictions on the side of the load are satisfied [9]. In [10] a microgrid is analyzed in its dynamic operation and a solution approach is proposed that contains a factor that considers the cost of recovering the pollution from a mathematical model point of view. In [2] it is considered a microgrid formed by wind turbines, photovoltaic modules with batteries, and this system is connected to a main grid, in this case, the analysis is carried out under different market policies and an approach of solution through the heuristic called Particle Swarm Optimization (PSO) [10].
A new dimension is presented in [11] with respect to the temporal correlation of intermittent renewable energy sources in hybrid systems and considers the daily variations of energy consumption in the different seasons of the year for a dispatch strategy with conventional machines; however; in this approach, the costs of regeneration of pollutants produced by conventional generation systems are not considered, nor is the concept of restriction of demand. In paper [12] is presents a distributed method to solve the problem of economic dispatch of combined heat and energy, which formulates a distributed coupled optimization problem that establishes two consensus protocols with feedback parts that satisfies the balance between electrical demand and heat demand, through an iterative method, in this approach are not considered additional aspects such as the regeneration of polluting, nor demand constraints [13,14,15]. In [16] an approach based on the generation of wind energy and photovoltaic generation is presented, here it is considered a new way of operating energy systems in a micro grid, suggesting a new mode of consumption, derived from the growing connection between energy resources and awareness of environmental protection, taking into account the reductions in SO2 and NOx emissions, however the aspect of demand restriction nor is considered in the proposal.
This paper considers different distributed generation systems as a main part to design a microgrid and the resources management is defined in a period through proposed dynamic economic dispatch approach. The inputs are obtained by the model predictive control algorithm considering variations of both pattern of consumption and generation systems capacity, including conventional and renewable energy sources. Furthermore, the proposed approach considers a benefits program to customers involving a demand restriction and the costs of regeneration of the pollutants produced by conventional generation systems. The dispatch strategy through a mathematical programming approach seeks to reduce to the minimum the fuel cost of conventional generators, the energy transactions, the regeneration of polluted emissions and, finally, includes the benefit in electricity demand reduction satisfying all restrictions through mathematical programming strategy.

3. Economic Dispatch Algorithm

The problem of assigning the load demands of the customers among the available generating units in an economically, safely and reliably way has received considerable attention [11,12]. The problem of the economic dispatch has two different formulations in the literature. The first formulation is called the problem of dynamic economic dispatch and the second problem of static economic dispatch. The problem of dynamic economic dispatch differs from the static economic dispatch problem by the incorporation of generator ramp speed restrictions [16].
Economic dispatch is a centralized approach to determining the optimal scheduling of generators, known as unit commitment. Economic dispatch for micro grids presents a highly constrained non-linear, mixed-integer optimization problem that scales exponentially with the number of systems [17]. There are many different distribution generations as they are shown in the paper [18]. The distribution generations will show different features in the dynamic economic dispatch under different operation modes and scheduling strategies.
This paper considers different distributed generation systems as a main part to design a microgrid and the resources management is defined in a period through proposed dynamic economic dispatch approach. The inputs are obtained by the model predictive control algorithm considering variations of both pattern of consumption and generation systems capacity, including conventional and renewable energy sources. Furthermore, the proposed approach considers a benefits program to customers involving a demand restriction and the costs of regeneration of the pollutants produced by conventional generation systems. The dispatch strategy through a mathematical programming approach seeks to reduce to the minimum the fuel cost of conventional generators, the energy transactions, the regeneration of polluted emissions and, finally, includes the benefit in electricity demand reduction satisfying all restrictions through mathematical programming strategy.
If an assumption is made that Locational Marginal Prices (LMP’s) [19] are used to purchase power between the main grid and microgrid from a specific interface bus (given as γ ), then the total transaction cost for trading transferable power is C r ( P r t ) and is given as [3].
C r ( P r t ) = { γ c P r t , P r t > 0 Power   to   microgrid 0 , P r t = 0 Disconect γ v P r t ,     P r t < 0 Power   to   main   grid
where P r t is the transferable power between the microgrid and the main grid at time t . The objective function in the grid connected mode is thus to minimize the fuel cost of the conventional generators and the transaction costs of the transferable power, given by:
m i n { ( w ) [ t = 1 T i = 1 I C i ( P i , t ) + t = 1 T C r ( P r t ) ] + ( 1 w ) [ t = 1 T j = 1 J C b ( x j , t ) ] + t = 1 T i = 1 I k C k ( P i , t ) }
subject to the following constraints:
i = 1 I P i , t + P w t + P s t + P r t = D j , t j = 1 J x j , t
P i , m i n P i , t P i , m a x
0 P w t W t
0 P s t S t
P r m a x P r t P r m a x
D R i P i , t + 1 P i , t U R i
C k ( P i , t ) = α t β k P i , t
C b ( x j , t ) = y j , t + λ j , t x j , t
where w is the power weighting generated and exchanged, C r ( P r t ) is the transaction cost for trading transferable power at time t ; C i ( P i , t ) is the fuel cost of conventional generator i at time t function; P r m a x is the maximum power that can be transferred between the main grid and microgrid; T are the total number dispatch interval; I is the total number of the DGs in the microgrid, C k ( P i , t ) is the treatment cost of the k th class of pollutants, where y j , t is the value United States Dollars (USD) of monetary compensation the customer receives at time t .
The model is subject to the following constraints: constraint (3) is the power balance constraint and ensures that at any time t, the total power generated from the conventional, wind and solar generators and the power transferred from the main grid equals the total demand; constraint (4) is the generation limits constraint for the conventional generators and ensures that the generator limits are not exceeded; the third and fourth constraints are the generation limits constraint for the renewable generators (constraints (5) and (6)). They ensure that the optimal values for the wind and solar generators are less than or equal to the forecast or maximum values; constraint (7) is the limit for the transferable power between the main grid and microgrid. This is dictated by the physical characteristics of the transmission facilities between the main grid and microgrid; and constraint (8) is the conventional generator ramp rate limits constraint and ensures that the generator ramp rate limits are not violated. For the sake of simplicity, the conventional generator fuel cost in Equation (11) is assumed to be a quadratic function of the generators active power output [10] and is given as [3]:
C i ( P i , t ) = a i P i , t 2 + b i P i , t
The cost function of the client defined in (10) models the participation of this factor in the function to be optimized, which is related to its quadratic behavior of (12) that describes the cost incurred by θ client that reduces the consumption of energy in x kVA. In this work, it is assumed that the mathematical function is given as [20]:
C ( θ , x ) = ( K 1 x 2 + K 2 x K 2 x θ )
where K 1 and K 2 are cost co-efficients. θ is the customer type and is used to categorize the different kinds of customers based on their desire/readiness to curb electric power. θ is normalized in the interval 0 θ 1 , thus θ = 1 for the most willing customer and θ = 0 for the least willing.

4. Case Study

The proposed approach is shown in Figure 1 and consists of a micro grid consisting of three conventional diesel-based generators ( P 1 , P 2 , P 3 ), a wind energy conversion system (WECS) and a solar photovoltaic (PV) system. The interconnection to a main grid for energy transfer bidirectional ( P r ) and three clients ( D 1 , D 2 , D 3 ), are also considered an operating interval of 24 h. Where the decision variables are: x j , t , y j , t , P w t , P s t , P r t and P i , t . The configuration of the study microgrid is shown in Figure 1. In addition Table 1 shows the coefficients of the fuel cost function, the power output limits and the ramp values of conventional generators.
The bonus cost coefficients for customers, their classification and the maximum capacity for daily interruptability are shown in Table 2 [3].
The values for W t and S t were estimated based on the wind speed readings with an anemometer installed at a height of 8 m, as well as the stochastic and diffuse global irradiance detected per hour using the simplified inclined plane model at the location in 20°8′3.63″ N, 98°23′4.57″ W at 2181 m altitude above sea level. Table 3 shows the values of input data for each of the 24 periods t in the one-day analysis period, the energy that can be produced by wind origin W t , that of the photovoltaic plant S t , the demand total that must be met D t , the factors λ j , t of interruptibility for each client in the EDR program and finally the environmental contingency factor α t that defines the start or stop of the pollution regeneration system of the machines of the conventional generators. On the other hand, the paper considers the weighting of conventional generation costs and interconnection (w) with a value of 0.5, the cost is United States Dollar ($ USD) of kVA/h transferred with the main grid is asymmetric in such a way that the sale is $ 1 and the purchase costs is $ 2.8. The maximum capacities of the generating plants are W t , m á x 25 kVA, S t ,   m á x 22 kVA and the conditions of contract and installation only allow the maximum transfer of energy with the upper mesh of 14 kVA and the maximum budget bonus in EDR is $ 400.
The case study assumes the following situations:
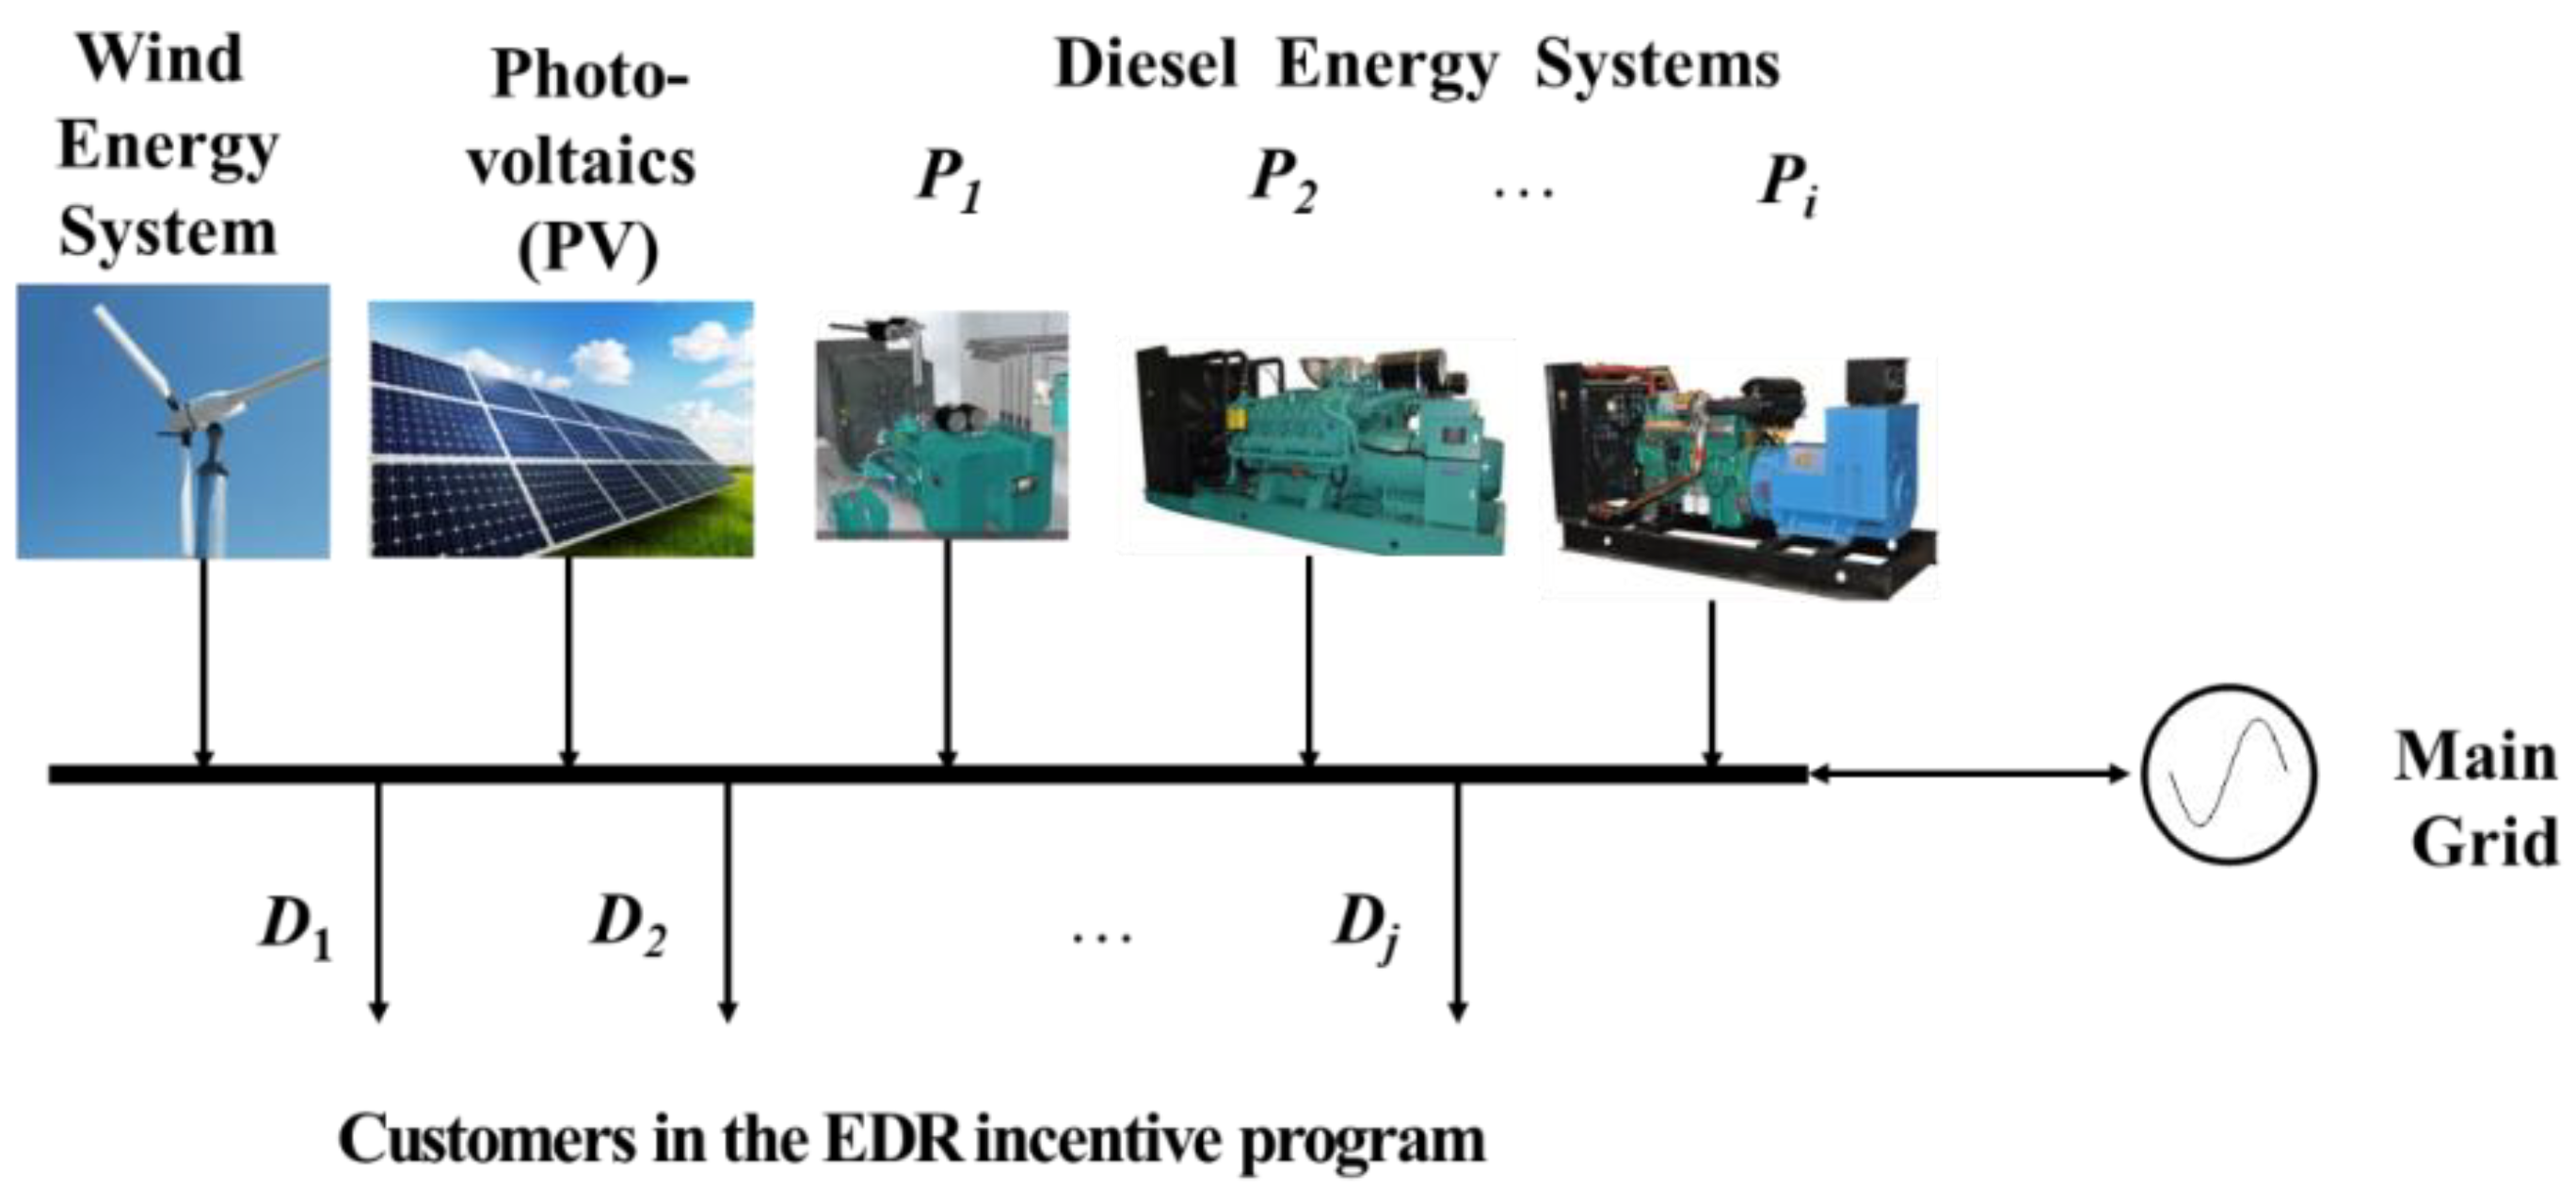
  • The microgrid is synchronized to the main grid.
  • Each element of the system has its self-protection devices working properly.
  • It is assumed that the microgrid contains instrumentation for monitoring and equipment for all control actions.
  • All generating plants operate in the ramp form and consequently contain their control system.
  • It has communication interfaces and protocols for proper operation in monitoring and management.
  • The load limitation values have been defined by the customer and do not affect the profitability of their operation in such a way that the resulting bonus represents a real benefit in the DR program.
  • The microgrid has access to a self-contained pollutant processing system that allows it to comply with the restrictions of the environmental contingency plan.
  • For the optimization analysis, a one-day study interval divided into 24 one-hour periods is considered.

5. Results

Solution to the problem of finding the minimum cost in the energy dispatch of the micro-grid proposed in Figure 1, which corresponds to the case study and which was based on the Economic dispatch algorithm with the Lingo program solver by means of quadratic regression that gave the results which are shown in Table 4. The source code of lingo is appended in Appendix A of this paper.
Table 4 shows the result of the optimization algorithm that defines the levels to which the energy transfer of each DG installed in the microgrid under study must be adjusted, where EDR indicates the total kVA energy that will be restricted to the demand in each of the lapses, x j , t indicates the quantity of demand that will restrict the client j . In the same way in Table 5 the results of the process for the EDR program are shown where y j , t refers to the USD monetary bonus that the client will receive for the aforementioned action.
Figure 2 exhibits the level of contribution of energy that each generator element must supply in the microgrid. Figure 3 presents the total demand levels according to the predictive control model, as well as the level of restriction of the demand and finally the level of dispatch that will had be in the microgrid that optimizes its operation in cost.
To establish the consistency of the proposed approach, we consider six particular cases. In Table 6 the particularities of each of them are exposed with respect to the base case.
Table 7 shows the results of the sensitivity analysis, in which the base case and six instances are compared.
Figure 4 exhibits the behavior of the energy dispatch comparing the base case and the proposed instances to analyze the behavior of the proposed approach. Figure 5 shows the behavior of the costs in the sensitivity analysis.
From the analysis of the cases we can establish: in the instance (b) to eliminate the asymmetry in the costs of commercialization with the upper grid it is observed that the originating energy increases of P r of 11.8 to 87.7 kVA with a slight variation in the conventional production and reduction in the total cost of the analysis period. In instance (c), when customers’ interruptability decreased λ t , the restricted energy and its bonus decreased from 309.9 to 83.8 USD with the imminent increase in total costs from 144.6 to 312.7 USD. In instance (d), by eliminating the priority of customers in DR plan, the values are kept with minimum adjustments that can practically be interpreted as unchanged. In instance (e) where the environmental contingency plan α t is eliminated, there is a notable increase in conventional production that goes from 427.7 to 574.5 kVA, the DR plan is used and energy is transferred to the main grid with the remarkable reduction of costs. In case (f) by increasing the environmental contingency plan to all the study periods now the conventional production goes from 427.7 to 158.6 kVA and the energy transferred from the main grid increases from 11.8 to 325.6 kVA, the DR plan it is maintained, which causes the total cost to increase greatly, going from 144.6 to 687.5 USD. Finally, in case (g), by increasing the energy transfer capacity with the upper mesh, conventional production is drastically reduced to 30 kVA with the consequent reduction of the total cost to 179.7 USD.

6. Conclusions

The improve operation of the analyzed microgrid is achieved due that the proposed problem formulation regards different variables and possible scenarios of loads and renewable energy generation capacity. In addition, electricity demand reduction plan, the air pollution and contingency case are considered to change if it necessary the energy management profile. The obtained results by the proposed algorithm in 24 periods of analysis in the study interval, guarantee that the output adjustment level of each generator of the microgrid can be defined in the best possible value. The use of the total capacity of the wind and photovoltaic systems is evident, since they do not imply any additional cost. Given the asymmetry in the purchase-sale price in the energy transactions with the primary electric power system exists periods when it is convenient to deliver (negative) energy. However, in the periods in which the environmental contingency occurs, it is recorded that conventional production is reduced giving priority to the maximum capacity of the alternative sources, later, the main grid with conventional generators with lowest pollution. The contribution levels are calculated with the proposed economic dispatch algorithm.

Author Contributions

S.-L.F.D., developed the mathematical model and performed the writing of Section 2 and Section 3. M.-P.H. and A.-M.O. provided technical advice in Section 3 and Section 4 and performed the writing of Section 1. T.-O.R. provided technical advice in Section 4 and support in the performed the writing of this section. Finally, all authors participated in the discussion and writing of Section 5 and Section 6.

Funding

This research received no external funding.

Acknowledgments

The support provided by the administration of the Popular Autonomous University of the State of Puebla (UPAEP), the Polytechnic University of Tulancingo (UPT) and CONACyT are appreciated.

Conflicts of Interest

The authors declare that there is no conflict of interest regarding the publication of this paper.

Abbreviations

Indices/Sets:
ISet of conventional generators i
JSet of customers connected to the micro-grid, client i connected to the micro-grid with EDR program.
TSet of periods for study t
KSet of pollutants to regenerate k
Parameters:
D R i lower ramp power limit of the conventional generator i
U R i upper ramp power limit of conventional generator i
a i quadratic coefficient of the cost function of the conventional generator i
b i linear coefficient of the cost function of the conventional generator i
D T t total demand in the microgrid in the time t
α t binary coefficient activation of the environmental contingency plan during at t time,
S t photovoltaic energy available in the period t
W t wind energy available in the period t
K 1 , j quadratic coefficient of cost function to the client j
K 2 , j linear coefficient of the cost function to the client j
θ j customer classification client j in DR program
C M j energy restriction of client j in DR program
λ j , t interruptibility factor of client j at time t in DR program
γ c purchase price of energy (kVA) from the main grid
γ v sale price of energy (kVA) from the main grid
β k is the coefficient of pollutant emissions in USD Kg/kVA [18]
Decision variables:
P i , t conventional generator i power at time t
P S t power production of the photo voltaic plant at time t
P W t power output of the wind power plant at time t
P r t power transferred with the upper main grid at time t
x j , t reduced energy per participating client j at time t
y j , t value of the monetary compensation for the client j at time t

Appendix A. Lingo Source Code Program

Model: ! Micro-network model 3 generators and 3 clients;
SETS:
Mc//: Pmin, Pmax, DR, UR, a1, b1;
hr//: DT, S, W, Pr, PW, PS, CPr, Alfa; Cte//: K1, K2, Tetha, CM; TPol//:Beta;
Pot(Mc,hr): P, CC, LRP;
Con(Cte,hr): X, Y, Lambda;
ENDSETS
DATA:
pcg = ;
PrCon = ;
PrVta = ;
PWm = ;
PSm = ;
Prm = ;
Pmin = ;
Pmax = ;
DR = ;
UR = ;
a1 = ;
b1 = ;
K1 = ;
K2 = ;
Tetha = ;
CM = ;
UB = ;
Beta = ;
Alfa = ;
S = ;
W = ;
DT = ;
Lambda = ;
ENDDATA
CALC:
@For( hr(t) : Gamma = @If( Pr(t) #GT# 0 , PrCon , -PrVta ) )
tmax = @Max( hr(t): t );
@For( Pot(i,t) : LRP(i,t) = @If( t #LT# tmax , P(i,t+1) - P(i,t) , P(i,t) ) );
@For( Pot(i,t): CC(i,t) = a1(i)*(P(i,t)^2) + b1(i)*P(i,t) );
@For( hr(t): CPr(t) = Alfa*Gamma*Pr(t) );
ENDCALC
Min = pcg*( @Sum( Pot(i,t): a1(i)*(P(i,t)^2) + b1(i)*P(i,t) ) + @Sum(hr(t): Gamma*Pr(t) ) ) + (1-pcg)* ( @Sum(Con(j,t): Y(j,t)-Lambda(j,t)*X(j,t) ) ) + @Sum(TPol(k): Beta(k)*@sum( Pot(i,t): Alfa(t)*P(i,t) ) ) ;
@For( hr(t) : @Sum( Mc(i) : P(i,t) ) + PS(t) + PW(t) + Pr(t) = DT(t) - @Sum( Cte(j): X(j,t) ) );
@For(Pot(i,t): @BND( Pmin(i) , P(i,t) , Pmax(i) ) );
@For(hr(t): @BND( 0 , PW(t) , W(t) ) );
@For(hr(t): @BND( 0 , PS(t) , S(t) ) );
@For(hr(t): @BND( -Prm , Pr(t) , Prm ) );
@For(Pot(i,t): @BND( -DR(i) , LRP(i,t) , UR(i) ) );
@For(Con(j,t): @Sum( Con(j,t): Y(j,t) − ( K1(j)*X(j,t)^2 + K2(j)*X(j,t) - K2(j)*X(j,t)*Tetha(j) ) ) >=0 ) ;
@For(Con(j,t): @Sum( Con(j,t): Y(j,t) − ( K1(j)*X(j,t)^2 + K2(j)*X(j,t) - K2(j)*X(j,t)*Tetha(j) ) ) >= @If( j #EQ# 1 , 0 ,
   @Sum( Con(j,t): Y(j−1,t) - ( K1(j−1)*X(j−1,t)^2 + K2(j−1)*X(j−1,t) - K2(j−1)*X(j−1,t)*Tetha(j−1) ) ) ) );
@For(Con(j,t): @Sum( Con(j,t): Y(j,t) ) <= UB ) ;
@For(Cte(j): @Sum( hr(t): X(j,t) ) <= CM(j) ) ;

References

  1. Tazvinga, H.; Xia, X.; Zhu, B. Model Predictive Control for Energy Dispatch of a Photovoltaic-Diesel-Battery Hybrid Power System. In Proceedings of the 19th World Congress the International Federation of Automatic Control, Cape Town, South Africa, 24–29 August 2014. [Google Scholar]
  2. Zhao, J.; Qian, J.; Han, K. A Novel Robust Tuning Strategy for Model Predictive Control. In Proceedings of the 6th World Congress on Intelligent Control and Automation, Dalian, China, 21–23 June 2006. [Google Scholar]
  3. Xia, X.; Nwulu, N.I. Optimal dispatch for a microgrid incorporating renewables and demand response. Renew. Energy 2017, 101, 16–28. [Google Scholar]
  4. Crijns-Grausa, W.H.J.; Guerrerob, J.M.; Vasquez, J.C.; Soshinskaya, M. Microgrids: Experiences, barriers and success factors. Renew. Sust. Energy Rev. 2014, 40, 629–672. [Google Scholar]
  5. Patidar, N.P.; Nema, R.K.; Paliwaln, P. Planning of grid integrated distributed generators: A review of technology, objectives and techniques. Renew. Sustain. Energy Rev. 2014, 40, 557–570. [Google Scholar]
  6. Gatsis, N.; Giannakis, G.B.; Zhang, Y. Robust Energy Management for Microgrids with High-Penetration Renewables. IEEE Trans. Sustain. Energy 2013, 4, 944–953. [Google Scholar]
  7. Wang, R.; Wang, P.; Xiao, G.; Gong, S. Power demand and supply management in microgrids with uncertainties of renewable energies. Int. J. Electr. Power Energy Syst. 2014, 63, 260–269. [Google Scholar] [CrossRef]
  8. Nicolay, P.; Velik, R. A cognitive decision agent architecture for optimal energy management of microgrids. Energy Convers. Manag. 2014, 86, 831–847. [Google Scholar]
  9. Zhou, H.; Wu, K. A multi-agent-based energy-coordination control system for grid-connected large-scale wind–photovoltaic energy storage power-generation units. Sol. Energy 2014, 107, 245–259. [Google Scholar]
  10. Hosseiman, S.H.; Gharehpetian, G.B.; Mohammadi, M. Optimization of hybrid solar energy sources/wind turbine systems integrated to utility grids as microgrid (MG) under pool/bilateral/hybrid electricity market using PSO. Sol. Energy 2012, 86, 112–125. [Google Scholar]
  11. Happ, H.H. Optimal power dispatch—A comprehensive survey. IEEE Trans. Power App. Syst. 1977, 96, 841–854. [Google Scholar] [CrossRef]
  12. Rahman, S.; Chowdhury, B.H. A review of recent advances in economic dispatch. IEEE Trans. Power Syst. 1990, 5, 1248–1259. [Google Scholar]
  13. Xia, X.; Zhang, J.; Tazvinga, H. Minimum cost solution of photovoltaic diesel battery hybrid systems for remote consumer. Sol. Energy 2013, 96, 292–299. [Google Scholar]
  14. Chen, S.; Zhou, Y.; Wang, J.; Cui, Y.; Wang, X. Optimal Dispatch of Microgrid with Combined Heat and Power System Considering Environmental Cost. Energies 2018, 11, 2493. [Google Scholar] [CrossRef]
  15. Zhang, H.G.; Huang, B.N.; Teng, F.; Li, Y.S. Distributed Optimal Economic Dispatch Based on Multi-Agent System Framework in Combined Heat and Power Systems. Appl. Sci. 2016, 6, 308. [Google Scholar] [Green Version]
  16. Elaiw, A.M.; Xia, X. Optimal dynamic economic dispatch of generation: A review. Electr Power Syst. Res. 2010, 80, 975–986. [Google Scholar] [CrossRef]
  17. Panossian, D.; Jabbari, N.; Traverso, F.; McLarty, A. Dynamic Economic Dispatch using Complementary Quadratic Programming. Energy 2019, 166, 755–764. [Google Scholar] [CrossRef]
  18. Liu, X.; Ding, M.; Wu, H. Dynamic economic dispatch of a microgrid: Mathematical models and solution algorithm. Int. J. Electr. Power Energy Syst. 2014, 63, 336–346. [Google Scholar] [CrossRef]
  19. Fahrioglu, M.; Nwulu, N.I. A soft computing approach to projecting locational marginal price. Neural Comput. Appl. 2013, 22, 1115–1124. [Google Scholar]
  20. Fahriog, M. Designing Incentive Compatible Contracts for Effective Demand Management. IEEE Trans. Power Syst. 2000, 15, 1255–1260. [Google Scholar] [CrossRef]
Figure 1. General outline of the case study.
Energies 12 00181 g001
Figure 2. Dispatch of each generator.
Energies 12 00181 g002
Figure 3. Demand behavior in the study case.
Energies 12 00181 g003
Figure 4. Behavior of the dispatch in the cases analyzed.
Energies 12 00181 g004
Figure 5. Behavior of costs in the cases analyzed.
Energies 12 00181 g005
Table 1. Cost coefficients and operating ranges in conventional generators.
i a i b i P i , m i n ( kVA ) P i , m a x ( kVA ) D R i ( kVA ) U R i ( kVA )
10.060.50413
20.030.250615
30.040.30918
Table 2. Cost coefficients to customers classification and interruptibility limits.
j K 1 j K 2 j θ j K j   ( kVA / h )
11.0791.32030
21.0781.630.4535
31.8471.640.940
Table 3. Input values for each study period in the analysis period.
t
(h)
W t
(kVA)
S t
(kVA)
D t
(kVA)
λ 1 , t
($/kVA)
λ 2 , t
($/kVA)
λ 3 , t
($/kVA)
α t
18.5035.81.73.72.70
28.5036.11.42.71.90
39034.72.23.21.80
47035.23.72.61.90
57.5035.54.53.82.30
68034.94.71.70.70
79035.15.12.31.41
811740.85.31.50.51
9121347.56.74.32.91
10101848.36.64.61.60
11102148.56.83.54.30
121021.551.16.24.24.80
131120.559.77.34.35.10
141419.561.77.86.35.40
15131958.10.53.55.50
16181956.65.25.36.10
17201752.76.85.35.61
18221650.75.76.16.31
1913742.64.82.64.50
2012039.43.93.64.20
2111034.83.84.23.90
228.5034.13.13.83.20
238035.22.52.32.80
248.5035.61.93.84.20
Table 4. kVA Energy dispatch of each distributed generator (DG).
t P W t P S t P 1 t ( kW ) P 2 t ( kW ) P 3 t ( kW ) P r t ( kW ) Total PowerEDR x 1 , t x 2 , t x 3 , t
18.50.04.08.012.00.833.32.50.01.21.3
28.50.04.08.012.01.734.21.90.00.81.1
39.00.04.08.012.0−0.432.62.10.01.01.1
47.00.04.08.012.01.832.82.40.50.81.1
57.50.04.08.012.00.732.23.30.91.21.2
68.00.04.08.012.00.732.72.21.00.50.8
79.00.00.35.03.014.031.33.91.61.01.2
811.07.00.03.51.914.037.43.31.70.71.0
912.013.00.02.10.914.0425.52.31.71.6
1010.018.04.08.012.0−8.143.94.41.91.51.0
1110.021.04.08.012.0−11.343.74.82.01.11.7
1210.021.54.08.012.0−9.346.24.91.71.41.9
1311.020.54.08.012.0−1.454.15.62.21.42.0
1414.019.54.08.012.0−2.455.16.62.42.12.0
1513.019.04.08.012.0−1.154.93.20.01.12.1
1618.019.04.08.012.0−9.651.45.21.21.82.2
1720.017.00.00.00.09.946.95.82.01.82.1
1822.016.00.00.00.06.944.95.81.42.12.3
1913.07.04.08.012.0−5.0393.61.00.81.8
2012.00.04.08.012.0−0.135.93.50.61.21.7
2111.00.04.08.012.0−3.831.23.60.61.41.6
228.50.04.08.012.0−1.331.22.90.21.21.4
238.00.04.08.012.01.233.22.00.00.71.3
248.50.04.08.012.00.132.63.00.01.21.7
Table 5. Results of the EDR program.
t y 1 , t y 2 , t y 3 , t
(USD)
10.03.44.0
20.01.92.9
30.02.62.8
41.01.82.9
52.03.53.5
62.30.91.6
74.92.73.5
85.21.52.3
98.56.05.6
106.25.02.6
116.73.16.8
125.24.27.8
138.04.48.4
149.58.89.0
150.03.19.3
163.26.410.7
176.76.49.5
184.18.311.1
192.51.87.2
201.23.26.6
211.14.26.0
220.43.54.8
230.01.54.2
240.03.56.6
Table 6. Parameters considered in the cases.
CaseConsidered Characteristics
a (Base case)All parameters of the initial study are considered.
bIt is considered a sale price γ v = $1 and purchases γ c = $1 in the transfer of energy with the main grid.
cIt is considered λ t = 0 as the interruptibility coefficient for all customers
dIt is considered θ j = 0 with the same priority for customers as well λ t = 0 in the EDR plan
eIt is considered α t = 0 without environmental contingency
fIt is considered α t = 1 in the 24 h with environmental contingency
gIt is considered γ v = γ c = 1, α t = 1, 24 h and P r m á x = 30 kVA
Table 7. Sensitivity analysis.
VariablesabcdefgStandard Deviation
D t (kVA)1044.71044.71044.71044.71044.71044.71044.70.00
P W (kVA)269.5269.5269.5269.5269.5269.5269.50.00
P S (kVA)198.5198.5198.5198.5198.5198.5198.50.00
P 1 (kVA)76.37676.676.7969.1037.75
P 2 (kVA)162.6160.5164.7165.319292.7066.42
P 3 (kVA)233.8170.6235.6236.1286.556.80106.38
P r (kVA)11.887.752.161.1−88.9325.6496.8202.94
x (kVA)92.38247.837.59192.579.922.66
y (USD)309.9257.196.183.8301.2308.3243.698.14
α t (h)5555024249.93
C T (USD)144.6123.7312.7321.612687.5179.7219.46
Iterations607362174159361274290150.58
Seconds1.120.330.280.220.240.190.20.33

