1. Introduction
The banking systems of developing countries tend to have a relatively high level of state control. Many scholars believe that this inhibits competition and the efficient redistribution of financial resources according to
Lee et al. (
2020) and
Le and Ngo (
2020). According to
Huang et al. (
2021) and
Mai et al. (
2022), developing countries should pursue a policy of deregulation and develop market mechanisms. However, the 2008 crisis and subsequent prolonged stagnation in the banking sector of developed countries, against the background of China’s significant economic success, force a new look at the regulation of financial institutions, competently combining administrative and market methods.
One important condition that central banks observe when regulating the banking system is the need to keep commercial banks interested in making profits. Control over the profitability of credit institutions can help in understanding how effectively banks of different types and sizes function, whether they need help, and whether changes in the existing mechanisms of market regulation are necessary. Central banks evaluate the profitability of individual banks using indicators such as return on assets and return on capital, and also pay attention to the share of profitable banks and the profitability of banks of different sizes and types, as indicated by
Capraru and Ihnatov (
2014) and
Lin and Zhang (
2009). Statistical and regression methods are used to assess the degree of influence of banking determinants on profitability (
Djalilova and Piesse 2016;
Saona 2016;
Tan 2017). This allows for us to understand the extent to which the central bank’s regulatory methods and changes in the economy will affect the activities of credit institutions.
It is important for the central bank to make sure that commercial banks are able to generate the expected profits for their owners and are interested in developing the banking business. To organize profitability control, the central bank needs to develop appropriate methods of analysis.
The profitability of the banking sector has a direct impact on the effective use of financial resources and the rational allocation of public resources (
Athanasoglou et al. 2008). The profitability of banks is a key element in ensuring the sustainability of the banking sector (
de Guindos 2019). Profitability measures the overall level of development and sustainable efficiency of commercial banks (
Vera-Gilces et al. 2020). The need to be profitable is spelled out in the Commercial Bank Law of China
1; the need to control the profitability of banks follows from the law on the People’s Bank of China
2.
In recent years, the profitability of commercial banks in China has significantly decreased as a result of slowing economic growth, increased competition from nonfinancial organizations, falling rates on financial markets, and tightening capital adequacy requirements.
The banking sector regulator, the People’s Bank of China, began to tighten capital adequacy requirements in 2011 and another liberalization of interest rates occurred in 2015. This complicates the activities of banks and requires efforts to ensure that commercial banks comply with regulatory requirements on the one hand, and on the other hand retain the ability to operate on market principles, and, above all, create profits.
The need to assess profitability from the position of regulatory and supervisory authorities and identify trends and reasons for changing the behavior of banks requires the development of scientific approaches that allow for these problems to be solved. As the results of a study by Chinese and foreign authors show, the stochastic frontier approach helps to significantly improve the assessment of the profitability of commercial banks from the perspective of their technological capabilities and the influence of managerial and environmental factors.
A feature of the stochastic frontier approach is the possibility to construct the production possibilities frontier of companies and determine each company’s distance from this frontier. Thus, it becomes possible to evaluate the effectiveness of all or most firms in the industry. The application of the stochastic frontier approach to assess the profitability of the Chinese banking sector requires that local features are taken into account. This is due to the allocation of groups of banks that focus on certain tasks and types of clients and have different levels of access to resources and different opportunities for the placement of assets. These groups are the conductors of the monetary policy of the state in certain areas of the economy.
We chose the period from 2012 to 2020 for this study. This period is characterized by important changes in the economy and the banking sector. In 2013, the Chinese government announced the launch of projects related to the export of capital to the countries of Asia, Africa and Latin America
3. During this period, there was a slowdown in economic growth, a significant decrease in interest rates in financial markets, the development of banking technologies on a digital basis, and the emergence of shadow banking. The noted changes affected the activities of banks and forced them to adapt to new conditions, which inevitably affected their profitability.
The movement of capital, especially within the framework of international and national infrastructure projects, contributed to the development of systemic banks and influenced their growth. Joint-stock banks also received the opportunity to increase the volume of their operations by servicing the growth of large companies, the growth of household incomes and their operations. Urban and rural banks were stimulated to grow by participating in programs to promote the development of urban and rural areas. Foreign banks mainly paid attention to the growing integration of the Chinese economy into the world economy.
Chinese and foreign scientists have paid attention to assessing the effectiveness of the banking system in different periods of its development (
Fu and Heffernan 2007). One can single out works (
Horrocks et al. 2008) that assess the success of Chinese reforms in the period up to 2012. They draw conclusions regarding the beginning of the process of transformation of the national banking system to market conditions. We did not find works on a later period, although serious changes occurred at this time, both in the PRC and in the world economy.
One feature of our analysis is an attempt to analyze the profitability of Chinese banks in the period from 2012 to 2020, taking into account internal specifics from the position of the central bank of China. This specificity is associated with the following features: the presence of different groups of banks with different levels of involvement in state regulation; the implementation of financial market reforms, which contributed to a radical reduction in market rates; the secrecy of data on the financial markets of China.
Therefore, in order to optimize the commercial profitability and profit efficiency of the Chinese banking sector, it is necessary to manage and improve the quality of banking assets. Therefore, this work is of great importance when studying the performance of listed banks in China and the factors influencing this.
The stochastic frontier approach can significantly improve the analysis of the profitability of the banking system. For China, this is of particular importance because of the need to evaluate the results of both reforms and the results of economic regulation, which may affect the interests of commercial banks.
The analysis of the profitability of the banking system should be based on its current level of profitability, which is determined by the current frontal boundary. The deviation of banks from this boundary allows for profitability trends to be determined. When analyzing profitability, it is important to consider the state of costs, which will allow us to determine the reason for the change in the state of profitability.
2. Characteristics of the Chinese Banking System from 2012 to 2020
2.1. The Structure of the Chinese Banking System
China’s banking system is characterized by a high degree of centralization and the presence of banks of various types
Mai et al. (
2022). Half of the assets of the banking system belong to large banks. The share of foreign banks is insignificant. Big banks also hold more than 60% of deposits and up to 50% of loans. The big banks are the core of the banking system, and they should be the focus of economic analysis. Basically, these are large national joint-stock commercial banks, which are owned by the state and are called state commercial banks
4 (SO). Their shares are traded on various world stock exchanges. The peculiarity of state-owned commercial banks is their focus on the financing of large infrastructure and projects that are important to the country. However, they successfully compete with other banks, carrying out banking operations with households and firms.
Political banks (PB)
5 are directly managed by the state and mainly provide banking services to state-owned companies. Their purpose is to stimulate the development of specific industries. Political banks do not operate with the aim of maximizing profits.
National joint-stock commercial banks (NJ)
6 meet the financing and savings needs of enterprises and households; they contribute to the formation of a competitive banking system. These banks are majority-owned by the state, either through government agencies or state-owned enterprises. These are relatively large credit institutions that have been corporatized by government order with the aim of creating market-oriented organizations, without government administration, for the benefit of shareholders.
Foreign commercial banks (FB), established as branches, subsidiaries or independent banks with foreign participation, focus on servicing projects involving the combination of domestic and foreign enterprises; they can help the customer develop a joint lending structure for domestic and foreign enterprises and provide services to customers related to foreign trade operations.
Rural commercial banks (RB) are joint-stock local financial institutions established by farmers, rural industrial and commercial enterprises, and corporate entities. Their main objective is to provide financial services for local farmers, agriculture and rural economic development, and to promote the coordinated development of the urban and rural economy. All the rural cooperative banks have been converted into rural commercial banks.
City commercial banks (CB) used to exist as urban credit cooperatives. Since 1995, the state council of China decided to establish city commercial banks in large and medium-sized cities. Most city commercial banks show flexibility and responsiveness to market changes compared to large banks, creating a strong attraction for enterprises with urgent capital needs. City commercial banks have the advantage that they are closely linked to the local economy and have a more detailed and accurate understanding of the lending capacity and performance of local customers.
The government can stimulate certain groups of banks to develop Infrastructure projects (state commercial banks play an important role here) to increase the wealth of rural regions (rural commercial banks play an important role here) and to develop business in cities (urban commercial banks). Therefore, the profitability of some banks can be high not only because of their efficient operation but also as a result of incentives from the state to promote their development.
Between 2012 and 2020, China’s banking system underwent significant changes. The period began with a slowdown in economic growth and a search for new ways to develop the economy. These paths were related to capital exports and implementation of large-scale infrastructure projects (
Li et al. 2023). The crash of 2015–2016 revealed problems that had accumulated in the financial sector, which required decisive intervention by the government
7. In 2018, trade relations with the US were deteriorating, leading to a decline in exports (
Yang et al. 2023). At the same time, foreign commercial banks were sharply reducing service revenues.
During this period, the mobile internet became increasingly popular and mobile payments and mobile e-commerce were becoming a way of life. The financial innovations represented by the mobile internet are having an impact on the banking industry. The work of
Scotta et al. (
2017) showed that digital innovation has had a significant impact on the long-term profitability of banks. The authors of
Zhao et al. (
2022) investigated the impact of fintech innovation on the performance of Chinese banks. They found that fintech innovation reduces bank profitability and overall asset quality, which is more pronounced among large state-owned commercial banks, but improves capital adequacy and governance efficiency.
2.2. Profitability of Chinese Banks in the Period 2012–2020
China’s economic growth has slowed since 2012, and long-standing structural contradictions continue to emerge: declining export prices for manufactured goods, lower real enterprise profits, lower fiscal revenue growth and increased economic risk potential (
Li 2020). In July 2013, the lending rates for banks and other financial institutions were fully liberalized. Banks were allowed to set their own lending rates, and, on 22 November 2014, the People’s Bank of China reduced the RMB lending and deposit rates of financial institutions using the base rate. In 2015, deposit insurance rules were announced (
Lee and Hsieh 2013) and China formally established a deposit insurance system. Despite a slowdown in economic growth, China’s interest rate liberalization reform was completed with further expansion of floating range of deposit rates and the introduction of a deposit insurance system.
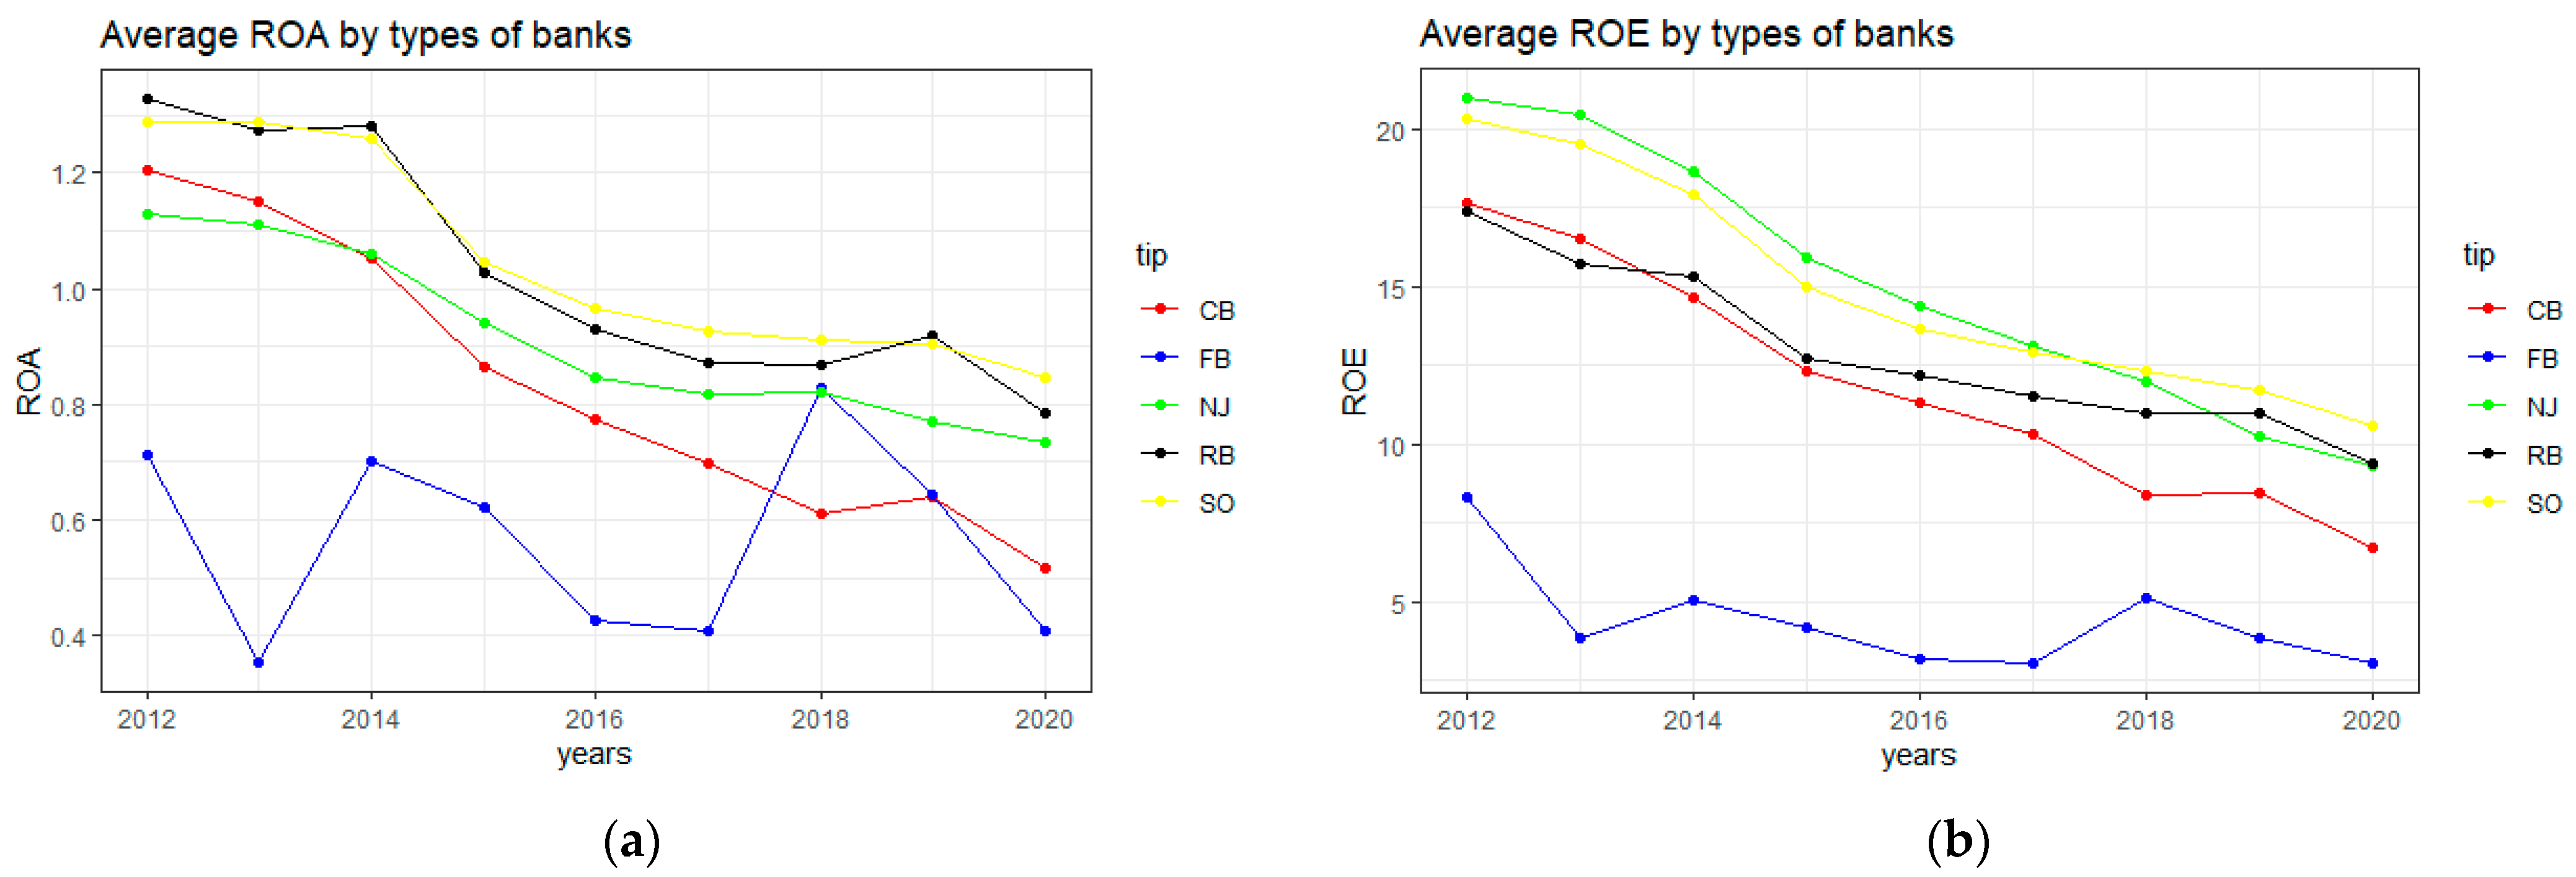
We show in
Figure 1, average ROA and ROE for China’s banking sector decline over the period 2013–2020. As a result of interest rate liberalization, bank profitability has declined (
Sun 2020), but the level of decline is in line with the standards of developed countries.
Interest rate liberalization (
Li et al. 2021) has allowed banks the autonomy to set their own deposit and lending rates. In a highly competitive environment, this has narrowed the spreads on the yield differential between attracted and lent resources and negatively affected banks’ profitability.
Since 2012, the Chinese government has understood that the further development of the economy and society cannot be confined to the production of goods and must move to a new level: the export of capital. The Belt and Road Initiative is a large-scale project to improve regional cooperation by improving connectivity between countries along the ancient Silk Road and beyond (
Li et al. 2023). As of February 2019, the Belt and Road Initiative has triggered an increase in transportation infrastructure investment in 96 countries along the Belt and Road since its inception in 2013. To service the construction of the One Belt, One Road initiative, Chinese banks are strengthening their financial support by developing relevant strategic plans, improving the structure of their institutions and service network, facilitating credit support for major projects along the One Belt, One Road region, and implementing business innovation, institutional innovation and managerial innovation.
During the period under study, banks in China had competitors in the form of companies that, along with their core business, offer a range of banking services to customers. We are talking primarily about the Alipay platform and Yu’e Bao, which have had a profound impact on the financial industry, but there are also other competitors (
Zhao et al. 2022). The growth of internet financing has attracted a significant portion of depositors’ funds to the companies in question, which will undoubtedly put significant pressure on banks, whose main form of income is interest.
For central banks, ROA and ROE are the most important indicators of profitability, as they show how banks generate profits under regulatory conditions. In the chart below, we analyze the average return on assets (ROA: how much net profit a bank generates per unit of assets) and average the return on equity (ROE: the bank’s ability to generate net profit from its net assets) for commercial banks in China over the period 2012–2020.
As noted, there has been a steady decline in bank asset returns over the past decade, but this has varied across bank types. There is a spread between rural banks, urban banks and joint-stock banks, possibly related to the stimulus processes undertaken by the government. National joint-stock commercial banks show a slower rate of decline than others, which suggests a relative increase in return on assets relative to other types of banks. City commercial banks show a steeper decline in returns than others; they are perhaps negatively influenced by the processes related to shadow banking and intrabank competition as discussed above. The Central Bank should perhaps pay attention to the development of banks in this sector. Foreign commercial banks show the movement of asset yields around the average value of 0.5%. This can be regarded as the lower boundary, within which the profitability of local banks can be reduced without affecting the financial stability of the credit institution.
Return on equity (ROE) considers the level of financial leverage and characterizes the profitability of bank owners, reflecting their level of interest in business development. The Central Bank is interested in creating the necessary conditions for the banking sector to be attractive to investors. The right part of
Figure 2 shows the dynamics of ROE for the observed period. It can be noted that foreign commercial banks show a level in the range of 3%. Chinese banks show a decline in ROE, which, as noted, was affected by the general decline in interest rates in the economy. The highest level of return on capital is shown by national joint-stock commercial banks, which seems to be due to their more effective management of the capital structure. This shows the success of measures to introduce market mechanisms into the banking sector. Rural commercial banks demonstrate good adaptation to market conditions. They manage to compensate for the overall decline in return on assets and show a weaker decline in ROE than other banks. Urban commercial banks show similar ROA and ROE dynamics.
Thus, we can observe a decline in profitability indicators in the banking system of China over the observed period. Most experts (
Huang 2020) see this as positive, associated with economic development and risk reduction. In this case, the use of SFA, which allows us to understand how banks are positioned relative to the production capacity boundary, allows for us to assess the effectiveness of banks in generating profits more accurately than traditional methods.
3. Literature Review on Banking Profit Efficiency and Cost Efficiency
In practice, two boundary methods are the most popular: the stochastic frontier approach (SFA) (
Aigner et al. 1997) and data envelopment analysis (DEA) (
Charnes et al. 1978). The SFA method is parametric; it describes the input–output relationship using production functions, such as the Cobb–Douglas function. The DEA method determines the production possibility boundary by constructing linear combinations of input and output parameters. Both methods show similar results and the choice of one of them can be related both to the preference of the researcher and the specifics of the data (
Avkiran 2011;
Wang et al. 2014;
Henriques et al. 2020). Since the late 1980s, several studies have been conducted to measure the profit efficiency and cost efficiency of banks. Estimates of banks’ profit efficiency and cost efficiency are important, and the results of the studies have important implications for bank practitioners and policymakers (
Silva et al. 2017).
DEA is a nonparametric approach and there is no concept of a production function in DEA analysis, but there is the concept of a production frontier. The DEA method determines the production possibility frontier by constructing linear combinations of input and output parameters (
Avkiran 2011). Using the DEA method to study the efficiency of 16 major commercial banks during banking reform in China (2003–2011),
Wang et al. (
2014) concluded that the overall efficiency of state-owned commercial banks was higher than that of joint-stock commercial banks before the reform, while the efficiency gap between state-owned and joint-stock commercial banks narrowed after the reform.
The SFA method is parametric and uses production functions such as the Cobb–Douglas function to describe the input–output relationship. Using the stochastic frontier approach, authors
Pasiouras et al. (
2009) studied 615 commercial banks operating in 74 countries over the period 2000–2004. The research showed that stronger banking supervision increases the cost and profit efficiency of banks. The authors of
Ngan (
2014) measured the cost and profit efficiency of 45 Vietnamese commercial banks in the period 2007–2012 using the stochastic frontier analysis (SFA) method, and the results showed that state-owned commercial banks (SCOBs) are more efficient in terms of profit efficiency than other domestic commercial banks (JSCBs) and foreign banks, while foreign banks are ahead of state-owned banks in terms of cost efficiency. The authors
Aielloa and Bonanno (
2016), using the stochastic frontier analysis (SFA) method, showed that cost efficiency was not related to market risk in Italian banks in 2006–2011, while profit efficiency was related to market risk. The cost efficiency of commercial banks is inversely related to loan diversification. The profits of Italian commercial banks are negatively affected by size. The authors
Dong et al. (
2016) examined the cost and profit efficiency of four types of commercial banks in China over the period from 2002 to 2013. The study shows that cost and profit efficiency increased for state-owned banks, joint-stock banks, foreign banks and city banks, and that banks were more profit-efficient than cost-efficient. Foreign banks are the most cost-efficient but the least profit-efficient. Using the stochastic frontier approach,
Bitar et al. (
2018) analyzed 1992 banks in 39 OECD countries over the period 1999–2013 and found that higher capital ratios may harm the banking efficiency and profitability of highly liquid banks.
In summary, our review of the literature on profit efficiency and cost efficiency in the banking sector reveals some mixed and contradictory results and research gaps. Since 2012, rural commercial banks have played an increasingly important role in the Chinese banking system, but existing studies have under-researched rural commercial banks in China.
Commercial banks in China vary in their ability to effectively apply banking technology. The choice of methodology may be related to the specifics of the data. In our study, we added the classification of Chinese commercial banks in China to the existing research analysis of rural commercial banks and used the SFA methodology because its results are illustrative and consider the inefficiency term.
4. Methodology
4.1. Empirical Method
In our study, we used the SFA method because its results are quite clear, it is robust to outliers, and it allows for us to build a boundary based on the most widespread use of the technology. Commercial banks in China differ in their effective application of banking technology and in their access to banking product markets, as well as having different sizes. In this case, focusing on the most widespread use of technology would provide a fairer estimate. Note that this assessment would be fair to banks when considered as separate entities, without taking into account their importance to the banking sector. This is important when creating a fair environment for all participants in the banking sector.
The stochastic frontier approach originally relied on a neoclassical theory of the firm, which attempts to explain the relationship between production (profits) and costs (
Aigner et al. 1997;
Coelli et al. 2005). Firms were assumed to operate in perfect output–cost markets and input prices were defined as exogenous. Competition leads to the price equalization of inputs and outputs. Subsequently, it was argued that profitability cannot be explained by production factors alone, but also by factors related to management, and the behavior of key stakeholders (
Silva et al. 2017;
Lee and Hsieh 2013). The application of frontier methods requires compliance with a number of requirements that are difficult to capture in real practice: all firms in the analysis are competing; the products are homogenous; all firms produce identical products and use identical resources; and firms have an identical function in converting resources into final products.
The stochastic frontier approach considers the set of firms as a set of technologies, which are characterized by the terms “input” and “output”, where inputs are resources and outputs are the products obtained by using these resources. They can be used to determine the boundary of production capacity at which firms use the minimum amount of resources to obtain the maximum volume of production (
Battese and Coelli 1995).
Berger and Humphrey (
1997) emphasized the advantages of effective frontier approaches compared to traditional performance measures, such as return on assets, because they take into account both the bank’s respective inputs and outputs and differences in the prices of inputs.
The SFA method assumes that not all components of the residuals of the production function built on the panel data are of a random nature and distinguishes nonrandom (u) and random (v) components in the residuals:
where
denotes the production at observation (t = 1, 2, …, T).
is a (1*k) vector of the values of known functions of production inputs and other explanatory variables associated with the i-th firm at the t-th observation. β is a (k*1) vector of unknown parameters to be estimated
8.
vit are random errors, which are distributed independently of the uit. uit are nonnegative random variables, associated with the technical inefficiency of production, which are assumed to be independently distributed. In most works on similar topics, it is assumed that the random component v has a normal distribution with a mean of zero, and component u has a semi-normal distribution; both quantities are independent. The parameter u is used to measure the production efficiency of individual organizations as part of their cumulative total, namely, to estimate the difference between the “output” of an individual company and the maximum possible output.
Historically, the scientific basis for the construction of production functions was the neoclassical theory of the firm, according to which, in a perfect market, firms had equal access to both resources and sales and competed with each other by reducing individual costs. As was shown later, this was not consistent with practice; in particular, the role of agents was not taken into account. The development of management theory led to an understanding of the role that managerial factors play in firm performance. The behavioral theory results led to an understanding of the importance of the harmonious development of an organization, consideration of the interests of all interested groups and influence of external factors. This is especially important for banks because the activity of these organizations is socially important; it is based on the trust of clients, is regulated and requires careful consideration of stakeholders’ opinions
9.
The impact of management and environmental factors can be accounted for in two ways: by adding determinants to the function (
Aiello and Bonanno 2013); by estimating the efficiency derived from the function using the production parameters and then estimating the impact of management determinants and environmental factors on efficiency (
Dong et al. 2016). Based on our data, we adopted the first approach, adding management parameters (Z) and environmental factors (E) to the function. The effect of environmental variables (e.g., GDP, inflation rate) on inefficiency were modeled together with a profit (or cost) frontier model. The profit and cost frontier models are represented below.
where y is the product (service) produced, w is the price, β is the function parameters,
is the profit of object i at time t, and
is the total cost of object i at time t. Z denotes the control parameters. v
p and v
c represent random components in the statistical error of Equations (3) and (4), u
p and u
c represent nonrandom components in the statistical error of Equations (3) and (4) associated with inefficiency. E denotes environmental parameters. The SFA method distinguishes between the nonrandom (u) and random (v) components of the residuals. The random component v has a normal distribution, and the component u has a semi-normal distribution, with both quantities being independent.
There are two different versions of the concept of profit efficiency, namely, standard profit efficiency (SPE) and alternative profit efficiency (APE) (
Berger and Mester 1997). Standard profit efficiency indicates how close a bank is to maximizing profits at a specified input and output price. It assumes that output markets are perfectly competitive. Alternative profit efficiency assumes that there is imperfect competition and, therefore, banks have some market power. APE measures how close a bank is to earning maximum profit by adjusting output prices and input quantities given a specific level of output and a specific input price. Due to the absence of reliable data on banks’ output prices and the existence of imperfect competition in the Chinese banking sector, we used alternative profit efficiency (APE) analysis in our study.
From Equations (3) and (4), profit efficiency is the ratio of actual observed bank profits to the maximum level of potential efficient bank profits. Cost efficiency is the ratio of the minimum level of potentially efficient banks’ costs to the actual observed level of banks’ costs. Profit efficiency and cost efficiency have a value between 0 and 1.
4.2. Variable Definitions
In the literature on bank efficiency, there are many ways to measure the inputs and outputs of banks: the production approach, the intermediation approach, and the operating approach
Coelli et al. (
2005).
Our study uses the intermediation approach. The intermediation approach, proposed by
Sealey and Lindley (
1977), views the bank as an intermediary that collects customer deposits and grants loans. The bank acts as an intermediary, collecting funds from savers and converting these funds into profit-generating items (loans, etc.). The approach is consistent with the concept of the bank as a financial intermediary and the data required to implement the approach are readily available.
Berger and Humphrey (
1997) highlighted the advantages of stochastic frontier methods compared to traditional measures of efficiency (e.g., return on assets) because they take into account both relevant bank inputs and outputs and differences in input prices; they believe that the intermediary approach is more appropriate for measuring the efficiency of the bank as a whole.
Profit before tax (P) is used as a measure of profit.
Total costs (C), i.e., the sum of overheads, interest costs and other operating expenses, are used as a measure of costs. There is no consensus as to which parameters should be used in the profitability function and the cost function. The opinion of the researchers is that some basic parameters characterize the production parameters, the management parameters and the environmental parameters.
Basic parameters (production parameters): The basic parameters outline the process of turning resources into final products. In general, the profitability and cost functions use loans, investments, and noninterest income as output parameters. The input parameters are labor prices and deposit prices.
Three groups of earning assets were used: loans, other earning assets and noninterest income (comprising mainly fee and commission income and investment income), which is consistent with current practice. These variables serve as the output parameters of the model. The input parameters (input prices: the price of loanable funds, the price of capital) described in the model are as follows.
Table 1 shows the selected variables (outputs and inputs), total costs (C) and total profits (P).
We believe that the stochastic frontier approach to assessing the profitability of commercial banks not only assesses the bank’s profitability relative to the leading banks in the industry but also takes into account the specific circumstances of the management techniques used and the market environment.
Control parameters. Risk management is a fundamental element of commercial banks’ management. Central banks regulate risks in the activities of commercial banks using capital adequacy risk, as recommended by BASEL 3.
Wanke et al. (
2022) provided a new perspective on the performance of banks in ASEAN member countries, arguing that capital adequacy and asset quality (especially credit quality) are key determinants of banks’ financial position and profitability. Bank management may expose the organization to high risk to provide higher profitability to investors. Bank liquidity and bank profitability interact (
Nicolae et al. 2015).
Abu-Alkheil et al. (
2018) found that liquidity risk affects the placing of some assets in a non-recoverable form, and reducing liquidity risk leads to lower profitability.
Klein and Weill (
2022) argued that banks’ profitability is affected by their asset size, which promotes economies of scale, and larger banks have access to cheaper resources and more reliable funding (
Vera-Gilces et al. 2020).
Table 2 shows the control parameters.
Environmental parameters: Environmental parameters are not controlled by bank management, but they affect a bank’s profitability.
Le and Ngo (
2020) and
Bitar et al. (
2018) argued that GDP growth leads to increased demand for production financing and affects the profitability of banks.
Vera-Gilces et al. (
2020) and
Nicolae et al. (
2015) argued that inflation and deregulation affect bank profitability.
Davis et al. (
2022) argued that market competition affects bank profitability;
Dong et al. (
2016) used time trends to reflect the technological change.
Table 3 shows the environmental parameters used in the analysis of the banking system.
4.3. Model Specification
Our profit efficiency frontier model is as follows.
where y1, y2, y3 are outputs; w1, w2 are the price of inputs;
,
,
,
,
,
,
are the parameters to be estimated. Using a translog, linear homogeneity also requires standard symmetry (
). u is the inefficiency of resource use; v is random error. lnP is the logarithm of total profits. The total profits (P) and input price terms are normalized by one of the input prices, w2, in order to impose a linear homogeneity of degree one on the input prices, W = w1/w2. When using the SFA model to analyze profitability, the observations in the panel data should not contain negative values. To ensure this, the profit values in the sample were adjusted based on the results of the study (
Aielloa and Bonanno 2016). Profit
10 figures were transformed by adding the absolute value of the minimum profit (
) for each bank plus one. After the transformation, the right side of Equation (7) looks as follows:
By substituting profit for cost
11 in the formula, we can obtain a cost function formula.
4.4. Data
Our sample covers 239 Chinese banks from 2012 to 2020, with annual data of 1719 observations in total. All banks with complete data for at least eight years were included in the analysis. We checked our data against the theoretical requirements and ensured that they were correct; incorrect data were removed. The sample included 6 state-owned commercial banks, 12 national joint-stock commercial banks, 61 rural commercial banks, 130 urban commercial banks and 30 foreign commercial banks (see
Table 4). The data for China for 2012–2020 were representative, covering more than 95% of the banking sector by asset size. The data were mainly taken from the ORBIS international database. All financial variables were measured in thousands of U.S. dollars. Data on GDP, inflation and stock market capitalization were taken from the Global Economy website (
https://www.theglobaleconomy.com/China/economic_growth/) accessed on 28 December 2022.
The sample included all state-owned commercial banks, national joint-stock commercial banks, and most foreign and urban banks. Rural commercial banks were represented by the most characteristic banks. The sample included banks whose total asset value was more than 95% of the total asset value of the banking system. PRC banks vary greatly in size. The average size of assets of systemic banks is 3447 billion US dollars; many of them top the list of the largest banks in the world. Joint-stock banks are much smaller but are nevertheless large and play an important role in the financial market. Foreign commercial banks are small in size; they are not involved in the transformation of assets, but mainly focus on service functions.
The main focus of our study was to analyze the efficiency of the profitability and costs of China’s commercial banks from the perspective of a regulator. The regulator is interested in the number of banks that are close to the production possibilities frontier and banks that are far from this frontier. It is important that as many banks as possible can generate profits at the level of the best technologies and management practices. Outsiders are the object of analysis of the determinants that affect their weak position. The regulator is interested in the dynamics of profitability and cost efficiency, which can help to reveal negative or positive trends, as well as the reaction of banks to reforms and external influences.
We did not consider issues related to the fulfillment of the theoretical requirements for the cost function and profitability function in detail. We checked our data for compliance with theoretical requirements and made sure they were correct. Outliers and incorrect data were removed; however, this did not significantly affect the sample size.
5. Results
Constructed regression equations showed high significance for the majority of determinants (see
Table 5), which allows us to conclude that we correctly determined the input and output production parameters, as well as the control parameters and external parameters
12.
To assess the significance of efficiency factors, we used the parameter γ (
Battese and Coelli 1992,
1995), which is the ratio of the change due to inefficiency to the total change in the residuals of the regression model. This indicates that the bank’s deviation from the efficiency frontier is due to inefficiency in the use of available resources:
and
represent the random error term v and the non-negative error term u, with a value γ between 0 and 1 (
Le et al. 2020;
Aiello and Bonanno 2013).
The closer the rate of change γ is to 1, the smaller the effect of the random error term v, which means that γ is determined by the nonnegative error term u. Conversely, the closer the rate of change γ is to 0, the more that the profit function and the cost function fail the test. The high value of the estimated γ parameter (0.65 for the profit function and 0.74 for the cost function) indicates that the vast majority of the residual variation is due to profit inefficiency and cost inefficiency effects, and strongly supports the use of the stochastic frontier model rather than the standard ordinary least squares (OLS) model.
The average profit efficiency of the banks in the entire sample was 0.8, indicating that most Chinese banks were close to the maximum possible profitability. However, the average cost efficiency of banks was 0.87. This suggests that banks are managing their costs efficiently. The difference in average profitability and cost efficiency can be explained by the particularities of the period under study, during which interest rates and capital adequacy requirements changed dramatically. Deposits, which account for the majority of commercial banks’ resources (approximately 70%), are classified as risk-free. Interest rates on loans, which also accounted for a large proportion of operating assets, included a risk premium. During this period, reducing financial risk would have had a greater impact on bank profits than on costs.
To analyze the dynamics of profit efficiency and cost efficiency, graphs were drawn up to show how these indicators change over time for different types of banks. This is important because different types of banks have different abilities regarding the use of banking technology, different levels of access to resources, and different asset allocation capabilities. For each group of banks, the average values
14 of the profit and cost efficiency indicator in a given year were estimated.
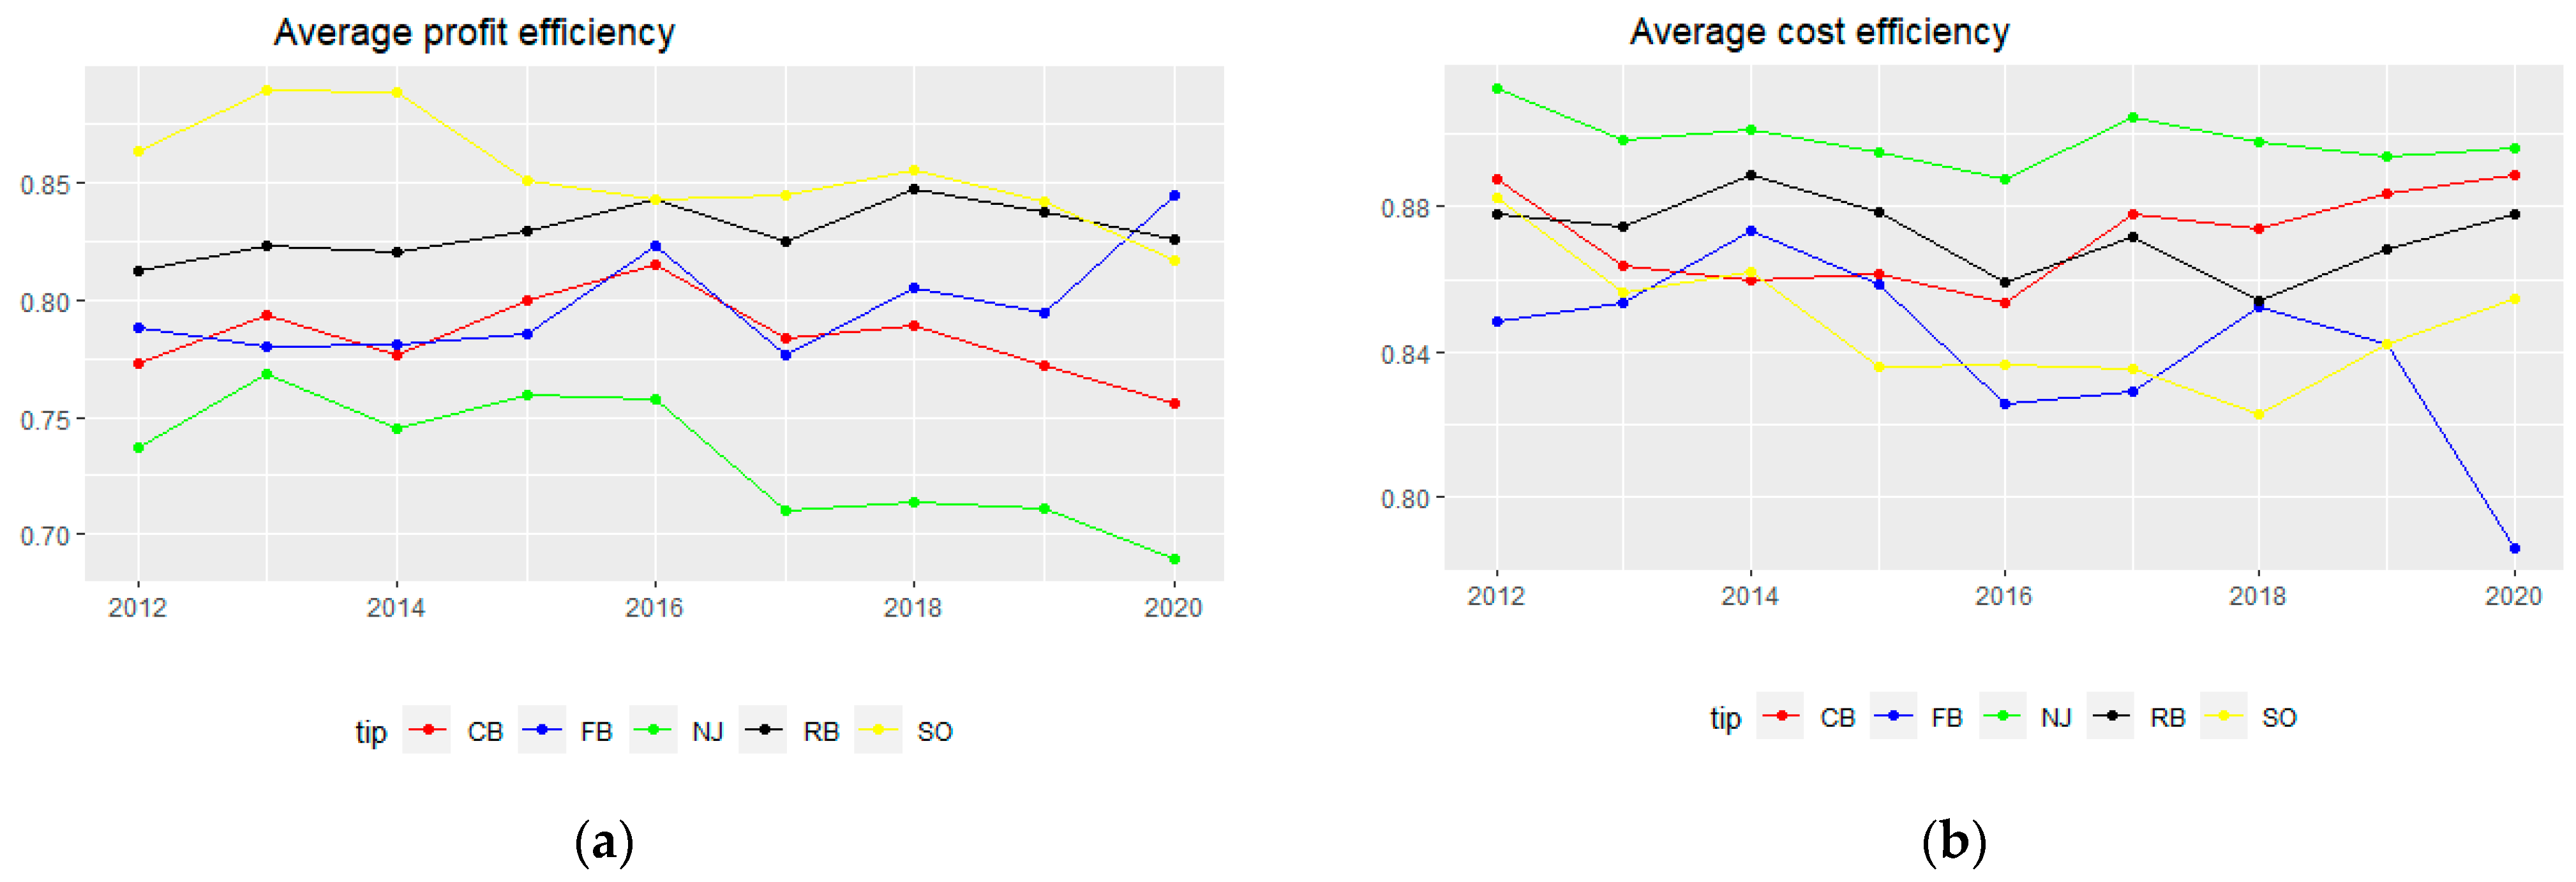
Figure 3, on the left, shows the dynamics of average profit efficiency by bank type, and on the right, the average cost efficiency by bank type. As can be seen from the left panel, the dynamics of profit efficiency can be divided into two phases. The first phase, from 2012 to 2016, is characterized by growth, and then the profit efficiency of Chinese banks starts to decline. In our view, this can be explained by the 2015–2016 stock market crisis in the Chinese financial market and the interest rate liberalization reforms. Foreign banks were less affected by this process. Before 2014, Chinese banks showed a multidirectional change in terms of cost efficiency. Between 2014 and 2016, cost efficiency declined sharply. Then, as the financial markets stabilized, an increase in cost efficiency could be seen in Chinese banks.
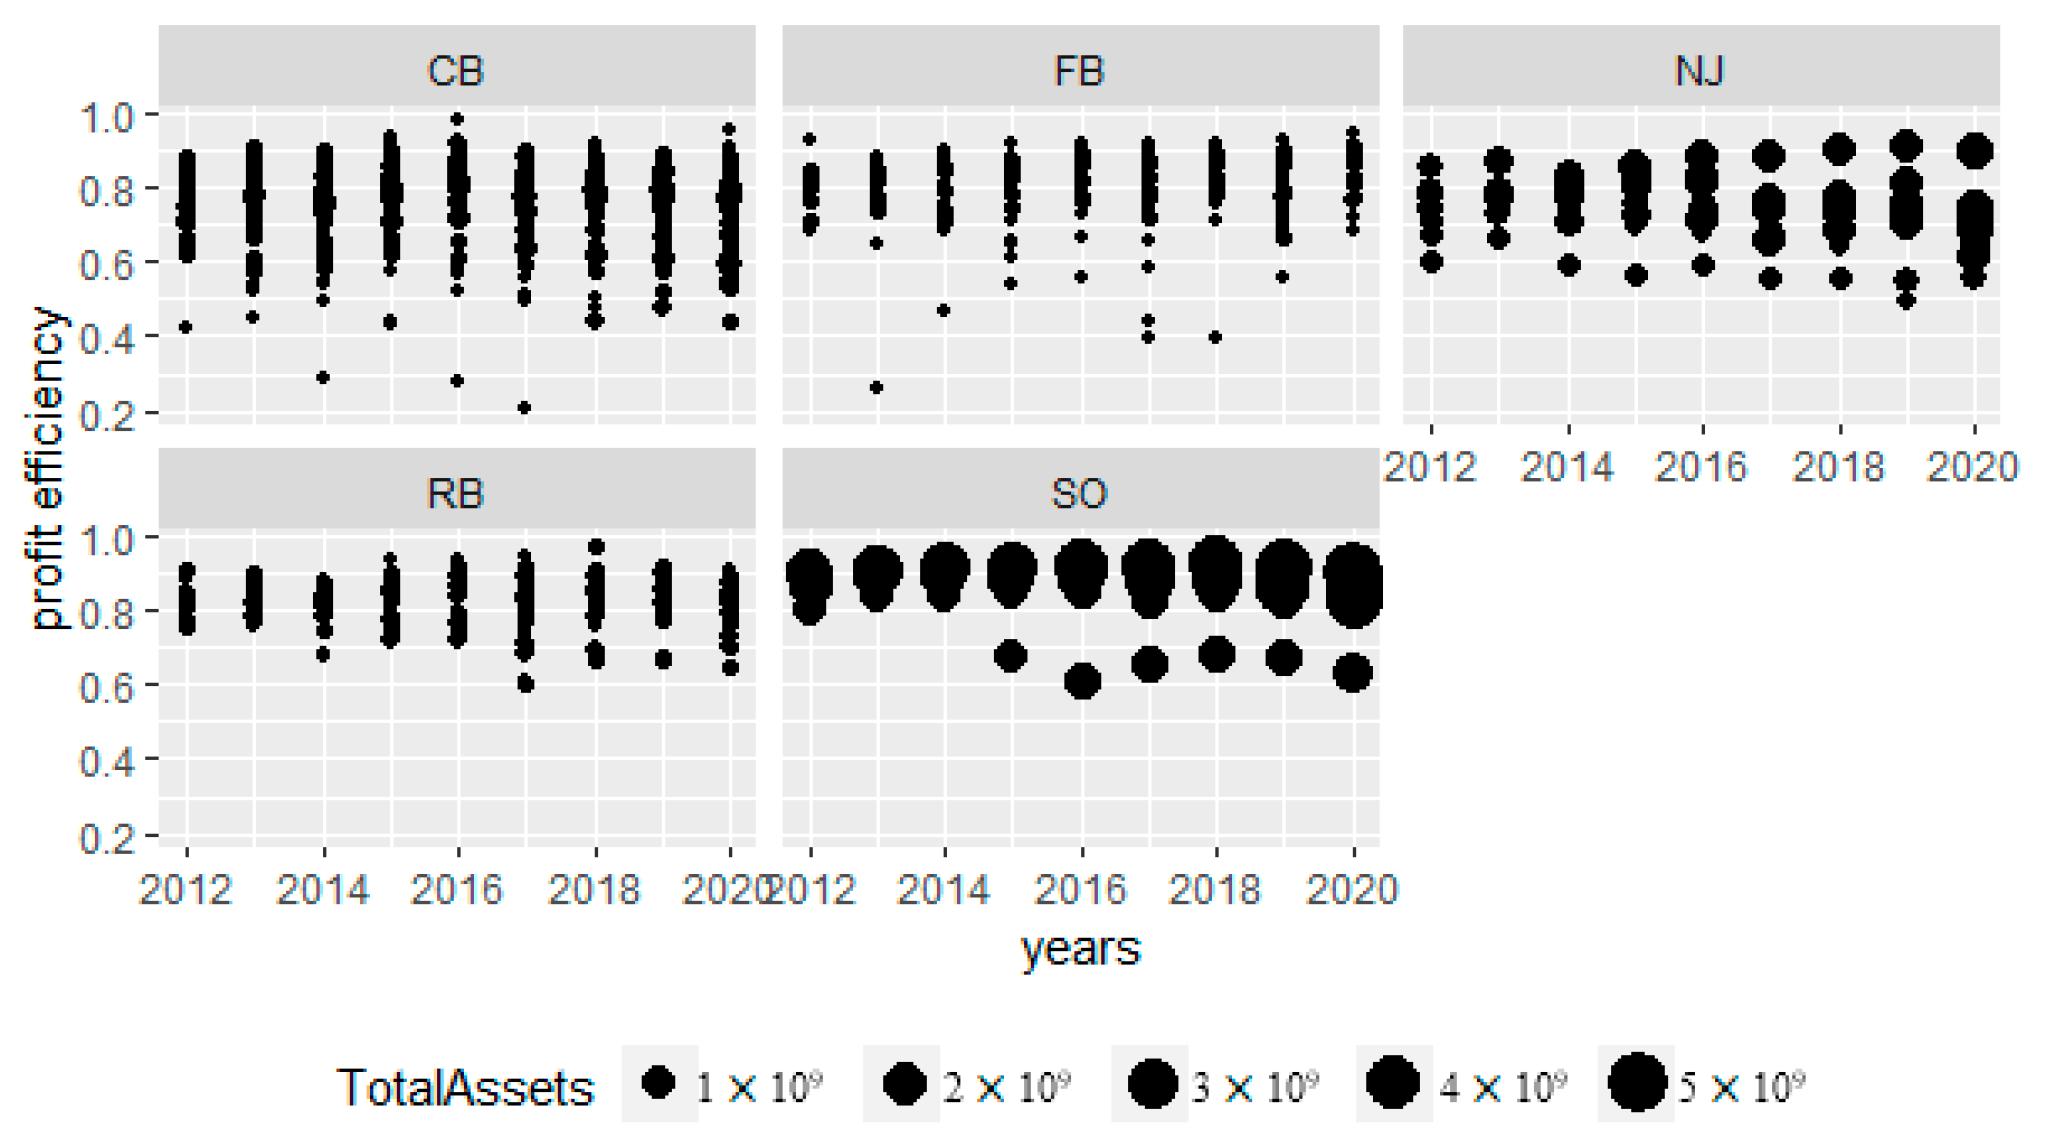
State-owned commercial banks, which had the highest profit efficiency relative to other types of banks during the study period, are steadily declining. Furthermore, as can be seen in
Figure 4, there is a clear distinction in size between state-owned commercial banks and other banks, which are significantly larger and do not deviate much from the average efficiency values, except for the Postal Savings Bank of China, the youngest state-owned bank. The decline in profit efficiency intensified after 2018, which can be attributed to rising problems in China’s international investments (Belt and Road Initiative), both for political reasons, such as trade issues between the US and China, and the general volatility of global markets. The cost efficiency of state-owned commercial banks has been relatively stable, but not the best. State-owned commercial banks do not need to improve their cost management and competitive resources. They have a high reputation for household and corporate activities and can also rely on national policy support.
National joint-stock commercial banks showed the lowest level of profit efficiency and negative dynamics for 2012–2020 overall; the decline has intensified since 2016. It is difficult for joint-stock banks, which cannot count on serious state support, to adapt to changes in a short time; moreover, they are forced to compete for markets with both systemic and city banks, as well as with shadow banking. However, these banks have the highest cost efficiency. It can be concluded that national joint-stock commercial banks are able to effectively manage their business but, due to drastic changes in financial markets and a slowdown in economic growth, they cannot fully control profitability.
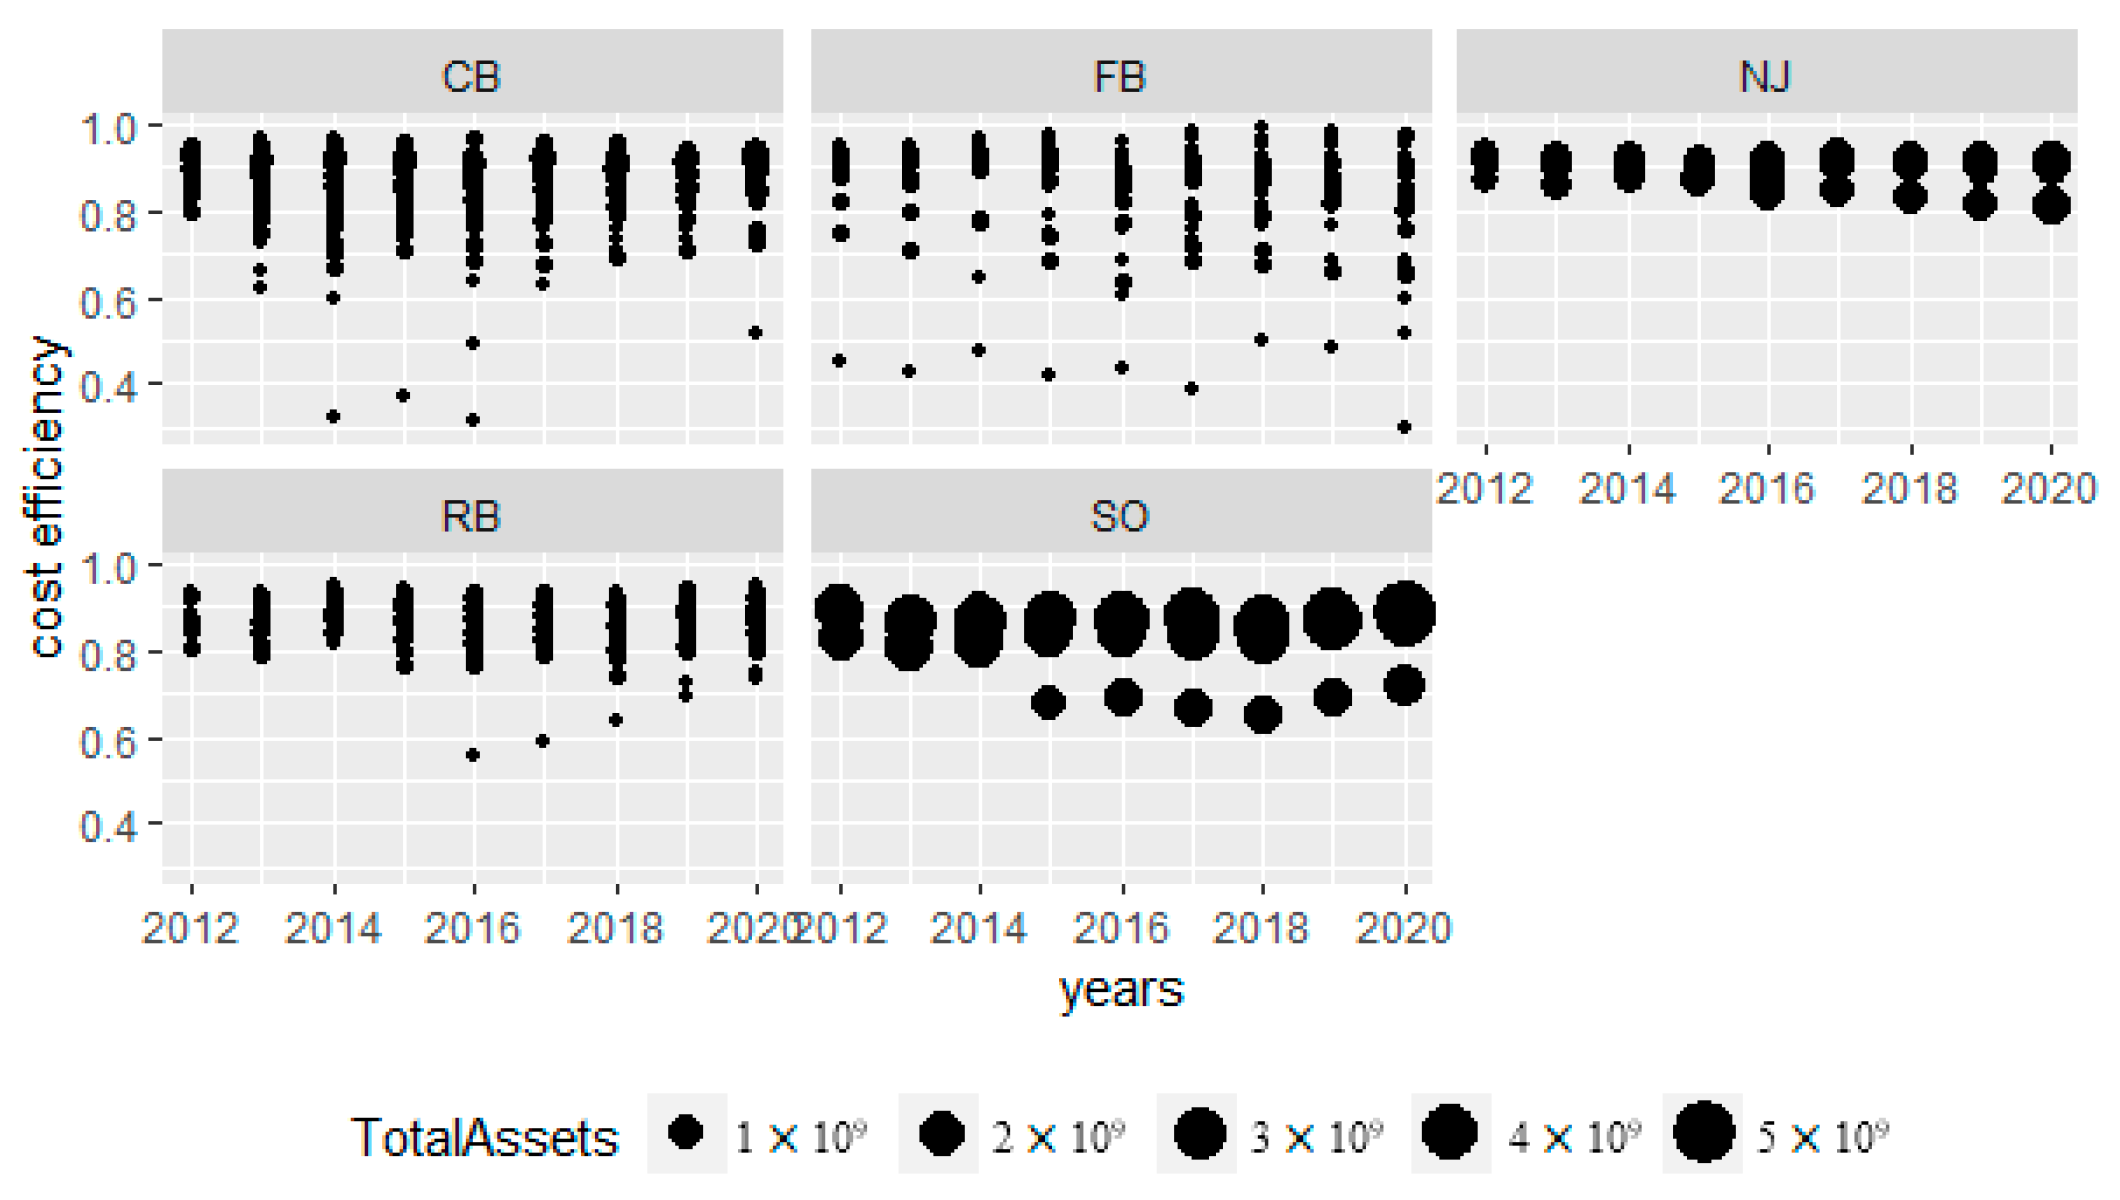
Figure 5 shows that this trend is not typical for all national joint-stock commercial banks; the general trend was affected by the decrease in the efficiency of some banks. It can be seen that, over time, the variability in both the profit- and cost efficiency of national joint-stock commercial banks increases relative to the average.
The profit and cost efficiency of city commercial banks are similar to those of national joint-stock commercial banks. There is a plausible explanation for this. These banks have similar customers and provide similar services. However, city commercial banks and national joint-stock commercial banks have different custom sizes. City banks work with small companies and individuals in smaller cities, where there is less competition from joint-stock banks and systemic banks. The volatility of profit efficiency increases for city commercial banks (
Figure 4), while the volatility of cost efficiency decreases (
Figure 5).
The profit and cost efficiency of agricultural commercial banks remained high and stable. In our opinion, the reason for this stability is related to the fact that the customers of these banks are linked to the domestic market and do not depend on external factors. Rural commercial banks use rather conservative products, such as loans and deposits and, less often, securities, depending on market factors. Rural development schemes are subsidized by the state, and this provides a stable income for rural commercial banks.
Figure 4 and
Figure 5 show that the assets of rural banks significantly increased over the observation period, with little change in the volatility of profitability or cost performance.
The efficiency of foreign commercial banks was stable and has been increasing since 2015. This can be explained by the fact that their core business is not tied to China’s lending rates; they do not need to adapt and the demand for their services from foreign companies is growing. As can be seen from the data in
Figure 4 and
Figure 5, for foreign banks, the variability in both profit efficiency and cost efficiency significantly increased. This indicates that foreign banks show different behavioral strategies in the Chinese market and have different competencies, related to the characteristics of their customers.
Thus, different types of Chinese banks, depending on their characteristics, show different behaviors as well as common variations. Profitability declined for both external economic and political reasons, as well as internal factors. In terms of the operation of the market mechanism and the development of competition, increased efficiency should be linked to both higher profitability and lower costs. Sound regulatory policies should work in tandem with market mechanisms. Therefore, if we want to assess the quality of banks and the quality of regulatory action in terms of profitability, it is necessary to examine the link between efficiency and related indicators (e.g., ROA).
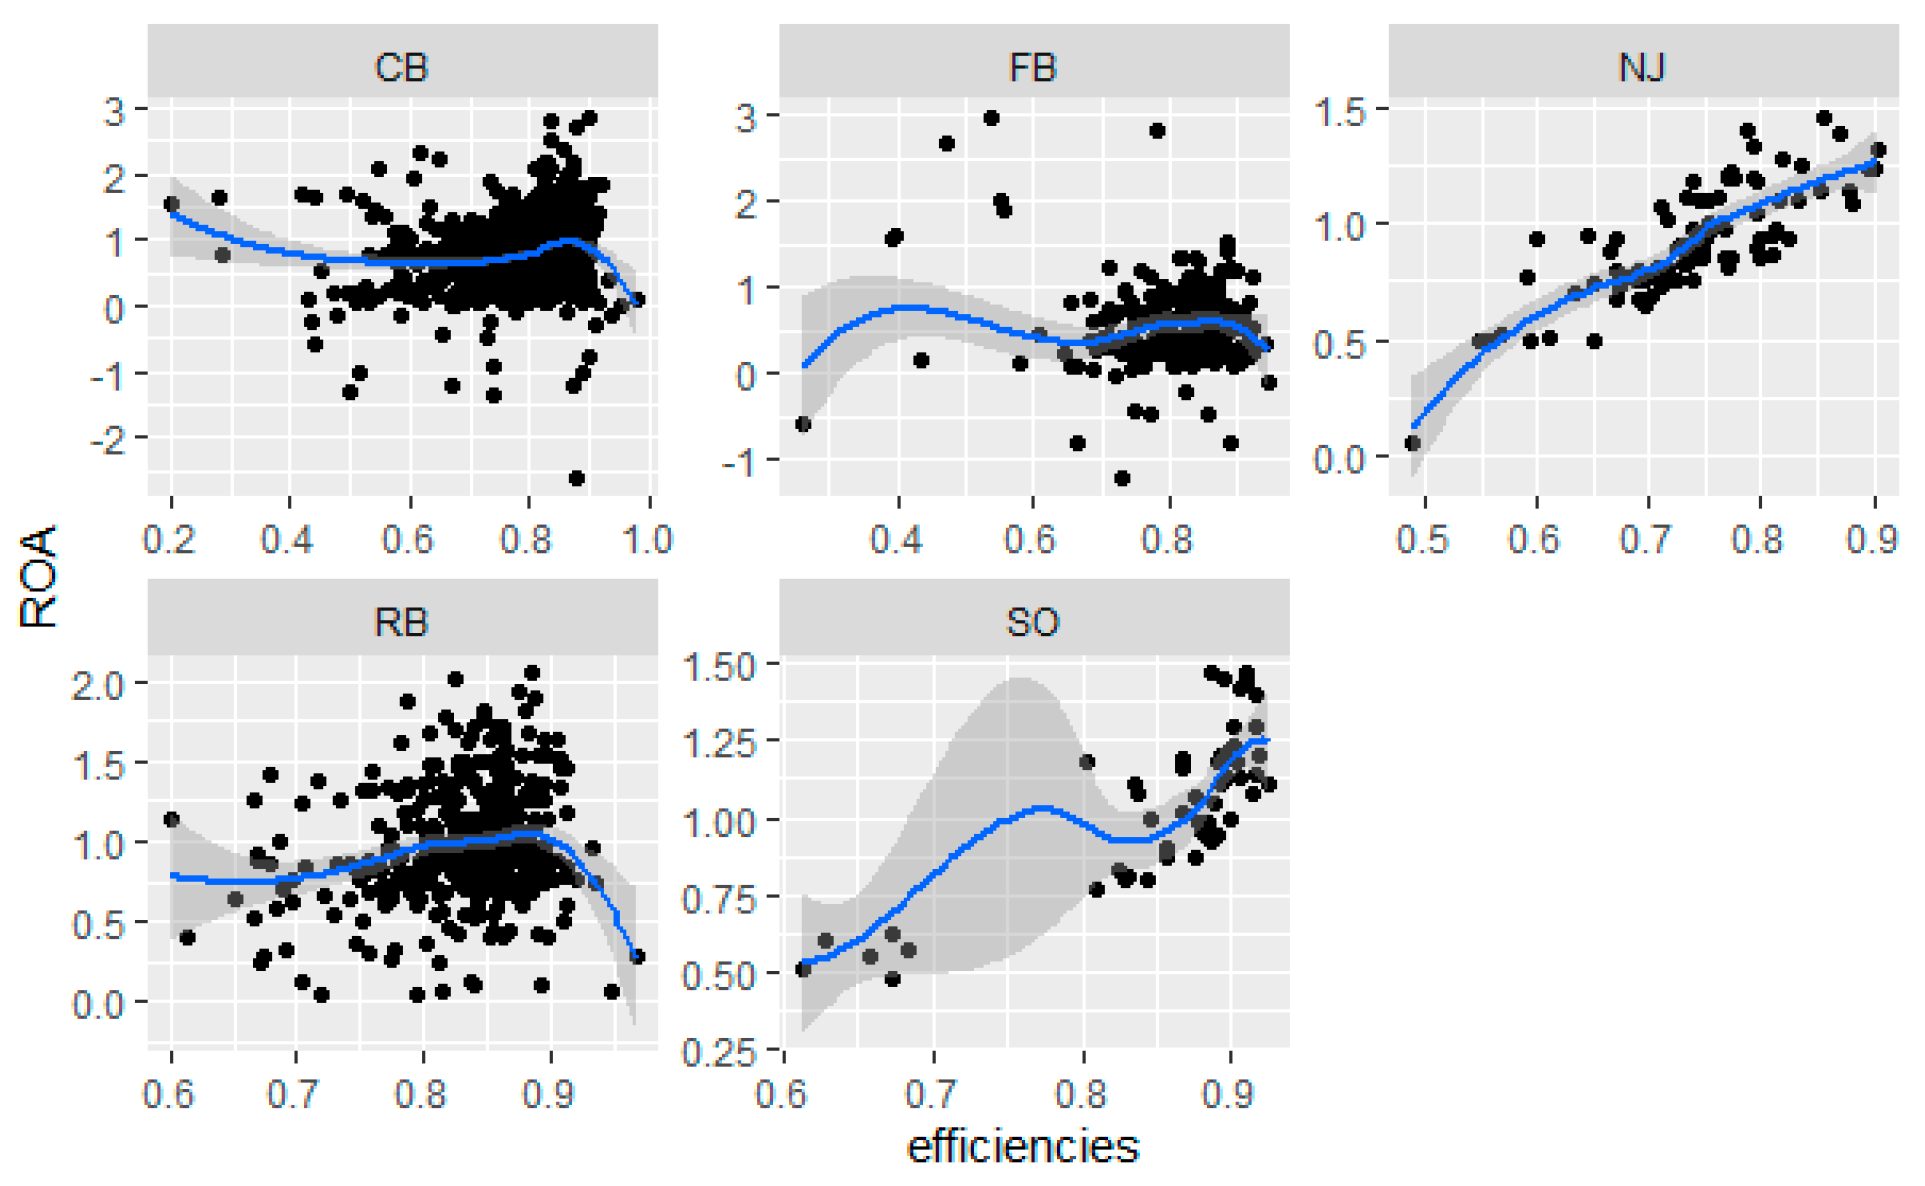
Figure 6 shows the relationship between return on assets (ROA) and profit efficiency performance. There is a strong positive correlation between return on assets (ROA) and profit efficiency for national joint-stock commercial banks. National joint-stock commercial banks were established as an important part of China’s market-based banking system to measure the role of market-based approaches in financial reform and banking sector reform. State-owned commercial banks also show high correlation between bank return on assets (ROA) and profit efficiency. However, rural commercial banks, foreign commercial banks and city commercial banks show no such relationship. It can be argued that foreign banks concentrate on service functions such as foreign and domestic trade settlement and do not pursue the goal of increasing profitability. Rural and city banks are quite heterogeneous and numerous and operate in distinctive niches (cities, small towns and rural settlements). The profitability of these banks depends on a variety of unique reasons, including innovation in banking financial products and government support. These banks have a short history and are undergoing a development process; the results will manifest in the future.
6. Conclusions
The Chinese banking system includes different types of banks with different resource acquisitions, asset allocations and technological capabilities. This specificity must be taken into account when analyzing profitability.
The studied period is characterized by instability due to the slowing economic growth, financial market instability, ongoing banking reforms and reorientation of the economy toward capital exports. It is important to understand how the banking system functioned during this period and whether regulatory intervention was necessary.
The findings suggest that Chinese commercial banks are adapting to the changes brought about by external changes and banking reforms.
Liu (
2017),
Li and Liu (
2019) and
Mott (
2022) have shown that interest rate policy affects the profitability of banks.
When characterizing the dynamics of profitability and cost efficiency by type of bank, the following points can be emphasized.
State-owned commercial banks lead in terms of profit efficiency; cost efficiency is also high.
After 2015, national joint-stock commercial banks had to compete for the market with systemic, municipal and shadow banks. This harmed their profitability. It can be concluded that national joint-stock commercial banks were able to manage their business efficiently but could not fully control their profitability due to dramatic changes in financial markets and the slowdown in economic growth.
The profitability and economic efficiency of city banks are similar to those of joint-stock banks. City banks work with small companies and individuals in smaller cities where there is less competition from joint-stock and state-owed commercial banks. China’s cities have a large concentration of manufacturing, logistics and financial institutions, all of which are increasing. City residents are financially literate and responsive to new banking products. This has forced city banks to improve their customer service techniques, which has affected their efficiency.
The profitability and economic efficiency of city commercial banks are similar to that of joint-stock banks. Urban commercial banks work with small companies and individuals in smaller cities, where there is less competition from joint-stock and system banks.
Foreign banks’ performance has remained stable and has been increasing since 2015. This can be explained by the fact that their core business is not tied to Chinese lending rates, they do not need to adapt to Chinese reforms, and the demand for services from foreign companies is increasing. The profit efficiency and cost efficiency of foreign commercial banks increased between 2012 and 2020.
Thus, different types of Chinese banks, depending on their characteristics, show different behaviors but follow some common trends. The decline in profitability is due to both external economic and political reasons, as well as internal factors related to changes in the structure of the stock market and financial sector reforms.
From the regulator’s perspective, the focus should be on the performance of joint-stock banks, as well as on the factors of deterioration in the efficiency of different types of banks. Given the increasing volatility of profitability and cost efficiency, it is necessary to understand the position of outsiders and the reasons for their declining efficiency.

 ,
, 


