Article

The Impact of Non-Financial and Financial Variables on Credit Decisions for Service Companies in Turkey

1
Department of Finance and Banking, Faculty of Business, Ankara Yildirim Beyazit University, 06760 Ankara, Turkey
2
Department of Business, Faculty of Business, Gebze Technical University, 41400 İstanbul, Turkey
3
Faculty of Mathematics & Statistics, Brock University, Toronto, ON L2S 3A1, Canada
*
Author to whom correspondence should be addressed.
J. Risk Financial Manag. 2023, 16(11), 487; https://doi.org/10.3390/jrfm16110487
Submission received: 11 September 2023 / Revised: 13 November 2023 / Accepted: 14 November 2023 / Published: 17 November 2023
(This article belongs to the Special Issue Financial Data Analytics and Statistical Learning)

Abstract

:
This study aims to analyze and generalize the factors influencing credit decision-making in Turkey’s service sector, which has seen substantial growth and increased dynamism post-2000, coinciding with accelerated economic development. The evolving competitive landscape and shifting consumer purchasing perceptions have led companies within this sector to seek differentiation strategies to attain a competitive edge. In this context, access to credit emerges as a crucial enabler for companies to expand and capture market share. The research focuses on the financial and non-financial characteristics of medium-sized service sector firms seeking credit, recognizing that both sets of variables play a pivotal role in the credit allocation process conducted by banks. The core of this study involves applying established assumption tests from extant literature, followed by an extensive regression analysis. The primary objective of this analysis is to identify and underscore the key financial and non-financial factors that significantly impact credit decisions in the service sector. By examining these variables, the study seeks to contribute valuable insights into the credit decision-making process, addressing the nuanced and varied nature of the service sector. This approach not only provides a deeper understanding of the sector’s credit dynamics but also assists in formulating more informed strategies for businesses seeking financial support within this evolving economic landscape. The primary conclusion reached by the study is that non-financial variables exert a greater influence on credit decision-making in the service sector compared to financial variables.

1. Introduction

Financial analysis plays a crucial role in understanding a company’s financial position and performance. By evaluating financial statement accounts and comparing them to established standards and industry averages, financial analysis allows for a comprehensive assessment of a company’s liquidity, financial structure, profitability, and activities. These kinds of analyses are also critical for understanding and assessing a company’s financial health. This involves evaluating the relationships among accounts in financial statements and interpreting them by comparing them with industry benchmarks and established standards. Financial analysis is an essential tool for understanding and interpreting a company’s financial statements (Konstantinidis et al. 2021).
Non-financial data collection and analysis are integral to credit assessment to determine the creditworthiness of borrowers and minimize credit risk (İş Bankası 2012; Vakıfbank 2011; Geçer 2014). Bolkvadze (2019) emphasizes the importance of analytical financial tools in financial analysis, particularly in the study of business entities. Ceran (2019) used financial ratios to predict non-performing loans (NPLs) in advance using artificial neural networks. Mbona, Masimba, and Kong (Mbona and Yusheng 2019) highlight the significance of financial statement analysis in understanding financial performance. Lam et al. (2021) propose an integrated entropy–fuzzy VIKOR model to evaluate the financial performance of construction companies, identifying ECONBHD as the best-performing firm.
Credit-granting decisions have been extensively explored in academic literature, particularly with a focus on small and medium-sized Enterprises (SMEs). Traditionally, these studies emphasize the importance of financial variables in credit decisions. Financial analyses and ratios are key indicators of a firm’s creditworthiness. However, recent research has also begun to stress the significance of non-financial variables (Jasevičienė et al. 2013).
Yan and Li (2023) introduced a credit risk prediction model for SMEs utilizing a decision tree trained on data sets combined with a linear programming approach. By integrating bank-specific constraints and objectives, the model aims to enhance the precision of credit risk quantification for banks.
Other studies explained that modern firms aim to enhance shareholder value by making decisions on various aspects, such as liquidity status, profitability, financial structure, investment projects, and technological adaptability. Financing decisions can influence firm value, with financial analysis providing information on ratio analysis, liquidity status, financial structure, asset utilization efficiency, and profitability (Altuğ 2010).
Another study investigates the importance of non-financial information in credit decisions, focusing on microentrepreneurs in China. It was discovered that non-financial data such as business characteristics, personal traits, and social relationships play a substantial role in the credit-granting process (Xu et al. 2019).
Similarly, Edem (2017) examined the role of non-financial data in making credit decisions in Macedonian commercial banks. The study revealed that, in addition to financial ratios, non-financial variables such as the company’s reputation, its relationship with the bank, market conditions, and the legal framework had a significant impact on credit decisions (Edem 2017).
Hossain (2023) reviewed the literature from 2016 to 2022 on Big Data analytics in banking and found that IEEE (The Institute of Electrical and Electronics Engineers) is the predominant publisher, with China as the major contributor. Hossain’s study highlights Random Forest techniques as dominant in credit risk management in the financial services sector while noting the need for further research on integrated algorithms.
Erdinç’s (2020) study investigated firm-specific and macroeconomic factors influencing the profitability of manufacturing firms listed on Borsa Istanbul between 2009 and 2019. A total of 129 firms were grouped by asset size, and 80 firms (20 large, 29 medium, and 31 small) were included in the analysis. Quarterly data from these firms were used, and regression analysis was conducted. The dependent variables are the active profitability rate, equity profitability rate, and pre-tax and interest profit (operational profitability) rates. The independent variables are company size, liquidity, asset structure, total debt ratio (leverage), GDP growth rate, and interest rates. The results of the research show a negative impact of the leverage ratio and fixed asset ratio on all profitability ratios, while the GDP growth rate had a positive effect (Erdinç 2020).
A systematic review of the literature provides a robust foundation for examining the impact of financial and non-financial variables on the credit decisions of middle-market companies in the service sector.
While the literature highlights the importance of both financial and non-financial variables in credit decisions, there appears to be a gap in studies that specifically focus on the service sector in Turkey. This study aims to fill this gap and provide a comprehensive understanding of the factors influencing mid-segment companies’ credit decisions in the service sector.
This study evaluates the impact of financial and non-financial features on the credit decisions of SMEs in the service sector. The motivation behind this study lies in the changing landscape of competition and consumer behavior, in which companies in the service sector strive to differentiate themselves to gain a competitive edge.
Although academic studies exist on the attributes of companies affecting credit decisions in Turkey, no study has been found to specifically reveal the attributes that are effective in the credit decisions of companies operating in the service sector. This finding reveals a deficiency in existing literature.
Therefore, the findings of this study contribute to the existing research by shedding light on certain financial and non-financial features that significantly affect credit decisions for mid-segment service sector companies in Turkey. To accomplish this, we conducted a comprehensive analysis of a diverse range of financial and non-financial variables. Statistical techniques and models are used to assess the relative importance and impact of these variables on credit decisions.
This study emphasizes the pivotal importance of a multifaceted array of variables, encompassing financial components, financial ratios, and non-financial data, in molding the credit decisions of enterprises operating within the service sector. While a vast body of literature has delved deeply into the importance of financial and non-financial variables in credit decisions, what remains conspicuously under-explored is the specificity and nuanced understanding of the service sector in Turkey, especially with respect to mid-sized firms. Given the burgeoning role of the service sector in the Turkish economy and its intricate interplay with global market dynamics, this research emerges not just as a filler of an academic void but as an imperative. Our study is novel in its targeted focus on this particular segment, offering insights that transcend conventional binary distinctions of financial and non-financial variables. The contributions of this research are multifaceted. First, it bridges a gap in understanding the unique dynamics of the Turkish service sector. Second, it provides a granular analysis, juxtaposing a myriad of variables to ascertain their influence on credit decisions. Last, our findings will serve as a pragmatic guide for financial institutions, equipping them with a refined lens to evaluate creditworthiness. We believe that this nuanced understanding can foster more resilient, sustainable, and inclusive financial ecosystems in the region.

1.1. Financial Analysis

Financial analysis plays a vital role in financial decision-making by collecting and interpreting data to evaluate the financial performance of businesses. This is important to companies, banks, and governments because it provides a foundation for effective financial planning. Planning activities cannot be conducted effectively without comprehensively analyzing a company’s financial situation. Additionally, financial analysis is important for governments and organizations that consider lending, partnering, taxing, and investing in businesses.
Basic financial statements such as balance sheets and income statements were first examined during the credit process. Other auxiliary tables were used to determine whether the companies were suitable for credit.

1.2. Financial Statement Items and Ratios

Banks request financial and non-financial data from companies that apply for credit during their credit processes. Non-financial data consists of information about the company’s standing with other banks and in the market, whereas financial data comprises balance sheets and income statement items, financial ratios, and sectoral ratios. Financial ratios are optional because they consist of balance sheet items. In other words, they vary on a sectoral, regional, and firm basis. Therefore, depending on the company and sector, different ratios can be produced and used for each credit evaluation.
Ratio analysis examines the partial relationships between items in financial statements and provides information on the financial condition of a business. This ratio is a mathematical expression of the relationship between two items in financial statements. The calculated ratios were typically expressed as percentages. It is possible to calculate a large number of ratios to indicate the relationships among financial statement items. However, rather than calculating a large number of ratios in a ratio analysis, it is more meaningful to focus on the ratios that have meaningful relationships with each other.

1.3. Non-Financial Analysis

Non-financial credit data, also known as intelligence data, are beneficial for getting to know customers well and making accurate, quick, and safe decisions. If the demands of a customer who is not well known cannot be met accurately and safely, the margin of error in the decision to be made is high. When evaluating customer credit requests, it is necessary to consider non-financial data to reach correct and safe decisions. The purposes of using non-financial data in banking can be summarized as follows: to obtain information and opinions about the general conditions of businesses, to discipline credit preparation based on certain procedures and principles, and to ensure that credit risk is eliminated or reduced by determining the business’s ability to pay.
There are a number of reasons why non-financial variables can be important predictors of credit risk. First, non-financial variables can provide insights into borrowers’ motivations and intentions. For example, a borrower who is unemployed and has a history of loan default is more likely to default on a new loan than a borrower who is employed and has a good credit history (World Bank 2014).

1.4. Credit

Economically, credit refers to the purchasing power of legal and real persons. The main reason why various transactions that differ from each other are gathered under the name of credit is because all of these transactions include providing “purchasing power” to the other party (Yürük 2006, p. 63).
We examine the relationship between total credit volume and economic growth in two ways. The first of these empirical studies is the evolution of credit volume as an indicator of financial development or credit to the private sector as a ratio of gross domestic product, and the second focuses on the relationship between direct credit volume and economic growth. With the inferences of these studies and the increase in financial instruments and institutions, the results show that financial development increases, and consequently, economic growth is supported (Mercan 2013, p. 57).

1.5. Service Industry in Turkey

In the information age, and owing to the dynamic components of other sectors, services are rapidly growing in importance in Turkey and the global economy. For these reasons, Turkey has adopted a change in its sectoral structure in the planned development model that has been implemented since the 1960s as an important objective, and plans have been prepared within this framework. Since the 1980s, Turkey has increased industrial activities while entering a period of globalization, and with the economic transformation of the 2000s, the importance of the service sector and its role in the economy has increased (İnamoğlu 2013, p. 2).
In the first section of this study, credit, financial items, financial ratios, and non-financial data are introduced, and the service sector is delineated. In the second section, the study’s objectives, research design, data structure, hypotheses, detailed information about the data set, sampling methods, and analytical techniques are elaborated. The third section encompasses normality tests, correlation analysis, regression analysis, and hypothesis tests, all serving the main objectives of the study. In the concluding section, the study’s key takeaways are discussed, results are analyzed and interpreted, and recommendations for future research are presented.

2. Methodology and Data

2.1. Aim of the Research

Financial and non-financial analyses play a significant role in credit decisions in the service sector. Given the substantial impact of both types of analysis on credit decisions, companies in today’s service sector not only seek credit from banks but also consider them stakeholders for growth. Over the years, the symbiotic relationship between a company and a bank has had a considerable positive impact on the survival and growth of the company as well as on the bank’s earnings.
This study evaluates the significance and impact of financial and non-financial analyses on credit decisions in Turkey’s service sector. This study focuses on identifying the most influential financial and non-financial variables among various options. This study aims to ascertain which types of data—financial or non-financial—are more critical to banks’ credit decisions. This study seeks to contribute to firms’ healthy growth strategies and efforts to reduce non-performing loan (NPL) rates by understanding the effectiveness of the various metrics and ratios used in banking practices.
The first section provides a brief introduction to the research topic and outlines its objectives. The second part includes a literature review covering financial and non-financial analyses, credit, and the service industry. This section establishes the theoretical framework by elaborating on financial ratios and key non-financial variables and detailing their importance in credit decision-making within the service sector.
The section on research design and methodology outlines the study’s purpose, scope, methods, and model. Credit decisions serve as the dependent variable, whereas financial and non-financial characteristics are selected as independent variables based on expert opinions. The experts consulted four credit process analysts with at least five years of experience in the bank from which the data were sourced. This section also describes the data collection methods, metrics employed in the study, statistical analysis techniques, and characteristics of the variables under investigation. The conclusion offers answers to the research hypotheses and presents the major findings. We also discuss the contributions and limitations of this study to the existing literature.

2.2. Research Methodology and Design
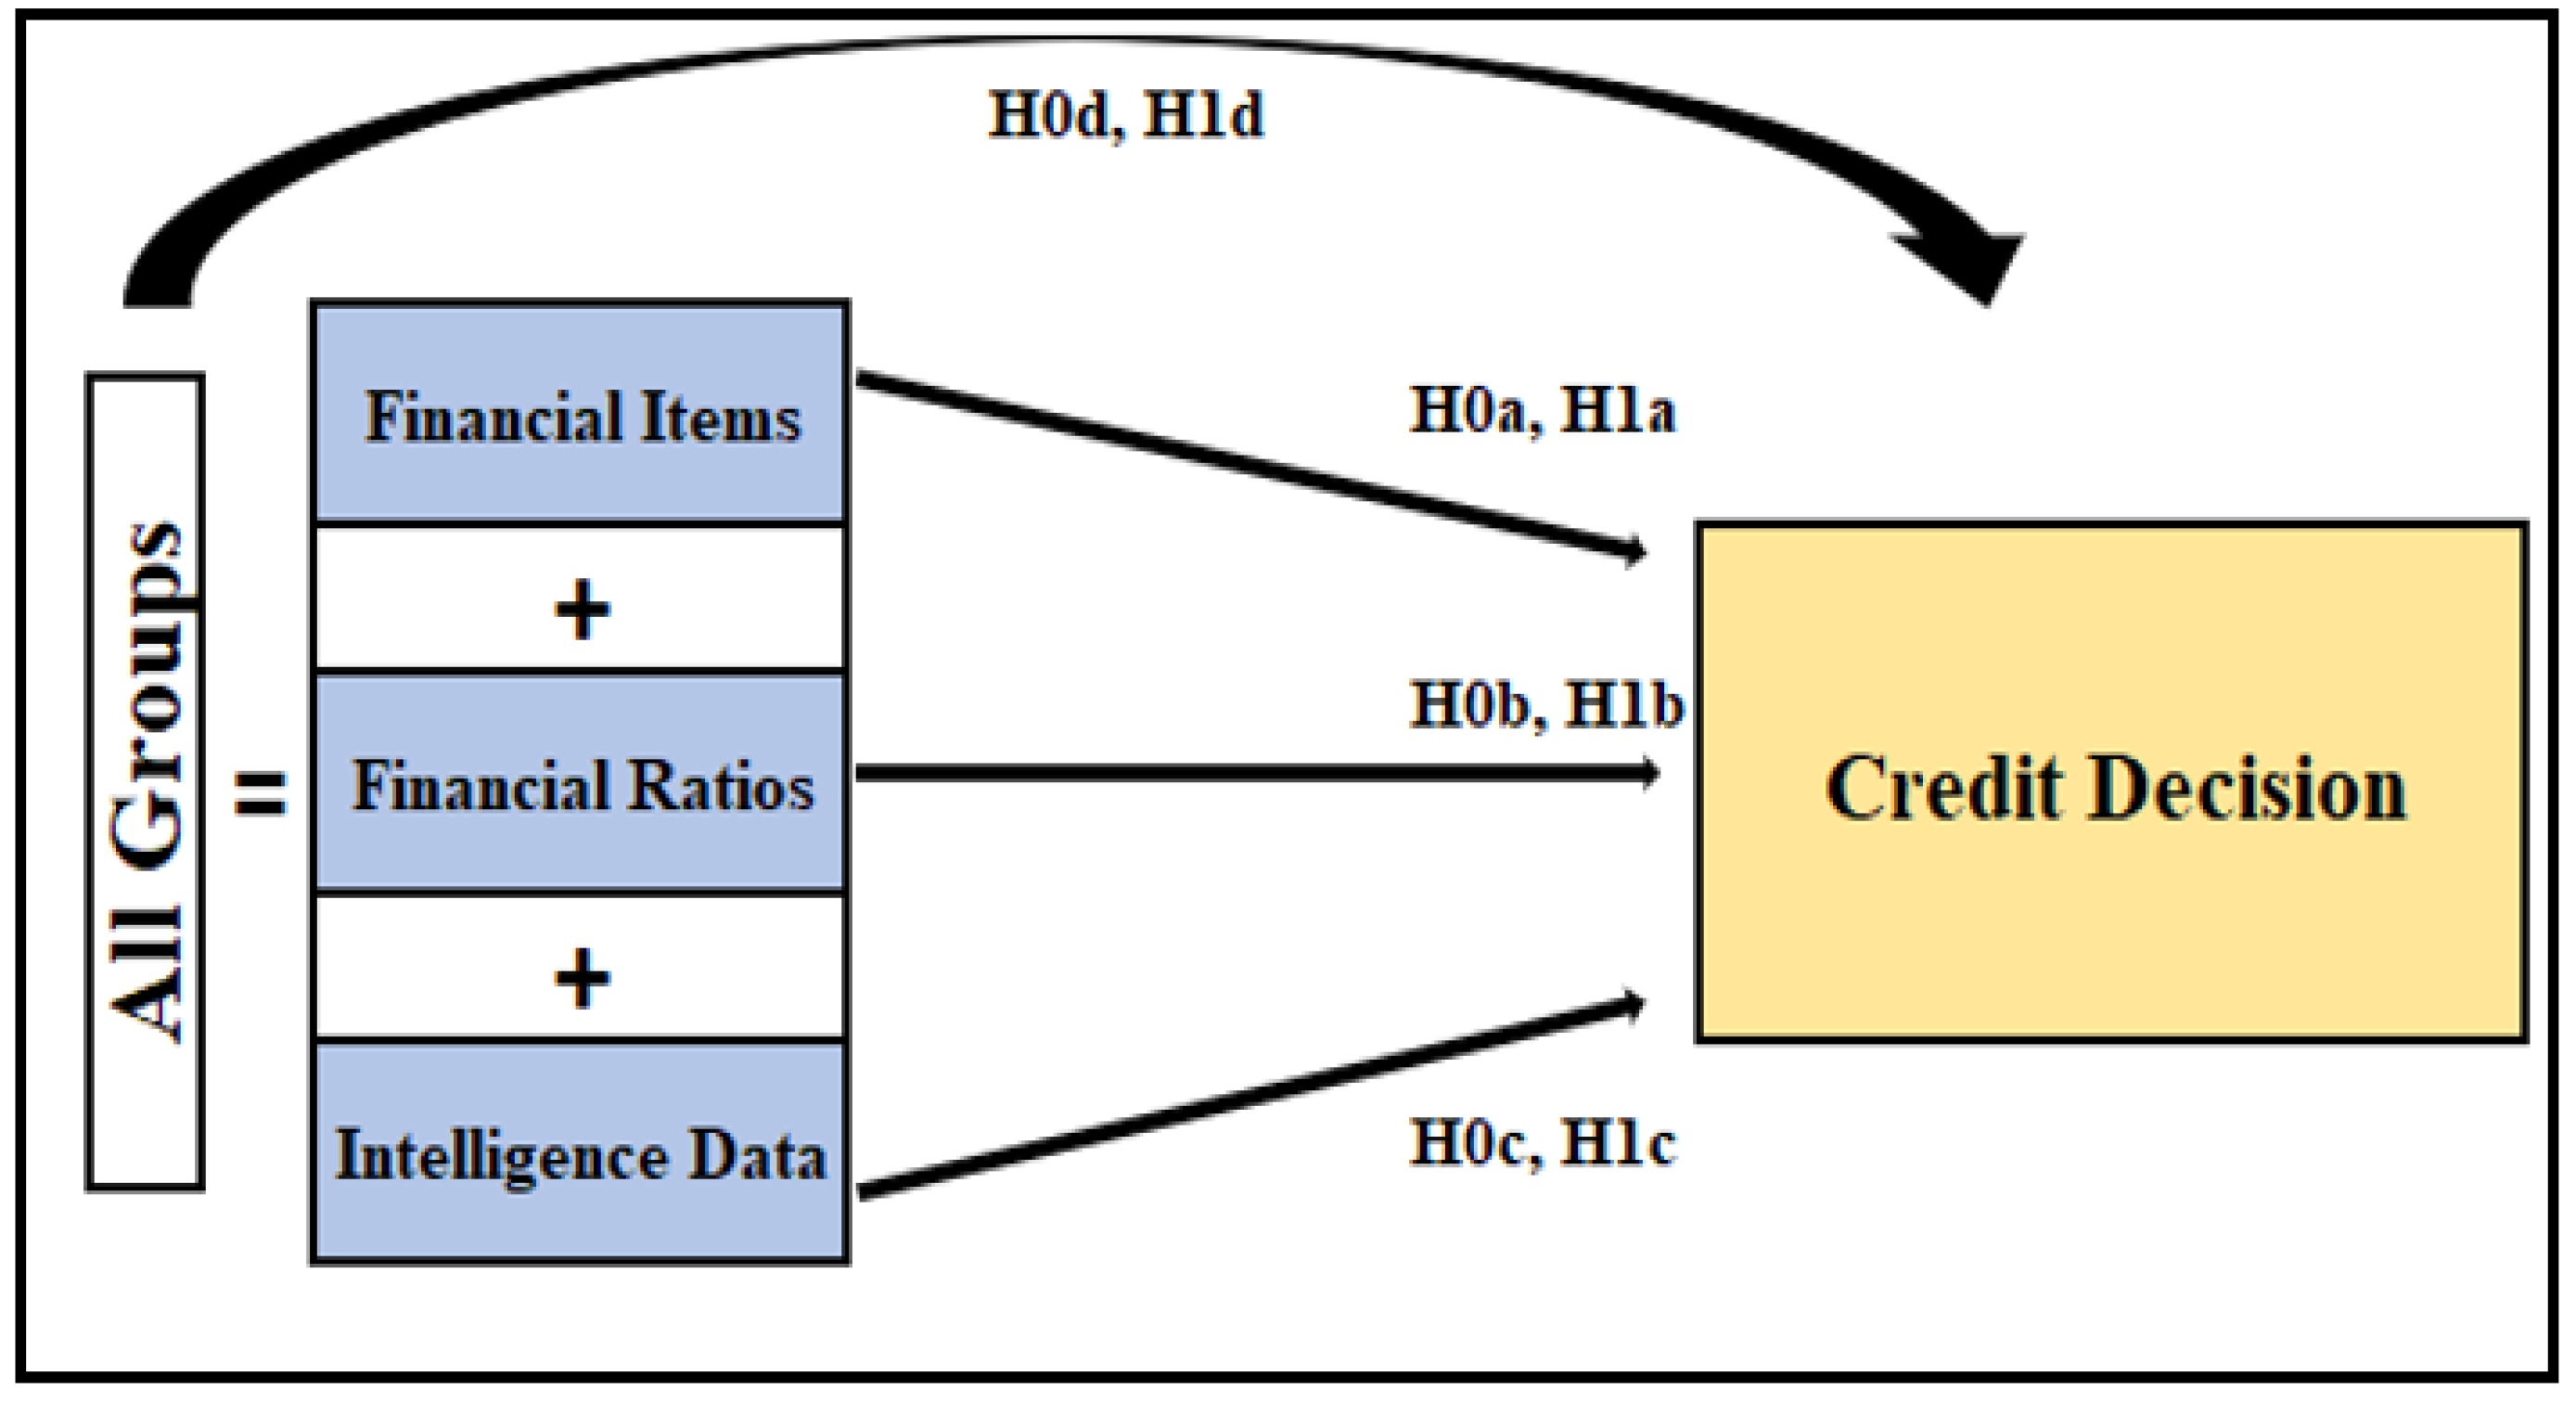
Qualitative and quantitative methods were used in this study. These methods are forms of scientific research aimed at understanding research subjects in a relevant population. Although the overall objectives of the quantitative and qualitative methods are similar, their approaches and focus differ substantially. To elucidate the impact of financial ratios, financial items, and non-financial data on credit decision-making, data from 530 companies were collected from private banks. Subsequently, 34 factors were identified in the analysis. Data were obtained from the bank system in compliance with all necessary ethical protocols, and it was determined that the confidential nature of the data should be maintained and not disclosed. After establishing these factors and completing the calculations, analyses were performed to test the proposed hypotheses. The results clarify the influence of the selected variables on credit decisions.

2.3. Hypotheses

1. H0a:
Financial items do not have a significant effect on credit decisions in the Turkish service sector.
2. H1a:
Financial items have a significant effect on credit decisions in the Turkish service sector.
3. H0b:
Financial ratios do not have a significant effect on credit decisions in the Turkish service sector.
4. H1b:
Financial ratios have a significant effect on credit decisions in the Turkish service sector.
5. H0c:
Non-financial data do not have a significant effect on credit decisions in the Turkish service sector.
6. H1c:
Non-financial data have a significant effect on credit decisions in the Turkish service sector.
7. H0d:
Financial items, financial ratios, and non-financial data do not have a significant effect on credit decisions in the Turkish service sector.
8. H1d:
Financial items, financial ratios, and non-financial data have a significant effect on credit decisions in the Turkish service sector.
Figure 1 presents the framework for the hypotheses. This figure summarizes whether Financial items, Financial ratios, and Non-financial items affect Credit Decisions. The collective analysis of these groups of variables is also included under the label “All Variables”.

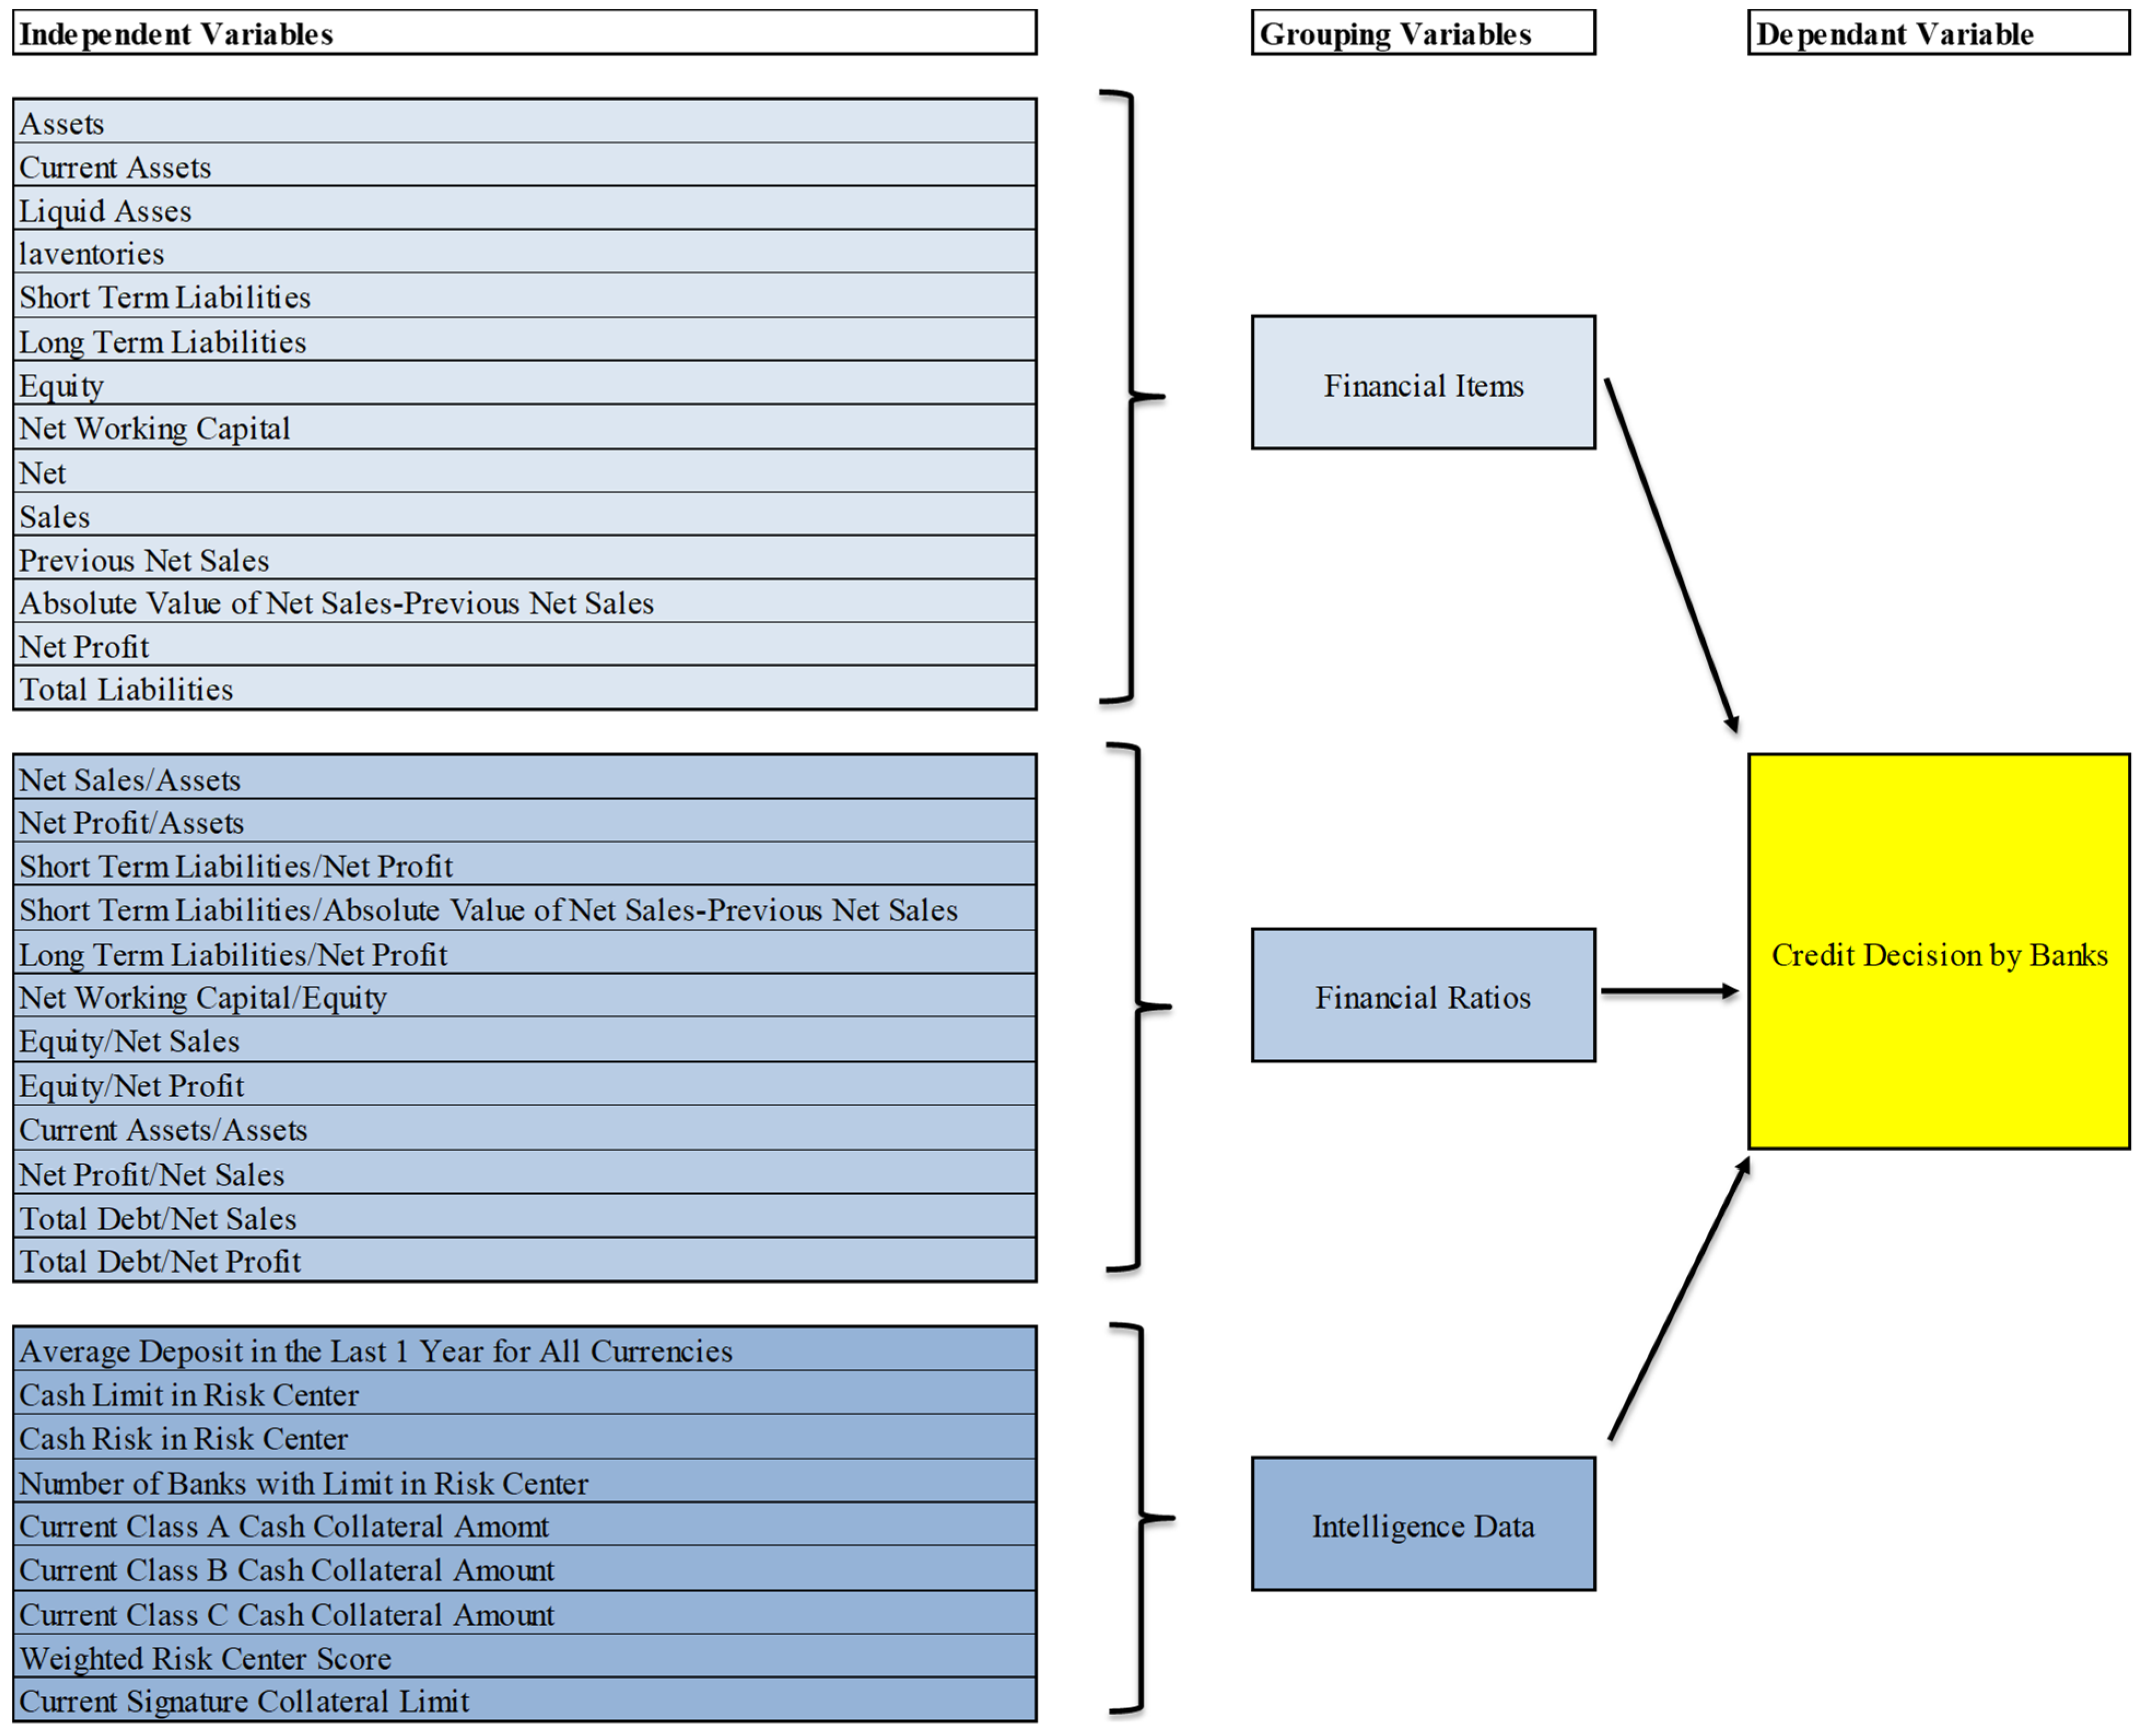
2.4. Sampling, Data and Measures

This study explored the relationship between financial and non-financial variables and credit decisions within Turkey’s service sector, focusing specifically on SMEs and commercial firms. Systematic sampling was employed to select companies based on criteria such as business segments, assets, and turnovers. The study incorporated 13 financial variables, 12 financial ratio variables, and nine non-financial variables as independent variables. These were selected through a review of existing literature and consultations with experts from bank allocation departments (Erdinç 2020; İnamoğlu 2013; Ceran 2019). Missing values were removed from the initial dataset of 1356 firms, resulting in a final dataset comprising 530 data points. The scope of the study encompassed various sub-sectors within the service industry, treating it as a holistic entity.
Figure 2 presents the research organization and offers a visual representation of the theoretical model illustrating the relationship between credit decisions and financial/non-financial variables. In this figure, 34 initial independent variables are categorized into three distinct groups, and their full names are provided. The dependent variable in this study was the credit decisions enacted by the banks. While some studies treat the credit decision as a categorical variable, it is considered a numerical variable, particularly in hybrid studies where both the credit decision and rate are predicted. For the purpose of this study, the target variable was the amount of credit allocated to the firms; therefore, it was treated as a numerical variable to enhance the sensitivity of the analysis.

2.5. Statistical Methods Used in Data Analysis

The data analysis and hypothesis testing were performed using Python and SPSS 20.0 software packages. The analytical process began with preliminary assumption tests for normality, followed by correlation and regression analyses, and ultimately, hypothesis testing. Finally, the conclusions are presented in the final section.
The data distribution was examined using normality tests to determine the appropriate analytical method. Given that the sample size exceeded 50, the Kolmogorov–Smirnov test was used to assess data normality. However, recognizing the sensitivity of the test to large sample sizes, we decided that exclusive reliance on these results could introduce bias. Consequently, P–P/Q–Q plots were consulted as supplementary tools to corroborate the findings of the normality tests.
A correlation analysis was performed to ascertain the relationships between the variables. The high correlations among the independent variables raised concerns about multicollinearity, which were mitigated by removing highly correlated variables from the analytical model. When deciding which variable to exclude, its relationship with the dependent variable was considered. Also, the fixed effects model was used in this study.
In the employed model, the Bidirectional Elimination (or Stepwise Selection) method was utilized for variable selection within the Stepwise approach. This was implemented with the objective of establishing a refined set of variables for modeling, specifically by eliminating the binary relationships among the variables. This process aims to ensure a more robust and accurate model by focusing on the most relevant and impactful variables, thereby enhancing the overall effectiveness of the modeling exercise.

3. Data Analysis and Research Findings

As the normality test, P–P/Q–Q plots were taken into consideration when deciding whether the data was normally distributed or not. The credit decision variable is found to have an approximately normal distribution.

3.1. Normality Analysis

Several methods are available to measure the normality of variables. The most commonly used methods are as follows.
  • Shapiro–Wilk Test:
Null Hypothesis: The data follows a normal distribution.
Test Statististic (W):
W = ( i = 1 n a i x ( i ) ) 2 i = 1 n ( x i x ¯ ) 2
The test statistic W is calculated based on the ordered sample values x ( i ) and their corresponding expected values a i under normality (Shapiro et al. 1968). Based on the Shapiro–Wilk test, the data appeared to be normally distributed (Shapiro–Wilks Test Statistic: 0.9944, p-value: 0.5009).
  • Kolmogorov–Smirnov Test:
Null Hypothesis: The data follow a specific distribution (e.g., normal distribution).
Test Statistic (D):
D = max | F n ( x ) F ( x ) |
Test statistic D was calculated based on the maximum absolute difference between the cumulative distribution function (CDF) F n ( x ) of the observed data and the CDF F n ( x ) under the hypothesized distribution. The Kolmogorov–Smirnov test indicated that the data were likely to be normally distributed (Kolmogorov–Smirnov Test Statistic: 0.0259, p = 0.5046).
  • P–P/Q–Q (Probability–Probability/Quantile–Quantile) plot:
P–P/Q–Q plots are utilized to assess the fit of a dataset to a normal distribution. The PP plot compares observed cumulative probabilities with expected probabilities under a normal distribution. Ideally, the plotted points should be aligned along a straight line, indicating a normal distribution. Deviations from the straight line indicated a departure from normality. These plots helped identify significant deviations from the normality of the data. Figure 3 presents the corresponding plots for the dependent variable.
Figure 3 shows that credit decisions and independent variables exhibit an approximate normal distribution.
The following steps were followed in the analyses.
  • Correlation Analysis: The formula for Pearson’s correlation coefficient (r) between two variables X and Y is given by
    r = ( X X ¯ ) ( Y Y ¯ ) ( X X ¯ ) 2 ( Y Y ¯ ) 2
    where X ¯ and Y ¯ represent the means of variables X and Y, respectively.
  • Multiple Regression Analysis: the formula for multiple linear regression is represented as follows:
    Y = β 0 + β 1 X 1 + β 2 X 2 + + β p X p + ε
    where Y is the dependent variable, X 1 , X 2 , , X p is the independent variable, β 0 , β 1 , β 2 , , β p is the regression coefficient, and ε is the error term.
  • Adjusted R-squared (Coefficient of Determination): the formula for adjusted R-squared (Adj R2) in the multiple regression analysis was calculated as
    A d j _ R 2 = 1 ( 1 R 2 ) ( N 1 ) N p 1 ,
    where R 2 = 1 ( Y Y ^ ) 2 ( Y Y ¯ ) 2 and N are the total sample sizes; p is the number of independent variables; Y represents the observed values of the dependent variable; Y ^ represents the values predicted by the regression model; and Y ¯ represents the mean of the dependent variable.

3.2. Financial Item Analysis

Correlation analysis was conducted to assess the relationships among these financial variables, thereby minimizing the issue of multicollinearity. Thirteen independent variables were initially considered in the Financial item category. Subsequent to this evaluation, variables with a Pearson correlation coefficient of ±0.80 or higher were scrutinized, and it was decided to retain only one of the highly correlated pairs, removing the other from the dataset. Notably, significant and strong correlations were observed between Assets and Current Assets, Assets and Long-Term Liabilities, and Current Assets and Current Liabilities (Pearson’s correlation coefficients were 0.842, 0.811, and 0.863, respectively; all p = 0.000). Consequently, two variables—Current Assets and Long-Term Liabilities—were excluded, and the analysis proceeded with 11 financial variables.
Multiple linear regression analysis using a Stepwise Method revealed that the eighth model was statistically significant. The goodness of fit of the model was examined using the coefficient of determination adjusted to the R2 values. Based on this evaluation, the capability of the selected financial variables to explain the variations in credit decisions is 54%. The selected financial variables are assets, liquid assets, inventories, current liabilities, equity, net working capital, net sales, previous net sales, the absolute value of the change in net sales, net profits, and total liabilities. Additionally, a statistically significant relationship is identified between credit decisions and several financial variables, including assets, current liabilities, equity, net sales, previous net sales, the absolute value of the change in net sales, net sales, net profit, and total liabilities (p < 0.05). Conversely, no significant relationship is observed between liquid assets, inventories, net working capital, and credit decisions (p > 0.05).
Based on the regression analysis results presented in Table 1, a statistically significant relationship is observed between credit decisions and financial item variables. The derived model was deemed statistically significant (F = 75.143, p < 0.001). Additionally, the model displayed no evidence of autocorrelation, as indicated by a Durbin–Watson statistic of 0.996. Consequently, the model was deemed statistically robust and valid.

3.3. Financial Ratio Analysis

Data pertaining to the financial ratios of 530 companies in the service sector were analyzed. Financial ratio variables, presumed to influence the dependent variable, were employed in the analysis.
Correlation analysis was conducted to ascertain the relationship between the financial ratio variables. This step mitigated the risk of multicollinearity among the independent variables. The dataset initially contains 12 independent variables in the financial ratio category. Upon analysis, variables with a Pearson correlation coefficient of ±0.80 or higher were scrutinized, and one variable from each correlated pair was removed from the dataset. Specifically, a significant and strong correlation was observed between “Net Profit/Assets” and “Current Liabilities/Net Profit” as well as between “Net Profit/Assets” and “Equity/Net Profit” (Pearson Correlation = 0.856, p < 0.001; Pearson Correlation = 0.872, p < 0.001, respectively). Consequently, one variable—net profit/assets—was excluded because of its weaker association with the dependent variable.
A multiple linear regression analysis using the stepwise method was conducted to elucidate the relationship between credit decisions and the financial ratio variables. The fifth model was considered statistically significant. Key metrics, such as the relationship coefficient, percentage of the dependent variable explained by the independent variables, and adjusted R2 values, were examined. According to the results presented in Table 2, the ability of the variables to explain the variations in credit decisions was 21%. The variables are net sales/assets, current liabilities/net profit, long-term liabilities/absolute value of net sales/previous net sales, long-term liabilities/net profit, net working capital/equity, equity/net sales, equity/net profit, current assets/assets, net fit/net sales, total debt/net sales, and total debt/net profit. Furthermore, a significant relationship is identified between Current Liabilities/Net Profit, Long-Term Liabilities/Net Profit, Current Assets/Assets, Total Debt/Net Sales, Total Debt/Net Profit, and Credit Decisions (p < 0.05). Conversely, no significant relationship is observed between the variables net sales/assets, long-term liabilities/absolute value of net sales–previous net sales, net working capital/equity, equity/net sales, equity/net profit, net profit/net sales, and credit decisions (p > 0.05).
Based on the results of the regression analysis presented in Table 2, a significant relationship between credit decisions and financial ratio variables was observed. The derived model was statistically significant (F = 28.510, p < 0.001). Additionally, a Durbin–Watson statistic of 0.447 indicated no autocorrelation within the model. Thus, the model was considered statistically valid.

3.4. Non-Financial Analysis

Data pertaining to non-financial variables from 530 companies in the service sector were analyzed. Non-financial variables believed to influence the dependent variable were included in the analysis. Correlation analysis was conducted to mitigate multicollinearity among the independent variables. Out of nine initial non-financial variables, one was removed due to a high correlation (±0.80 or above) with another variable. Specifically, a significant and high correlation was found between “Cash Limit in Risk Center” and “Cash Risk in Risk Center” (Pearson Correlation = 0.873, p = 0.01). Consequently, “Cash Risk in Risk Center” was excluded from the dataset, resulting in eight variables for subsequent analyses.
A multiple linear regression analysis was conducted using a stepwise method to ascertain the relationship between credit decisions and the remaining non-financial variables. The sixth model is statistically significant. Key statistics, such as the correlation coefficient, explanatory power of the independent variables over the dependent variable, and adjusted R2 values, were examined. According to these metrics, variables including “Deposit Average in Banks Over the Last Year”, “Cash Limit in Risk Center”, “Number of Banks with Limits in Risk Center”, “Current Class A Cash Collateral Amount”, “Current Class B Cash Collateral Amount”, “Current Class C Cash Collateral Amount”, “Weighted KKB Score” and “Current Signature Collateral Limit” accounted for 71% of the variance in credit decisions. A significant relationship was found between “Cash Limit in Risk Center”, “Number of Banks with Limits in Risk Center”, “Current Class A Cash Collateral Amount”, “Current Class B Cash Collateral Amount”, “Current Class C Cash Collateral Amount”, “Current Signature Collateral Limit” and the dependent variable, Credit Decision (p < 0.05). No significant relationship was observed between the “average deposit in banks over the last year”, “weighted KKB score,” and the dependent variable, credit decisions (p > 0.05).
According to the results of the regression analysis presented in Table 3, a significant relationship is observed between credit decisions and non-financial variables. The derived model was found to be statistically significant, as evidenced by an F-value of 217.73 and a p-value of less than 0.05 (p = 0.000). Additionally, the Durbin–Watson statistic of 1.442 indicates the absence of autocorrelation within the model. Based on these metrics, the model was deemed statistically valid.

3.5. All Variable Groups Analysis

A comprehensive regression analysis, including all group variables, was performed.
Following prior regression analyses, data related to financial items, financial ratios, and non-financial variables for the 530 companies operating in the service sector were collectively analyzed. Multiple linear regression analysis is subsequently conducted to evaluate the collective influence of financial and non-financial variables on credit decisions. The variables are listed in Table 4.
From the preceding analyses, the variables deemed redundant and subsequently removed included Current Assets and Long-Term Liabilities among the financial item variables, net fit/assets among the financial ratio variables, and cash risk in risk centers among Non-Financial Variables.
Correlation analysis was performed to ascertain intervariable relationships. Based on these results, the Weighted KKB Score was excluded from the Non-Financial Variables, and the Equity variable was removed from the financial variables.
A comprehensive regression analysis is performed to assess the relationship between credit decisions and the remaining variables. The eighth model was significant when using the stepwise method. Key metrics, such as the relationship coefficient, proportion of the dependent variable explained by the independent variables, and adjusted R-squared values, were analyzed. According to the findings, the collective explanatory power of financial items, financial ratios, and non-financial variables for the credit decision variable was 81%. The analysis revealed significant associations between the Credit Decision variable and several variables within Financial Items at a significance level of p < 0.05 (e.g., such as Assets, Equity, Net Sales, Previous Net Sales, Net Profit, Total Liabilities); Financial ratios (e.g., such as Net Sales/Assets, Current Liabilities/Net Profit, Long-Term Liabilities/Net Profit, Net Profit/Net Sales, Total Debt/Net Sales, Total Debt/Net Profit); and Non-Financial variables (e.g., such as Cash Limit in Risk Center, Number of Banks with Limits in Risk Center, Current Class A Cash Collateral Amount, Current Class C Cash Collateral Amount, Weighted KKB Score, Current Signature Collateral Limit).
According to the regression analysis results presented in Table 5, a statistically significant relationship is identified between credit decisions and financial items, financial ratios, and non-financial factors. The model was confirmed to be statistically significant, as evidenced by an F-value of 132.641 and a p-value less than 0.05 (p = 0.000). Additionally, the absence of autocorrelation in the model was verified using a Durbin–Watson statistic of 1.710, confirming the statistical validity of the model.
With a single unit increase in variables such as Current Class A Cash Collateral Amount, Total Liabilities, Current Liabilities/Net Profit, Net Profit, Net Profit/Net Sales, Current Signature Collateral Limit, Net Sales, Cash Limit in Risk Center, Assets, Long-Term Liabilities/Net Profit, and Net Sales/Assets, credit decisions increased by coefficients of 0.682, 0.152, 85,375, 0.280, 165,810, 1.289, 0.026, 0.044, 0.060, 38,906, and 106,938, respectively. Conversely, an increase of one unit in Total Debt/Net Profit, Previous Net Sales, Number of Banks with Limits in Risk Centers, Current Class C Cash Collateral Amount, and Total Debt/Net Sales resulted in a decrease in credit decisions, with coefficients of 50,288, 0.019, 49,598, 0.886, and 99,727, respectively.
The regression model was further corroborated through residual plot analysis, presented in Figure 4, which confirmed the absence of heteroskedasticity. The Jarque–Bera test yielded a p-value of 0.0000, further bolstering the reliability of the regression analysis employed in the study.
The red dashed line in a residual plot represents the expected position of residuals if a predictive model’s estimates are perfect. It serves as a benchmark for assessing the model’s prediction accuracy, where deviations indicate prediction errors. Within the framework of econometric modeling, the treatment of outliers is a topic that has generated significant discourse. Outliers can profoundly influence the accuracy of regression estimates. The literature typically divides the discussion on outliers into two distinct perspectives:
Econometric Perspective: From a purely statistical standpoint, outliers are observations that notably deviate from the expected pattern of the data. These can unduly influence the model’s performance and potentially lead to misleading interpretations. Quantitative metrics, such as Cook’s distance, are employed to diagnose and assess the influence of these outliers. When such outliers are identified, standard procedure in econometrics often recommends their removal or adjustment, especially if their presence adversely affects the model’s diagnostic tests and predictive accuracy.
Financial Realism Perspective: However, outliers often represent genuine economic phenomena in financial econometrics. These outliers could be symptomatic of events or processes that have genuine economic significance, such as unofficial balance sheet adjustments, anomalous sales activities, or taxation anomalies. Removing these outliers might enhance the statistical properties of the model but at the expense of omitting crucial information about the underlying economic process. From this viewpoint, discarding such outliers would strip the model of its ability to capture the full complexity and nuances of the financial reality it seeks to represent.
In summary, while the conventional econometric approach prioritizes the statistical integrity of the model, the financial realism perspective underscores the importance of retaining economically meaningful outliers. Hence, the decision of whether or not to remove outliers should not be based solely on statistical considerations. It is essential also to weigh the substantive economic context and the specific objectives of the analysis. Furthermore, the impact of outliers needs to be quantified before deciding upon their removal. Given these considerations, it was determined that retaining the outliers would be more conducive to the objectives of the study.
In our analytical process, we also considered the impact of outliers on our regression model. A version of the model was employed after removing these outliers. The results were remarkably consistent with those obtained using the least squares estimation on the full dataset. Given the similarity in outcomes and to maintain conciseness in our presentation, we opted not to report the results of the outlier-removed model in detail within this paper. However, it is worth noting that the presence or removal of outliers did not significantly distort our main findings.
In the presence of outliers, one can employ robust regression techniques, for example, robust M-estimation, among others. However, in this study, we confine ourselves to classical least square estimation.
To further assess the integrity of the model, multicollinearity issues were examined independently for the Financial Items, Financial Ratios, and Intelligence Data variable groups. As evidenced by the Variance Inflation Factors (VIF) presented in Table 6, no VIF values indicative of multicollinearity concerns were identified.

4. Conclusions and Discussion

4.1. Findings and Results

Aligned with most commercial enterprises’ overarching objectives, banks primarily aim to maximize profits. Historically, they have realized this goal through avenues like funding businesses in the marketplace or treasury tool investments. Primarily, it is postulated that banks generate substantial revenue through market funding, coupled with meticulous oversight of credit returns to mitigate the emergence of non-performing assets. During this critical phase, a comprehensive evaluation of both financial and non-financial data furnished by companies becomes instrumental in guiding credit allocation decisions (Villalpando 2014).
The results indicate that both financial and non-financial data have a significant impact on credit decisions. The analysis demonstrates that these data positively influence credit decisions, with non-financial variables having the strongest effect, followed by financial and financial ratio variables. Considering all variable groups, the regression analysis confirms that evaluating these data together yields more effective credit decisions, with the highest model success rate compared with separate analyses. Thus, it can be concluded that the financial and non-financial data provided by enterprises in Turkey have a positive effect on their credit limits and the banks’ credit allocation decisions.
In juxtaposition with the extant literature that scrutinizes the influences of both financial and non-financial variables on credit determinations in specific sectors, the analytical results of this study elucidate certain variables previously unexplored in such contexts yet demonstrably impactful on credit decisions. Beyond confirming the findings of prior research, these results introduce novel variables into the discourse. Given the heterogeneous sub-sector distribution within the service industry, yet the financial congruities among them, the introduction of these unprecedented financial and non-financial variables can potentially enrich the credit decision-making paradigm within the sector (Melnyk et al. 2020; Ceran 2019).
For firms operating in the service sector, the establishment of robust, enduring, and efficacious credit relationships with financial institutions necessitates the comprehensive management of both financial and non-financial reputational factors. This involves the meticulous maintenance of financial records, robustness of key financial metrics, and transparency of non-financial data. Such strategic efforts contribute substantively to constructing a favorable organizational image and reputation from a banking perspective. By showcasing their management of both financial and non-financial variables, firms can position themselves as credible and reliable partners for financial institutions, thereby facilitating long-term, mutually beneficial relationships.
In conclusion, this study underscores the criticality of a multifaceted set of variables, including financial items, financial ratios, and non-financial data, in shaping credit decisions of enterprises in the service sector. These findings emphasize that firms must proactively manage their financial and market reputations to forge durable and advantageous credit affiliations with banks. By providing comprehensive and verifiable financial and non-financial data, these enterprises can increase their creditworthiness, thereby extending their access to higher credit limits and sustaining a continuum of support from financial institutions.
A salient contribution of this study lies in its nuanced approach to disentangling the intertwined influences of financial and non-financial data on credit determinations. Unlike previous studies, which often conducted isolated examinations of these variables or focused within narrow industry boundaries, the current research adopts a distinctive approach by integrating these variables comprehensively, thereby yielding a more holistic comprehension. Specifically, our findings illuminate the differential weightings banks according to these data types, with non-financial metrics emerging as surprisingly dominant determinants. This underscores a shifting paradigm in credit decision-making processes, where subjective and qualitative indicators are increasingly pivotal. Moreover, by introducing previously uncharted financial and non-financial variables into the credit evaluation matrix, this study advances the academic discourse and provides pragmatic insights for the banking sector. The integration of these innovative variables serves not only as an augmentation to the existing scholarly landscape but also equips financial institutions with refined tools and metrics, optimizing their credit allocation endeavors.
As a result, this study’s insights offer significant implications for banks and policymakers, particularly in enhancing credit assessment models and fostering service sector growth. Banks can utilize these findings to incorporate a wider range of non-financial metrics in their credit evaluations, potentially improving risk assessment accuracy and supporting viable enterprises. Policymakers could leverage these insights to develop policies promoting transparency in non-financial reporting, aiding in more informed credit decisions, especially beneficial to SMEs.

4.2. Limitations and Future Study

Although insightful, this study had several limitations that warrant further discussion. The analysis was confined to the service sector and based on limited sample size, thus constraining the generalizability of the findings beyond this specific industry. Furthermore, this study focuses solely on the impact of variables on credit decisions, and there may be limitations in the applicability of statistical methods to real-world scenarios. The missing values in the dataset further complicate the interpretation of the results.
Notwithstanding these limitations, this study significantly augments the existing literature by comprehensively examining the interplay between financial items, financial ratios, and non-financial variables affecting credit decisions, a domain not extensively explored in previous studies. This study offers both theoretical and empirical contributions by illuminating how various financial and non-financial metrics influence credit decisions within the SME segment of the Turkish service sector. These insights can serve as valuable guides for financial institutions to design credit evaluation models based on the unique characteristics of these enterprises.
A key contribution of this study is its nuanced exploration of the relationships between multiple variables and credit decisions. This comprehensive approach not only fills a research gap but also advances our understanding of the nuanced mechanisms driving credit allocation in Turkey’s service sector. Additionally, a comparative analysis of the three variable categories enriches the literature by delineating their relative impacts on credit decisions and emphasizing the need for a multifaceted approach to credit evaluations.
Despite its narrow focus on SMEs in a specific sector, this study offers actionable insights for financial institutions seeking to refine credit allocation mechanisms. This underscores the importance of crafting credit evaluation models tailored to the idiosyncratic needs and characteristics of SMEs in the service sector.
In conclusion, this study posits that non-financial variables have a more pronounced influence on credit decisions than financial variables. This counterintuitive finding paves the way for future research to further explore the relevance of non-financial metrics in credit decision-making, a relatively underexplored area in the existing literature. Overall, this study extends our understanding of the multifaceted influences on credit decisions in the service sector and lays the groundwork for subsequent investigations in other industries.
Theoretically, this research challenges and extends existing credit allocation theories by emphasizing non-financial variables, thereby enriching the literature on financial decision-making. However, the study’s focus on Turkey’s service sector and a limited sample size calls for further research in diverse settings to validate these findings universally. Such explorations could broaden the theoretical and practical understanding of credit risk assessments globally.

Author Contributions

Conceptualization: A.İ.Ç. Methodology: A.E.Ç.; Software: A.İ.Ç.; Formal analysis: A.E.Ç.; Validation: A.İ.Ç.; Resources: A.İ.Ç.; Original draft Preparation: A.İ.Ç. and S.E.A.; Writing—review and editing: S.E.A.; Supervision: S.E.A. All authors have read and agreed to the published version of the manuscript.

Funding

S. Ejaz Ahmed was supported by the Natural Sciences and Engineering Research Council (NSERC) of Canada.

Data Availability Statement

Company data were obtained from a private bank’s data system to ensure compliance with necessary regulations. The confidentiality of private information was strictly maintained, and data sharing was prohibited.

Acknowledgments

The authors thank S. Liu for his time and effort in improving the presentation and quality of this paper.

Conflicts of Interest

The authors declare no financial or personal relationships that could inappropriately influence or bias the content of this study.

References

  1. Altuğ, Fatih. 2010. Finansal analiz sürecinde sistematik bir yaklaşım ve öneriler (A Systematic Approach and Recommendations in the Financial Analysis Process). Ph.D. thesis, Marmara Universitesi, Istanbul, Turkey. [Google Scholar]
  2. Bolkvadze, Besik. 2019. The Importance of Financial Ratios in Financial Analysis of Business Entities. Globalization and Business 3: 154–157. [Google Scholar] [CrossRef]
  3. Ceran, M. 2019. Bankacılıkta Dijitalleşme Kapsamında Öğrenen Yapay Zekâ Desteğiyle Sorunlu Kredilerin Belirlenmesi (Identifying Non-Performing Loans with the Support of Learning Artificial Intelligence within the Scope of Digitalization in Banking). Ph.D. thesis, Marmara Üniversitesi, Social Science Institute, İstanbul, Turkey; pp. 122–28. [Google Scholar]
  4. Edem, Daniel Bassey. 2017. Liquidity management and performance of deposit money banks in Nigeria (1986–2011): An investigation. International Journal of Economics, Finance and Management Sciences 5: 146–61. [Google Scholar] [CrossRef]
  5. Erdinç, Nilüfer Yücedağ. 2020. Borsa İstanbul’da İşlem Gören İmalat İşletmelerinin Kârlılığını Etkileyen İşletmeye Özgü ve Makroekonomik Değişkenlerin Analizi (Analysis of Business-Specific and Macroeconomic Variables Affecting the Profitability of Manufacturing Businesses Traded in Borsa Istanbul). Üçüncü Sektör Sosyal Ekonomi Dergisi 55: 2109. [Google Scholar]
  6. Geçer, Turgay. 2014. Kredi İstihbaratı. Sosyal Bilimleri Dergisi 25: 21–35. [Google Scholar]
  7. Hossain, Md Junayed. 2023. Implementation of Big Data Analytics in Credit Risk Management in the Banking and Financial Services Sector: A Contemporary Literature Review. Available online: https://ssrn.com/abstract=4441658 (accessed on 1 September 2023). [CrossRef]
  8. İnamoğlu, Yusuf. 2013. Türkiye’de Hizmet Sektörünün Gelişimi Ve Ekonomik Büyümeye Etkisi (The Development of the Service Sector in Turkey and Its Impact on Economic Growth). Master’s thesis, Bülent Ecevit Üniversitesi, Social Science Institute, Zonguldak, Turkey; pp. 1–2. [Google Scholar]
  9. İş Bankası. 2012. İstihbarat. İstanbul: Eğitim Müdürlüğü Yayınları. [Google Scholar]
  10. Jasevičienė, Filomena, Bronius Povilaitis, and Simona Vidzbelytė. 2013. Commercial banks performance 2008–2012. Business Management and Economics Engineering 11: 189–208. [Google Scholar] [CrossRef]
  11. Konstantinidis, Christos V., Anastasia Tsolaki, and Nikolaos Giovanis. 2021. Estimating Competitiveness Relations Between Firms of a Multinational Group of Clothing And Footwear Manufacturing Industry In Greece. TEL 4: 789–802. [Google Scholar] [CrossRef]
  12. Lam, Weng Siew, Weng Hoe Jaaman, and Kah Fai Liew. 2021. Performance Evaluation of Construction Companies Using Integrated Entropy–fuzzy Vikor Model. Entropy 3: 320. [Google Scholar] [CrossRef] [PubMed]
  13. Mbona, Reginald Masimba, and Kong Yusheng. 2019. Financial statement analysis: Principal component analysis (PCA) approach case study on China telecoms industry. Asian Journal of Accounting Research 4: 233–45. [Google Scholar]
  14. Melnyk, Mariana, Iryna Leshchukh, Tetyana Medynska, and Nadiya Rushchyshyn. 2020. Potential of the sector of financial services in view of the socio-economic growth of Ukrainian regions. Economic Annals-XXI 185: 144–54. [Google Scholar]
  15. Mercan, Mehmet. 2013. Kredi Hacmindeki Değişimlerin Ekonomik Büyümeye Etkisi: Türkiye Ekonomisi İçin Sınır Testi Yaklaşımı (The Effect of Changes in Credit Volume on Economic Growth: Bounds Test Approach for Turkish Economy). TBB Bankacılar Dergisi 84: 54–71. [Google Scholar]
  16. Shapiro, Samuel S., Martin B. Wilk, and Hwei J. Chen. 1968. A comparative study of various tests for normality. Journal of the American Statistical Association 63: 1343–72. [Google Scholar] [CrossRef]
  17. Vakıfbank. 2011. İstihbarat, Mali Tahlil ve Skorlama Yönetmeliği (Financial Analysis and Scoring Regulation). Ankara: Law of Vakıfbank. [Google Scholar]
  18. Villalpando, Mario. 2014. Bank credit and productivity: Evidence from Mexican firms. Revista Mexicana de Economía y Finanzas. Nueva Época/Mexican Journal of Economics and Finance 9: 195–214. [Google Scholar]
  19. World Bank. 2014. The Use of Non-Financial Information in Credit Scoring: A Review of the Literature. Washington, DC: World Bank. [Google Scholar]
  20. Xu, Yao-Zhi, Jian-Lin Zhang, Ying Hua, and Lin-Yue Wang. 2019. Dynamic credit risk evaluation method for e-commerce sellers based on a hybrid artificial intelligence model. Sustainability 11: 5521. [Google Scholar] [CrossRef]
  21. Yan, Ying, and Bo Li. 2023. The Research in Credit Risk of Micro and Small Companies with Linear Regression Model. In Advances in Swarm Intelligence. ICSI 2023. Edited by Ying Tan, Yuhui Shi and Wenjian Luo. Lecture Notes in Computer Science. Cham: Springer, vol. 13969. [Google Scholar] [CrossRef]
  22. Yürük, A. T. 2006. Banka ve Sigorta Hukuku (Banking and Insurance Law). Eskişehir: Anadolu Üniversitesi Yayım, p. 63. [Google Scholar]
Figure 1. Hypothesis and Research Organization of All Variable Groups and Credit Decisions.
Jrfm 16 00487 g001
Figure 2. Conceptual Framework of Three Variable Groups and Credit Decisions.
Jrfm 16 00487 g002
Figure 3. Normal P–P/Q–Q Plots of Credit Decisions.
Jrfm 16 00487 g003
Figure 4. Residual Plot for Credit Decisions.
Jrfm 16 00487 g004
Table 1. Coefficients and Adj-R2 of Regression Model for Financial Items.
8. Model FDependent VariableIndependent VariablesBtpAdj-R2
F = 75.143
p = 0.000
Credit DecisionConstant−197,186−2.4880.0130.536
Total Liabilities0.1467.7200.000
Net Profit0.4178.8710.000
Equity0.2064.9520.000
Previous Net Sales−0.120−7.0260.000
Net Sales0.0845.5960.000
Current Liabilities0.1825.0840.000
Assets0.061−2.5540.011
Absolute Value of Net Sales–Previous Net Sales−0.076−2.1980.028
Table 2. Coefficients and Adj-R2 of Regression Model for Financial Ratios.
5. Model FDependent VariableIndependent VariablesβTpAdj-R2
F = 28.510
p = 0.000
Credit DecisionConstant925,7214.2450.0000.214
Current Liabilities/Net Profit−197,12310.0230.000
Total Debt/Net Profit−80,574−5.9190.000
Long-Term Liabilities/Net Profit−62,8802.9510.000
Current Assets/Assets810,149−2.4640.014
Net Sales/Assets127,0672.1180.035
Table 3. Coefficients and Adj-R2 of Regression Model for Non-Financial Data.
5. Model FDependent VariableIndependent VariablesβTpAdj-R2
F = 217.73
p = 0.000
Credit DecisionConstant570,1825.9370.0000.714
Current Class A Cash Collateral Amount0.97428.230.000
Cash Limit in Risk Center0.0617.0760.000
Weighted KKB Score1.6504.3700.000
Current Class C Cash Collateral Amount−1.313−3.6960.000
Number of Banks with Limits in Risk Center−36,496−2.8800.004
Current Class B Cash Collateral Amount0.2782.2960.022
Table 4. Classification of Significant Variables for Financial Items, Ratios, and Non-Financial Data.
All Significant Variables
Financial ItemsFinancial RatiosNon-Financial Variables
AssetsNet Sales/AssetsDeposit Average in Banks Last 1 Year
Liquid AssetsCurrent Liabilities/Net ProfitCash Limit in Risk Center
InventoriesLong-Term Liabilities/Absolute Value of Net Sales–Previous Net SalesNumber of Banks with Limits in Risk Center
Current LiabilitiesLong-Term Liabilities/Net ProfitCurrent Class A Cash Collateral Amount
EquityNet Working Capital/EquityCurrent Class B Cash Collateral Amount
Net Working CapitalEquity/Net SalesCurrent Class C Cash Collateral Amount
Net SalesEquity/Net ProfitWeighted KKB Score
Previous Net SalesCurrent Assets/AssetsCurrent Signature Collateral Limit
Absolute Value of Net Sales-Previous Net SalesNet Profit/Net Sales
Net ProfitTotal Debt/Net Sales
Total LiabilitiesTotal Debt/Net Profit
Table 5. Coefficients and Adj-R2 of Regression Model for All Variables.
8. Model FDependent VariableIndependent VariablesBtpAdj-R2
F = 132.641
p = 0.000
Credit DecisionConstant245,7852.3220.0210.805
Current Class A Cash Collateral Amount0.68218.0250.000
Total Liabilities0.1528.5960.000
Current Liabilities/Net Profit85,3757.5330.000
Total Debt/Net Profit−50,288−5.7320.000
Net Profit0.2804.9630.000
Net Profit/Net Sales−165,810−3.0970.002
Current Signature Collateral Limit1.2894.0810.000
Previous Net Sales−0.019−1.6760.004
Net Sales0.0262.2750.023
Number of Banks with Limits in Risk Center−49,598−4.5400.000
Cash Limit in Risk Center0.0444.3960.000
Assets0.060−4.8670.000
Long-Term Liabilities/Net Profit38,9063.2740.001
Net Sales/Assets106,9383.7180.000
Current Class C Cash Collateral Amount−0.886−2.9920.003
Total Debt/Net Sales−99,727−2.3140.021
Table 6. Variance Inflation Factor (VIF) for each Variable.
Variable NameVIFVariable NameVIFVariable NameVIF
Total Liabilities1.018321Current Liabilities/Net Profit1.007908Current Class A Cash Collateral Amount1.010088
Net Profit1.016648Total Debt/Net Profit1.010269Cash Limit in Risk Center1.013432
Equity1.057124Long-Term Liabilities/Net Profit1.019002Weighted KKB Score1.028962
Previous Net Sales1.077362Current Assets/Assets1.217395Current Class C Cash Collateral Amount1.055214
Net Sales1.025715Net Sales/Assets1.1246Number of Banks with Limits in Risk Center1.06382
Current Liabilities1.01011 Current Class B Cash Collateral Amount1.27036
Assets1.013703
Absolute Value of Net Sales–Previous Net Sales1.010068
Disclaimer/Publisher’s Note: The statements, opinions and data contained in all publications are solely those of the individual author(s) and contributor(s) and not of MDPI and/or the editor(s). MDPI and/or the editor(s) disclaim responsibility for any injury to people or property resulting from any ideas, methods, instructions or products referred to in the content.

