
Effect of Structural Economic Vulnerability on the Participation in International Trade

Abstract
:1. Introduction
2. Theoretical Discussion on the Effect of EVI on the Participation in International Trade
2.1. Effect of Environmental and External Economic and Financial Shocks on the Participation in International Trade
2.2. Effect of Exposure to Shocks on the Participation in International Trade
3. Empirical Strategy
3.1. Model Specification
3.1.1. Effect of Trade Costs
3.1.2. Effect of Development Aid
3.1.3. Effect of the Institutional and Governance Quality
3.1.4. Effect of Financial Development
3.2. Data Analysis
3.3. Econometric Approach
4. Results’ Interpretation
5. Further Analysis
6. Conclusions
Funding
Institutional Review Board Statement
Informed Consent Statement
Data Availability Statement
Acknowledgments
Conflicts of Interest
Appendix A. Definition and Source of Variables
| Variables | Definition | Source |
| TRADE | This is the measure of a country’s level of participation in international trade. It is proxied by the indicator of trade openness proposed by Squalli and Wilson (2011). This indicator is calculated as the share of the sum of exports and imports of goods and services in GDP adjusted by the proportion of a country’s trade level relative to the average world trade (see Squalli and Wilson 2011, p. 1758). | Author’s calculation based on data extracted from the World Development Indicators (WDI) of the World Bank. |
| TS | This is the alternative indicator of countries’ participation in international trade. It is measured by a country’s share of the sum of exports and imports of goods and services to GDP. Note that as this variable is taken in logarithm in the analysis, it is not expressed in percentage. | WDI |
| EVI | This is the indicator of structural economic vulnerability also referred to as the Economic Vulnerability Index. It has been set up by the United Nations by the Committee for Development Policy (CDP) and used by the latter as one of the criteria for identifying LDCs. It has been computed on a retrospective basis for 145 developing countries (including 48 LDCs) by the “Fondation pour les Etudes et Recherches sur le Developpement International (FERDI)”. The EVI has been calculated as the simple arithmetic average of two sub-indexes, namely the intensity of exposure to shocks (exposure sub-index) (denoted “EXPOS”), and the intensity of environmental and exogenous economic shocks (shocks sub-index) (denoted “SHOCK”). These two sub-indexes have been calculated using a weighted average of different component indexes, with the sum of components’ weights equaling 1 so that the values of EVI range between 0 and 100. For further details on the computation of the EVI, see, for example, Feindouno and Goujon (2016). The components of the exposure sub-index are the population size. the remoteness from world markets; the export product concentration; the share of agriculture, forestry, and fisheries in GDP; and the share of the population living in low-elevation coastal zones. The components of the shocks sub-index are the agricultural production instability, the export instability, and the index of the victims of natural disasters. | Data on EVI are extracted from the database of the Fondation pour les Etudes et Recherches sur le Developpement International (FERDI)—see online at: https://ferdi.fr/donnees/un-indicateur-de-vulnerabilite-economique-evi-retrospectif (accessed on 4 July 2022) |
| ERP | The variable “ERP” represents the transformed measure of the exchange rate pressure. This transformation goes as follows (see also Morrissey et al. 2016) ERP , where refers to the absolute value of the Exchange Rate Pressure, denoted “PI”, and where E is the exchange rate in local currency units per USD, RES is the size of reserves, and are country-specific weights, , and . stands for the standard deviation of over the full period of the analysis (here, 1996–2018). Similarly, is the standard deviation of over the full period of the analysis (here, 1996–2018). The variable “PI” has been computed using the annual data over the period of 1996–2018. | Author’s calculation based on data from the WDI. |
| TRCOST | This is the indicator of the average comprehensive (overall) trade costs. The average overall trade costs (including both tariff and nontariff costs) have been calculated for a given country in a given year, as the average of the bilateral overall trade costs on goods across all trading partners of this country. Data on bilateral overall trade costs have been computed by Arvis et al. (2012, 2016) following the approach proposed by Novy (2013). Arvis et al. (2012, 2016) have built on Anderson and van Wincoop (2004)’s definition of trade costs and considered bilateral comprehensive trade costs as all costs involved in trading goods (agricultural and manufactured goods) internationally with another partner (i.e., bilaterally) relative to those involved in trading goods domestically (i.e., intranationally). Hence, the bilateral comprehensive trade costs indicator captures trade costs in its wider sense, including not only tariffs and international transport costs but also other trade cost components discussed in Anderson and van Wincoop (2004), such as direct and indirect costs associated with differences in languages, currencies, as well as cumbersome import or export procedures. Higher values of the indicator of average overall trade costs indicate higher overall trade costs. | Author’s computation using the ESCAP-World Bank Trade Cost Database. Accessible online at: https://www.unescap.org/resources/escap-world-bank-trade-cost-database (accessed on 4 July 2022) Detailed information on the methodology used to compute the bilateral comprehensive trade costs could be found in Arvis et al. (2012, 2016), as well as in the short explanatory note accessible online at: https://www.unescap.org/sites/default/d8files/Trade%20Cost%20Database%20-%20User%20note.pdf (accessed on 4 July 2022) |
| ODA | This is the real gross disbursements of total Official Development Assistance (ODA), expressed in constant prices for 2019, USD. | OECD (Organization for Economic Cooperation and Development) database on development indicators. |
| GDPC | Real per capita Gross Domestic Product (constant prices for 2010, USD). | World Development Indicators (WDI) |
| FD | This is the financial development index, which summarizes how developed financial institutions and financial markets are in terms of their depth (size and liquidity), access (the ability of individuals and companies to access financial services), and efficiency (ability of institutions to provide financial services at low costs and with sustainable revenues, and the level of activity of capital markets). The values of this indicator range between 0 and 1, with higher values indicating greater financial development. | Data extracted from the IMF Financial Development Index Database (see online at: https://data.imf.org/?sk=F8032E80-B36C-43B1-AC26-493C5B1CD33B)—See also Sahay et al. (2015) (accessed on 7 August 2022). |
| TERMS | This is the indicator of the terms of trade, measured by the net barter terms of trade index (2000 = 100). | WDI |
| INST | This is the variable capturing the institutional and governance quality. It has been computed by extracting the first principal component (based on factor analysis) of the following six indicators of governance. These indicators are, respectively, political stability and absence of violence/terrorism, regulatory quality, rule of law, government effectiveness, voice and accountability, and corruption. Higher values of the index “INST” are associated with better institutional and governance quality, while lower values reflect worse institutional and governance quality. | Data on the components of “INST” variables have been extracted from World Bank Governance Indicators developed by Kaufmann et al. (2010) and updated recently. See online at: https://info.worldbank.org/governance/wgi/ (accessed on 1 June 2022) |
Appendix B. List of Countries Used in the Full Sample

| Full Sample | LDCs | ||||
|---|---|---|---|---|---|
| Algeria | Costa Rica | Kiribati | Philippines | Angola | Tanzania |
| Angola | Cote d’Ivoire | Kyrgyz Republic ** | Qatar | Bangladesh | Togo |
| Antigua and Barbuda | Cyprus | Lao PDR ** | Rwanda ** | Benin | Uganda |
| Argentina | Dominica | Lebanon | Samoa | Bhutan | Vanuatu |
| Armenia ** | Dominican Republic | Lesotho ** | Saudi Arabia | Burkina Faso | Zambia |
| Azerbaijan ** | Ecuador | Liberia | Senegal | Burundi | |
| Bahamas, The | Egypt, Arab Rep. | Libya | Seychelles | Cambodia | |
| Bahrain | El Salvador | Madagascar | Sierra Leone | Central African Republic | |
| Bangladesh | Equatorial Guinea | Malaysia | Singapore | Chad | |
| Barbados | Eswatini ** | Maldives | South Africa | Comoros | |
| Belize | Ethiopia ** | Mali ** | Sri Lanka | Congo, Dem. Rep. | |
| Benin | Fiji | Mauritania | St. Vincent and the Grenadines | Ethiopia | |
| Bhutan ** | Gabon | Mauritius | Sudan | Gambia, The | |
| Bolivia ** | Gambia, The | Mexico | Suriname | Guinea | |
| Botswana ** | Georgia | Micronesia, Fed. Sts. | Tajikistan ** | Guinea-Bissau | |
| Brazil | Ghana | Mongolia ** | Tanzania | Kiribati | |
| Brunei Darussalam | Grenada | Morocco | Thailand | Lao PDR | |
| Burkina Faso ** | Guatemala | Mozambique | Togo | Lesotho | |
| Burundi ** | Guinea | Myanmar | Tonga | Liberia | |
| Cabo Verde | Guinea-Bissau | Namibia | Tunisia | Madagascar | |
| Cambodia | Guyana | Nepal ** | Turkey | Mali | |
| Cameroon | Honduras | Nicaragua | Uganda ** | Mauritania | |
| Central African Republic ** | India | Niger ** | Uruguay | Mozambique | |
| Chad ** | Indonesia | Nigeria | Uzbekistan ** | Myanmar | |
| Chile | Iran, Islamic Rep. | Oman | Vanuatu | Nepal | |
| China | Israel | Pakistan | Venezuela, RB | Niger | |
| Colombia | Jamaica | Panama | Vietnam | Rwanda | |
| Comoros | Jordan | Papua New Guinea | Zambia ** | Senegal | |
| Congo, Dem. Rep. | Kazakhstan ** | Paraguay ** | Sierra Leone | ||
| Congo, Rep. | Kenya | Peru | Sudan | ||
Appendix C. Descriptive Statistics on Variables Used in the Analysis
| Variable | Observations | Mean | Standard Deviation | Minimum | Maximum |
| TRADE | 652 | 0.0013 | 0.0045 | 0.000003 | 0.076 |
| TS | 652 | 0.767 | 0.381 | 0.117 | 3.762 |
| EVI | 652 | 33.431 | 11.754 | 9.224 | 85.274 |
| EXPOS | 652 | 34.838 | 13.509 | 3.352 | 86.622 |
| SHOCK | 652 | 32.027 | 14.735 | 4.378 | 87.964 |
| PI | 588 | −0.187 | 0.565 | −8.138 | 0.632 |
| TRCOST | 652 | 325.306 | 58.121 | 150.240 | 500.805 |
| TERMS | 652 | 1.180 | 0.398 | 0.281 | 4.537 |
| GDPC | 652 | 4586.193 | 6086.397 | 212.472 | 63,193.380 |
| ODA | 652 | 609,000,000 | 754,000,000 | 160,000 | 6,740,000,000 |
| FD | 652 | 0.219 | 0.131 | 0.034 | 0.751 |
| INST | 652 | −0.886 | 1.504 | −4.671 | 3.693 |
| 1 | Such shocks can be commodity price shocks, shocks to export demand, volatility of capital inflows, natural disasters, and health shocks (e.g., Guillaumont 2009, 2010). |
| 2 | |
| 3 | See for example, Aguiar and Gopinath (2007); Almansour et al. (2015); Azomahou et al. (2021); Barrot et al. (2018); Dabla-Norris and Gündüz (2014); Guillaumont (2009, 2010); Kim et al. (2020); Koren and Tenreyro (2007); Ruch (2020) and WTO (2021a). |
| 4 | Detailed information on LDCs is provided by the Office of the High Representative for the Least Developed Countries, Landlocked Developing Countries, and Small Island Developing States (UNOHRLLS) and is accessible online at: https://www.un.org/ohrlls/content/least-developed-countries (accessed on 1 June 2022) |
| 5 | In general, these studies have uncovered adviser effects of EVI on macroeconomic outcomes. |
| 6 | These refer to extreme weather events such as droughts, earthquakes, insect infestations, pandemics, floods, extreme temperatures, avalanches, landslides, storms, volcanoes, fires, and hurricanes (e.g., Baker et al. 2022). |
| 7 | This may also reflect an undiversified domestic production featured by a high share of agriculture, forestry, and fisheries in GDP. |
| 8 | For example, a recent report by the WTO on market access for products and services of export interest to LDCs (WTO 2021b) has shown that the share of these countries’ exports in world exports of goods and services remains below 1 per cent. This reflects a high share of primary products in total LDC exports (which has declined from 73% in 2011 to 48% in 2020). |
| 9 | See, for example, Ali and Milner (2016), Anderson and Marcouiller (2002), Diakantoni et al. (2017), Hendy and Zaki (2021), Hoekman and Nicita (2011), Hoekman and Shepherd (2015), Hummels (2007), Jacks et al. (2011), Limão and Venables (2001), Papalia and Bertarelli (2015), Portugal-Perez and Wilson (2012), and Shepherd (2022). |
| 10 | |
| 11 | The list of LLDCs used in the analysis is contained in Appendix B, and the full list of existing LLDCs is accessible online at: https://www.un.org/ohrlls/content/list-lldcs (accessed on 1 June 2022). |
| 12 | The list of LDCs used in the analysis is contained in Appendix B, and the full list of countries included in the category of LDCs is accessible online at: https://www.un.org/ohrlls/content/profiles-ldcs (accessed on 1 June 2022). |
References
- Abiad, Abdul, Prachi Mishra, and Petia Topalova. 2014. How Does Trade Evolve in the Aftermath of Financial Crises? IMF Economic Review 62: 213–47. [Google Scholar] [CrossRef]
- Addison, Tony, and Mina Baliamoune-Lutz. 2017. Aid, the Real Exchange Rate and Why Policy Matters: The Cases of Morocco and Tunisia. The Journal of Development Studies 53: 1104–21. [Google Scholar] [CrossRef]
- Aguiar, Mark, and Gita Gopinath. 2007. Emerging Markets Business Cycles: The Cycle is the Trend. Journal of Political Economy 115: 11–69. [Google Scholar] [CrossRef]
- Aizenman, Joshua, and Michael M. Hutchison. 2012. Exchange market pressure and absorption by international reserves: Emerging markets and fear of reserve loss during the 2008–2009 crisis. Journal of International Money and Finance 31: 1076–91. [Google Scholar] [CrossRef]
- Alesina, Alberto, and Romain Wacziarg. 1998. Openness, country size and government. Journal of Public Economics 69: 305–21. [Google Scholar] [CrossRef]
- Ali, Salamat, and Chris Milner. 2016. Narrow and Broad Perspectives on Trade Policy and Trade Costs: How to Facilitate Trade in Madagascar. The World Economy 39: 1917–33. [Google Scholar] [CrossRef]
- Almansour, Aseel, Aqib Aslam, John Bluedorn, and Rupa Duttagupta. 2015. How vulnerable are emerging markets to external shocks? Journal of Policy Modeling 37: 460–83. [Google Scholar] [CrossRef]
- Álvarez, Inmaculada C., Javier Barbero, Andrés Rodríguez-Pose, and José L. Zofío. 2018. Does Institutional Quality Matter for Trade? Institutional Conditions in a Sectoral Trade Framework. World Development 103: 72–87. [Google Scholar] [CrossRef]
- Anderson, James E., and Douglas Marcouiller. 2002. Insecurity and the pattern of trade: An empirical investigation. Review of Economics and Statistics 84: 342–52. [Google Scholar] [CrossRef]
- Anderson, James E., and Eric van Wincoop. 2004. Trade Costs. Journal of Economic Literature 42: 691–751. [Google Scholar] [CrossRef]
- Anderson, Kym. 2022. Trade-related food policies in a more volatile climate and trade environment. Food Policy 109: 102253. [Google Scholar] [CrossRef]
- Ando, Mitsuyo, and Kazunobu Hayakawa. 2022. Impact of COVID-19 on trade in services. Japan and the World Economy 62: 101131. [Google Scholar] [CrossRef] [PubMed]
- Arvis, Jean-François, Gaël Raballand, and Jean-François J.-F. Marteau. 2010. The Cost of Being Landlocked. Logistics Costs and Supply Chain Reliability. Washington, DC: World Bank. [Google Scholar]
- Arvis, Jean-François, Yann Duval, Ben Shepherd, and Chorthip Utoktham. 2012. Trade Costs in the Developing World: 1995–2010. ARTNeT Working Papers, No. 121/December 2012 (AWP No. 121). Bangkok: Asia-Pacific Research and Training Network on Trade, Bangkok, ESCAP. [Google Scholar]
- Arvis, Jean-François, Yann Duval, Ben Shepherd, Chorthip Utoktham, and Anasuya Raj. 2016. Trade Costs in the Developing World: 1996–2010. World Trade Review 15: 451–74. [Google Scholar] [CrossRef]
- Asongu, Simplice, and Ivo J. Leke. 2019. Can Foreign Aid Dampen the Threat of Terrorism to International Trade? Evidence from 78 Developing Countries. Arthaniti: Journal of Economic Theory and Practice 18: 32–55. [Google Scholar] [CrossRef]
- Atkin, David, and Dave Donaldson. 2022. Chapter 1—The role of trade in economic development. In Handbook of International Economics. Edited by Gita Gopinath, Elhanan Helpman and Kenneth Rogoff. Amsterdam: Elsevier, vol. 5, pp. 1–59. [Google Scholar]
- Atolia, Manoj, Prakash Loungani, Milton Marquis, and Chris Papageorgiou. 2020. Rethinking development policy: What remains of structural transformation? World Development 128: 104834. [Google Scholar] [CrossRef]
- Auboin, Marc. 2009. Restoring Trade Finance during a Period of Financial Crisis: Stock-Taking of Recent Initiatives. WTO Staff Working Paper, ERSD-2009-16. Geneva: World Trade Organization (WTO). [Google Scholar]
- Auboin, Marc. 2021. Trade Finance, Gaps and the COVID-19 Pandemic: A Review of Events and Policy Responses to Date. WTO Staff Working Paper, ERSD-2021-5. Geneva: World Trade Organization (WTO). [Google Scholar]
- Auboin, Marc, and Martina Engemann. 2014. Testing the trade credit and trade link: Evidence from data on export credit insurance. Review of World Economics 150: 715–43. [Google Scholar] [CrossRef]
- Auer, Raphael A. 2015. Human capital and the dynamic effects of trade. Journal of Development Economics 117: 107–18. [Google Scholar] [CrossRef]
- Azomahou, Théophile T., Njuguna Ndung’u, and Mahamady Ouédraogo. 2021. Coping with a dual shock: The economic effects of COVID-19 and oil price crises on African economies. Resources Policy 72: 102093. [Google Scholar] [CrossRef] [PubMed]
- Baker, Scott R., Nicholas Bloom, and Stephen Terry. 2022. Using Disasters to Estimate the Impact of Uncertainty. NBER Working Paper 27167. Cambridge: National Bureau of Economic Research. [Google Scholar]
- Barbero, Javier, Juan José de Lucio, and Ernesto Rodríguez-Crespo. 2021. Effects of COVID-19 on trade flows: Measuring their impact through government policy responses. PLoS ONE 16: e0258356. [Google Scholar] [CrossRef]
- Barbier, Edward B. 2015. Climate change impacts on rural poverty in low-elevation coastal zones. Estuarine, Coastal and Shelf Science 165: A1–A13. [Google Scholar] [CrossRef] [Green Version]
- Barrot, Luis-Diego, César Calderón, and Luis Servén. 2018. Openness, specialization, and the external vulnerability of developing countries. Journal of Development Economics 134: 310–28. [Google Scholar] [CrossRef]
- Becker, Bo, Jinzhu Chen, and David Greenberg. 2013. Financial Development, Fixed Costs, and International Trade. Review of Corporate Finance Studies 2: 1–28. [Google Scholar] [CrossRef]
- Bekkers, Eddy, and Robert B. Koopman. 2022. Simulating the trade effects of the COVID-19 pandemic—Scenario analysis based on quantitative trade modelling. The World Economy 45: 445–67. [Google Scholar] [CrossRef] [PubMed]
- Bems, Rudolfs, Robert C. Johnson, and Kei-Mu Yi. 2013. The Great Trade Collapse. Annual Review of Economics 5: 375–400. [Google Scholar] [CrossRef]
- Benguria, Felipe, and Alan M. Taylor. 2020. After the Panic: Are Financial Crises Demand or Supply Shocks? Evidence from International Trade. American Economic Review: Insights 2: 509–26. [Google Scholar]
- Birchler, Kassandra, and Katharina Michaelowa. 2016. Making aid work for education in developing countries: An analysis of aid effectiveness for primary education coverage and quality. International Journal of Educational Development 48: 37–52. [Google Scholar] [CrossRef]
- Bleaney, Michael, and Abelardo Salazar Neaves. 2013. Declining Distance Effects in International Trade: Some Country-Level Evidence. The World Economy 36: 1029–40. [Google Scholar] [CrossRef]
- Blundell, Richard, and Stephen Bond. 1998. Initial conditions and moment restrictions in dynamic panel data models. Journal of Econometrics 87: 115–43. [Google Scholar] [CrossRef]
- Bonciani, Dario, and Martino Ricci. 2020. The international effects of global financial uncertainty shocks. Journal of International Money and Finance 109: 102236. [Google Scholar] [CrossRef]
- Bond, Stephen R. 2002. Dynamic panel data models: A guide to micro data methods and practice. Portuguese Economic Journal 1: 141–62. [Google Scholar] [CrossRef]
- Bougheas, Spiros, and Raymond Riezman. 2007. Trade and the Distribution of Human Capital. Journal of International Economics 73: 421–33. [Google Scholar] [CrossRef] [Green Version]
- Bredenkamp, Hugh, and Julia Bersch. 2012. Commodity Price Volatility: Impact and Policy Challenges for Low-Income Countries. In Commodity Price Volatility and Inclusive Growth in Low-Income Countries. Edited by Rabah Arezki, Catherine Pattillo, A. Quintyn, G. Marc and Min Zhu. Washington, DC: International Monetary Fund. [Google Scholar]
- Calì, Massimiliano, and Dirk Willem te Velde. 2011. Does aid for trade really improve trade performance? World Development 39: 725–40. [Google Scholar] [CrossRef]
- Caves, Susan, Liam Phelan, and Jenn Cameron. 2020. Space to tinker: From faux resilience to productive novelty in agricultural policy. Journal of Rural Studies 78: 87–95. [Google Scholar] [CrossRef]
- Chaney, Thomas. 2016. Liquidity Constrained Exporters. Journal of Economic Dynamics and Control 72: 141–54. [Google Scholar] [CrossRef]
- Chang, Roberto, Linda Kaltani, and Norman V. Loayza. 2009. Openness can be good for growth: The role of policy complementarities. Journal of Development Economics 90: 33–49. [Google Scholar] [CrossRef]
- Cordina, Gordon. 2004. Economic Vulnerability and Economic Growth: Some Results from a Neo-Classical Growth Modelling Approach. Journal of Economic Development 29: 21–39. [Google Scholar]
- Dabla-Norris, Era, and Yasemin Bal Gündüz. 2014. Exogenous Shocks and Growth Crises in Low-Income Countries: A Vulnerability Index. World Development 59: 360–78. [Google Scholar] [CrossRef]
- de Lucio, Juan, Raúl Mínguez, Asier Minondo, and Francisco Requena. 2022. Impact of Covid-19 containment measures on trade. International Review of Economics & Finance 80: 766–78. [Google Scholar]
- Di Pace, Federico, Juvenal Luciana, and Petrella Ivan. 2020. Terms-of-Trade Shocks are Not all Alike. IMF Working Paper WP/20/280. Washington, DC: International Monetary Fund. [Google Scholar]
- Diakantoni, Antonia, Hubert Escaith, Michael Roberts, and Thomas Verbeet. 2017. Accumulating Trade Costs and Competitiveness in Global Value Chains. WTO Working Paper ERSD-2017-02. Geneva: World Trade Organization. [Google Scholar]
- Donaubauer, Julian, Birgit Meyer, and Peter Nunnenkamp. 2016. Aid, Infrastructure and FDI: Assessing the Transmission Channel with a New Index of Infrastructure. World Development 78: 230–45. [Google Scholar] [CrossRef]
- Ductor, Lorenzo, and Danilo Leiva-León. 2022. Fluctuations in global output volatility. Journal of International Money and Finance 120: 102533. [Google Scholar] [CrossRef]
- Egger, Peter. 2008. On the Role of Distance for Bilateral Trade. The World Economy 31: 653–62. [Google Scholar] [CrossRef]
- El Hadri, Hajare, Daniel Mirza, and Isabelle Rabaud. 2019. Natural disasters and countries’ exports: New insights from a new (and an old) database. The World Economy 42: 2668–83. [Google Scholar] [CrossRef]
- Ezeaku, Hillary C., Simplice A. Asongu, and Joseph Nnanna. 2021. Volatility of international commodity prices in times of COVID-19: Effects of oil supply and global demand shocks. The Extractive Industries and Society 8: 257–70. [Google Scholar] [CrossRef]
- Farrugia, Nadia. 2007. The importance of institution building in small island states. Bank of Valletta Review 33: 57–75. [Google Scholar]
- Feindouno, Sosso, and Michaël Goujon. 2016. The Retrospective Economic Vulnerability Index, 2015 Update. Working Paper n°147. Clermont-Ferrand: Fondation pour les Etudes et Recherches sur le Developpement InternationaL (FERDI). [Google Scholar]
- Felbermayr, Gabriel, and Jasmin Gröschl. 2013. Natural disasters and the effect of trade on income: A new panel IV approach. European Economic Review 58: 18–30. [Google Scholar] [CrossRef]
- Foley, Fritz C., and Kalina Manova. 2015. International Trade, Multinational Activity, and Corporate Finance. Annual Review of Economics 7: 119–46. [Google Scholar] [CrossRef]
- Fukumoto, Yukio, and Tomoko Kinugasa. 2017. Age Structure and Trade Openness: An Empirical Investigation. The World Economy 40: 1247–63. [Google Scholar] [CrossRef]
- Gassebner, Martin, Alexander Keck, and Robert Teh. 2010. Shaken, not stirred: The impact of disasters on international trade. Review of International Economics 18: 351–68. [Google Scholar] [CrossRef]
- Giordani, Paolo E., Nadia Rocha, and Michele Ruta. 2016. Food prices and the multiplier effect of trade policy. Journal of International Economics 101: 102–22. [Google Scholar] [CrossRef]
- Gnangnon, Sèna Kimm. 2013. Structural vulnerability and excessive public indebtedness in CFA Franc Zone countries. Economic Modelling 35: 816–32. [Google Scholar] [CrossRef]
- Gnangnon, Sèna Kimm. 2014. Does structural economic vulnerability matter for public indebtedness in developing countries? Journal of Economic Studies 41: 644–71. [Google Scholar] [CrossRef]
- Gnangnon, Sèna Kimm. 2016a. Market Access of OECD Donor Countries and Their Supply of Aid for Trade. Journal of International Commerce, Economics and Policy 7: 1650004. [Google Scholar] [CrossRef]
- Gnangnon, Sèna Kimm. 2016b. Trade openness and structural vulnerability in developing countries. Journal of Economic Studies 43: 70–89. [Google Scholar] [CrossRef]
- Gnangnon, Sèna Kimm. 2017. Structural economic vulnerability, openness and bilateral development aid flows. Economic Analysis and Policy 53: 77–95. [Google Scholar] [CrossRef]
- Gnangnon, Sèna Kimm. 2018. Effect of multilateral trade liberalization on foreign direct investment outflows amid structural economic vulnerability in developing countries. Research in International Business and Finance 45: 15–29. [Google Scholar] [CrossRef]
- Gnangnon, Sèna Kimm. 2019a. Structural economic vulnerability and public revenue performance. International Journal of Public Policy 15: 225–47. [Google Scholar] [CrossRef]
- Gnangnon, Sèna Kimm. 2019b. Tax Reform and Trade Openness in Developing Countries. Journal of Economic Integration 34: 498–519. [Google Scholar] [CrossRef]
- Gnangnon, Sèna Kimm. 2021a. Productive Capacities, Economic Growth and Economic Growth Volatility in Developing Countries: Does Structural Economic Vulnerability Matter? Journal of International Commerce, Economics and Policy Preprints. [Google Scholar] [CrossRef]
- Gnangnon, Sèna Kimm. 2021b. Structural Economic Vulnerability and the Utilization of Unilateral Trade Preferences: Does Development Aid Matter? Research Square Preprint Paper. [Google Scholar] [CrossRef]
- Gnangnon, Sèna Kimm. 2022a. Duration of the membership in the World Trade Organization, Structural Economic Vulnerability and Trade Costs. Research Square Preprint Paper. [Google Scholar] [CrossRef]
- Gnangnon, Sèna Kimm. 2022b. Aid for Trade, export product diversification, and foreign direct investment. Review of Development Economics 26: 534–61. [Google Scholar] [CrossRef]
- Gnangnon, Sèna Kimm. 2022c. Aid for Trade and the Real Exchange Rate. The International Trade Journal 36: 264–87. [Google Scholar] [CrossRef]
- Gnangnon, Sèna Kimm, and Harish Iyer. 2017. Structural Economic Vulnerability, Trade Policy and FDI Inflows. Journal of International Commerce, Economics and Policy 8: 1750005. [Google Scholar] [CrossRef]
- Guillaumont, Patrick. 2009. An Economic Vulnerability Index: Its Design and Use for International Development Policy. Oxford Development Studies 37: 193–228. [Google Scholar] [CrossRef] [Green Version]
- Guillaumont, Patrick. 2010. Assessing the economic vulnerability of small island developing states and the least developed countries. Journal of Development Studies 46: 828–54. [Google Scholar] [CrossRef]
- Guillaumont, Patrick. 2011. The Concept of Structural Economic Vulnerability and Its Relevance for the Identification of the Least-Developed Countries and Other Purposes (Nature, Measurement, and Evolution). CDP Background Paper No. 12—ST/ESA/2011/CDP/12. New York: Department of Economic and Social Affairs. [Google Scholar]
- Guillaumont, Patrick. 2013. Measuring Structural Vulnerability to Allocate Development Assistance and Adaptation Resources. FERDI Working Paper 68. Clermont-Ferrand: Fondation pour les Etudes et Recherches sur le Développement International (FERDI). [Google Scholar]
- Guillaumont, Patrick, and Laurant Wagner. 2012. Aid and Growth Accelerations: Vulnerability Matters. UNU-WIDER Working Paper Series WP-2012-031; Helsinki: UNU World Institute for Development Economics Research (UNU-WIDER). [Google Scholar]
- Guillaumont, Patrick, Sylviane Guillaumont Jeanneney, and Laurent Wagner. 2017. How to Take into Account Vulnerability in Aid Allocation Criteria and Lack of Human Capital as Well: Improving the Performance Based Allocation. World Development 90: 27–40. [Google Scholar] [CrossRef]
- Guttmann, Simon, and Anthony Richards. 2006. Trade openness: An Australian perspective. Australian Economic Papers 45: 188–203. [Google Scholar] [CrossRef]
- Hendy, Rana, and Chahir Zaki. 2021. Trade facilitation and firms exports: Evidence from customs data. International Review of Economics & Finance 75: 197–209. [Google Scholar]
- Hidalgo, César A. 2022. The Policy Implications of Economic Complexity. arXiv arXiv:2205.02164. [Google Scholar] [CrossRef]
- Hirsch, Seev, and Baruch Lev. 1971. Sales stabilization through export diversification. Review of Economics and Statistics 53: 270–77. [Google Scholar] [CrossRef]
- Hoekman, Bernard, and Alessandro Nicita. 2011. Trade policy, trade costs, and developing country trade. World Development 39: 2069–79. [Google Scholar] [CrossRef]
- Hoekman, Bernard, and Ben Shepherd. 2015. Who profits from trade facilitation initiatives? Implications for African countries. Journal of African Trade 2: 51–70. [Google Scholar] [CrossRef]
- Hühne, Philipp, Birgit Meyer, and Peter Nunnenkamp. 2014. Who Benefits from Aid for Trade? Comparing the Effects on Recipient versus Donor Exports. Journal of Development Studies 50: 1275–88. [Google Scholar] [CrossRef]
- Hummels, David. 2007. Transport costs and international trade in the second era of globalisation. Journal of Economic Perspectives 21: 131–54. [Google Scholar] [CrossRef]
- International Monetary Fund (IMF). 2012. World Economic Outlook: Growth Resuming, Dangers Remain. April 2012, Chapter 4: Commodity Price Swings and Commodity Exporters. Washington, DC: International Monetary Fund. [Google Scholar]
- International Monetary Fund (IMF). 2018. World Economic Outlook: Challenges to Steady Growth. Washington, DC: International Monetary Fund (IMF). [Google Scholar]
- International Monetary Fund (IMF). 2020. Global Financial Stability Report: Markets in the Time of COVID-19. Washington, DC: International Monetary Fund. [Google Scholar]
- Jacks, David S., Christopher M. Meissner, and Dennis Novy. 2011. Trade booms, trade busts and trade costs. Journal of International Economics 83: 185–201. [Google Scholar] [CrossRef] [Green Version]
- Juvenal, Luciana, and Paulo Santos Monteiro. 2013. Export Market Diversification and Productivity Improvement: Theory and Evidence from Argentinian Firms. Working Paper 2013-015A. Saint Louis: Federal Reserve Bank of Saint Louis. [Google Scholar]
- Kaufmann, Daniel, Aart Kraay, and Mastruzzi Mastruzzi. 2010. The Worldwide Governance Indicators Methodology and Analytical Issues. World Bank Policy Research N° 5430 (WPS5430). Washington, DC: The World Bank. [Google Scholar]
- Keefe, Helena Glebocki. 2021. The transmission of global monetary and credit shocks on exchange market pressure in emerging markets and developing economies. Journal of International Financial Markets, Institutions and Money 72: 101320. [Google Scholar] [CrossRef]
- Kim, Youngju, Hyunjoon Lim, and Wook Sohn. 2020. Which external shock matters in small open economies? Global risk aversion vs. US economic policy uncertainty. Japan and the World Economy 54: 101011. [Google Scholar] [CrossRef]
- Koren, Miklós, and Silvana Tenreyro. 2007. Volatility and Development. Quarterly Journal of Economics 122: 243–87. [Google Scholar] [CrossRef]
- Kotsadam, Andreas, Gudrun Rustad Østby, Tollefsen Siri Aas, Andreas Forø, and Henrik Urdal. 2018. Development aid and infant mortality. Micro-level evidence from Nigeria. World Development 105: 59–69. [Google Scholar] [CrossRef]
- Kramarz, F, J. Martin, and I. Mejean. 2020. Volatility in the small and in the large: The lack of diversification in international trade. Journal of International Economics 122: 103276. [Google Scholar] [CrossRef]
- Leibovici, Fernando. 2021. Financial Development and International Trade. Journal of Political Economy 129: 3405–46. [Google Scholar] [CrossRef]
- Levchenko, Andrei A. 2007. Institutional Quality and International Trade. The Review of Economic Studies 74: 791–819. [Google Scholar] [CrossRef]
- Limão, Nuno, and Anthony J. Venables. 2001. Infrastructure, Geographical Disadvantage, Transport Costs, and Trade. World Bank Economic Review 15: 451–79. [Google Scholar] [CrossRef]
- Ly-My, Dung, and Hyun-Hoon Lee. 2019. Effects of aid for trade on extensive and intensive margins of greenfield FDI. The World Economy 42: 2120–43. [Google Scholar] [CrossRef]
- Ly-My, Dung, Hyun-Hoonand Lee, and Donghyun Park. 2021. Does aid for trade promote import diversification? The World Economy 44: 1740–69. [Google Scholar] [CrossRef]
- Manova, Kalina. 2013. Credit Constraints, Heterogeneous Firms, and International Trade. Review of Economic Studies 80: 711–44. [Google Scholar] [CrossRef]
- Martyr-Koller, Rosanne, Adelle Thomas, Carl-Friedrich Schleussner, Alexander Nauels, and Tabea Lissner. 2021. Loss and damage implications of sea-level rise on Small Island Developing States. Current Opinion in Environmental Sustainability 50: 245–59. [Google Scholar] [CrossRef]
- Mary, Sébastien, and Ashok K. Mishra. 2020. Humanitarian food aid and civil conflict. World Development 126: 104713. [Google Scholar] [CrossRef]
- Méon, Pierre-Guillaume, and Khalid Sekkat. 2008. Institutional quality and trade: Which institutions? which trade? Economic Inquiry 46: 227–40. [Google Scholar] [CrossRef]
- Milner, Helen V., and Keiko Kubota. 2005. Why the Move to Free Trade? Democracy and Trade Policy in the Developing Countries. International Organization 59: 107–43. [Google Scholar] [CrossRef]
- Minondo, Asier. 2020. Export revenue and quality: Firm-level evidence from developing countries. Review of Development Economics 24: 471–84. [Google Scholar] [CrossRef]
- Montalbano, Pierluigi. 2011. Trade Openness and Developing Countries’ Vulnerability: Concepts, Misconcep-tions, and Directions for Research. World Development 39: 1489–502. [Google Scholar] [CrossRef]
- Morrissey, Oliver, Christian Von Haldenwang, Armin Von Schiller, Maksym Ivanyna, and Ingo Bordon. 2016. Tax Revenue Performance and Vulnerability in Developing Countries. The Journal of Development Studies 52: 1689–703. [Google Scholar] [CrossRef]
- Naudé, Wim, Mark McGillivray, and Stephanié Rossouw. 2009. Measuring the vulnerability of subnational regions in South Africa. Oxford Development Studies 37: 249–76. [Google Scholar] [CrossRef]
- Nissanke, Machiko. 2019. Exploring macroeconomic frameworks conducive to structural transformation of sub-Saharan African economies. Structural Change and Economic Dynamics 48: 103–16. [Google Scholar] [CrossRef] [Green Version]
- Novy, Dennis. 2013. Gravity redux: Measuring international trade costs with panel data. Economic Inquiry 51: 101–21. [Google Scholar] [CrossRef]
- Noy, Illan. 2009. The macroeconomic consequences of disasters. Journal of Development Economics 88: 221–31. [Google Scholar] [CrossRef]
- OECD, and WTO. 2015. Aid for Trade at a Glance 2015: Reducing Trade Costs for Inclusive, Sustainable Growth. Chapter 5, “Reducing trade costs for least developed countries”, Contributed by the Executive Secretariat for the Enhanced Integrated Framework. Geneva: WTO. Paris: OECD Publishing. [Google Scholar]
- Oh, Chang Hoon, and Rafael Reuveny. 2010. Climatic natural disasters, political risk, and international trade. Global Environmental Change 20: 243–54. [Google Scholar] [CrossRef]
- Ouattara, Bazoumana, and Eric Strobl. 2008. Foreign aid inflows and the real exchange rate in the CFA franc zone. International Economics 4: 37–51. [Google Scholar] [CrossRef]
- Papalia, Rosa Bernardini, and Silvia Bertarelli. 2015. Trade Costs in Bilateral Trade Flows: Heterogeneity and Zeroes in Structural Gravity Models. The World Economy 38: 1744–62. [Google Scholar] [CrossRef]
- Patnaik, Ila, Joshua Felman, and Ajay Shah. 2017. An exchange market pressure measure for cross country analysis. Journal of International Money and Finance 73: 62–77. [Google Scholar] [CrossRef]
- Pham, Ngoc Thien Anh, and Nicholas Sim. 2020. Shipping cost and development of the landlocked developing countries: Panel evidence from the common correlated effects approach. The World Economy 43: 892–920. [Google Scholar] [CrossRef]
- Portugal-Perez, Alberto, and John S. Wilson. 2012. Export Performance and Trade Facilitation Reform: Hard and Soft Infrastructure. World Development 40: 1295–307. [Google Scholar] [CrossRef]
- Razafindravaosolonirina, Romain Justinien. 2018. Essays on Foreign Direct Investment, Economic Vulnerability and Uncertainty. Economics and Finance. Saint-Denis: Université de la Réunion. [Google Scholar]
- Riddell, Abby, and Miguel Niño-Zarazúa. 2016. The effectiveness of foreign aid to education: What can be learned? International Journal of Educational Development 48: 23–36. [Google Scholar] [CrossRef]
- Ruch, Franz Ulrich. 2020. Prospects, Risks, and Vulnerabilities in Emerging and Developing Economies—Lessons from the Past Decade. Policy Research Working Paper 9181. Washington, DC: World Bank. [Google Scholar]
- Sahay, Ratna, Martin Cihak, Papa M. N’Diaye, Adolfo Barajas, Diana B. Ayala Pena, Ran Bi, Yuan Gao, Annette J. Kyobe, Lam Nguyen, Christian Saborowski, and et al. 2015. Rethinking Financial Deepening: Stability and Growth in Emerging Markets. IMF Staff Discussion Note, SDN/15/08. Washington, DC: International Monetary Fund. [Google Scholar]
- Selaya, Pablo, and Eva Rytter Sunasen. 2012. Does Foreign Aid Increase Foreign Direct Investment? World Development 40: 2155–76. [Google Scholar] [CrossRef] [Green Version]
- Shamout, Sameh, Paola Boarin, and Suzanne Wilkinson. 2021. The shift from sustainability to resilience as a driver for policy change: A policy analysis for more resilient and sustainable cities in Jordan. Sustainable Production and Consumption 25: 285–98. [Google Scholar] [CrossRef]
- Shepherd, Ben. 2022. Modelling global value chains: From trade costs to policy impacts. The World Economy 45: 2478–9. [Google Scholar] [CrossRef]
- Singh, Tarlok. 2010. Does International Trade Cause Economic Growth? A Survey. The World Economy 33: 1517–64. [Google Scholar] [CrossRef]
- Toya, Hideki, and Mark H. Skidmore. 2007. Economic development and the impacts of natural disasters. Economics Letters 94: 20–25. [Google Scholar] [CrossRef]
- Squalli, Jay, and Kenneth Wilson. 2011. A New Measure of Trade Openness. The World Economy 34: 1745–70. [Google Scholar] [CrossRef]
- Svaleryd, Helena, and Jonas Vlachos. 2002. Markets for Risk and Openness to Trade: How are They Related? Journal of International Economics 57: 369–95. [Google Scholar] [CrossRef]
- Unel, Bulent. 2015. Human Capital Formation and International Trade. The B.E. Journal of Economic Analysis & Policy 5: 1067–92. [Google Scholar]
- Vannoorenberghe, Gonzague, Zheng Wang, and Zhihong Yu. 2016. Volatility and diversification of exports: Firm-level theory and evidence. European Economic Review 89: 216–47. [Google Scholar] [CrossRef]
- Vaubourg, Anne-Gaël. 2016. Finance and International Trade: A Review of the Literature. Revue D’économie Politique 1: 57–87. [Google Scholar] [CrossRef]
- Verbeke, Alain, and Wenlong Yuan. 2021. A few implications of the covid-19 pandemic for international business strategy research. Journal of Management Studies 58: 597–601. [Google Scholar] [CrossRef]
- Verschuur, J., E. E. Koks, A. Haque, and J. W. Hall. 2020. Prioritising resilience policies to reduce welfare losses from natural disasters: A case study for coastal Bangladesh. Global Environmental Change 65: 102179. [Google Scholar] [CrossRef]
- Vijil, Mariana, and Laurent Wagner. 2012. Does Aid for Trade Enhance Export Performance? Investigating the Infrastructure Channel. The World Economy 35: 838–68. [Google Scholar] [CrossRef]
- Wagner, Laurent. 2014. Identifying thresholds in aid effectiveness. Review of World Economics 150: 619–38. [Google Scholar] [CrossRef]
- Wang, Zheng, and Meina Xu. 2018. Aid for trade and the quality of exports. Applied Economics Letters 25: 668–73. [Google Scholar] [CrossRef]
- World Bank. 2020. Global Economic Prospects, June 2020. Washington, DC: The World Bank. [Google Scholar]
- World Bank. 2022. World Bank Report on Commodity Markets Outlook, April 2022. Washington, DC: World Bank. [Google Scholar]
- WTO. 2021a. World Trade Report 2021: Economic Resilience and Trade. Geneva: WTO. [Google Scholar]
- WTO. 2021b. Market Access for Products and Services of Export Interest to Least Developed Countries. Note by the Secretariat prepared for the Sub-Committee on Least Developed Countries, WT/COMTD/LDC/W/69, 27 October 2021. Geneva: World Trade Organization. [Google Scholar]
- WTO. 2021c. Easing Trade Bottlenecks in Landlocked Developing Countries. WTO Secretariat Report, 2021. Geneva, Switzerland. Available online: https://www.wto.org/english/res_e/publications_e/landlocked2021_e.htm (accessed on 12 May 2021).
- Yang, Dean. 2008. Coping with disaster: The impact of hurricanes on international financial flows, 1970–2002. B.E. Journal of Economic Analysis & Policy (Advances) 8. [Google Scholar] [CrossRef]
- Yogo, Urbain Thierry, and Douzounet Mallaye. 2015. Health Aid and Health Improvement in Sub-Saharan Africa: Accounting for the Heterogeneity Between Stable States and Post-Conflict States. Journal of International Development 27: 1178–96. [Google Scholar] [CrossRef]
- Yohou, Djedje Hermann, and Michaël Goujon. 2017. Reassessing Tax Effort in Developing Countries: A Proposal of a Vulnerability-Adjusted Tax Effort Index (VATEI). FERDI Working Paper 186. Clermont-Ferrand: Fondation pour les Études et Recherches sur le Développement International (FERDI). [Google Scholar]
- Younas, Javed. 2008. Motivation for bilateral aid allocation: Altruism or trade benefits. European Journal of Political Economy 24: 661–74. [Google Scholar] [CrossRef]


| Variables | Log(TRADE) | Log(TRADE) | Log(TRADE) | Log(TRADE) | Log(TRADE) | Log(TRADE) |
|---|---|---|---|---|---|---|
| (1) | (2) | (3) | (4) | (5) | (6) | |
| Log(TRADE)t−1 | 0.690 *** | 0.667 *** | 0.703 *** | 0.645 *** | 0.656 *** | 0.716 *** |
| (0.0260) | (0.0238) | (0.0249) | (0.0184) | (0.0153) | (0.0214) | |
| Log(EVI) | −0.256 ** | −0.653 *** | ||||
| (0.126) | (0.119) | |||||
| Log(EXPOS) | −0.440 *** | 0.334 | ||||
| (0.104) | (0.207) | |||||
| Log(SHOCK) | −0.0191 | 0.477 ** | ||||
| (0.0546) | (0.210) | |||||
| ERP | −0.540 *** | |||||
| (0.0691) | ||||||
| [Log(EXPOS)]×Log(SHOCK)] | −0.166 *** | |||||
| (0.0620) | ||||||
| [Log(EVI)]×INST | −0.209 *** | |||||
| (0.0376) | ||||||
| Log(TRCOST) | −0.665 *** | −0.589 *** | −0.519 *** | −0.784 *** | −0.682 *** | −0.426 *** |
| (0.168) | (0.164) | (0.162) | (0.122) | (0.106) | (0.149) | |
| Log(ODA) | 0.105 *** | 0.137 *** | 0.167 *** | 0.170 *** | 0.123 *** | 0.114 *** |
| (0.0306) | (0.0287) | (0.0314) | (0.0220) | (0.0168) | (0.0266) | |
| Log(GDPC) | 0.0112 | 0.267 *** | 0.108 | 0.0507 | 0.155 *** | −0.0232 |
| (0.0704) | (0.0539) | (0.0660) | (0.0510) | (0.0377) | (0.0556) | |
| Log(FD) | 0.342 *** | 0.0991 | 0.483 *** | 0.672 *** | 0.314 *** | 0.339 *** |
| (0.108) | (0.0812) | (0.106) | (0.0601) | (0.0519) | (0.0940) | |
| INST | −0.104 *** | −0.0823 *** | −0.119 *** | −0.0855 *** | −0.149 *** | 0.637 *** |
| (0.0242) | (0.0227) | (0.0275) | (0.0208) | (0.0131) | (0.141) | |
| Log(TERMS) | 0.325 *** | 0.329 *** | 0.317 *** | 0.365 *** | 0.294 *** | 0.265 *** |
| (0.0664) | (0.0638) | (0.0652) | (0.0471) | (0.0409) | (0.0514) | |
| DUMOUT | 0.542 *** | 0.615 *** | 0.646 *** | 0.793 *** | 0.448 *** | 0.687 *** |
| (0.0989) | (0.101) | (0.105) | (0.0823) | (0.0595) | (0.0918) | |
| Observations–Countries | 652–118 | 683–118 | 654–118 | 617–108 | 652–118 | 652–118 |
| AR1 (p-Value) | 0.0307 | 0.0273 | 0.0344 | 0.0116 | 0.0428 | 0.0282 |
| AR2 (p-Value) | 0.8779 | 0.9582 | 0.8161 | 0.4862 | 0.9099 | 0.8367 |
| AR3 (p-Value) | 0.6088 | 0.7975 | 0.6617 | 0.7244 | 0.6429 | 0.6425 |
| OID (p-Value) | 0.3024 | 0.1819 | 0.2970 | 0.4253 | 0.3106 | 0.5757 |
| Variables | Log(TS) | Log(TS) | Log(TS) |
|---|---|---|---|
| (1) | (2) | (3) | |
| Log(TS)t−1 | 0.682 *** | 0.584 *** | 0.662 *** |
| (0.0256) | (0.0192) | (0.0245) | |
| Log(EVI) | −0.0163 | ||
| (0.0484) | |||
| Log(EXPOS) | 0.263 *** | ||
| (0.0493) | |||
| Log(SHOCK) | −0.106 *** | ||
| (0.0230) | |||
| Log(TRCOST) | −0.220 *** | −0.423 *** | −0.264 *** |
| (0.0787) | (0.0784) | (0.0770) | |
| Log(ODA) | −0.0532 *** | −0.0247 | −0.0595 *** |
| (0.0132) | (0.0162) | (0.0112) | |
| Log(GDPC) | −0.0667 * | −0.0579 * | −0.102 *** |
| (0.0376) | (0.0344) | (0.0331) | |
| Log(FD) | −0.00740 | 0.0746 * | −0.0543 |
| (0.0434) | (0.0442) | (0.0416) | |
| INST | 0.0133 | −0.0106 | 0.0311 *** |
| (0.0110) | (0.0128) | (0.0107) | |
| Log(TERMS) | −0.0411 | −0.0495 ** | −0.0409 |
| (0.0255) | (0.0232) | (0.0263) | |
| DUMOUT | 0.620 *** | 0.454 *** | 0.491 *** |
| (0.0749) | (0.0627) | (0.0652) | |
| Observations–Countries | 652–118 | 683–118 | 654–118 |
| AR1 (p-Value) | 0.0014 | 0.0023 | 0.0014 |
| AR2 (p-Value) | 0.9460 | 0.6750 | 0.8447 |
| AR3 (p-Value) | 0.1189 | 0.10 | 0.1786 |
| OID (p-Value) | 0.4660 | 0.2900 | 0.2662 |
| Variables | Log(TRADE) | Log(TRADE) | Log(TRADE) |
|---|---|---|---|
| (1) | (2) | (3) | |
| Log(TRADE)t−1 | 0.637 *** | 0.593 *** | 0.686 *** |
| (0.0244) | (0.0216) | (0.0244) | |
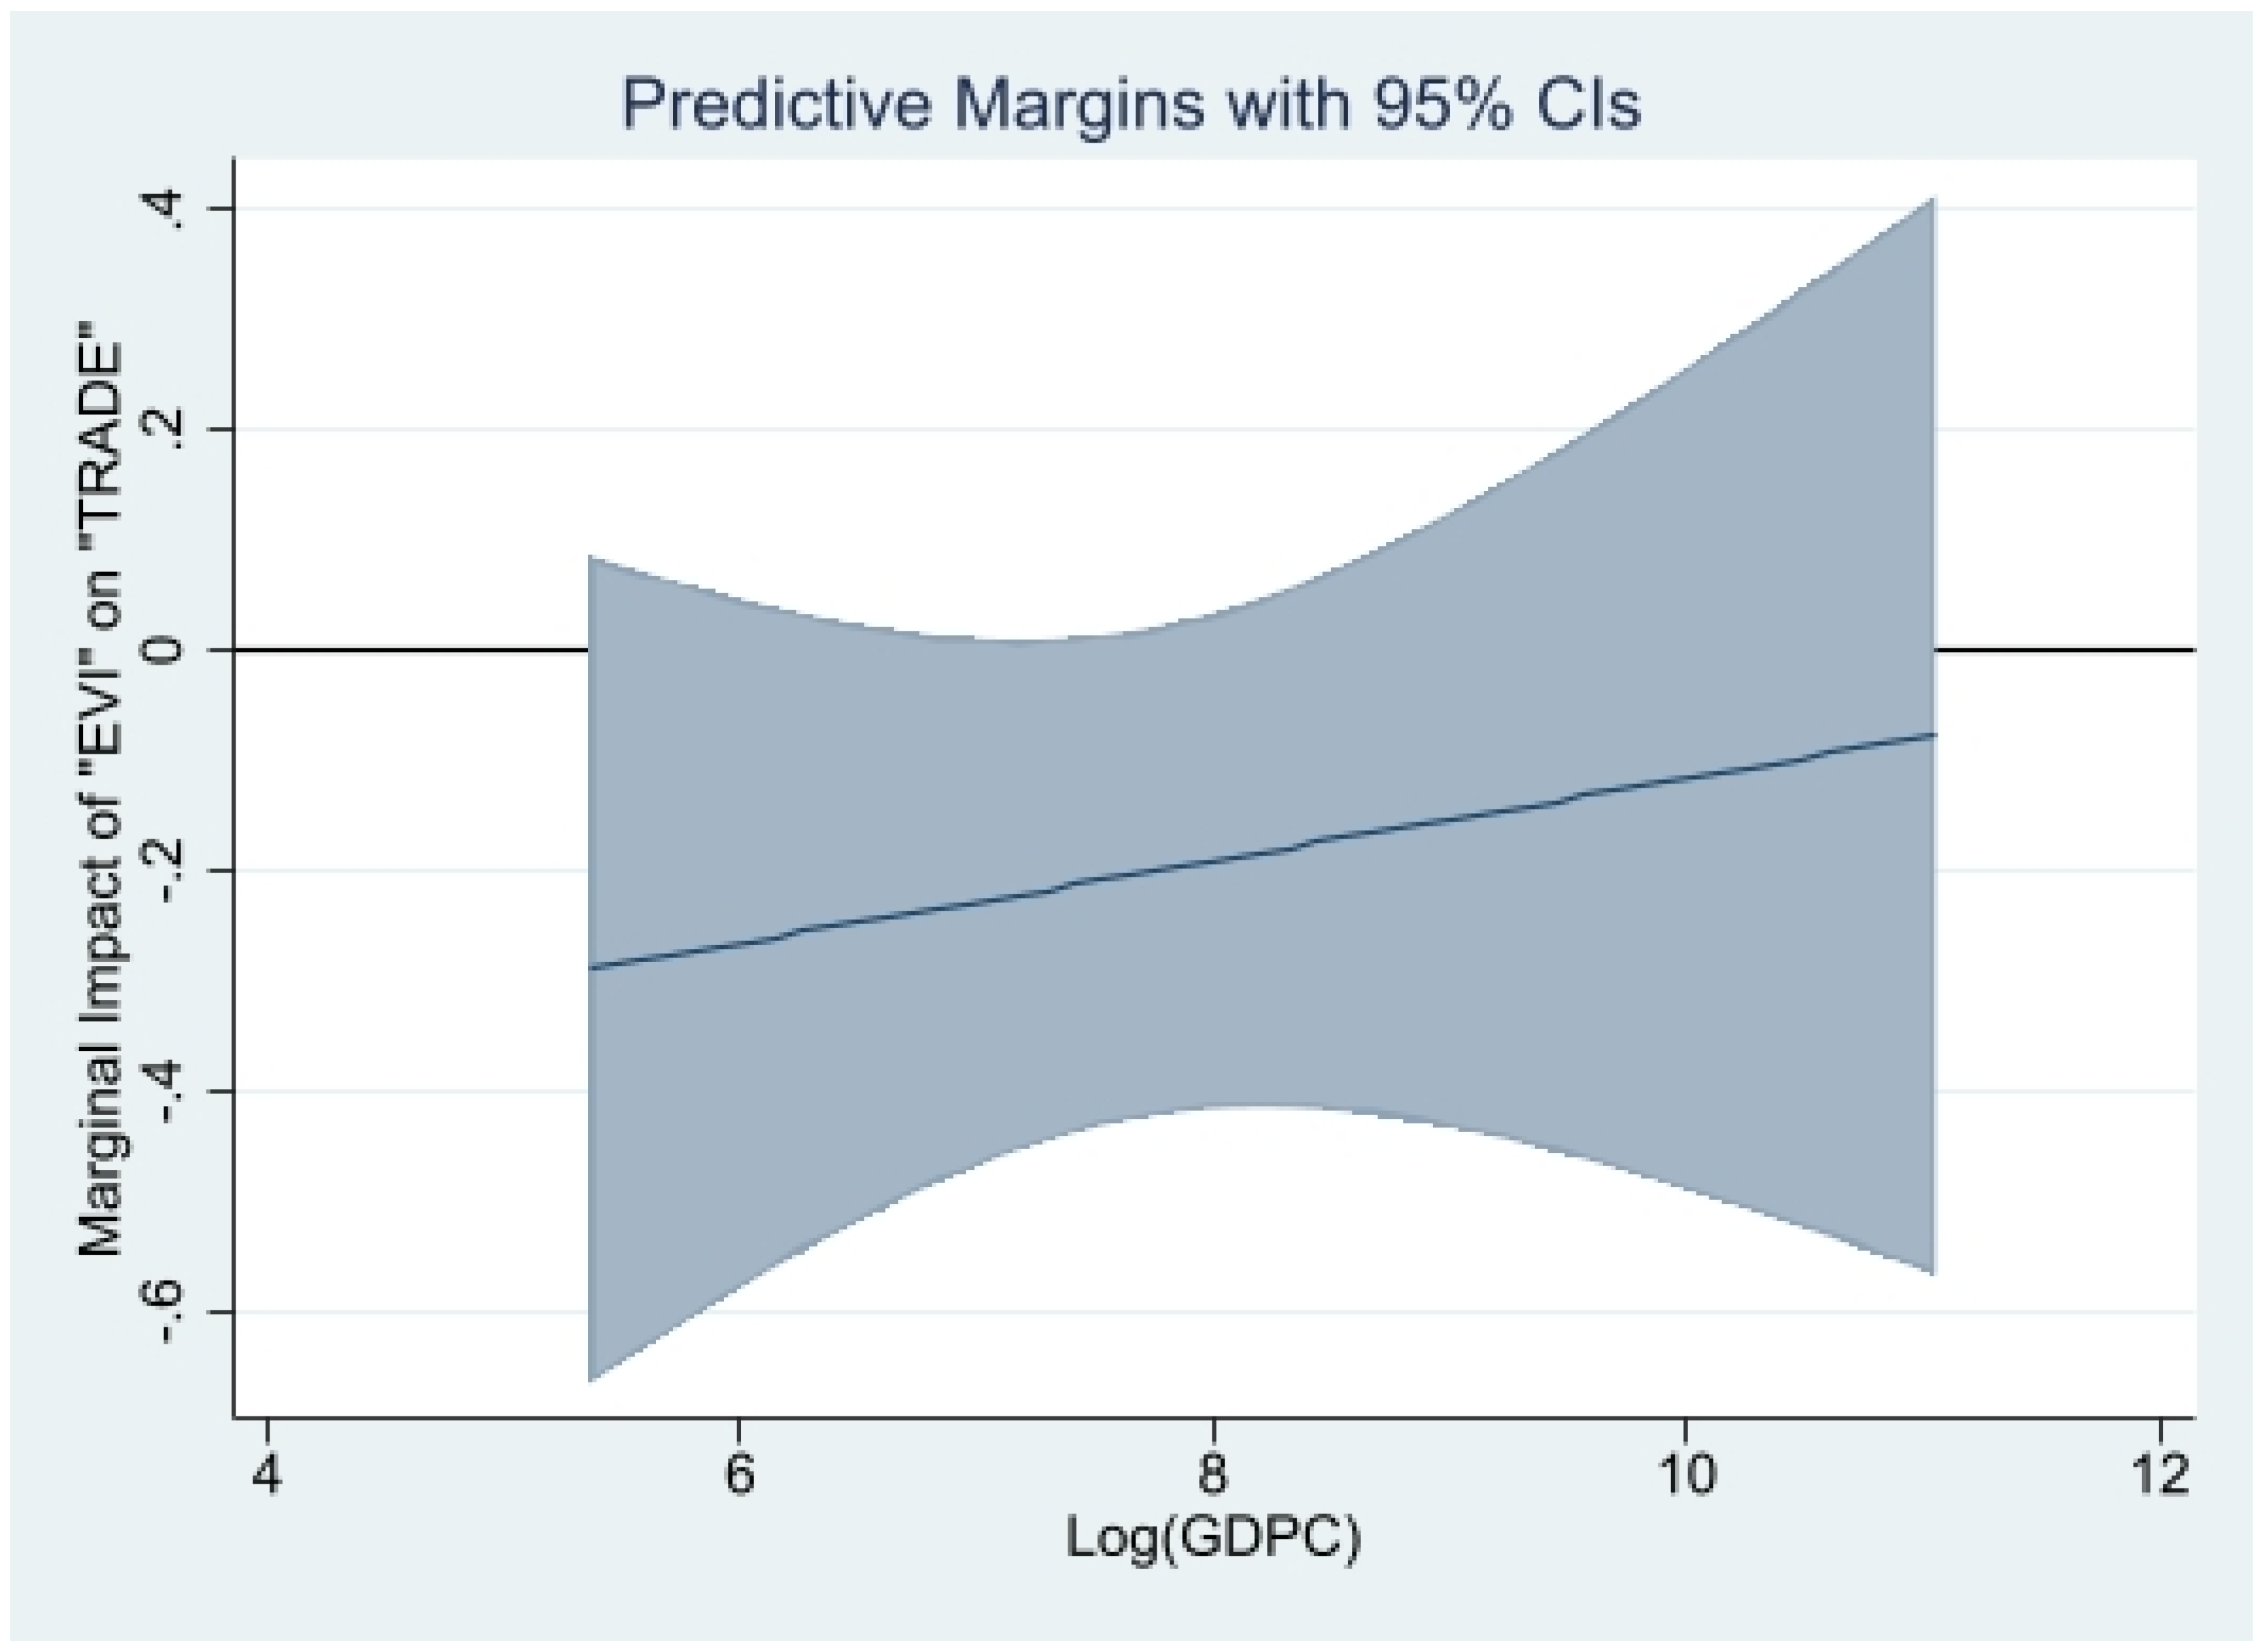
| [Log(EVI)]×Log(GDPC] | 0.0374 | ||
| (0.0664) | |||
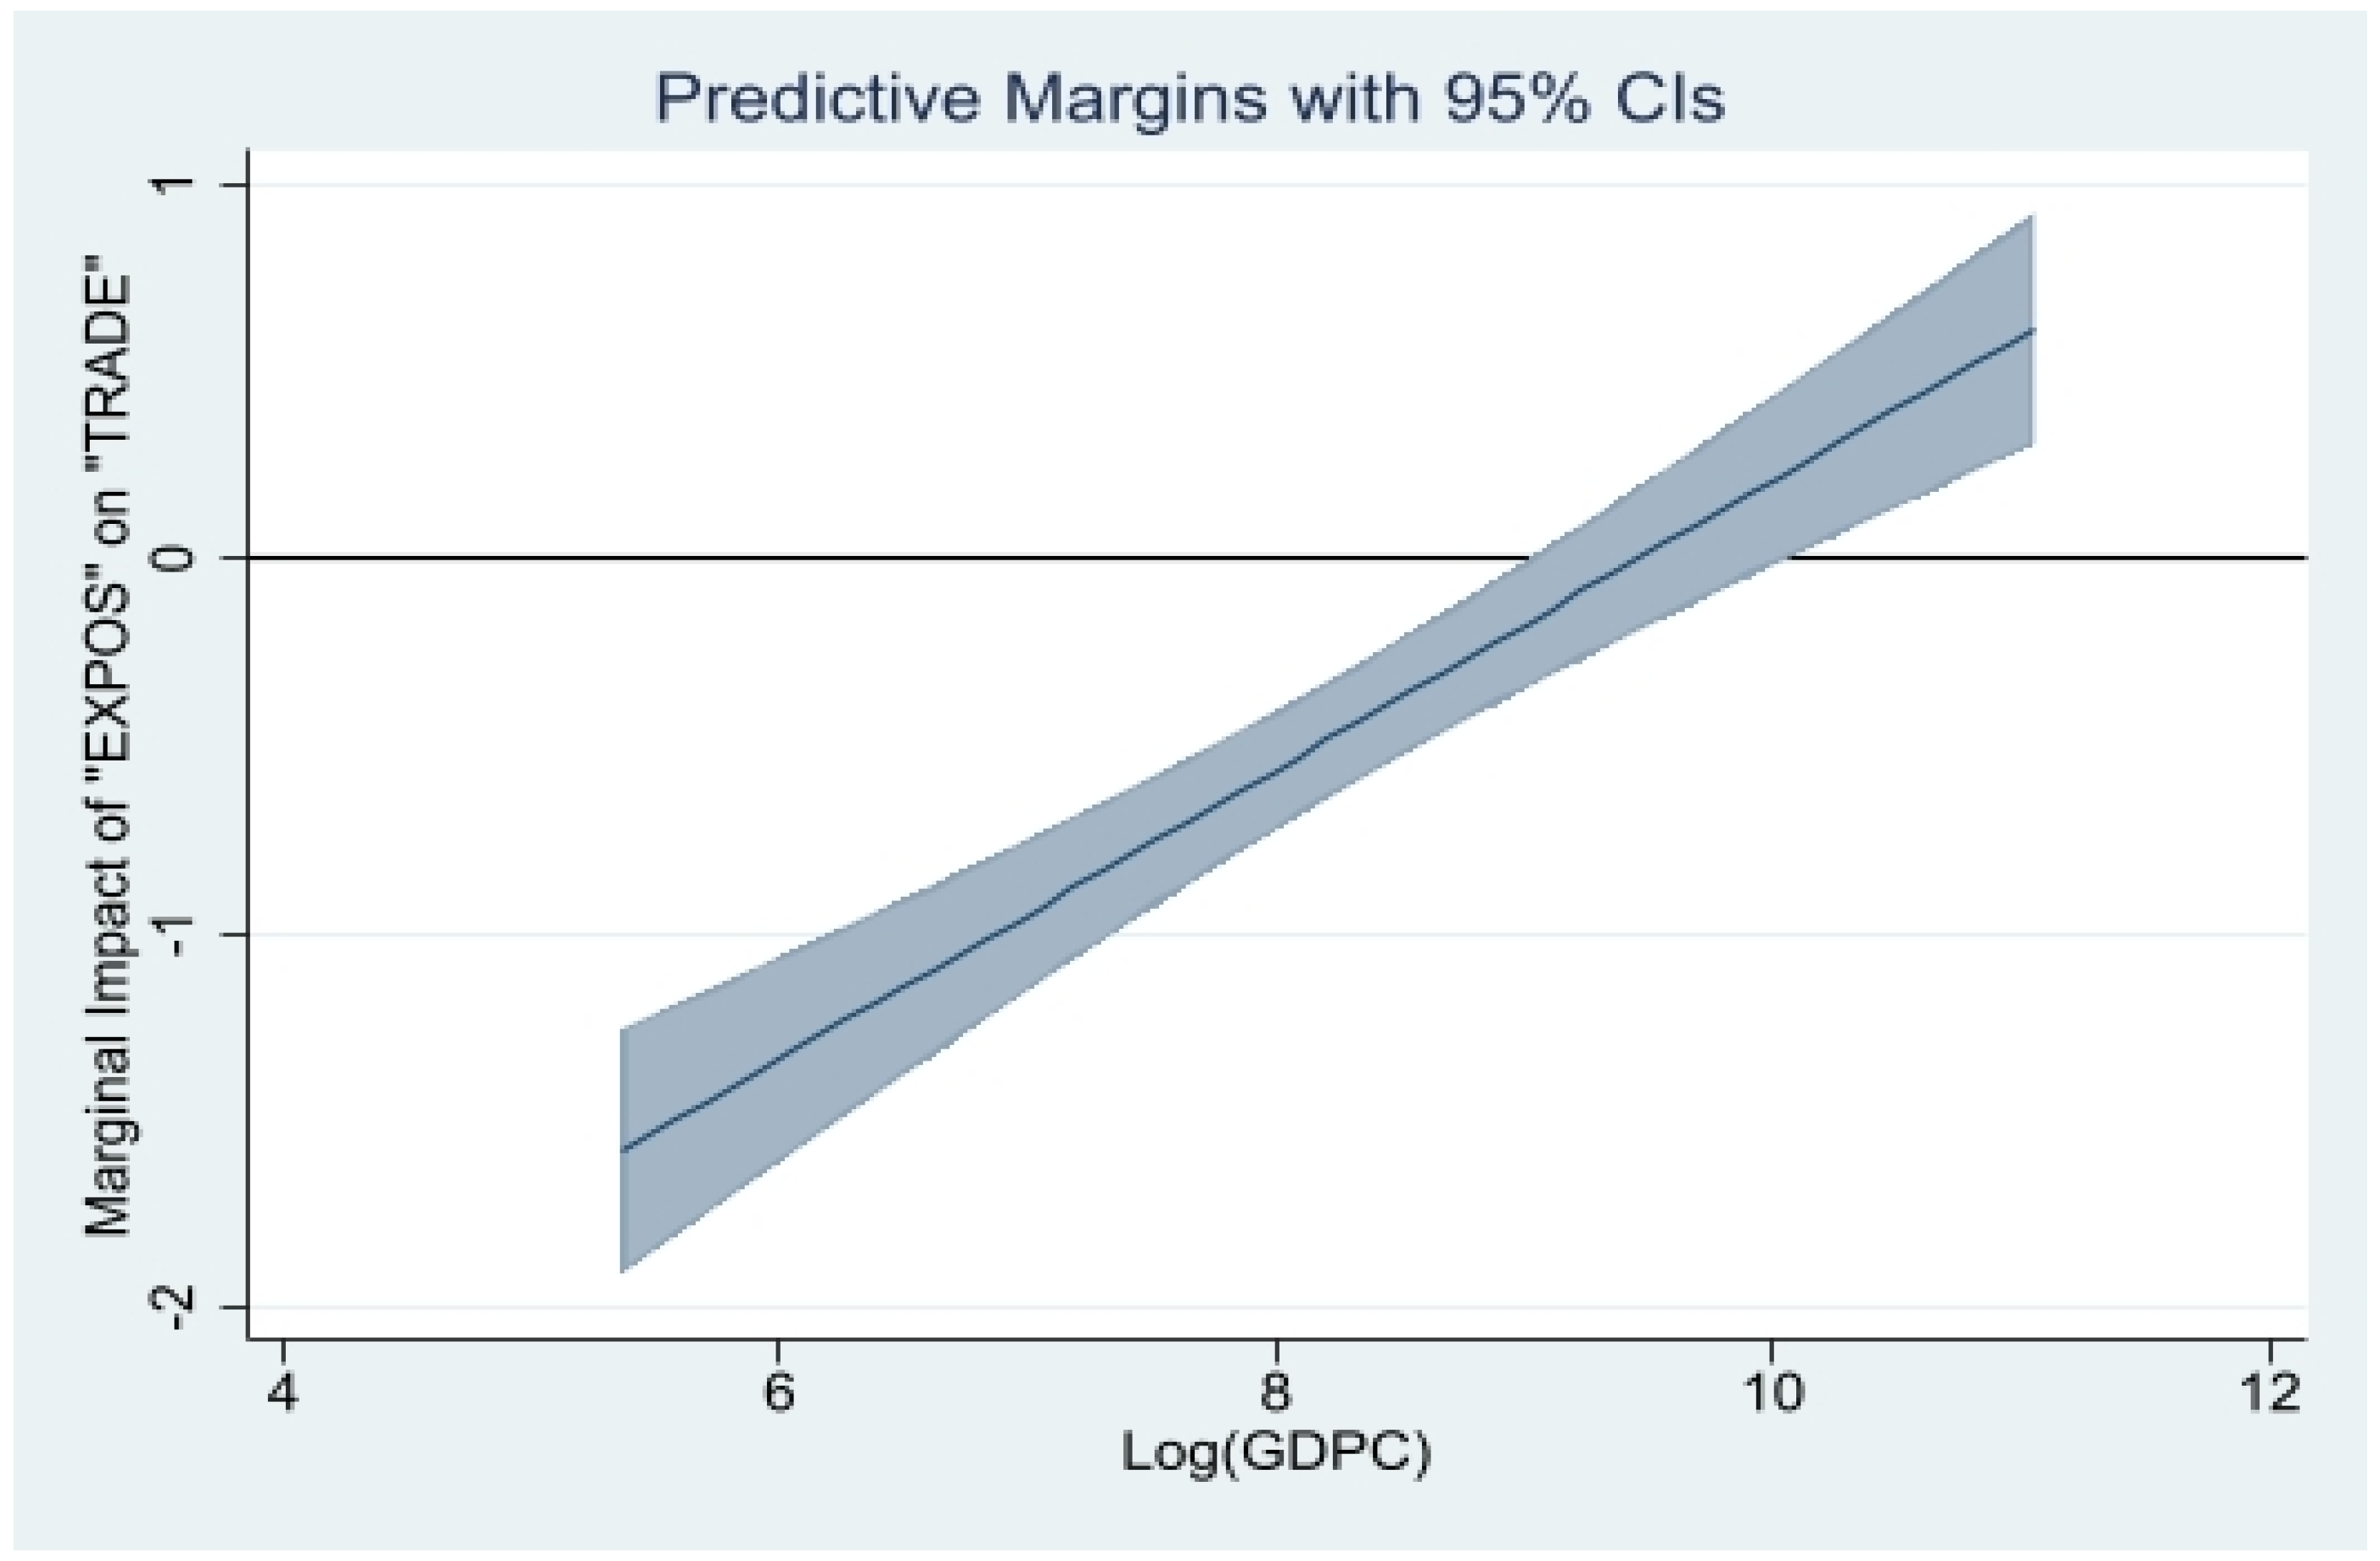
| [Log(EXPOS)]×[Log(GDPC] | 0.386 *** | ||
| (0.0497) | |||
| Log(EXPOS) | −3.654 *** | ||
| (0.421) | |||
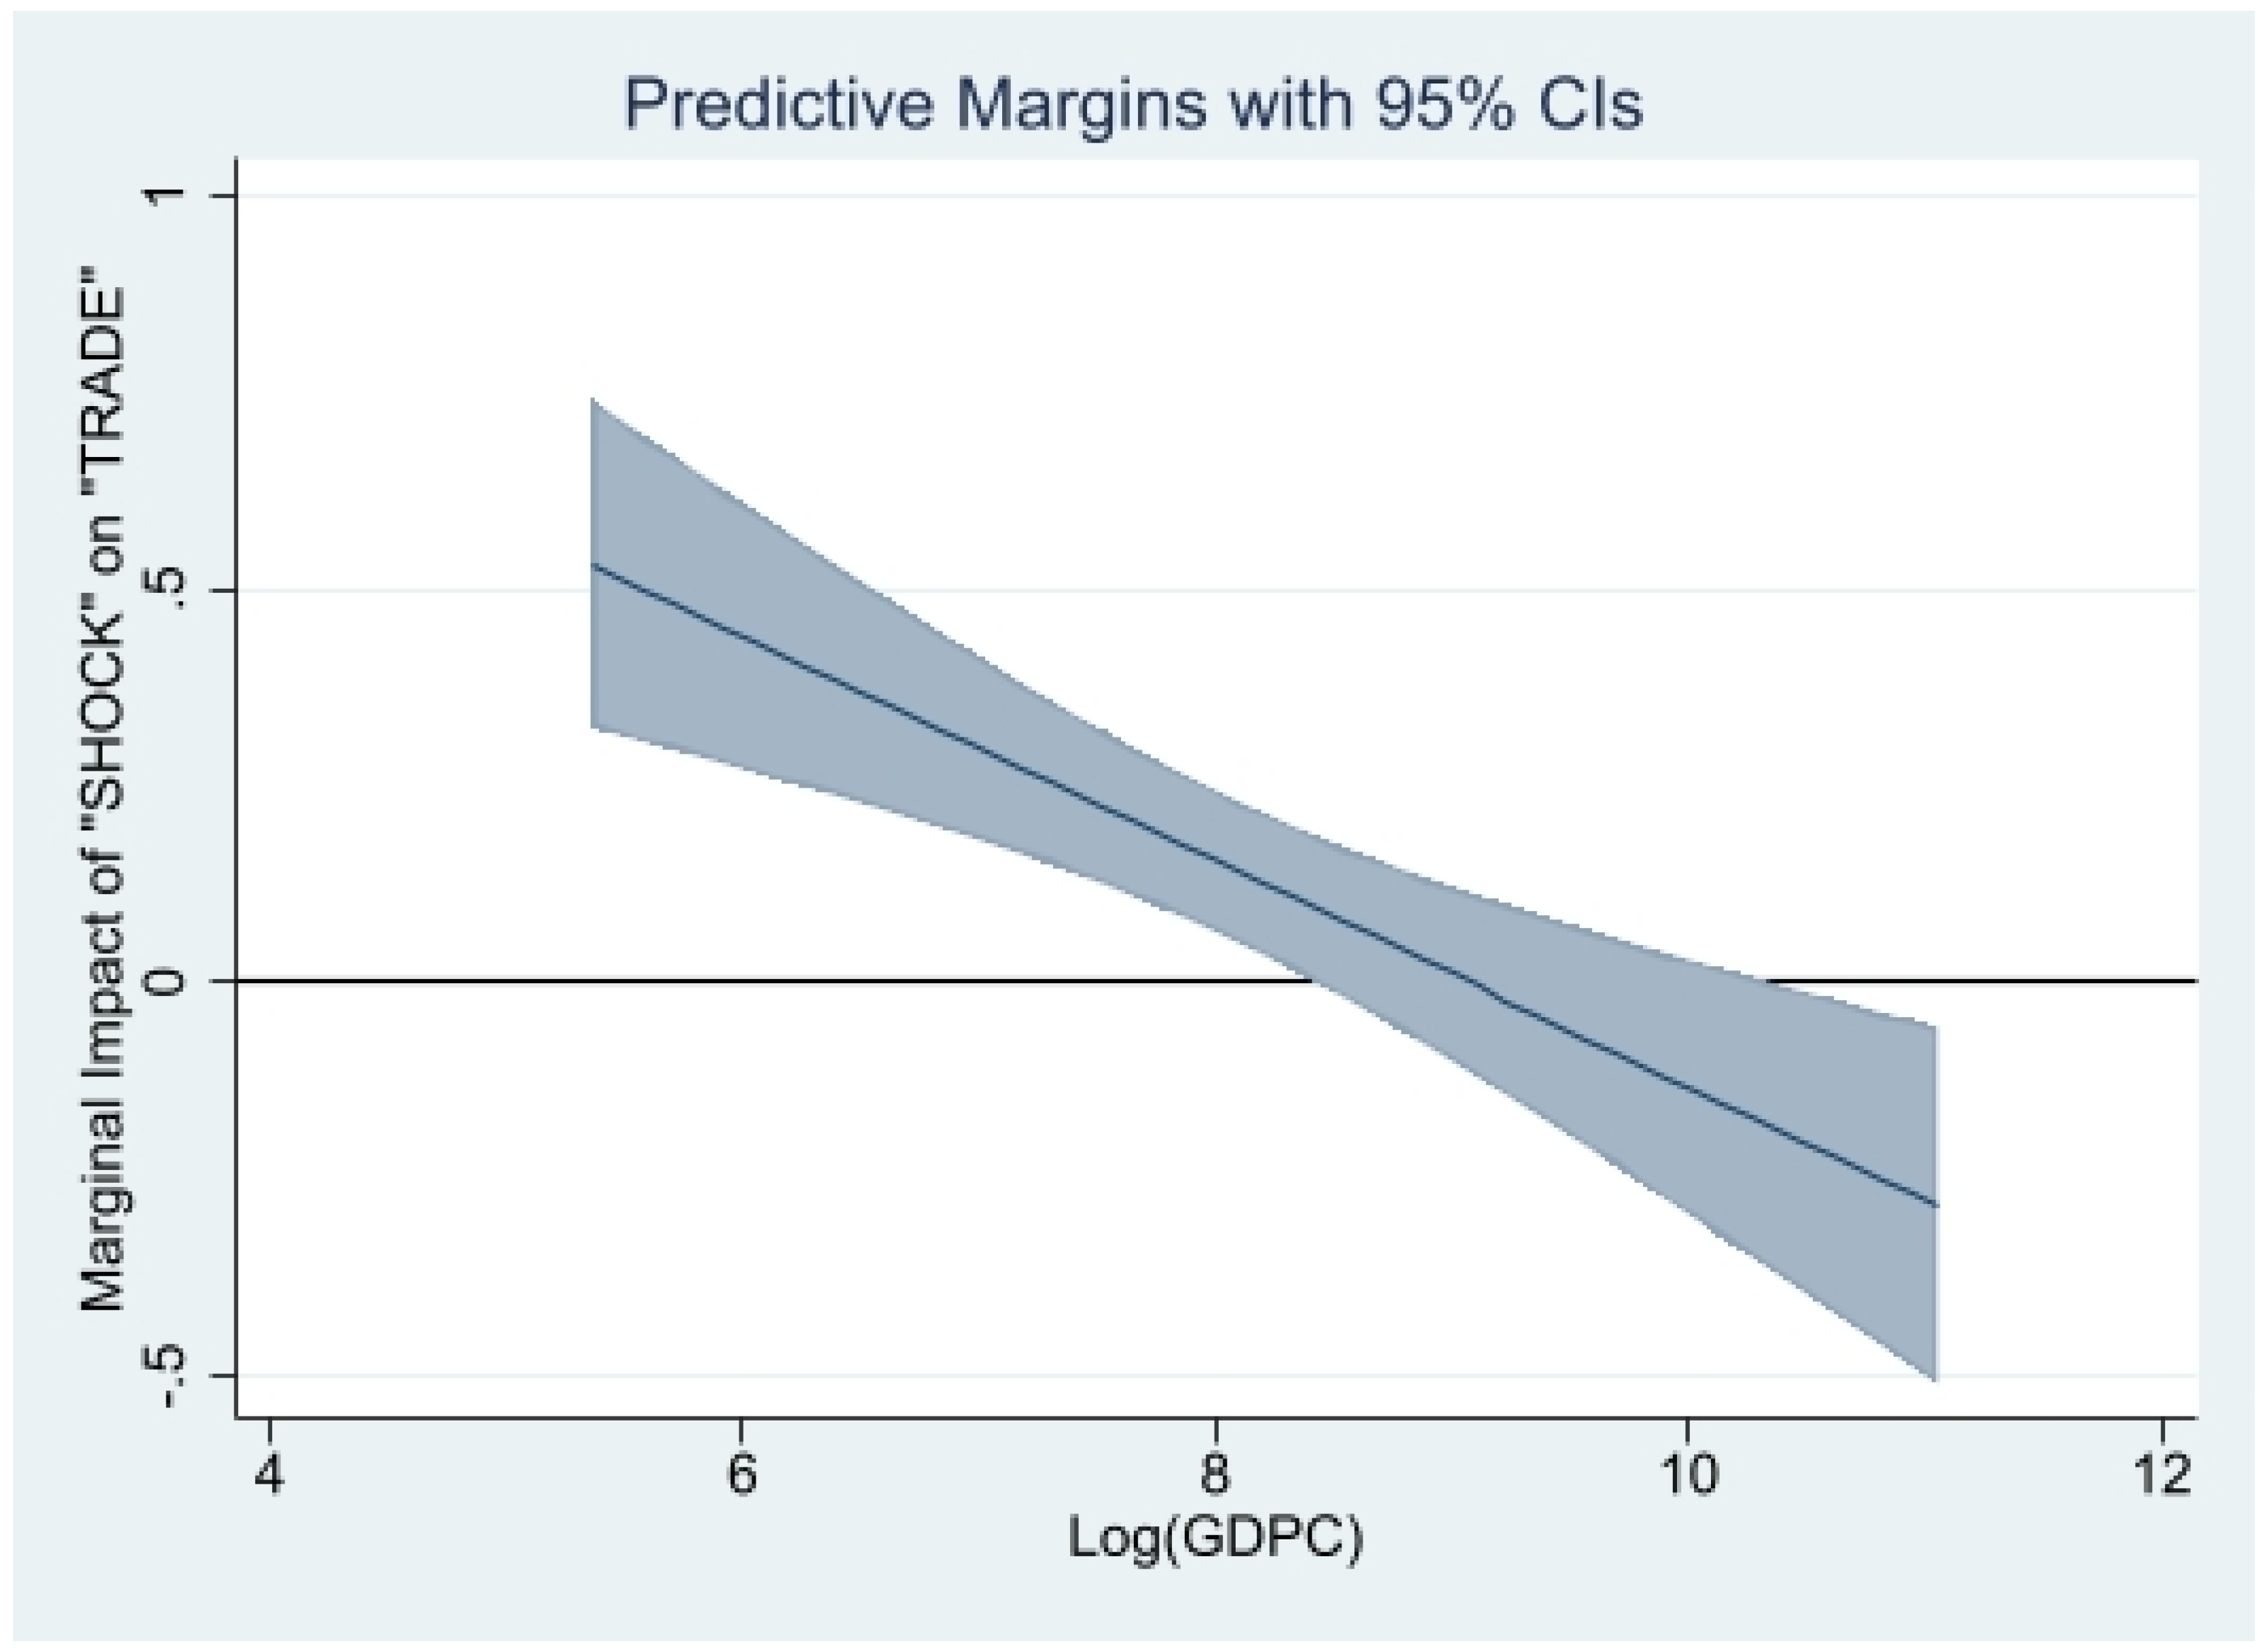
| [Log(SHOCK)]×[Log(GDPC] | −0.143 *** | ||
| (0.0355) | |||
| Log(SHOCK) | 1.299 *** | ||
| (0.290) | |||
| Log(EVI) | −0.491 | ||
| (0.524) | |||
| Log(TRCOST) | −0.774 *** | −0.991 *** | −0.609 *** |
| (0.139) | (0.118) | (0.135) | |
| Log(ODA) | 0.227 *** | 0.195 *** | 0.243 *** |
| (0.0215) | (0.0197) | (0.0241) | |
| Log(GDPC) | 0.0977 | −1.007 *** | 0.830 *** |
| (0.252) | (0.184) | (0.146) | |
| Log(FD) | 0.311 *** | 0.0800 | 0.369 *** |
| (0.0775) | (0.0730) | (0.0611) | |
| INST | −0.132 *** | −0.120 *** | −0.151 *** |
| (0.0194) | (0.0149) | (0.0214) | |
| Log(TERMS) | 0.345 *** | 0.412 *** | 0.262 *** |
| (0.0538) | (0.0506) | (0.0561) | |
| DUMOUT | 0.874 *** | 0.601 *** | 1.133 *** |
| (0.130) | (0.104) | (0.119) | |
| Observations–Countries | 652–118 | 683–118 | 654–118 |
| AR1 (p-Value) | 0.0234 | 0.0269 | 0.0260 |
| AR2 (p-Value) | 0.9710 | 0.7756 | 0.8569 |
| AR3 (p-Value) | 0.5479 | 0.5830 | 0.8549 |
| OID (p-Value) | 0.3270 | 0.3954 | 0.6195 |
| Variables | Log(TRADE) | Log(TRADE) | Log(TRADE) |
|---|---|---|---|
| (1) | (2) | (3) | |
| Log(TRADE)t−1 | 0.635 *** | 0.582 *** | 0.687 *** |
| (0.0183) | (0.0180) | (0.0168) | |
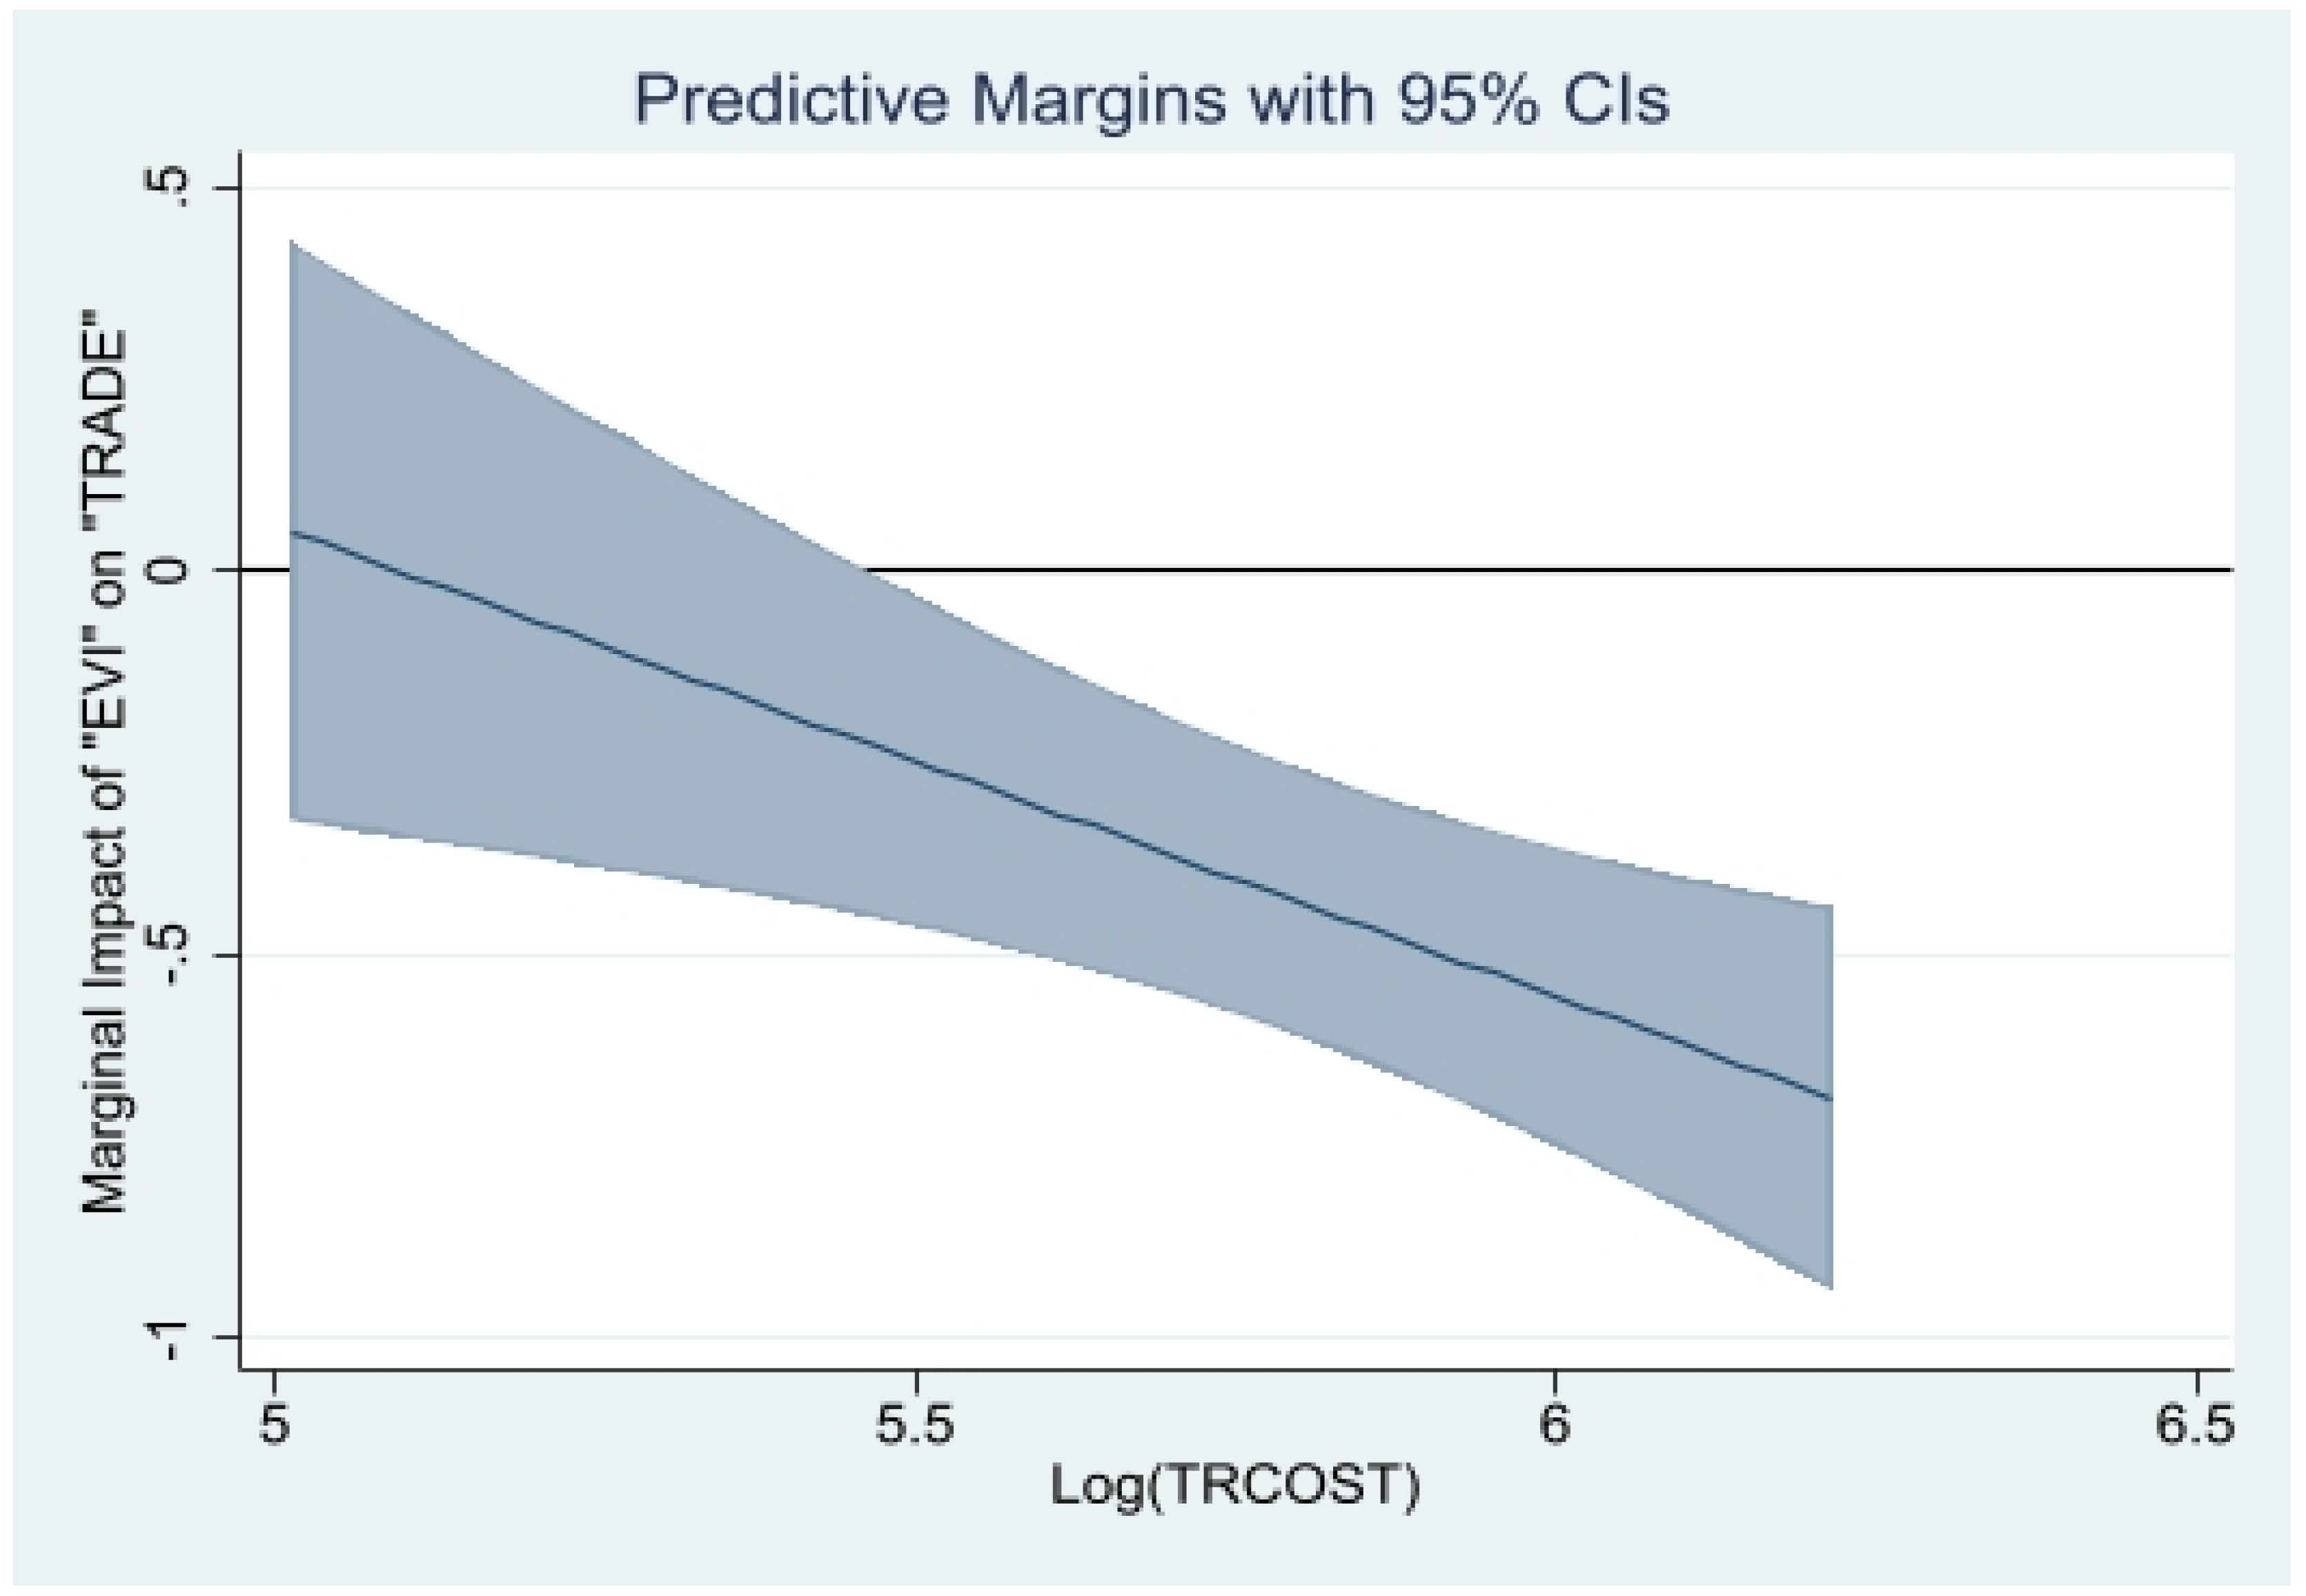
| [Log(EVI)]×[Log(TRCOST)] | −0.615 *** | ||
| (0.218) | |||
| Log(EVI) | 3.132 ** | ||
| (1.266) | |||
| [Log(EXPOS)]×[Log(TRCOST)] | −0.962 *** | ||
| (0.123) | |||
| Log(EXPOS) | 4.938 *** | ||
| (0.665) | |||
| [Log(SHOCK)]×[Log(TRCOST)] | 0.118 | ||
| (0.116) | |||
| Log(SHOCK) | −0.721 | ||
| (0.661) | |||
| Log(TRCOST) | 1.588 ** | 2.573 *** | −0.582 * |
| (0.704) | (0.447) | (0.335) | |
| Log(ODA) | 0.118 *** | 0.181 *** | 0.178 *** |
| (0.0237) | (0.0216) | (0.0240) | |
| Log(GDPC) | −0.0157 | 0.337 *** | 0.105 ** |
| (0.0500) | (0.0457) | (0.0425) | |
| Log(FD) | 0.449 *** | 0.215 *** | 0.572 *** |
| (0.0658) | (0.0664) | (0.0645) | |
| INST | −0.106 *** | −0.110 *** | −0.0912 *** |
| (0.0212) | (0.0179) | (0.0252) | |
| Log(TERMS) | 0.386 *** | 0.322 *** | 0.369 *** |
| (0.0551) | (0.0467) | (0.0490) | |
| DUMOUT | 0.287 *** | 0.484 *** | 0.648 *** |
| (0.0844) | (0.0700) | (0.0929) | |
| Observations–Countries | 652–118 | 683–118 | 654–118 |
| AR1 (p-Value) | 0.0365 | 0.0365 | 0.0333 |
| AR2 (p-Value) | 0.9225 | 0.7843 | 0.8305 |
| AR3 (p-Value) | 0.4776 | 0.5534 | 0.6870 |
| OID (p-Value) | 0.2106 | 0.3430 | 0.4943 |
| Variables | Log(TRADE) | Log(TRADE) | Log(TRADE) |
|---|---|---|---|
| (1) | (2) | (3) | |
| Log(TRADE)t−1 | 0.706 *** | 0.577 *** | 0.773 *** |
| (0.0180) | (0.0222) | (0.0163) | |
| [Log(EVI)]×[Log(ODA)] | 0.288 *** | ||
| (0.0220) | |||
| Log(EVI) | −5.738 *** | ||
| (0.428) | |||
| [Log(EXPOS)]×[Log(ODA)] | 0.277 *** | ||
| (0.0256) | |||
| Log(EXPOS) | −5.934 *** | ||
| (0.543) | |||
| [Log(SHOCK)]×[Log(ODA)] | 0.0711 *** | ||
| (0.0157) | |||
| Log(SHOCK) | −1.324 *** | ||
| (0.300) | |||
| Log(TRCOST) | −0.831 *** | −0.921 *** | −0.446 *** |
| (0.0985) | (0.147) | (0.0981) | |
| Log(ODA) | −0.838 *** | −0.777 *** | −0.127 ** |
| (0.0730) | (0.0955) | (0.0523) | |
| Log(GDPC) | 0.138 *** | 0.387 *** | 0.0503 |
| (0.0445) | (0.0451) | (0.0318) | |
| Log(FD) | 0.343 *** | 0.190 ** | 0.481 *** |
| (0.0739) | (0.0749) | (0.0748) | |
| INST | −0.101 *** | −0.122 *** | −0.0933 *** |
| (0.0210) | (0.0187) | (0.0209) | |
| Log(TERMS) | 0.0930 ** | 0.150 *** | 0.209 *** |
| (0.0471) | (0.0511) | (0.0508) | |
| DUMOUT | 0.840 *** | 0.388 *** | 0.979 *** |
| (0.0867) | (0.0874) | (0.0787) | |
| Observations–Countries | 652–118 | 683–118 | 654–118 |
| Turning point of “ODA” (in million USD) above which the effect of EVI (or its components) is positive | 449.5 = exponential (5.738/0.288) | 2012 = exponential (5.934/0.277) | 122.3 = exponential (1.324/0.0711) |
| AR1 (p-Value) | 0.0294 | 0.0223 | 0.0346 |
| AR2 (p-Value) | 0.8250 | 0.7676 | 0.7162 |
| AR3 (p-Value) | 0.6795 | 0.6562 | 0.8491 |
| OID (p-Value) | 0.4362 | 0.4527 | 0.6182 |
| Variables | Log(TRADE) | Log(TRADE) | Log(TRADE) | Log(TRADE) | Log(TRADE) | Log(TRADE) |
|---|---|---|---|---|---|---|
| (1) | (2) | (3) | (4) | (5) | (6) | |
| Log(TRADE)t−1 | 0.635 *** | 0.580 *** | 0.679 *** | 0.659 *** | 0.589 *** | 0.701 *** |
| (0.0148) | (0.0156) | (0.0139) | (0.0150) | (0.0162) | (0.0157) | |
| Log(EVI) | 6.477 *** | 1.784 | ||||
| (1.070) | (1.109) | |||||
| [Log(EVI)]×[Log(TRCOST)] | −1.199 *** | −0.374 * | ||||
| (0.188) | (0.195) | |||||
| [Log(EVI)]×[Log(TRCOST)]×LLDC | 0.102 *** | |||||
| (0.0266) | ||||||
| [Log(EVI)]×[Log(TRCOST)]×LDC | −0.0678 *** | |||||
| (0.0157) | ||||||
| Log(EXPOS) | 6.808 *** | 3.153 *** | ||||
| (0.607) | (0.419) | |||||
| [Log(EXPOS)]×[Log(TRCOST)] | −1.293 *** | −0.660 *** | ||||
| (0.113) | (0.0774) | |||||
| [Log(EXPOS)]×[Log(TRCOST)]×LLDC | 0.128 *** | |||||
| (0.0280) | ||||||
| [Log(EXPOS)]×[Log(TRCOST)]×LDC | −0.0512 *** | |||||
| (0.0180) | ||||||
| Log(SHOCK) | 2.129 *** | 0.114 | ||||
| (0.636) | (0.530) | |||||
| [Log(SHOCK)]×[Log(TRCOST)] | −0.376 *** | −0.0241 | ||||
| (0.114) | (0.0929) | |||||
| [Log(SHOCK)]×[Log(TRCOST)]×LLDC | 0.0383 ** | |||||
| (0.0188) | ||||||
| [Log(SHOCK)]×[Log(TRCOST)]×LDC | −0.0421 *** | |||||
| (0.0102) | ||||||
| LLDCs | −2.340 *** | −2.623 *** | −0.877 ** | |||
| (0.570) | (0.576) | (0.414) | ||||
| LDCs | 1.521 *** | 1.289 *** | 0.987 *** | |||
| (0.342) | (0.371) | (0.233) | ||||
| Log(TRCOST) | 3.695 *** | 3.825 *** | 0.976 *** | 1.005 | 1.475 *** | −0.00502 |
| (0.628) | (0.425) | (0.340) | (0.623) | (0.284) | (0.259) | |
| Log(ODA) | 0.182 *** | 0.200 *** | 0.236 *** | 0.151 *** | 0.114 *** | 0.236 *** |
| (0.0199) | (0.0171) | (0.0238) | (0.0179) | (0.0132) | (0.0181) | |
| Log(GDPC) | 0.189 *** | 0.391 *** | 0.314 *** | 0.162 *** | 0.339 *** | 0.277 *** |
| (0.0337) | (0.0358) | (0.0335) | (0.0374) | (0.0380) | (0.0369) | |
| Log(FD) | 0.318 *** | 0.225 *** | 0.357 *** | 0.369 *** | 0.236 *** | 0.444 *** |
| (0.0567) | (0.0586) | (0.0509) | (0.0466) | (0.0435) | (0.0468) | |
| INST | −0.134 *** | −0.122 *** | −0.129 *** | −0.104 *** | −0.107 *** | −0.121 *** |
| (0.0112) | (0.0154) | (0.0137) | (0.0134) | (0.0175) | (0.0154) | |
| Log(TERMS) | 0.254 *** | 0.256 *** | 0.271 *** | 0.250 *** | 0.267 *** | 0.257 *** |
| (0.0336) | (0.0370) | (0.0385) | (0.0235) | (0.0301) | (0.0376) | |
| DUMOUT | 0.359 *** | 0.605 *** | 0.614 *** | 0.271 *** | 0.346 *** | 0.447 *** |
| (0.0764) | (0.0704) | (0.0822) | (0.0828) | (0.0812) | (0.0768) | |
| Observations–Countries | 652–118 | 683–118 | 654–118 | 652–118 | 683–118 | 654–118 |
| AR1 (p-Value) | 0.0370 | 0.0349 | 0.0316 | 0.0335 | 0.0395 | 0.0302 |
| AR2 (p-Value) | 0.9566 | 0.8249 | 0.9007 | 0.8850 | 0.8960 | 0.8483 |
| AR3 (p-Value) | 0.4766 | 0.6010 | 0.6069 | 0.5957 | 0.6556 | 0.6357 |
| OID (p-Value) | 0.4055 | 0.4777 | 0.5541 | 0.2677 | 0.3668 | 0.5639 |
Publisher’s Note: MDPI stays neutral with regard to jurisdictional claims in published maps and institutional affiliations. |
© 2022 by the author. Licensee MDPI, Basel, Switzerland. This article is an open access article distributed under the terms and conditions of the Creative Commons Attribution (CC BY) license (https://creativecommons.org/licenses/by/4.0/).
Share and Cite
Gnangnon, S.K. Effect of Structural Economic Vulnerability on the Participation in International Trade. J. Risk Financial Manag. 2022, 15, 417. https://doi.org/10.3390/jrfm15090417
Gnangnon SK. Effect of Structural Economic Vulnerability on the Participation in International Trade. Journal of Risk and Financial Management. 2022; 15(9):417. https://doi.org/10.3390/jrfm15090417
Chicago/Turabian StyleGnangnon, Sena Kimm. 2022. "Effect of Structural Economic Vulnerability on the Participation in International Trade" Journal of Risk and Financial Management 15, no. 9: 417. https://doi.org/10.3390/jrfm15090417