
Sustainable versus Conventional Cryptocurrencies in the Face of Cryptocurrency Uncertainty Indices: An Analysis across Time and Scales


Abstract
:1. Introduction
2. Related Studies
3. Materials and Methods
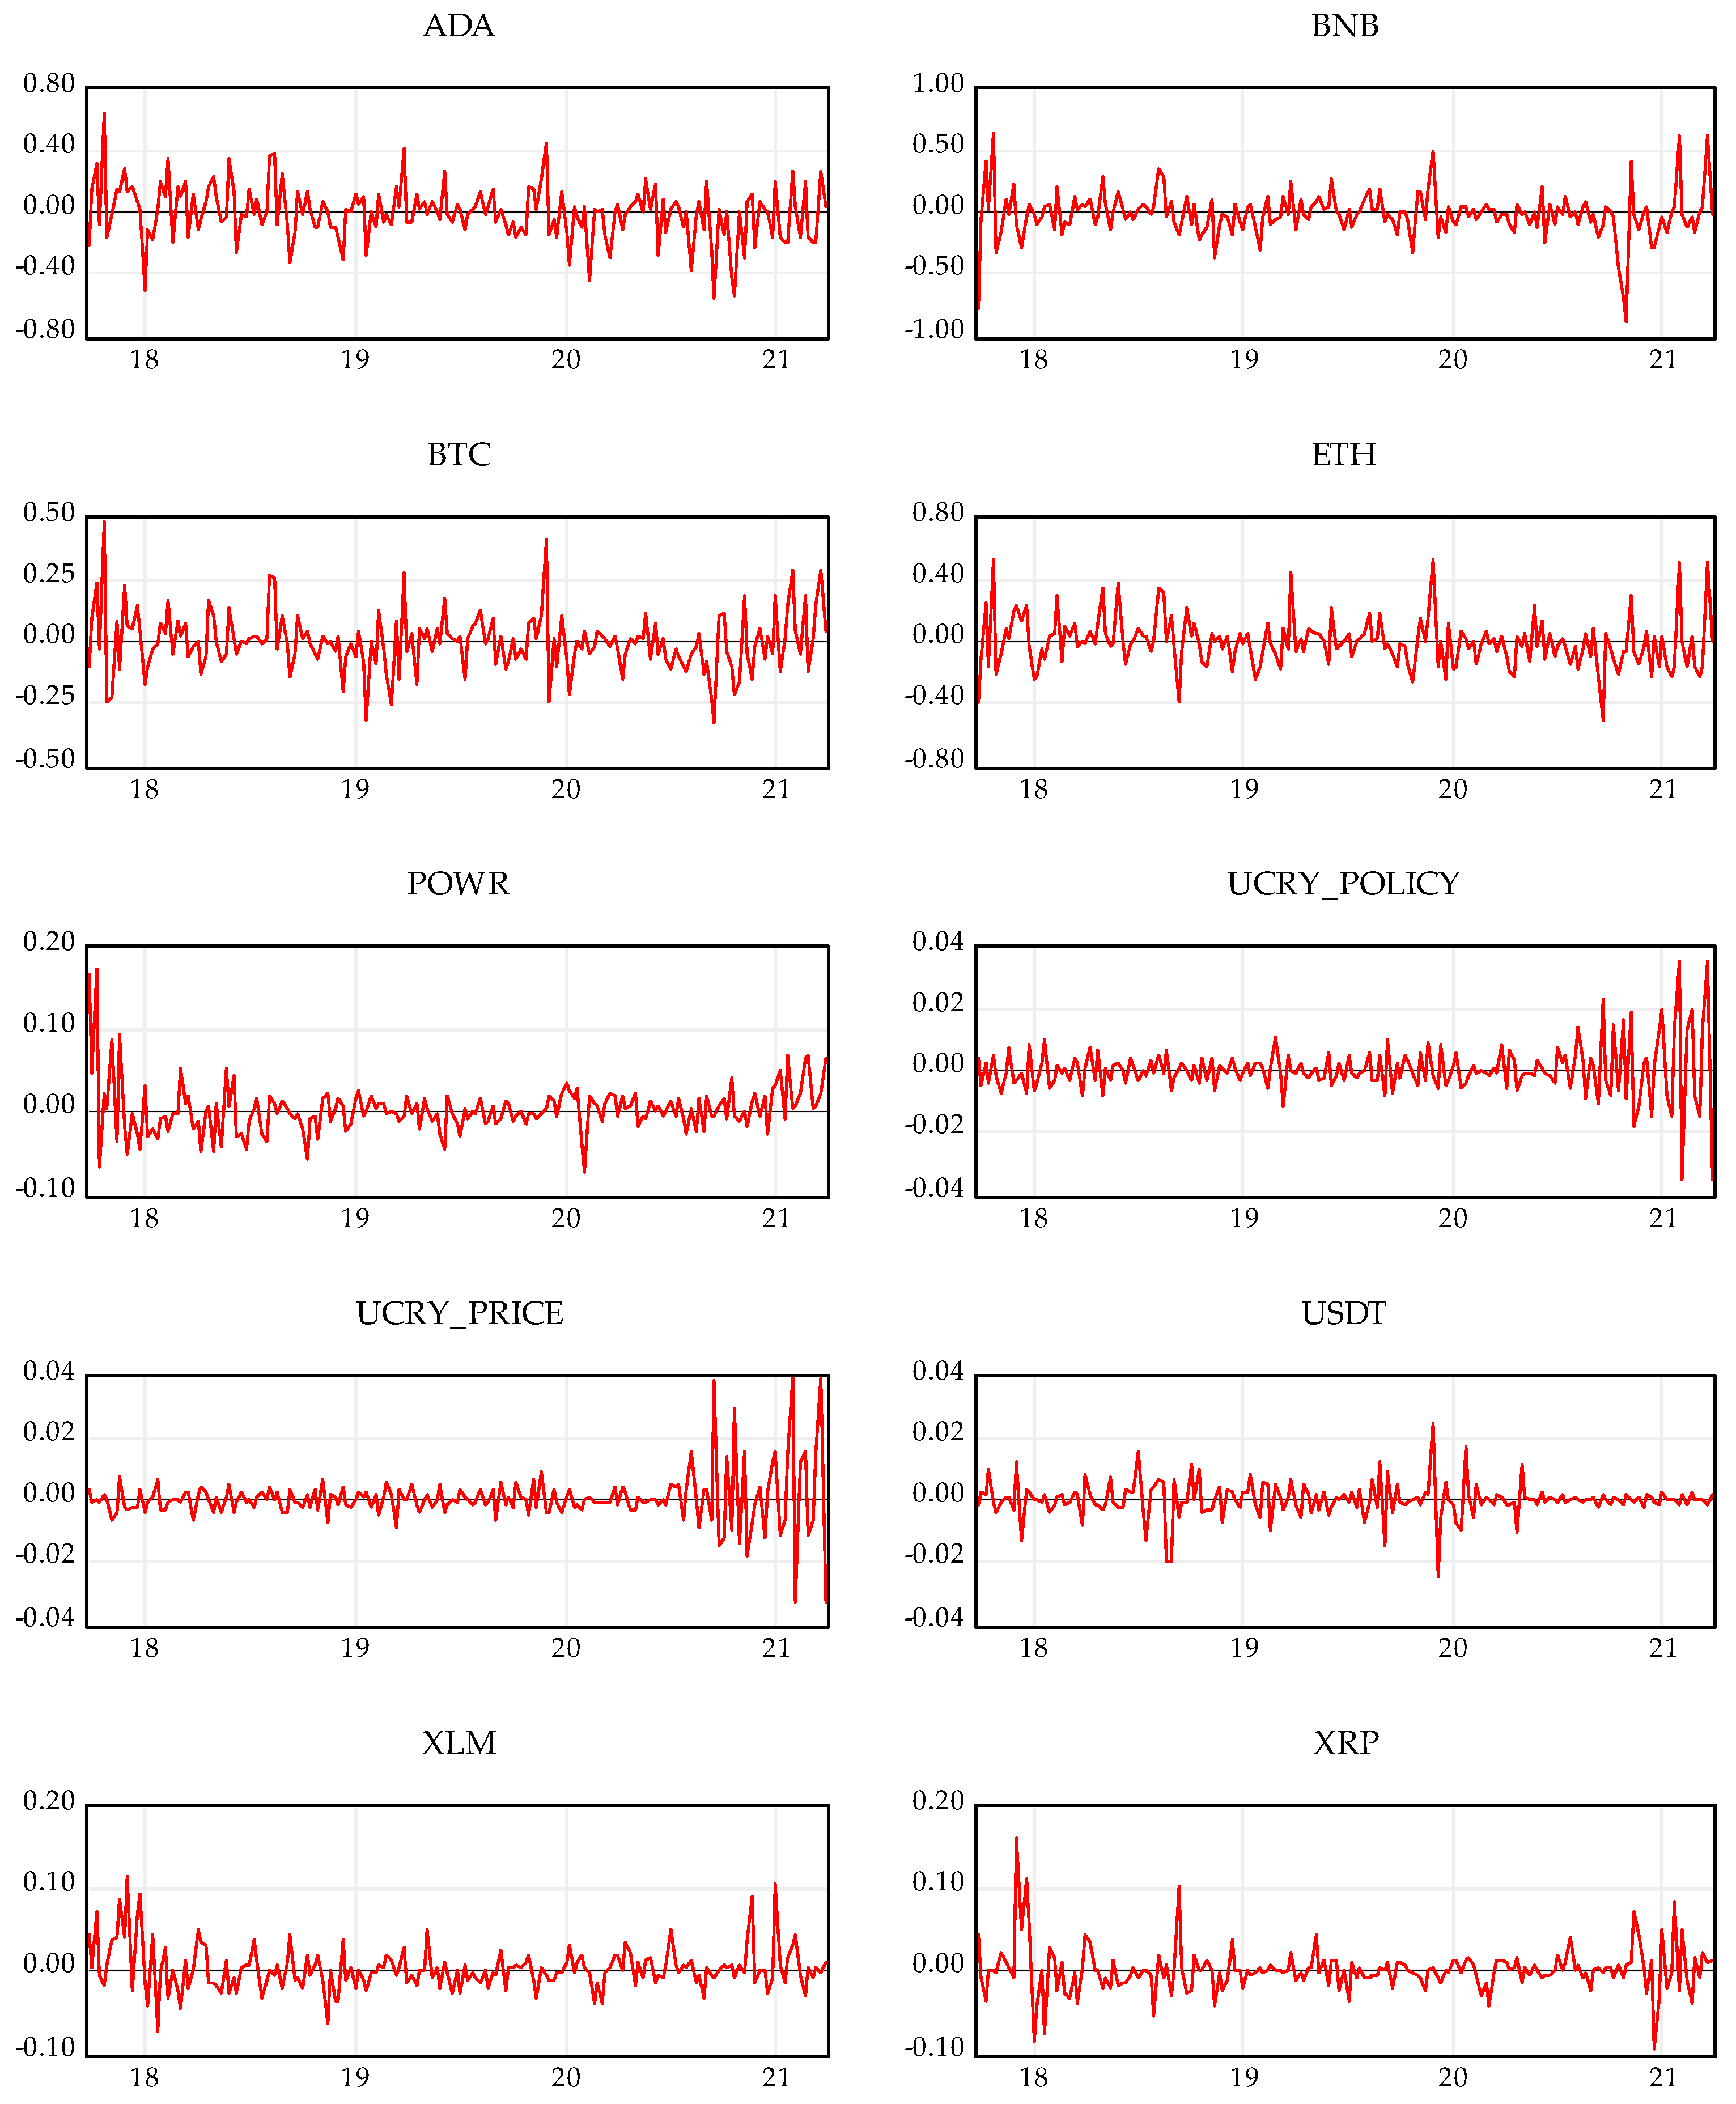
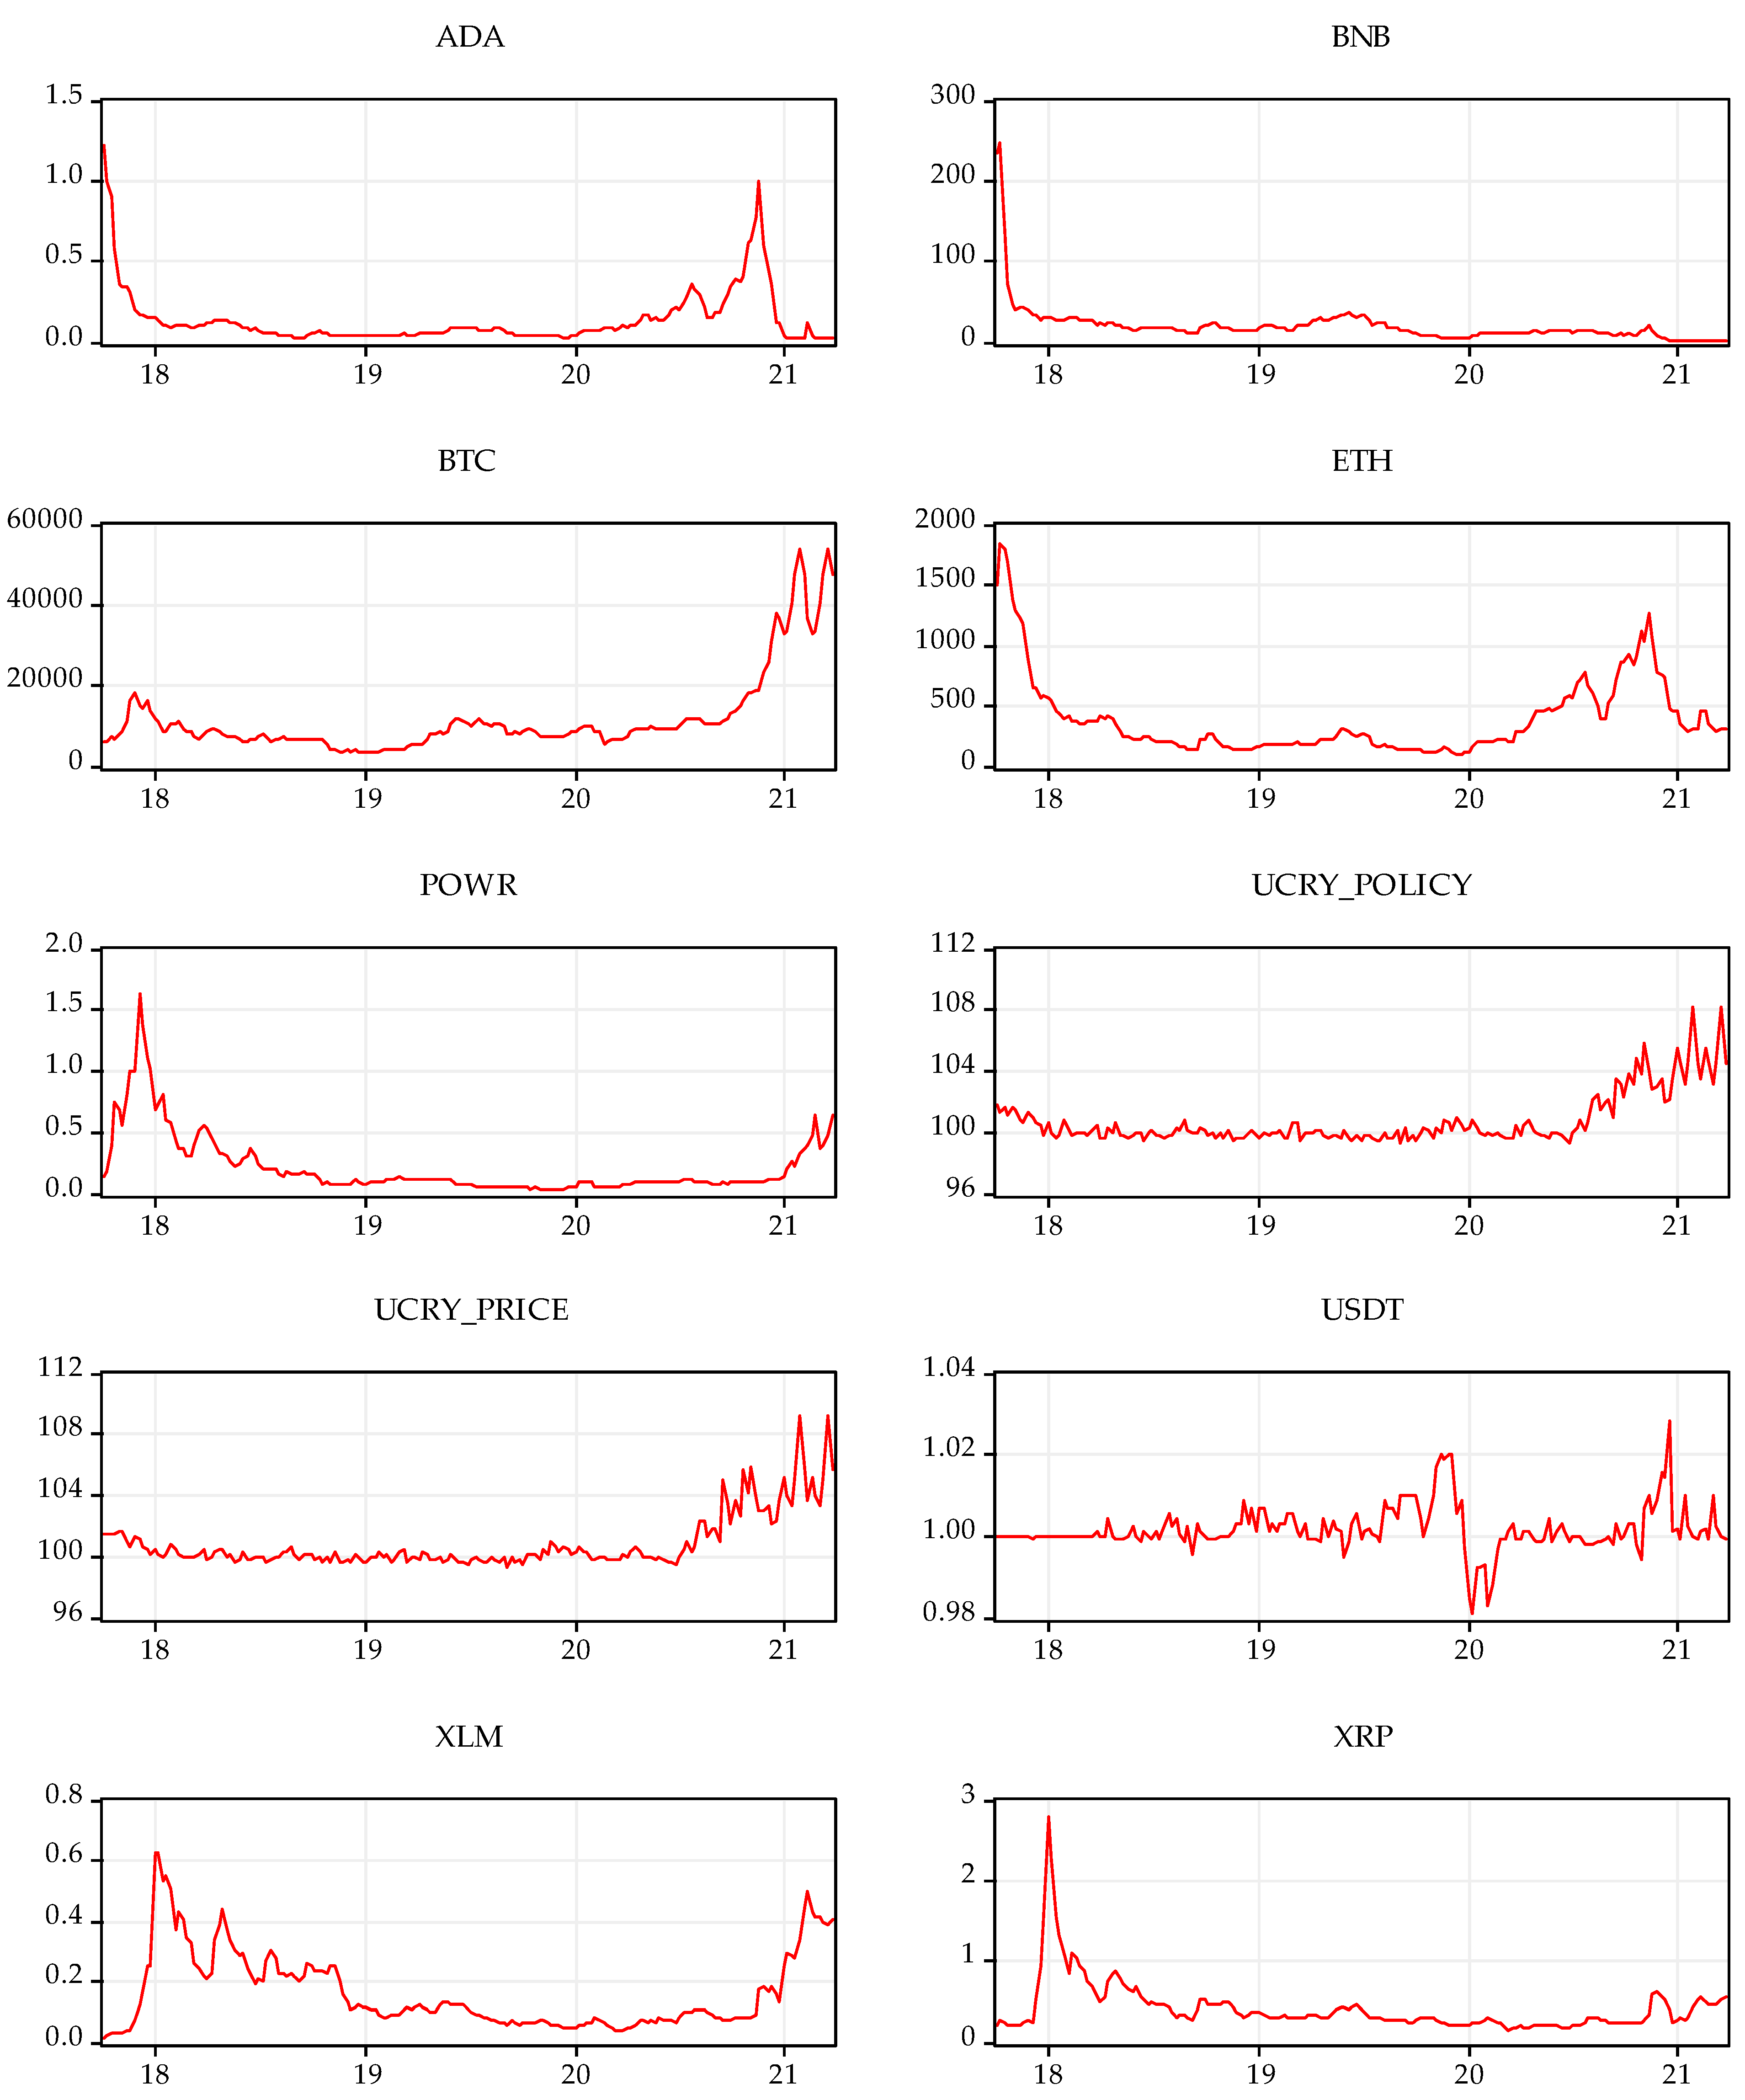
3.1. Data Description
3.2. Wavelet Coherence
4. Empirical Results
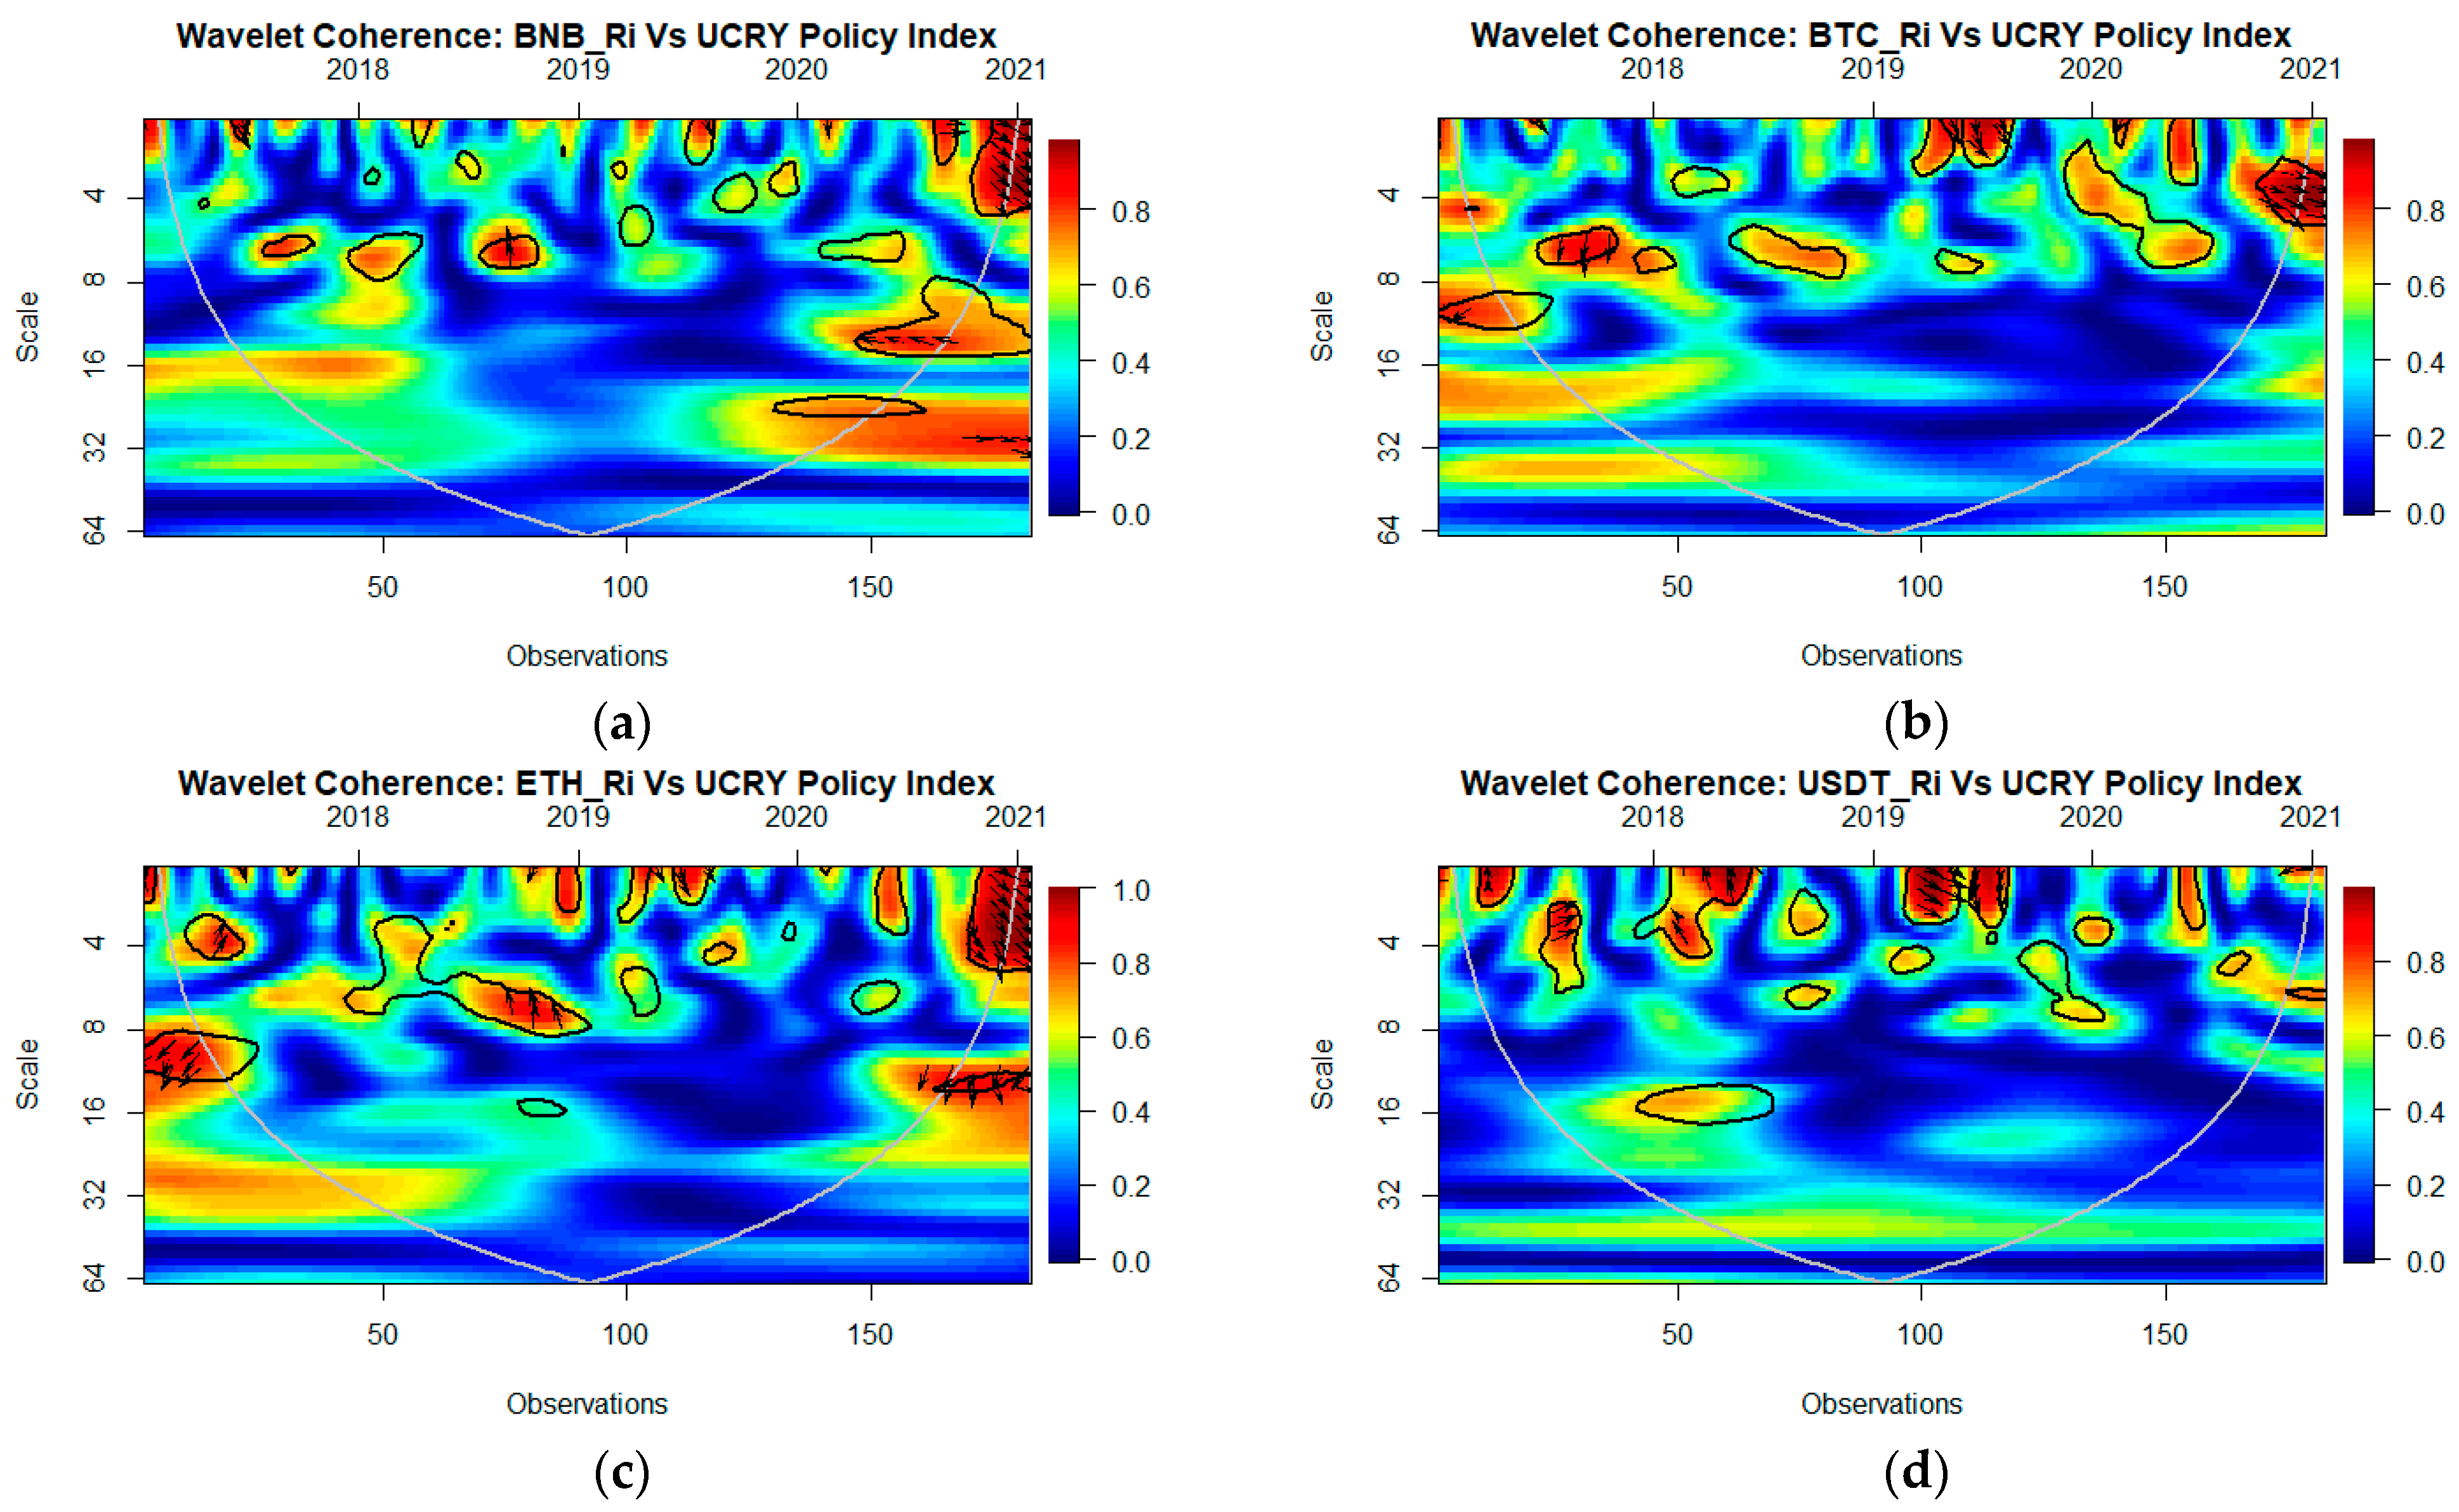
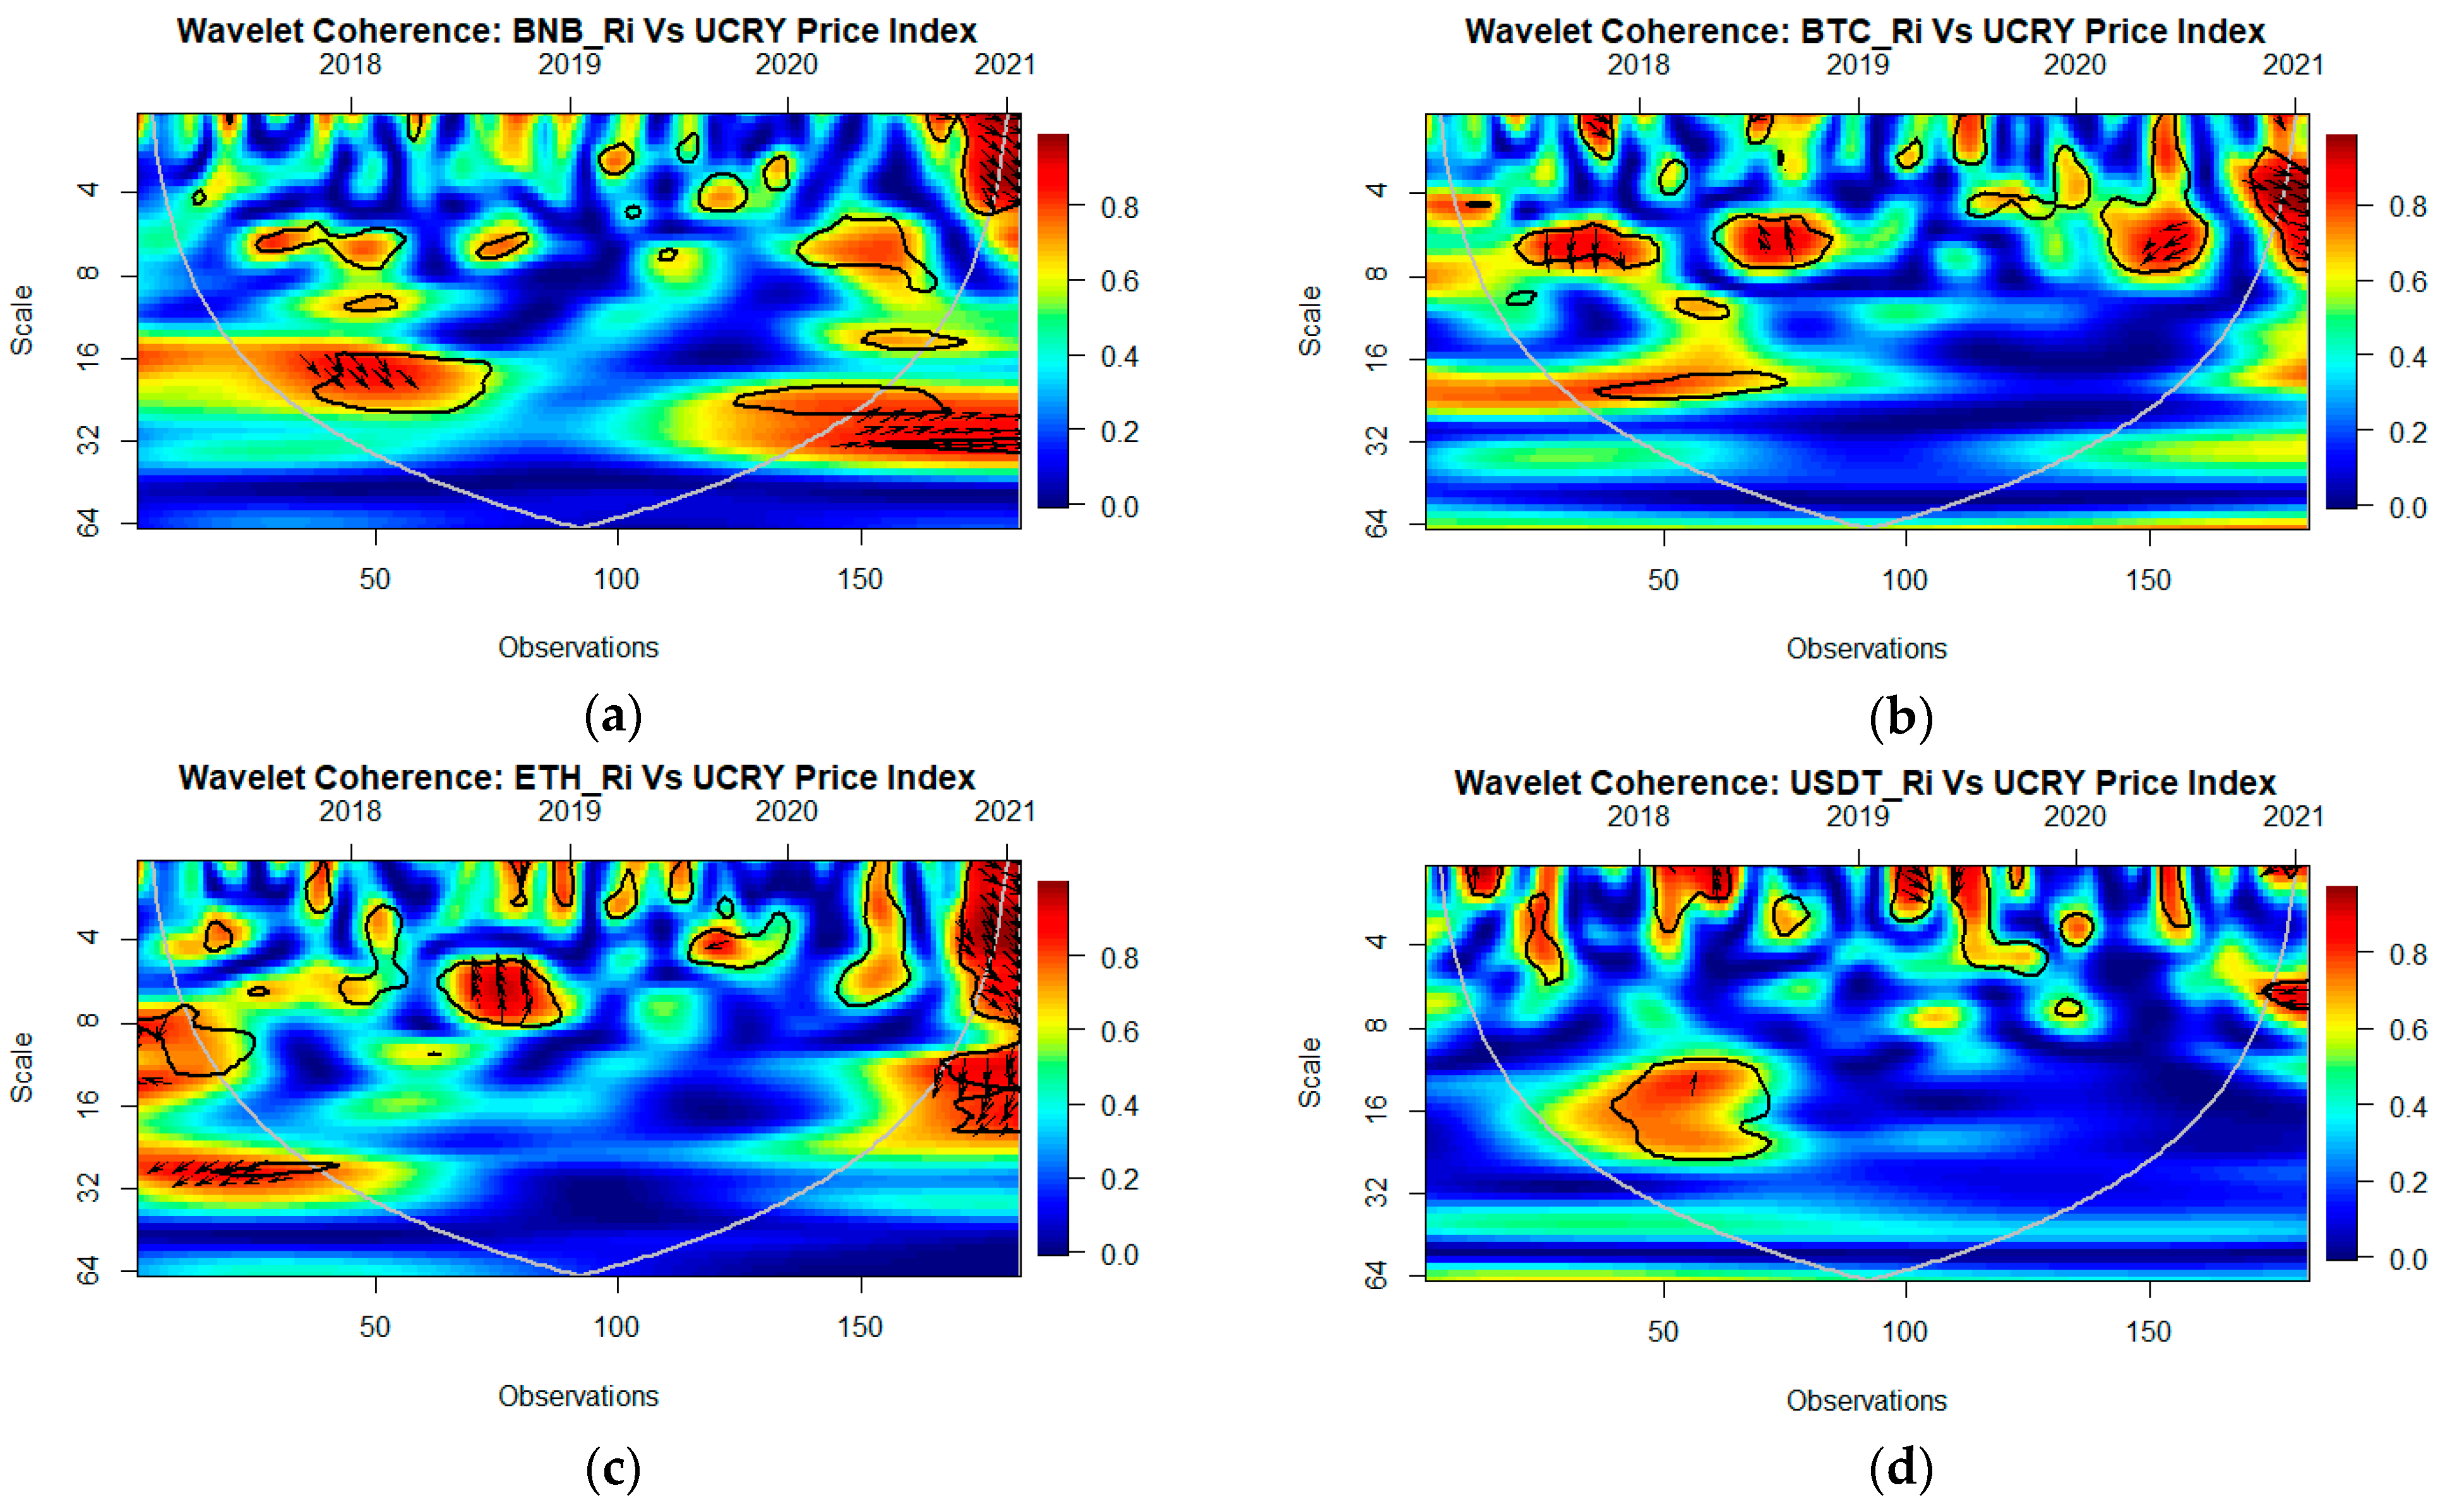
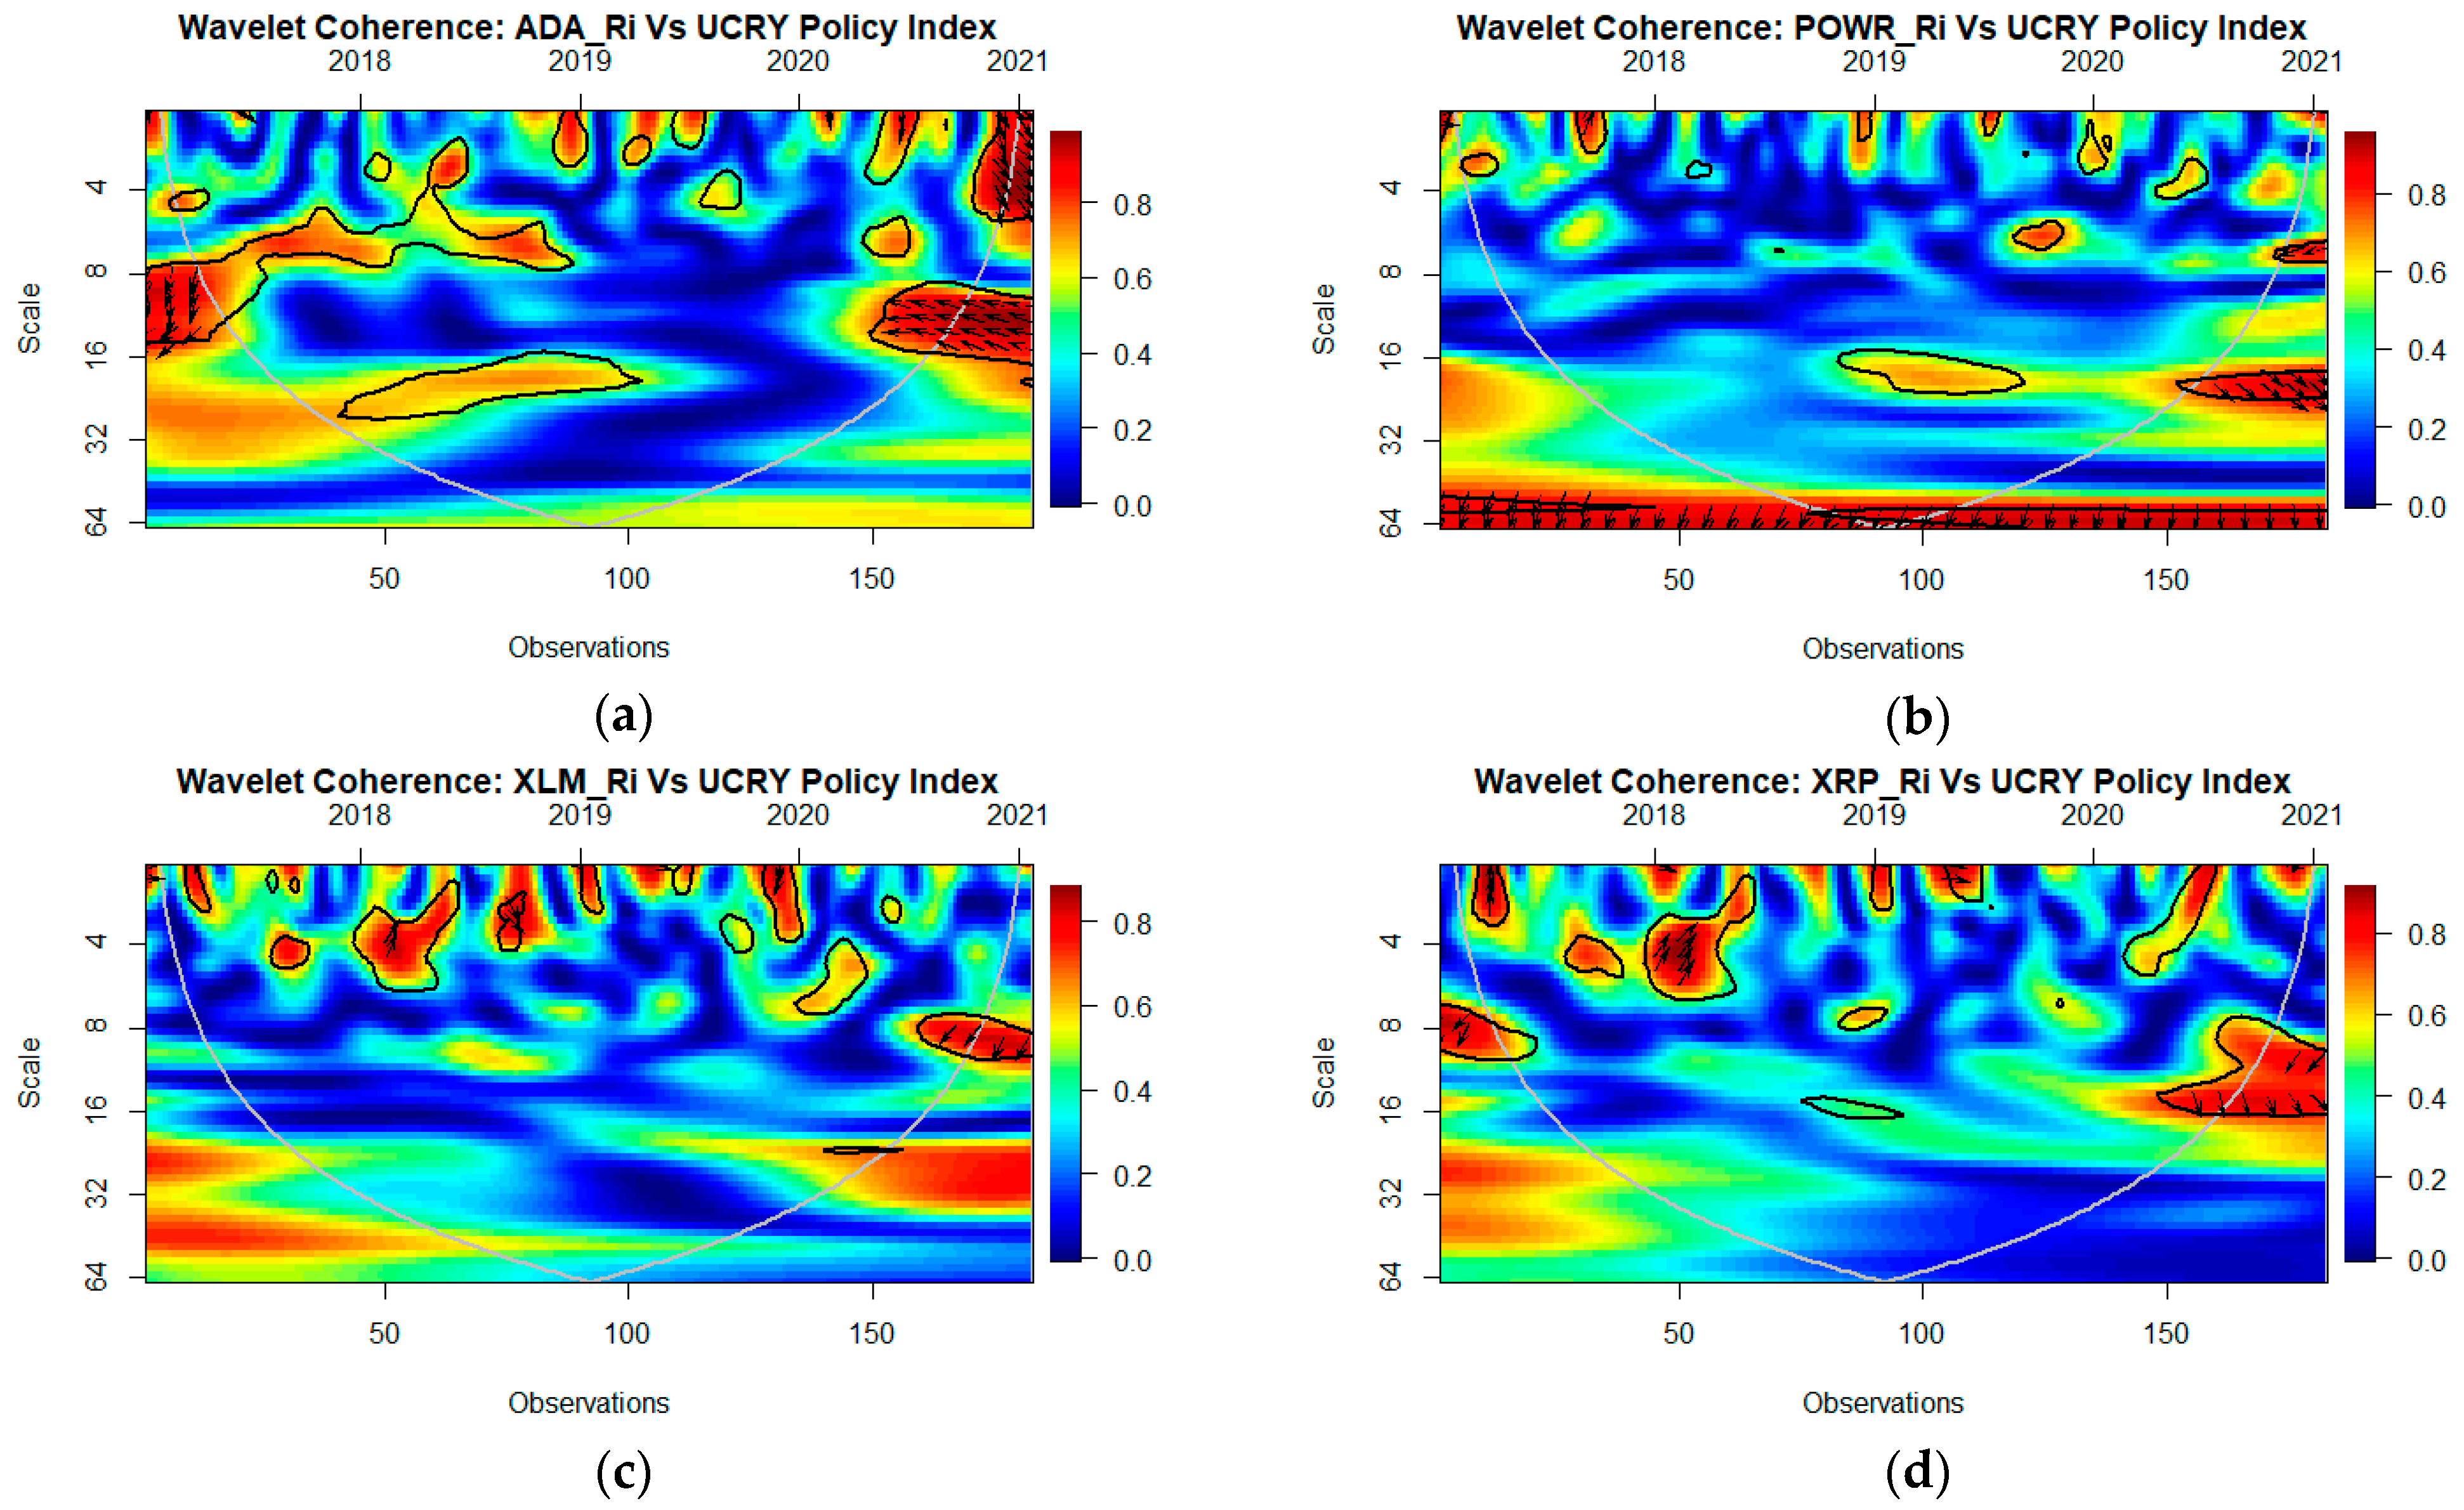
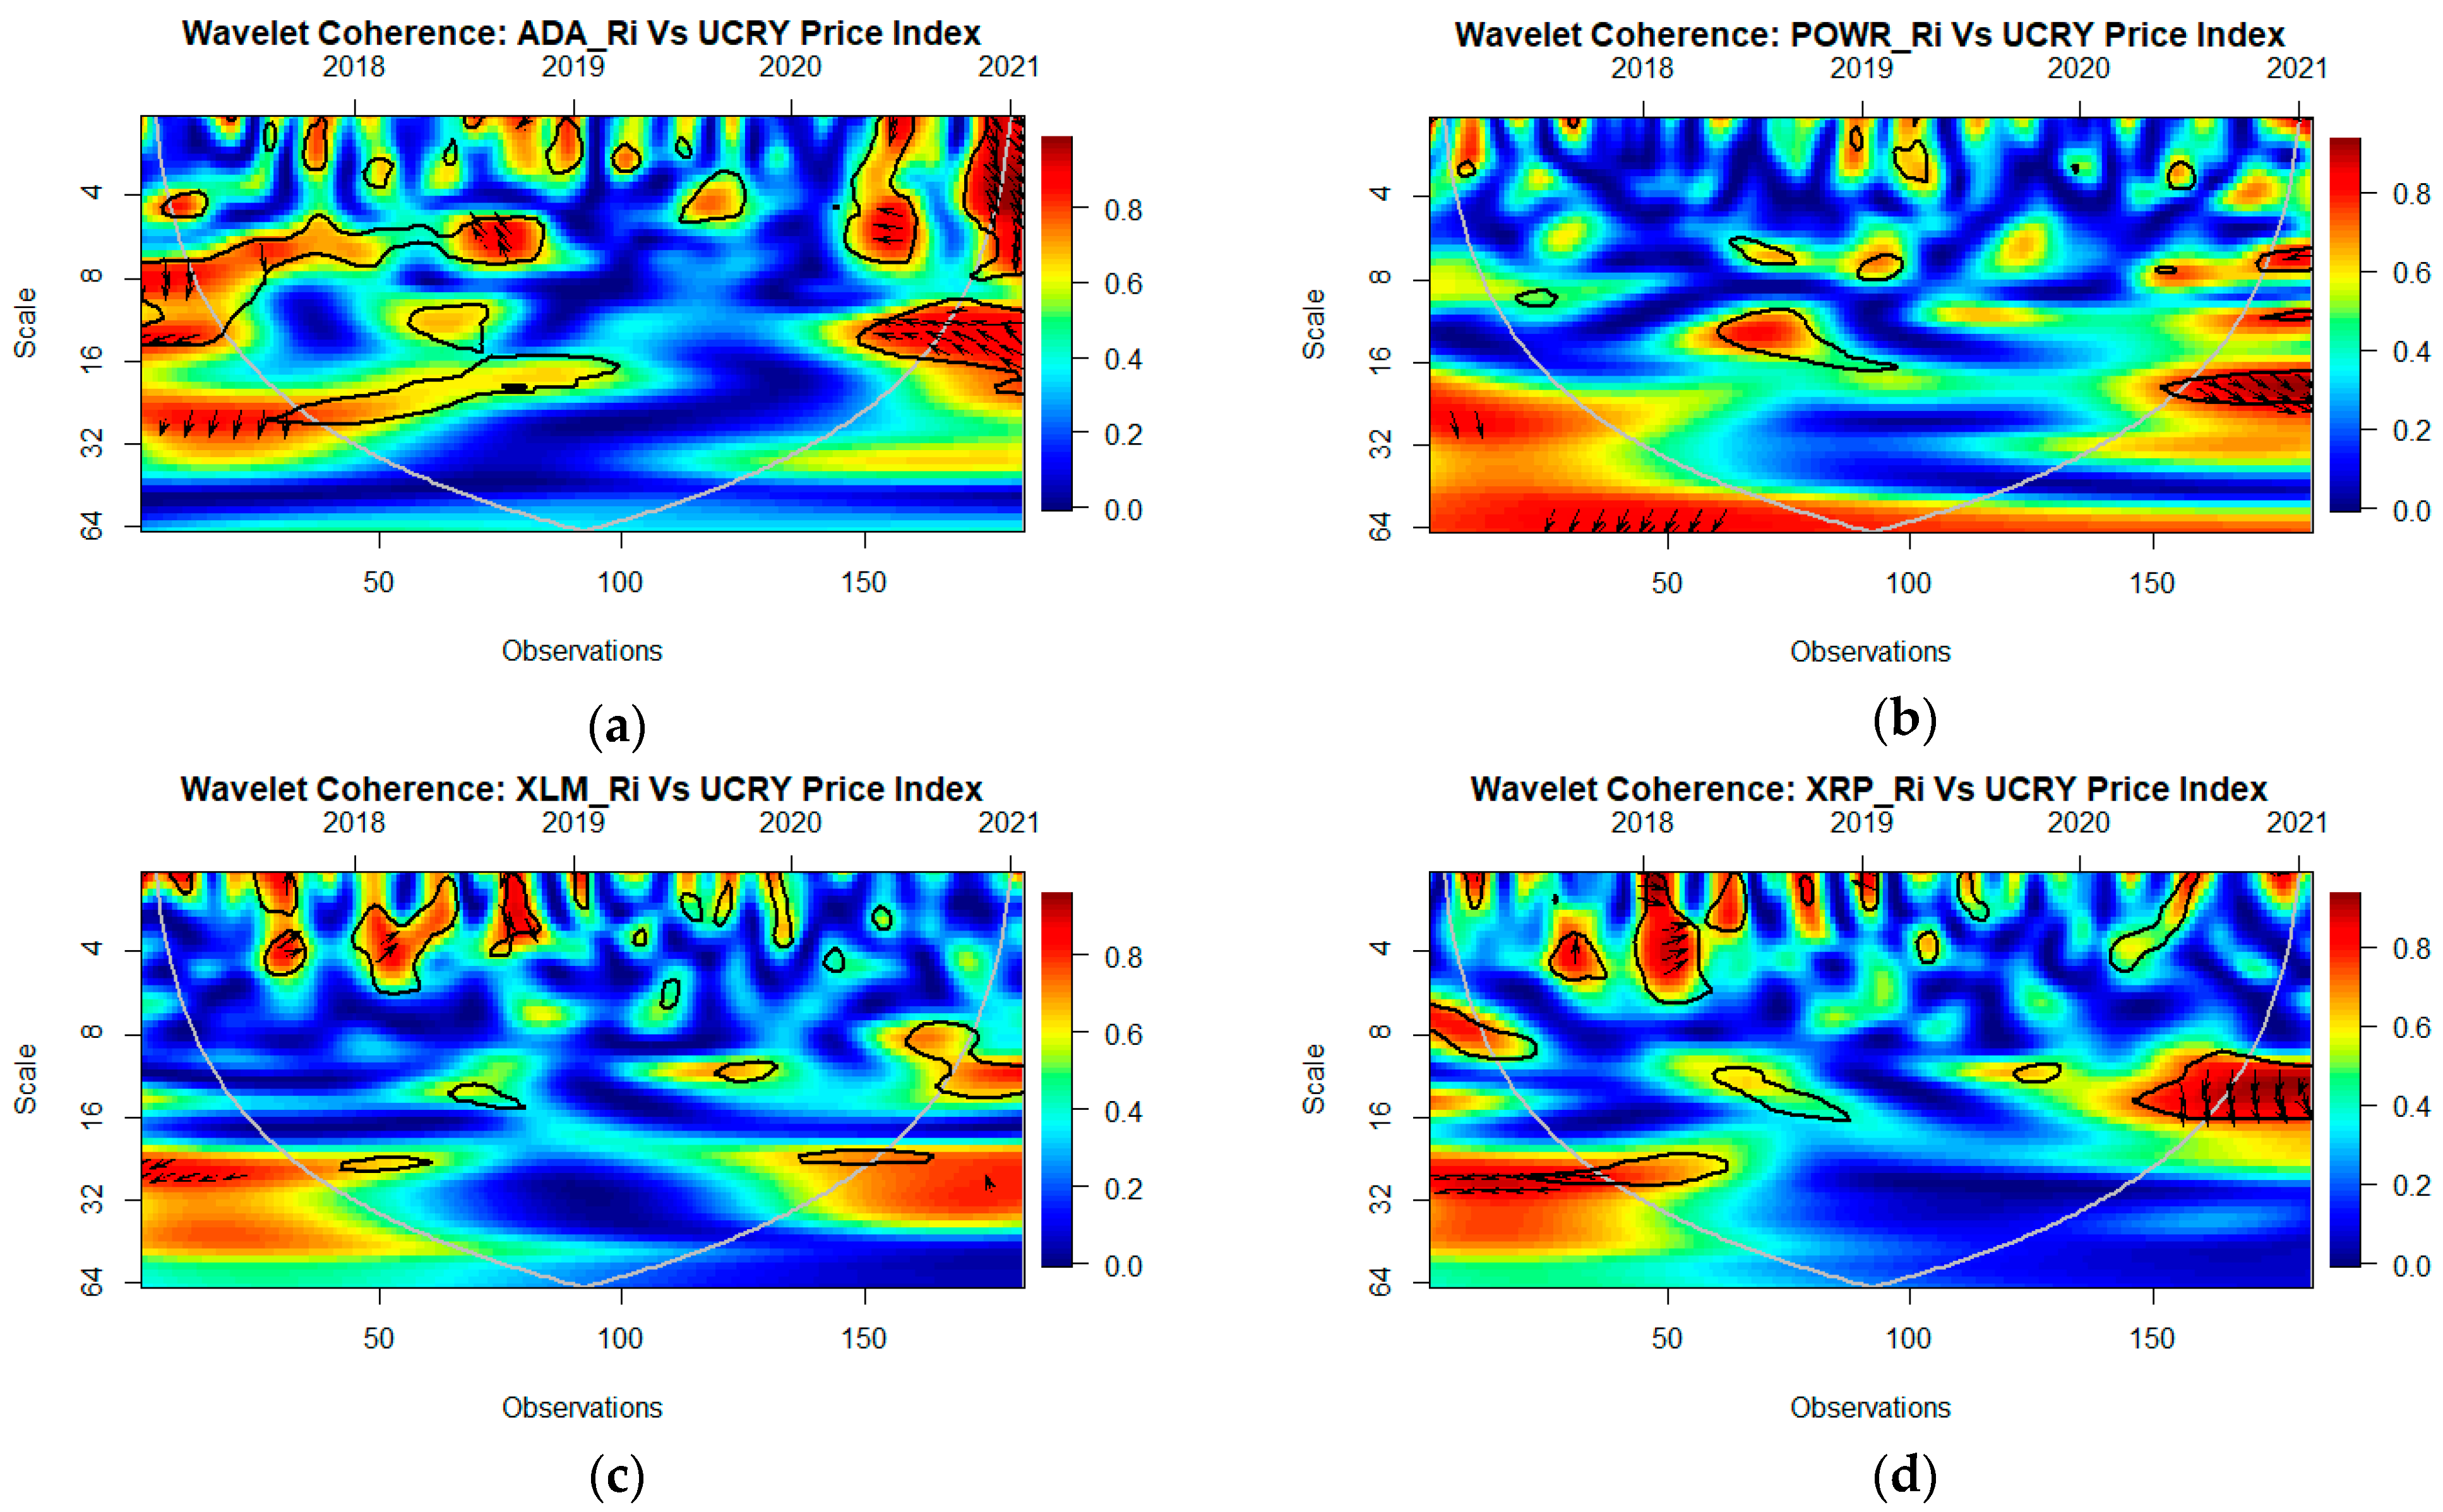
Evidence from Wavelet Coherence
5. Discussion and Implications
6. Conclusions
Author Contributions
Funding
Data Availability Statement
Conflicts of Interest
Appendix A

| 1 | Some studies consider environmental movements (Djoundourian 2011), climate change challenges (Djoundourian 2021), environmental policy objectives (Hilmi et al. 2021), and emission taxes (Marrouch and Sinclair-Desgagné 2012), bearing in mind that monetary policies are affected by a changing financial environment (Shahin and El-Achkar 2017). |
| 2 | A related strand of literature considers the connectedness across major cryptocurrencies (Bouri et al. 2021; Shahzad et al. 2021; Kumar et al. 2022), and the presence of time-varying jumps (Dutta and Bouri 2022). |
| 3 | Wavelet-based methods are applied in various research fields (see Katicha et al. 2017, 2021). |
References
- Ah Mand, Abdollah. 2021. Cryptocurrency Returns and Cryptocurrency Uncertainty: A Time-Frequency Analysis. Available online: https://papers.ssrn.com/sol3/papers.cfm?abstract_id=3950087 (accessed on 20 September 2022).
- Aharon, David Y., Ender Demir, Chi Keung Marco Lau, and Adam Zaremba. 2022. Twitter-Based uncertainty and cryptocurrency returns. Research in International Business and Finance 59: 101546. [Google Scholar] [CrossRef]
- Ashish, Kumar, Najaf Iqbal, Subrata Kumar Mitra, Ladislav Kristoufek, and Elie Bouri. 2022. Connectedness among major cryptocurrencies in standard times and during the COVID-19 outbreak. Journal of International Financial Markets, Institutions & Money 77: 101523. [Google Scholar]
- Azhgaliyeva, Dina, Anant Kapoor, and Yang Liu. 2020. Green bonds for financing renewable energy and energy efficiency in South-East Asia: A review of policies. Journal of Sustainable Finance & Investment 10: 113–40. [Google Scholar]
- Baker, Scott R., Nicholas Bloom, and Steven J. Davis. 2016. Measuring economic policy uncertainty. The Quarterly Journal of Economics 131: 1593–636. [Google Scholar] [CrossRef]
- Banga, Josué. 2019. The green bond market: A potential source of climate finance for developing countries. Journal of Sustainable Finance & Investment 9: 17–32. [Google Scholar]
- Bouri, Elie, Naji Jalkh, Peter Molnár, and David Roubaud. 2017a. Bitcoin for energy commodities before and after the December 2013 crash: Diversifier, hedge or safe haven? Applied Economics 49: 5063–73. [Google Scholar] [CrossRef]
- Bouri, Elie, Peter Molnár, Georges Azzi, David Roubaud, and Lars Ivar Hagfors. 2017b. On the hedge and safe haven properties of Bitcoin: Is it really more than a diversifier? Finance Research Letters 20: 192–98. [Google Scholar] [CrossRef]
- Bouri, Elie, Syed Jawad Hussain Shahzad, David Roubaud, Ladislav Kristoufek, and Brian Lucey. 2020. Bitcoin, gold, and commodities as safe havens for stocks: New insight through wavelet analysis. The Quarterly Review of Economics and Finance 77: 156–64. [Google Scholar] [CrossRef]
- Bouri Elie, Tarek Saeed, Xuan Vinh Vo, and David Roubaud. 2021. Quantile connectedness in the cryptocurrency market. Journal of International Financial Markets, Institutions & Money 71: 101302. [Google Scholar]
- Chan, Wing Hong, Minh Le, and Yan Wendy Wu. 2019. Holding Bitcoin longer: The dynamic hedging abilities of Bitcoin. The Quarterly Review of Economics and Finance 71: 107–13. [Google Scholar] [CrossRef]
- Chen, Xingxing, Olaf Weber, Xianzhong Song, and Lidan Li. 2021. Do greener funds perform better? An analysis of open-end equity funds in China. Journal of Sustainable Finance & Investment, 1–19. [Google Scholar] [CrossRef]
- Cheng, Hui-Pei, and Kuang-Chieh Yen. 2020. The relationship between the economic policy uncertainty and the cryptocurrency market. Finance Research Letters 35: 101308. [Google Scholar] [CrossRef]
- Dai, Peng-Fei, John W. Goodell, Toan Luu Duc Huynh, and Zhifeng Liu. 2021. Cryptocurrencies and Financial Stability: Evidencing Crash Transmission to Equity Markets. Available online: https://papers.ssrn.com/sol3/papers.cfm?abstract_id=3943285 (accessed on 20 September 2022).
- Diebold, Francis X, and Kamil Yilmaz. 2012. Better to give than to receive: Predictive directional measurement of volatility spillovers. International Journal of forecasting 28: 57–66. [Google Scholar] [CrossRef]
- Dutta Anupam, Elie Bouri. 2022. Outliers and time-varying jumps in the cryptocurrency markets. Journal of Risk and Financial Management 15: 128. [Google Scholar] [CrossRef]
- Dyhrberg, Anne Haubo. 2016. Hedging capabilities of bitcoin. Is it the virtual gold? Finance Research Letters 16: 139–44. [Google Scholar] [CrossRef]
- Ghosh, Bikram, and Elie Bouri. 2022. Is Bitcoin carbon footprint persistent? Multifractality evidence and policy implica-tions. Entropy 24: 647. [Google Scholar] [CrossRef]
- Grinsted, Aslak, John C. Moore, and Svetlana Jevrejeva. 2004. Application of the cross wavelet transform and wavelet coherence to geophysical time series. Nonlinear Processes in Geophysics 11: 561–66. [Google Scholar] [CrossRef]
- Haq, Inzamam UI, Hira Nadeem, Apichit Maneengam, Saowanee Samantreeporn, Nhan Huynh, Thasporn Kettanom, and Worakamol Wisetsri. 2022. Do Rare Earths and Energy Commodities Drive Volatility Transmission in Sustainable Financial Markets? Evidence from China, Australia, and the US. International Journal of Financial Studies 10: 76. [Google Scholar] [CrossRef]
- Haq, Inzamam Ul, Apichit Maneengam, Supat Chupradit, Wanich Suksatan, and Chunhui Huo. 2021. Economic policy uncertainty and cryptocurrency market as a risk management avenue: A systematic review. Risks 9: 163. [Google Scholar] [CrossRef]
- Haq, Inzamam Ul. 2022. Cryptocurrency Environmental Attention, Green Financial Assets, and Information Transmission: Evidence From the COVID-19 Pandemic. Energy Research Letters 3. [Google Scholar]
- Hasan, Md Bokhtiar, M. Kabir Hassan, Zulkefly Abdul Karim, and Md Mamunur Rashid. 2022. Exploring the hedge and safe haven properties of cryptocurrency in policy uncertainty. Finance Research Letters 46: 102272. [Google Scholar] [CrossRef]
- Hassan, M. Kabir, Md Bokhtiar Hasan, and Md Mamunur Rashid. 2021. Using precious metals to hedge cryptocurrency policy and price uncertainty. Economics Letters 206: 109977. [Google Scholar] [CrossRef]
- Hilmi, Nathalie, Salpie Djoundourian, Wassim Shahin, and Alain Safa. 2021. Does the ECB policy of quantitative easing impact environmental policy objectives? Journal of Economic Policy Reform 25: 259–271. [Google Scholar] [CrossRef]
- Iqbal, Javed. 2017. Does gold hedge stock market, inflation and exchange rate risks? An econometric investigation. International Review of Economics & Finance 48: 1–17. [Google Scholar]
- Jiang, Zhuhua, and Seong-Min Yoon. 2020. Dynamic co-movement between oil and stock markets in oil-importing and oil-exporting countries: Two types of wavelet analysis. Energy Economics 90: 104835. [Google Scholar] [CrossRef]
- Karaömer, Yunus. 2022. The time-varying correlation between cryptocurrency policy uncertainty and cryptocurrency returns. Studies in Economics and Finance 39: 297–310. [Google Scholar] [CrossRef]
- Karim, Sitara, Muhammad Abubakr Naeem, Nawazish Mirza, and Jessica Paule-Vianez. 2022. Quantifying the hedge and safe-haven properties of bond markets for cryptocurrency indices. The Journal of Risk Finance 23: 191–205. [Google Scholar] [CrossRef]
- Katicha, Samer Wehbe, John Khoury, and Gerardo Flintsch. 2021. Spatial Multiresolution Analysis Approach to Identi-fy Crash Hotspots and Estimate Crash Risk. Journal of Transportation Engineering, Part A: Systems 147: 04021019. [Google Scholar] [CrossRef]
- Katicha, Samer W., Amara Loulizi, John El Khoury, and Gerardo Flintsch. 2017. Adaptive false discovery rate for wavelet denoising of pavement continuous deflection measurements. Journal of Computing in Civil Engineering 31: 04016049. [Google Scholar] [CrossRef]
- Khalil, Muhammad Azhar, and Kridsda Nimmanunta. 2022. Conventional versus green investments: Advancing innovation for better financial and environmental prospects. Journal of Sustainable Finance & Investment, 1–28. [Google Scholar] [CrossRef]
- Kim, Alisa, Simon Trimborn, and Wolfgang Karl Härdle. 2021. VCRIX—A volatility index for crypto-currencies. International Review of Financial Analysis 78: 101915. [Google Scholar] [CrossRef]
- Koumba, Ur, Calvin Mudzingiri, and Jules Mba. 2020. Does uncertainty predict cryptocurrency returns? A copula-based approach. Macroeconomics and Finance in Emerging Market Economies 13: 67–88. [Google Scholar] [CrossRef]
- Lucey, Brian M., Samuel A. Vigne, Larisa Yarovaya, and Yizhi Wang. 2022. The cryptocurrency uncertainty index. Finance Research Letters 45: 102147. [Google Scholar] [CrossRef]
- Majdoub, Jihed, Salim Ben Sassi, and Azza Bejaoui. 2021. Can fiat currencies really hedge Bitcoin? Evidence from dynamic short-term perspective. Decisions in Economics and Finance 44: 789–816. [Google Scholar] [CrossRef]
- Marrouch, Walid, and Bernard Sinclair-Desgagné. 2012. Emission taxes when pollution depends on location. Environment and Development Economics 17: 433–43. [Google Scholar] [CrossRef]
- Mishra, Lokanath, and Vaibhav Kaushik. 2021. Application of blockchain in dealing with sustainability issues and challenges of financial sector. Journal of Sustainable Finance & Investment, 1–16. [Google Scholar] [CrossRef]
- Naeem, Muhammad Abubakr, and Sitara Karim. 2021. Tail dependence between bitcoin and green financial assets. Economics Letters 208: 110068. [Google Scholar] [CrossRef]
- Najjar, Mohammad, Ihab H. Alsurakji, Amjad El-Qanni, and Abdulnaser I. Nour. 2022. The role of blockchain technology in the integration of sustainability practices across multi-tier supply networks: Implications and potential complexities. Journal of Sustainable Finance & Investment, 1–19. [Google Scholar] [CrossRef]
- Pham, Linh, Sitara Karim, Muhammad Abubakr Naeem, and Cheng Long. 2022. A tale of two tails among carbon prices, green and non-green cryptocurrencies. International Review of Financial Analysis 82: 102139. [Google Scholar] [CrossRef]
- Raheem, Ibrahim D. 2021. COVID-19 pandemic and the safe haven property of Bitcoin. The Quarterly Review of Economics and Finance 81: 370–75. [Google Scholar] [CrossRef]
- Ren, Boru, and Brian Lucey. 2022a. A clean, green haven?—Examining the relationship between clean energy, clean and dirty cryptocurrencies. Energy Economics 109: 105951. [Google Scholar] [CrossRef]
- Ren, Boru, and Brian Lucey. 2022b. Do clean and dirty cryptocurrency markets herd differently? Finance Research Letters 47: 102795. [Google Scholar] [CrossRef]
- Rubbaniy, Ghulame, Ali Awais Khalid, and Aristeidis Samitas. 2021. Are Cryptos Safe-Haven Assets during Covid-19? Evidence from Wavelet Coherence Analysis. Emerging Markets Finance and Trade 57: 1741–56. [Google Scholar] [CrossRef]
- Salpie, Djoundourian. 2021. Response of the Arab world to climate change challenges and the Paris agreement. International Environmental Agreements: Politics, Law and Economics 21: 469–91. [Google Scholar]
- Saplie, Djoundourian. 2011. Environmental movement in the Arab world. Environment, Development and Sustainability 13: 743–58. [Google Scholar]
- Saravade, Vasundhara, Xingxing Chen, Olaf Weber, and Xianzhong Song. 2022. Impact of regulatory policies on green bond issuances in China: Policy lessons from a top-down approach. Climate Policy, 1–12. [Google Scholar] [CrossRef]
- Schumacher, Kim, Hugues Chenet, and Ulrich Volz. 2020. Sustainable finance in Japan. Journal of Sustainable Finance & Investment 10: 213–46. [Google Scholar]
- Shahin Wassim, El-Achkar Elias. 2017. Banking and Monetary Policies in a Changing Financial Environment. London: Routledge. [Google Scholar]
- Shahzad, Syed Jawad Hussain, Elie Bouri, Sang Hoon Kang, and Tareq Saeed. 2021. Regime specific spillover across cryptocurrencies and the role of COVID-19. Financial Innovation 7. [Google Scholar] [CrossRef]
- Shahzad, Syed Jawad Hussain, Bouri Elie, David Roubaud, and Ladislav Kristoufek. 2020. Safe haven, hedge and di-versification for G7 stock markets: Gold versus bitcoin. Economic Modelling 87: 212–24. [Google Scholar] [CrossRef]
- Shanmugam, Karthikeyan, Vijayabanu Chidambaram, and Satyanarayana Parayitam. 2022. Effect of financial knowledge and information behavior on sustainable investments: Evidence from India. Journal of Sustainable Finance & Investment, 1–24. [Google Scholar] [CrossRef]
- Tuhkanen, Heidi, and Gregor Vulturius. 2020. Are green bonds funding the transition? Investigating the link between companies’ climate targets and green debt financing. Journal of Sustainable Finance & Investment, 1–23. [Google Scholar] [CrossRef]
- Ul Haq, Inzamam, Apichit Maneengam, Supat Chupradit, and Chunhui Huo. 2022. Are green bonds and sustainable cryptocurrencies truly sustainable? Evidence from a wavelet coherence analysis. Economic Research-Ekonomska Istraživanja, 1–20. [Google Scholar] [CrossRef]
- Wang, Yizhi, Brian Lucey, Samuel Alexandre Vigne, and Larisa Yarovaya. 2022. An index of cryptocurrency environmental attention (ICEA). China Finance Review International 53: 4582–95. [Google Scholar] [CrossRef]
- Wiek, Arnim, and Olaf Weber. 2014. Sustainability challenges and the ambivalent role of the financial sector. Journal of Sustainable Finance & Investment 4: 9–20. [Google Scholar]
- Wu, Shan, Mu Tong, Zhongyi Yang, and Abdelkader Derbali. 2019. Does gold or Bitcoin hedge economic policy uncertainty? Finance Research Letters 31: 171–78. [Google Scholar] [CrossRef]
- Yen, Kuang-Chieh, and Hui-Pei Cheng. 2021. Economic policy uncertainty and cryptocurrency volatility. Finance Research Letters 38: 101428. [Google Scholar] [CrossRef]
- Zhang, Hao. 2020. Regulating green bond in China: Definition divergence and implications for policy making. Journal of Sustainable Finance & Investment 10: 141–56. [Google Scholar]


| M. | Max. | Min. | SD. | Skew. | Kurt. | JB. | PP. | ADF. | |
|---|---|---|---|---|---|---|---|---|---|
| ADA | −0.0056 | 0.6438 | −0.5555 | 0.1789 | −0.0851 | 4.3562 | 14.245 a | −12.417 a | −12.326 a |
| BNB | −0.0184 | 0.6438 | −0.8874 | 0.1880 | −0.3540 | 8.5978 | 242.750 a | −13.056 a | −13.056 a |
| BTC | −0.0029 | 0.4850 | −0.3285 | 0.1193 | 0.5508 | 5.0578 | 41.542 a | −12.926 a | −12.927 a |
| ETH | −0.0071 | 0.5288 | −0.5165 | 0.1616 | 0.7420 | 5.0882 | 50.043 a | −20.791 a | −18.542 a |
| POWR | 0.0028 | 0.1739 | −0.0731 | 0.0309 | 1.8714 | 11.7267 | 687.502 a | −14.521 a | −15.348 a |
| USDT | 0.0001 | 0.0249 | −0.0247 | 0.0057 | −0.2427 | 8.2488 | 211.865 a | −20.684 a | −18.178 a |
| XLM | 0.0027 | 0.1149 | −0.0743 | 0.0273 | 1.1786 | 6.3049 | 125.655 a | −11.420 a | −10.736 a |
| XRP | 0.0008 | 0.1602 | −0.0965 | 0.0282 | 1.3289 | 10.9611 | 537.129 a | −13.791 a | −12.121 a |
| UCRYP | 0.0003 | 0.0353 | −0.0358 | 0.0083 | 0.1962 | 8.9634 | 272.340 a | −12.610 a | −12.608 a |
| UCRYPR | 0.0004 | 0.0392 | −0.0327 | 0.0084 | 1.1719 | 11.9044 | 646.465 a | −19.384 a | −17.264 a |
| ADA | BNB | BTC | ETH | POWR | USDT | XLM | XRP | UCRYP | UCRYPR | |
|---|---|---|---|---|---|---|---|---|---|---|
| ADA | 1 | 0.5814 | 0.7016 | 0.7832 | −0.0212 | 0.0982 | 0.0594 | −0.0177 | −0.0315 | −0.0977 |
| BNB | 0.5814 | 1 | 0.6813 | 0.7062 | −0.1017 | 0.1080 | 0.0057 | −0.0749 | 0.2184 | 0.2000 |
| BTC | 0.7016 | 0.6813 | 1 | 0.8077 | 0.0111 | 0.1694 | 0.0241 | 0.0175 | 0.1390 | 0.0675 |
| ETH | 0.7832 | 0.7062 | 0.8077 | 1 | −0.0917 | 0.1303 | 0.0237 | −0.0197 | 0.1449 | 0.0867 |
| POWR | −0.0212 | −0.1017 | 0.0111 | −0.0917 | 1 | −0.0695 | 0.1361 | −0.0203 | 0.0329 | 0.0076 |
| USDT | 0.0982 | 0.1080 | 0.1694 | 0.1303 | −0.0695 | 1 | 0.1000 | 0.0667 | 0.0136 | 0.0020 |
| XLM | 0.0594 | 0.0057 | 0.0241 | 0.0237 | 0.1361 | 0.1000 | 1 | 0.6952 | 0.0190 | −0.0002 |
| XRP | −0.0177 | −0.0749 | 0.0175 | −0.0197 | −0.0203 | 0.0667 | 0.6952 | 1 | −0.0925 | −0.0938 |
| UCRYP | −0.0315 | 0.2184 | 0.1390 | 0.1449 | 0.0329 | 0.0136 | 0.0190 | −0.0925 | 1 | 0.9324 |
| UCRYPR | −0.0977 | 0.2000 | 0.0675 | 0.0867 | 0.0076 | 0.0020 | −0.0002 | −0.0938 | 0.9324 | 1 |
Publisher’s Note: MDPI stays neutral with regard to jurisdictional claims in published maps and institutional affiliations. |
© 2022 by the authors. Licensee MDPI, Basel, Switzerland. This article is an open access article distributed under the terms and conditions of the Creative Commons Attribution (CC BY) license (https://creativecommons.org/licenses/by/4.0/).
Share and Cite
Haq, I.U.; Bouri, E. Sustainable versus Conventional Cryptocurrencies in the Face of Cryptocurrency Uncertainty Indices: An Analysis across Time and Scales. J. Risk Financial Manag. 2022, 15, 442. https://doi.org/10.3390/jrfm15100442
Haq IU, Bouri E. Sustainable versus Conventional Cryptocurrencies in the Face of Cryptocurrency Uncertainty Indices: An Analysis across Time and Scales. Journal of Risk and Financial Management. 2022; 15(10):442. https://doi.org/10.3390/jrfm15100442
Chicago/Turabian StyleHaq, Inzamam UI, and Elie Bouri. 2022. "Sustainable versus Conventional Cryptocurrencies in the Face of Cryptocurrency Uncertainty Indices: An Analysis across Time and Scales" Journal of Risk and Financial Management 15, no. 10: 442. https://doi.org/10.3390/jrfm15100442