
Direct and Indirect Implications of the COVID-19 Pandemic on Amazon’s Financial Situation

Abstract
:1. Introduction
2. Literature Review
2.1. Amazon’s Corporate Profile
2.2. COVID-19 and Business Performance
- How did Amazon perform during the COVID-19 pandemic?
- Does the COVID-19 pandemic have any influence on Amazon’s financial performance?
3. Analytical Framework
3.1. Profitability Analysis
3.2. DuPont Analysis
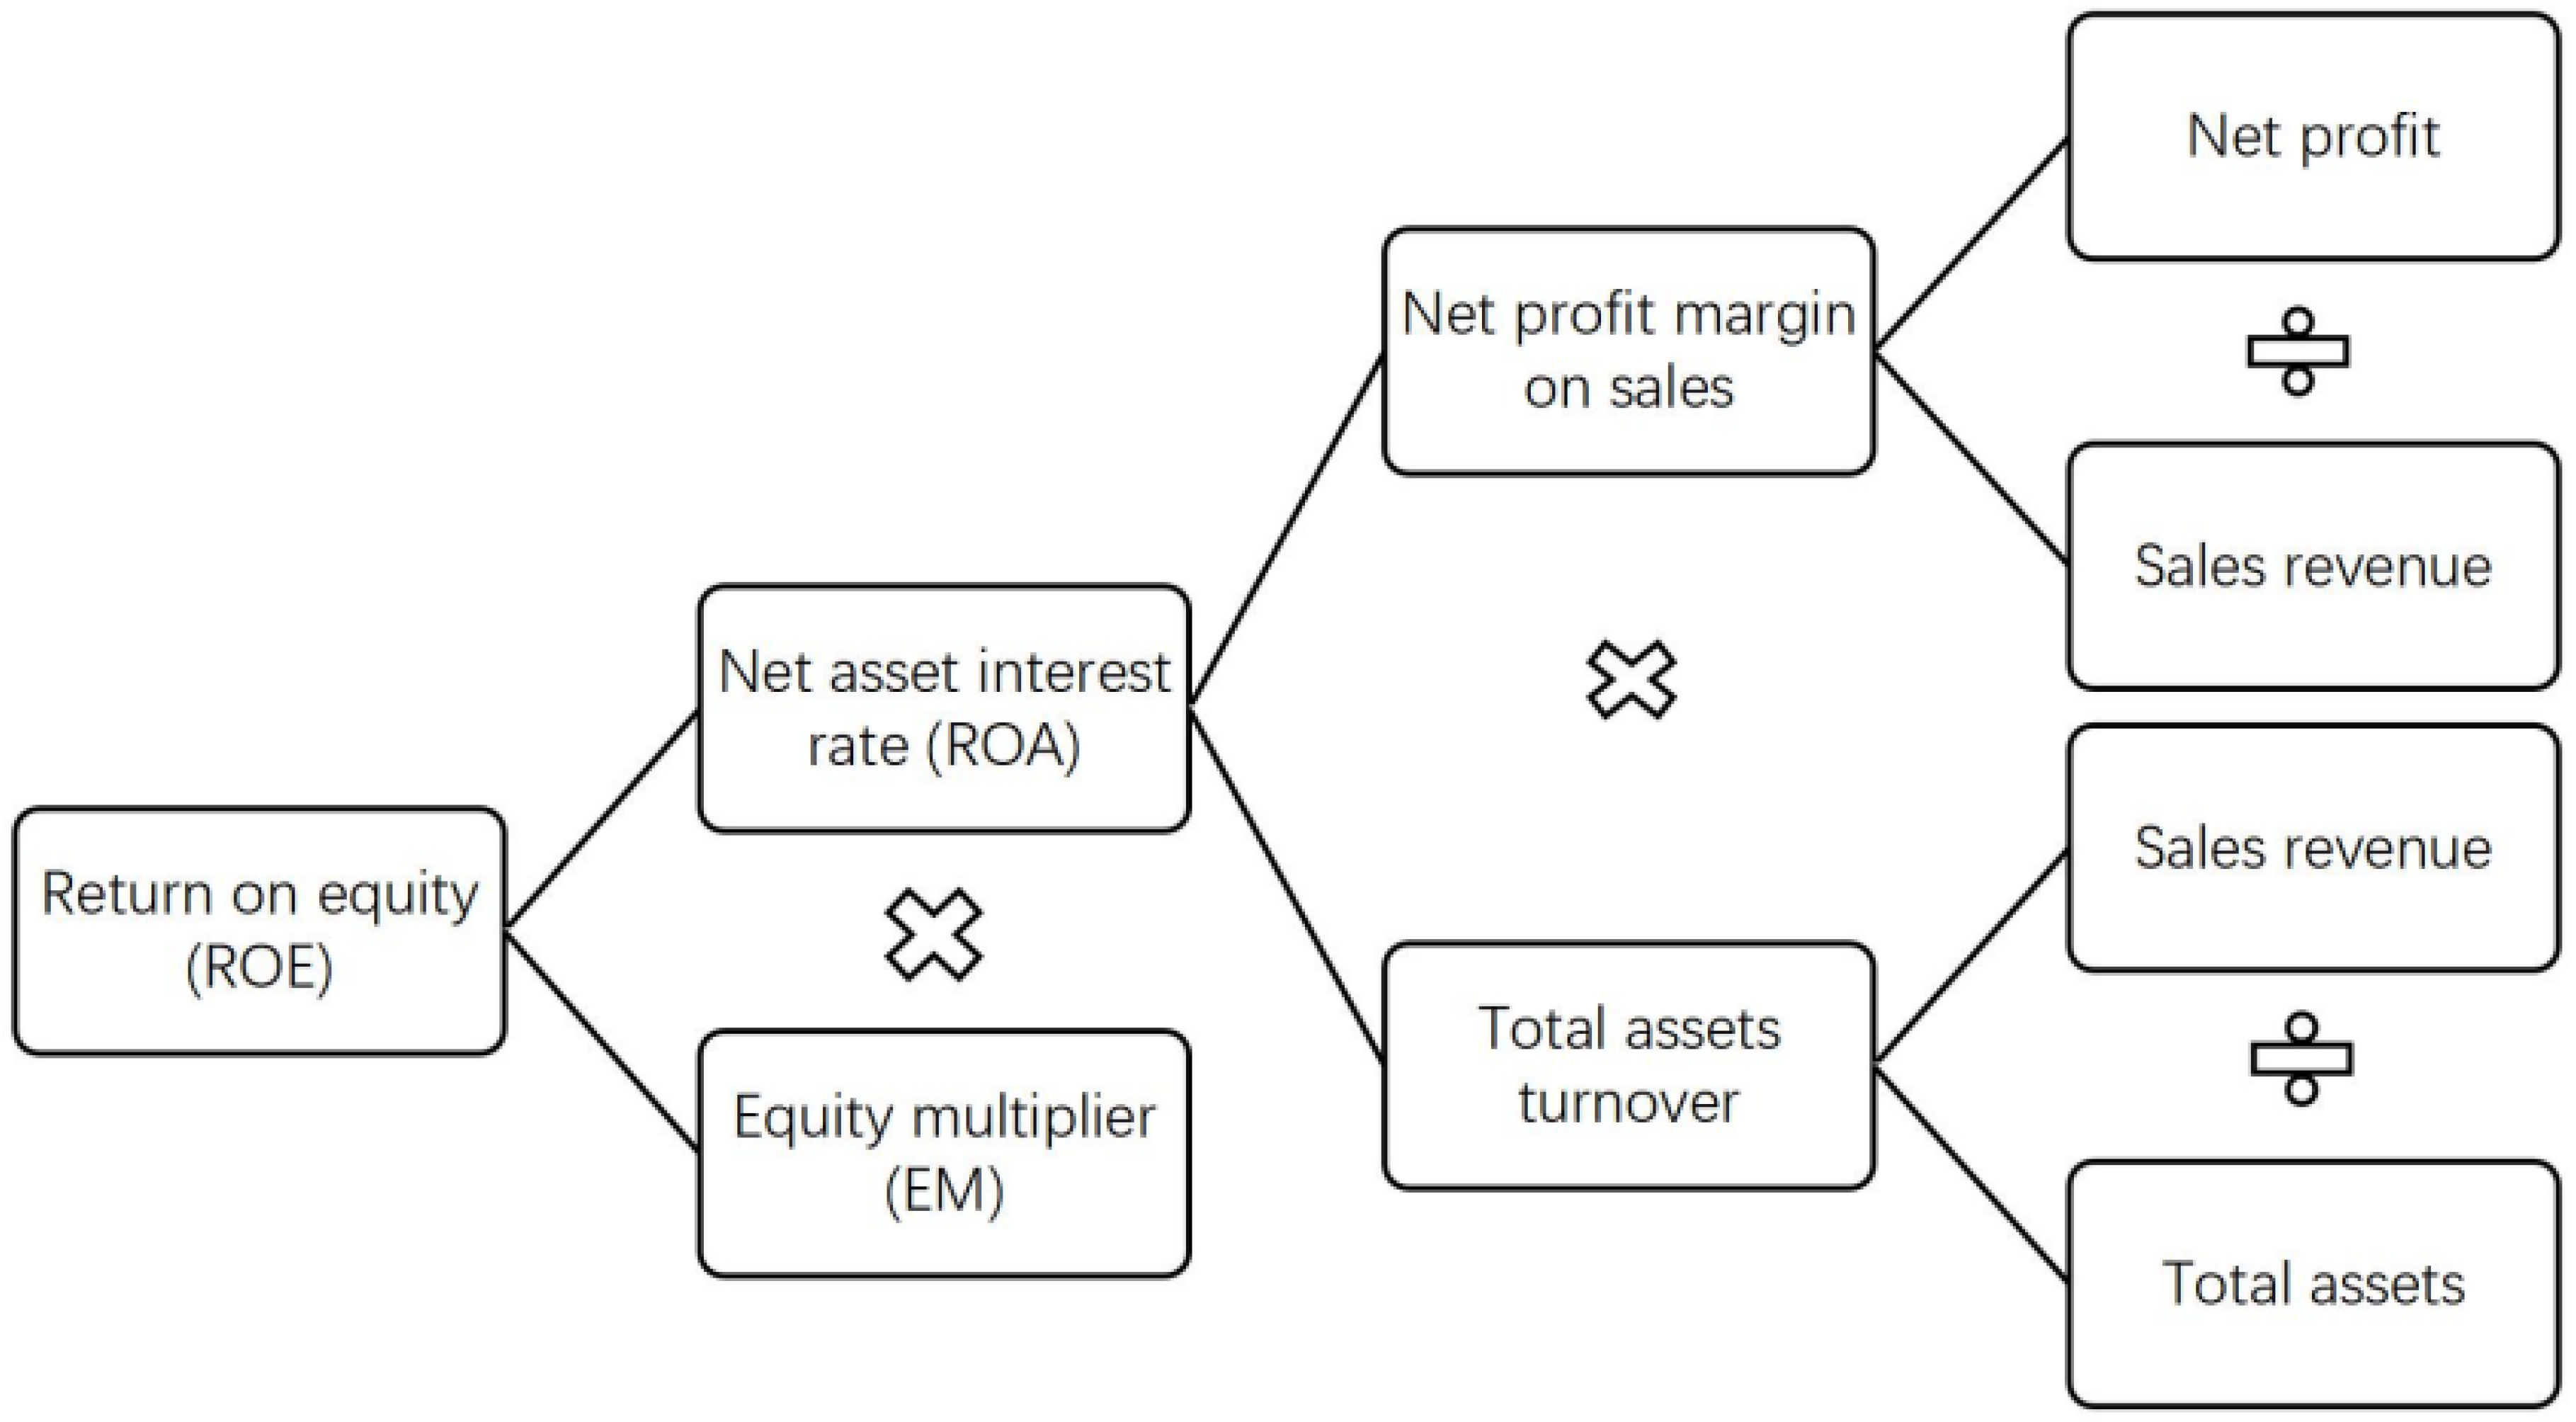
3.3. DuPont Analysis System
3.4. DuPont Analysis System Index
3.4.1. Return on Equity (ROE)
3.4.2. Net Asset Interest Rate (ROA)
3.4.3. Equity Multiplier (EM)
3.5. Amazon’s Statement of Financial Positions Analysis
3.5.1. Analysis on the Changes of Main Items of Assets
3.5.2. Analysis on the Changes of Liabilities and Owners’ Equity
3.5.3. Analysis of the Changes in Financial Performance
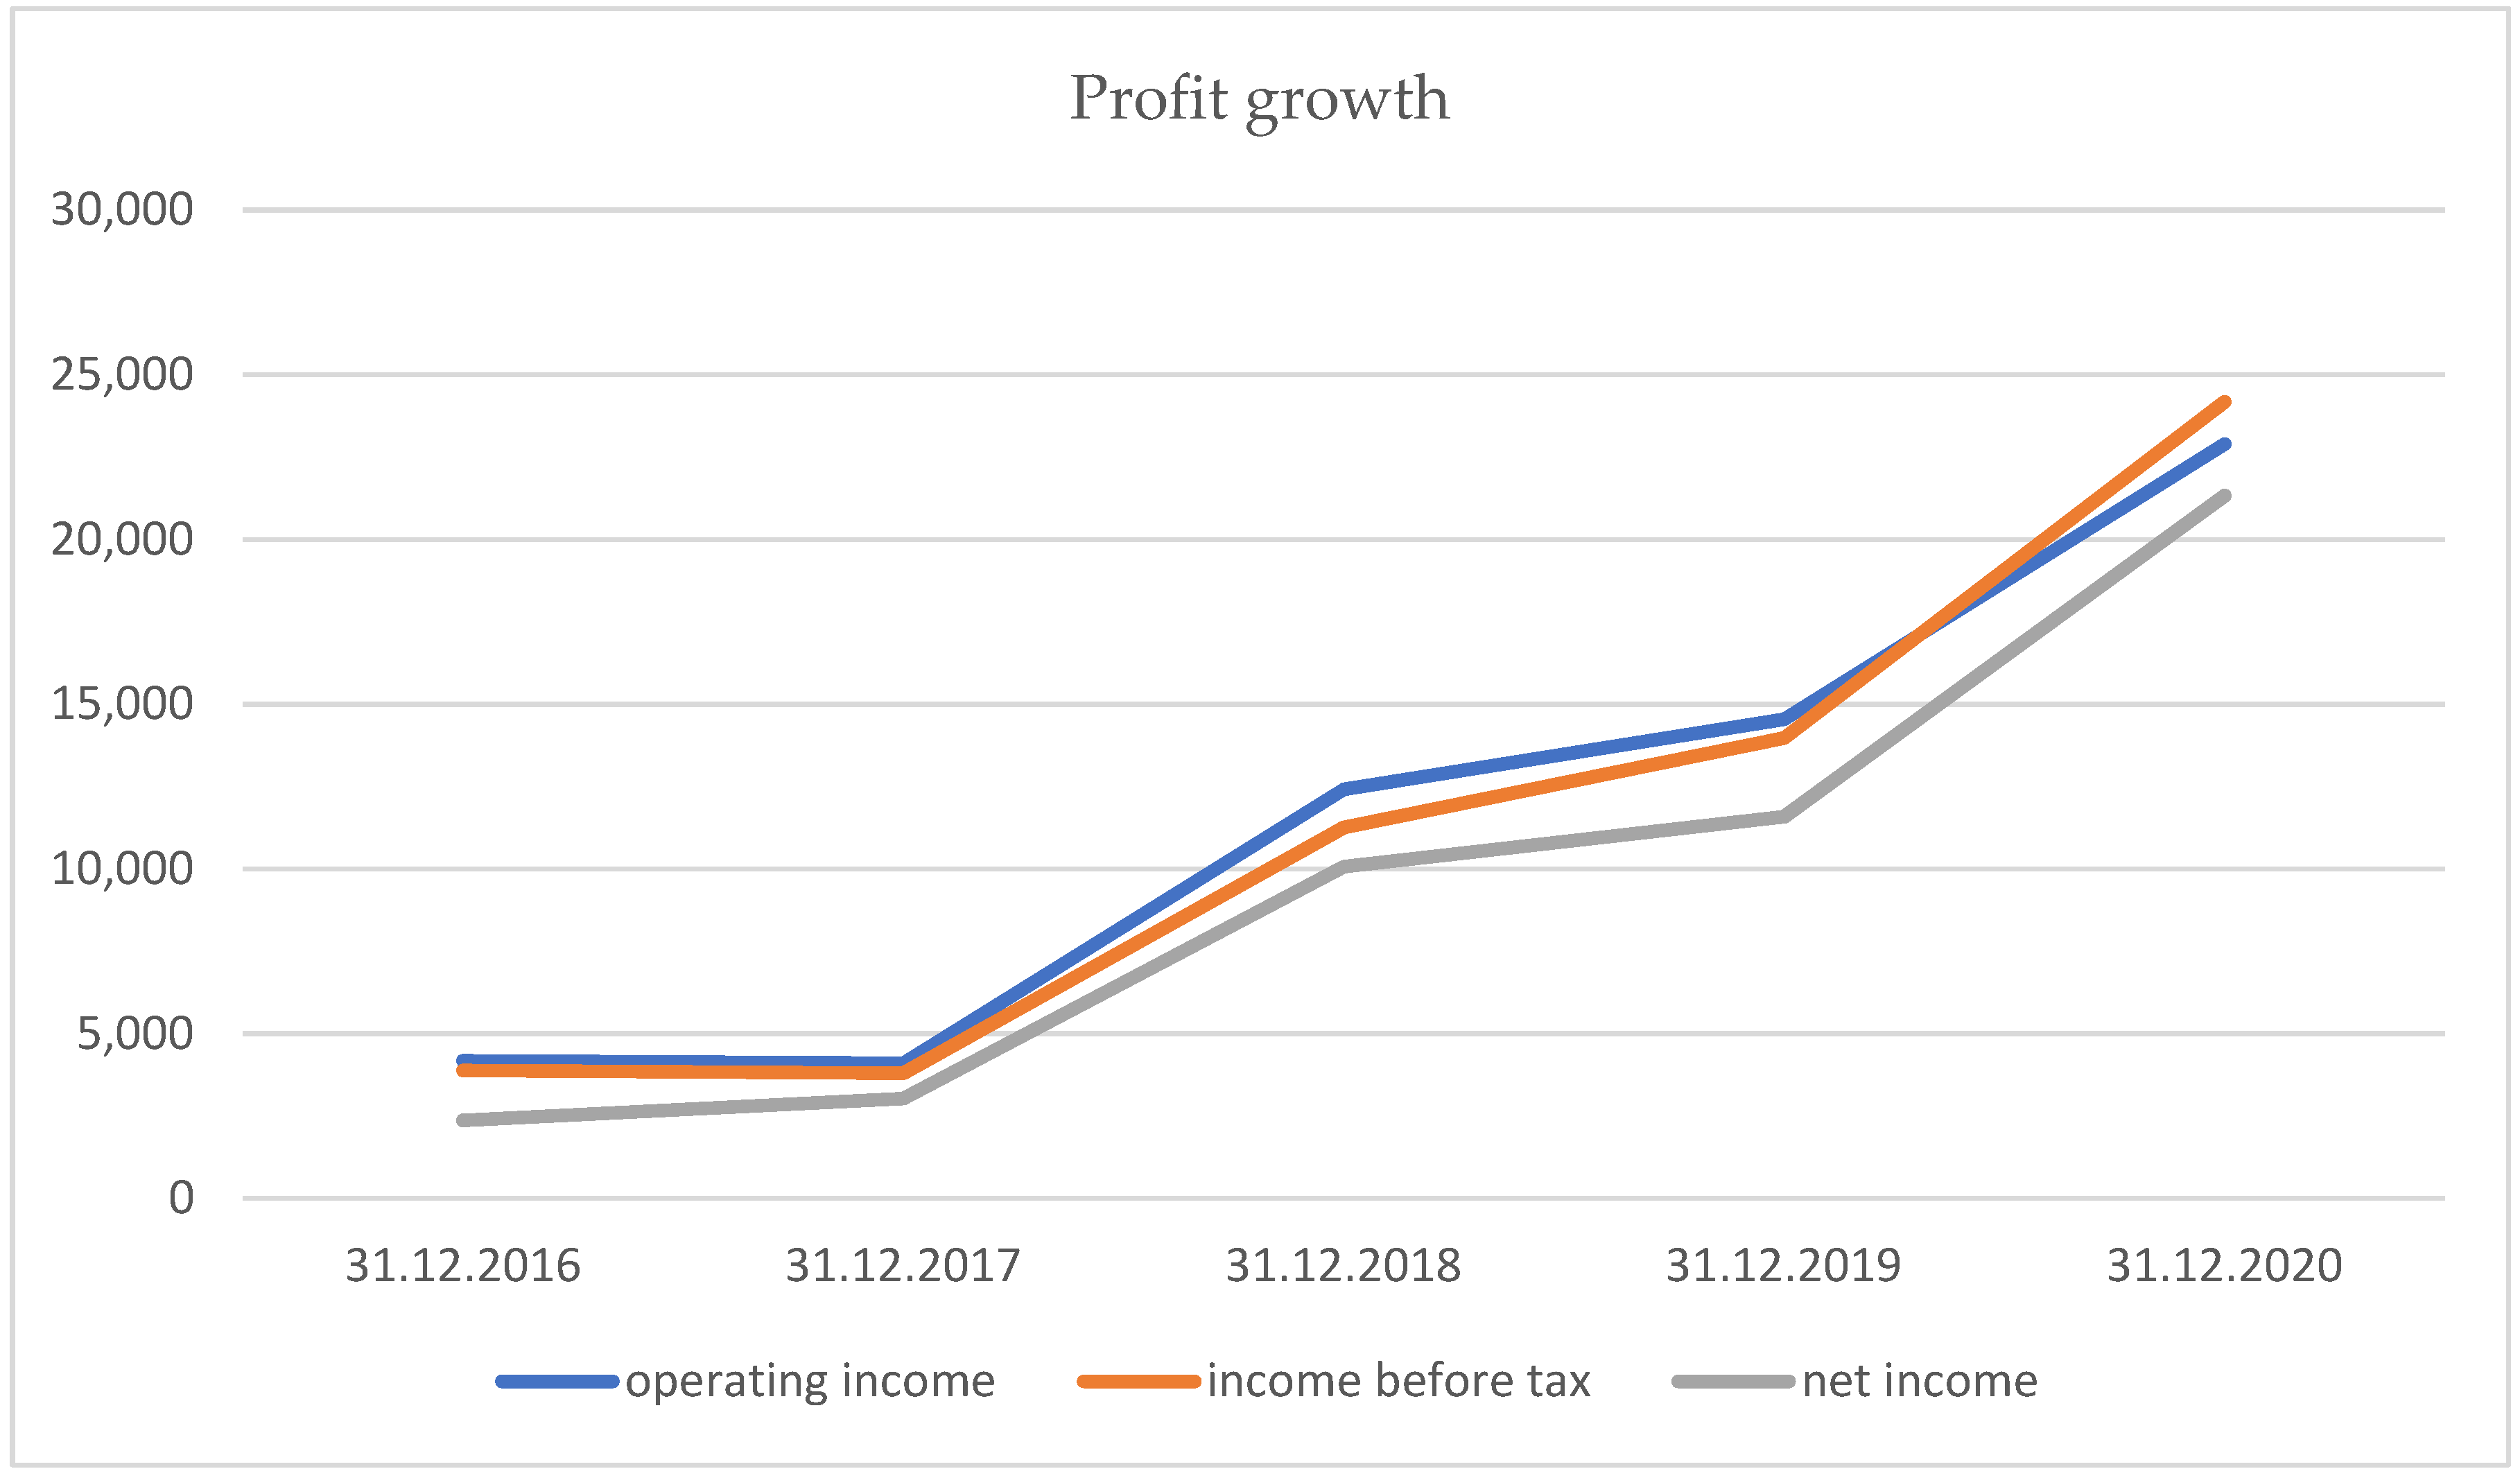
Total Profit Growth and Composition Analysis
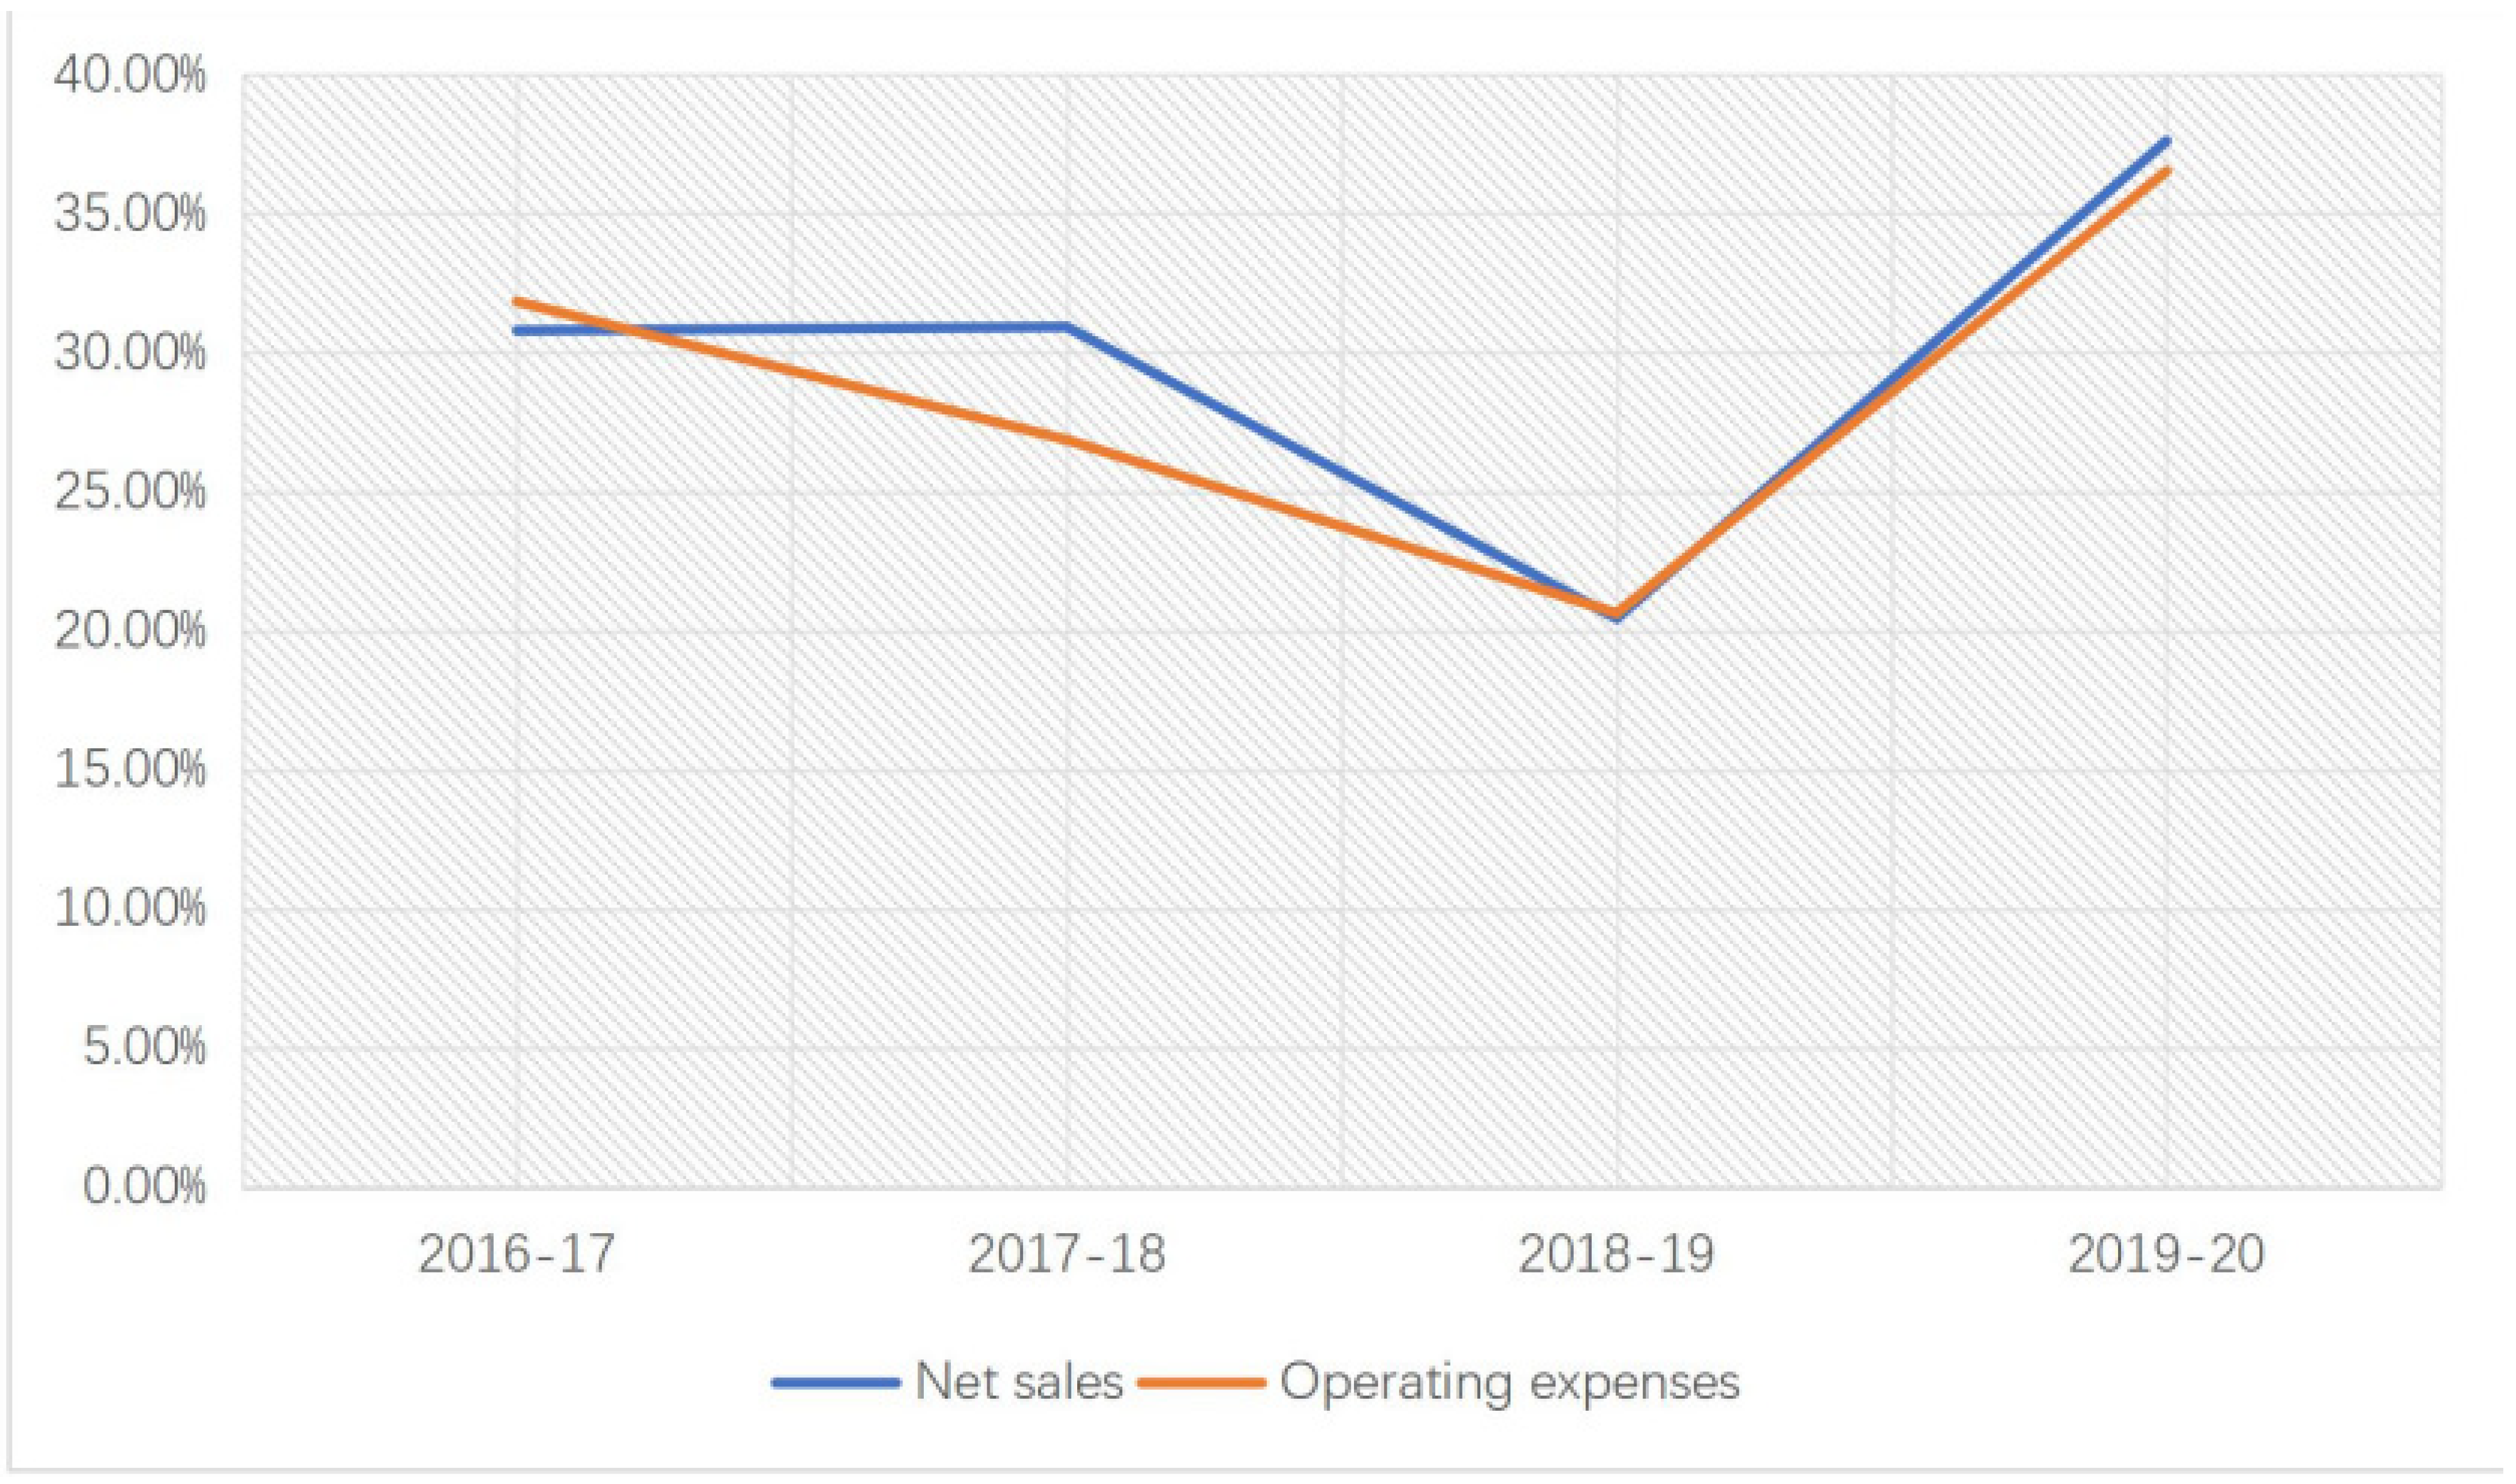
Cost and Expense Analysis
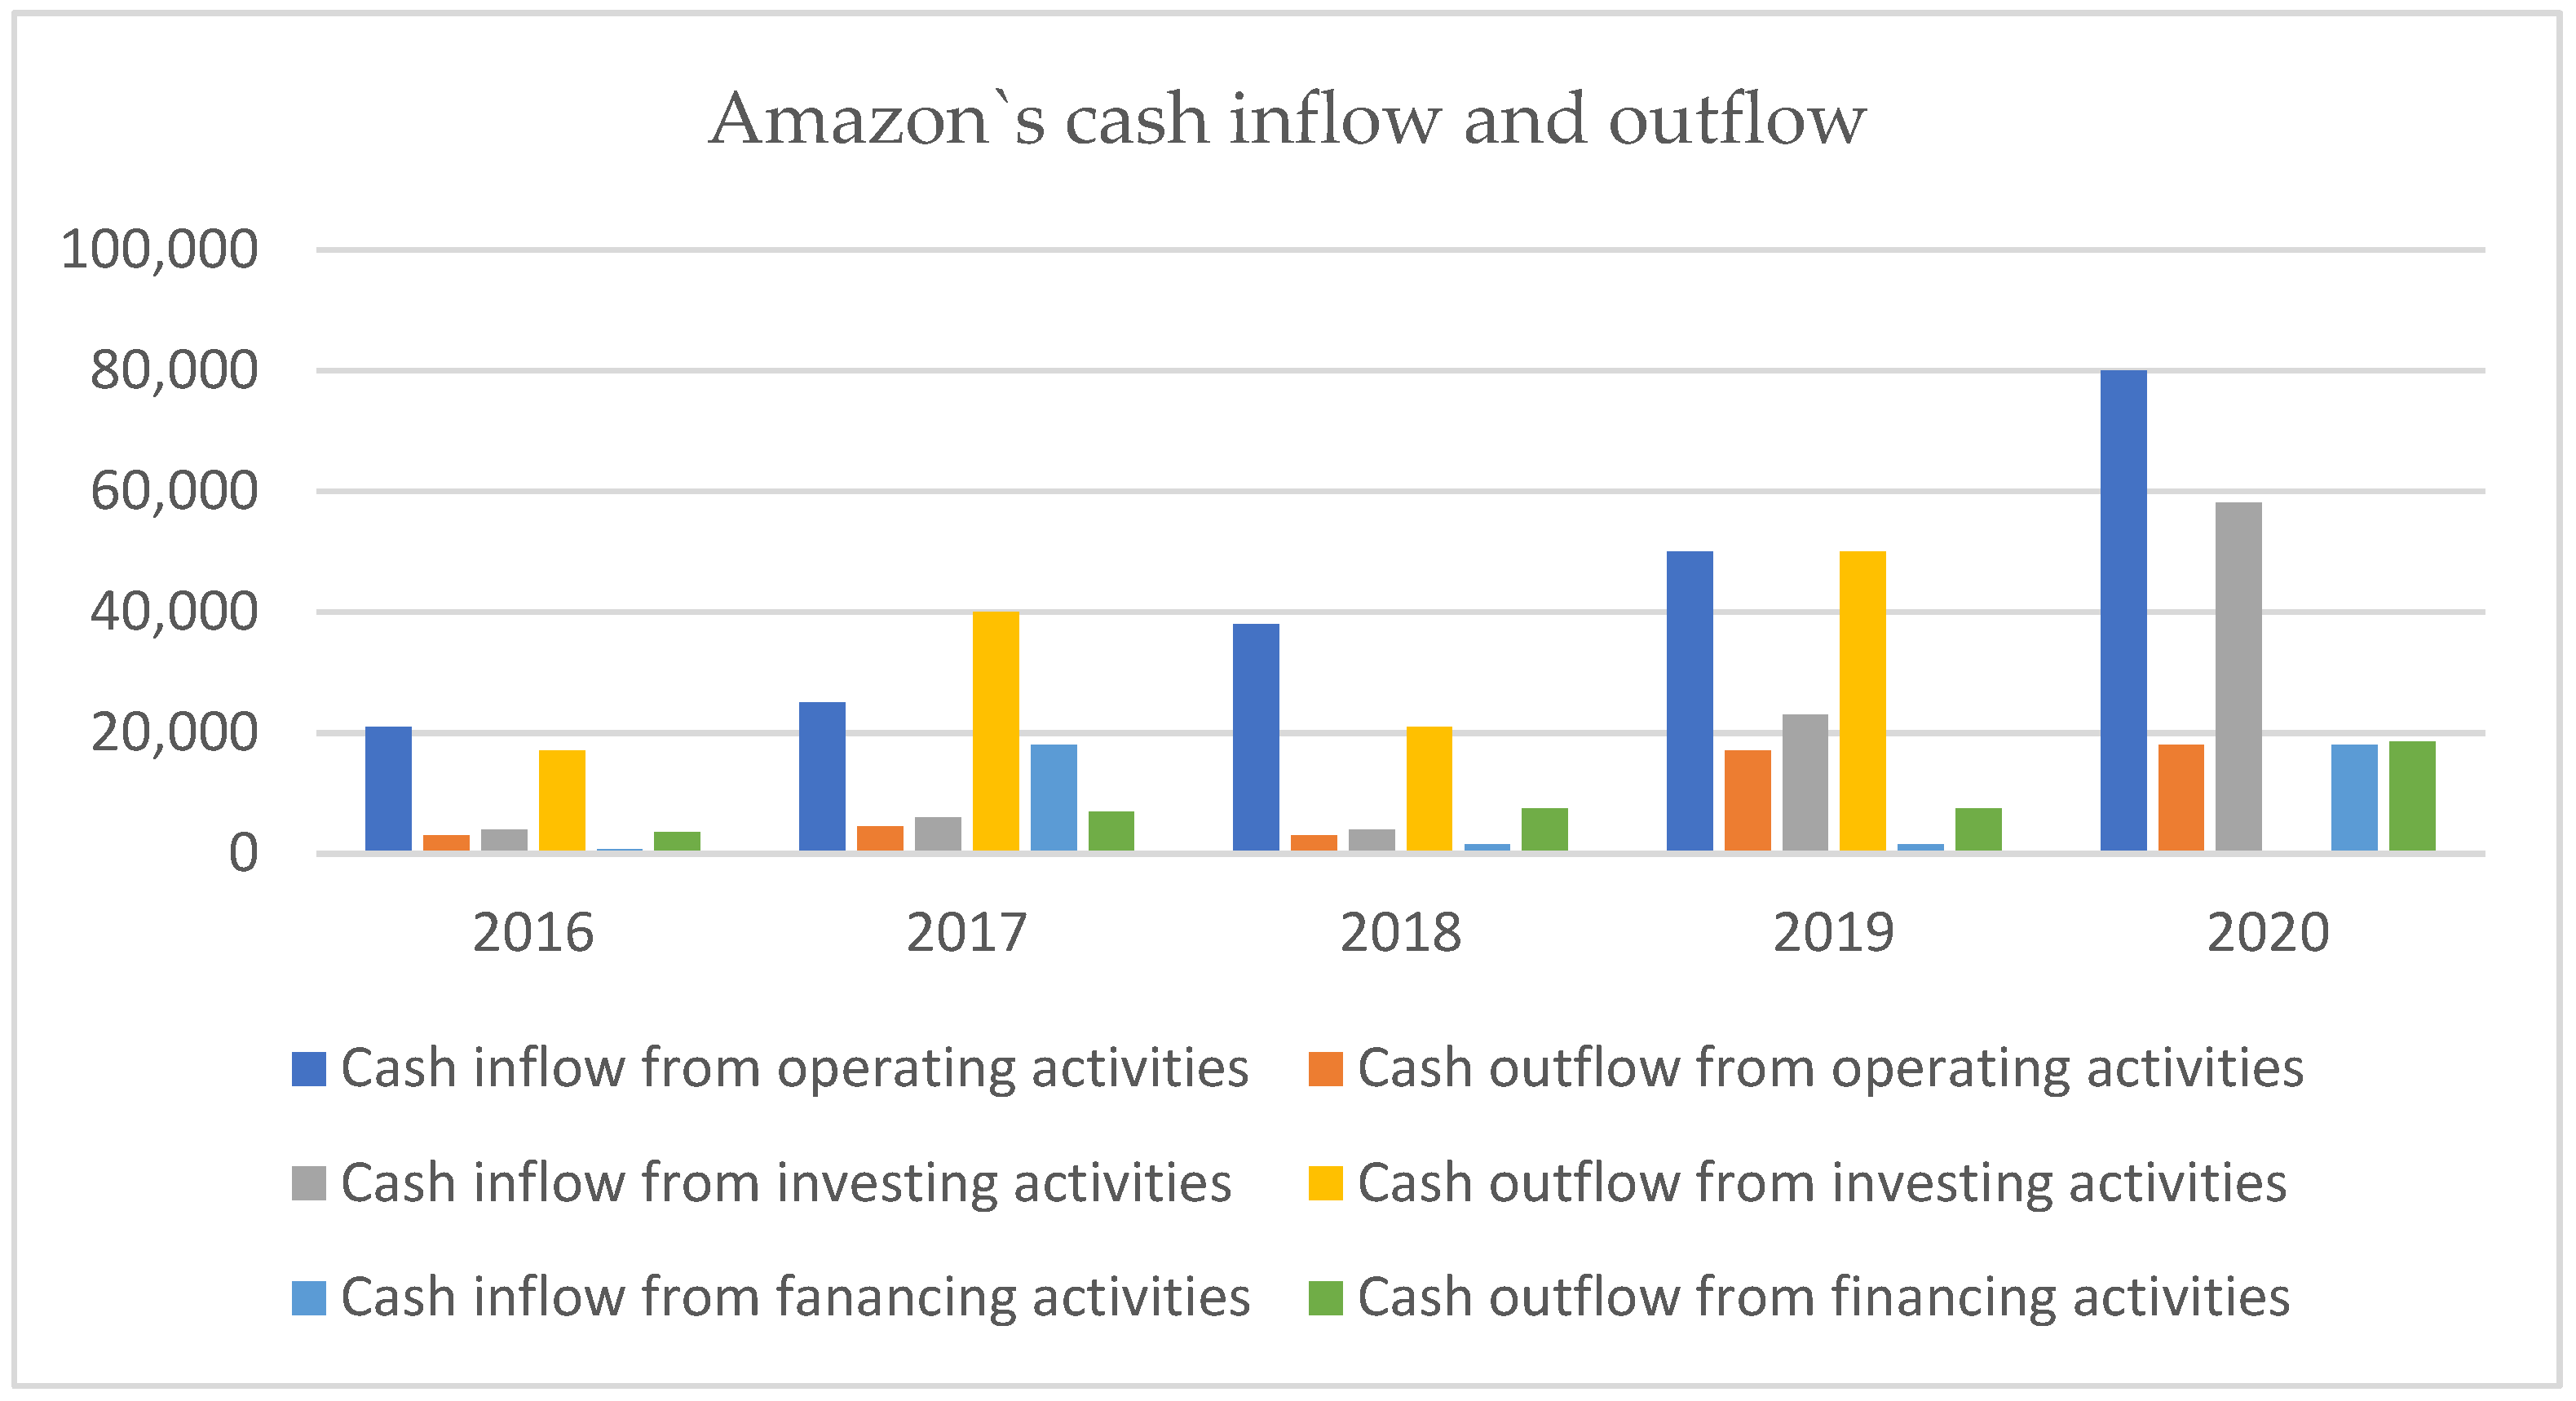
Analysis of the Changes in Cash Flow Statement
Comparative Analysis of Cash Inflow and Outflow Structure
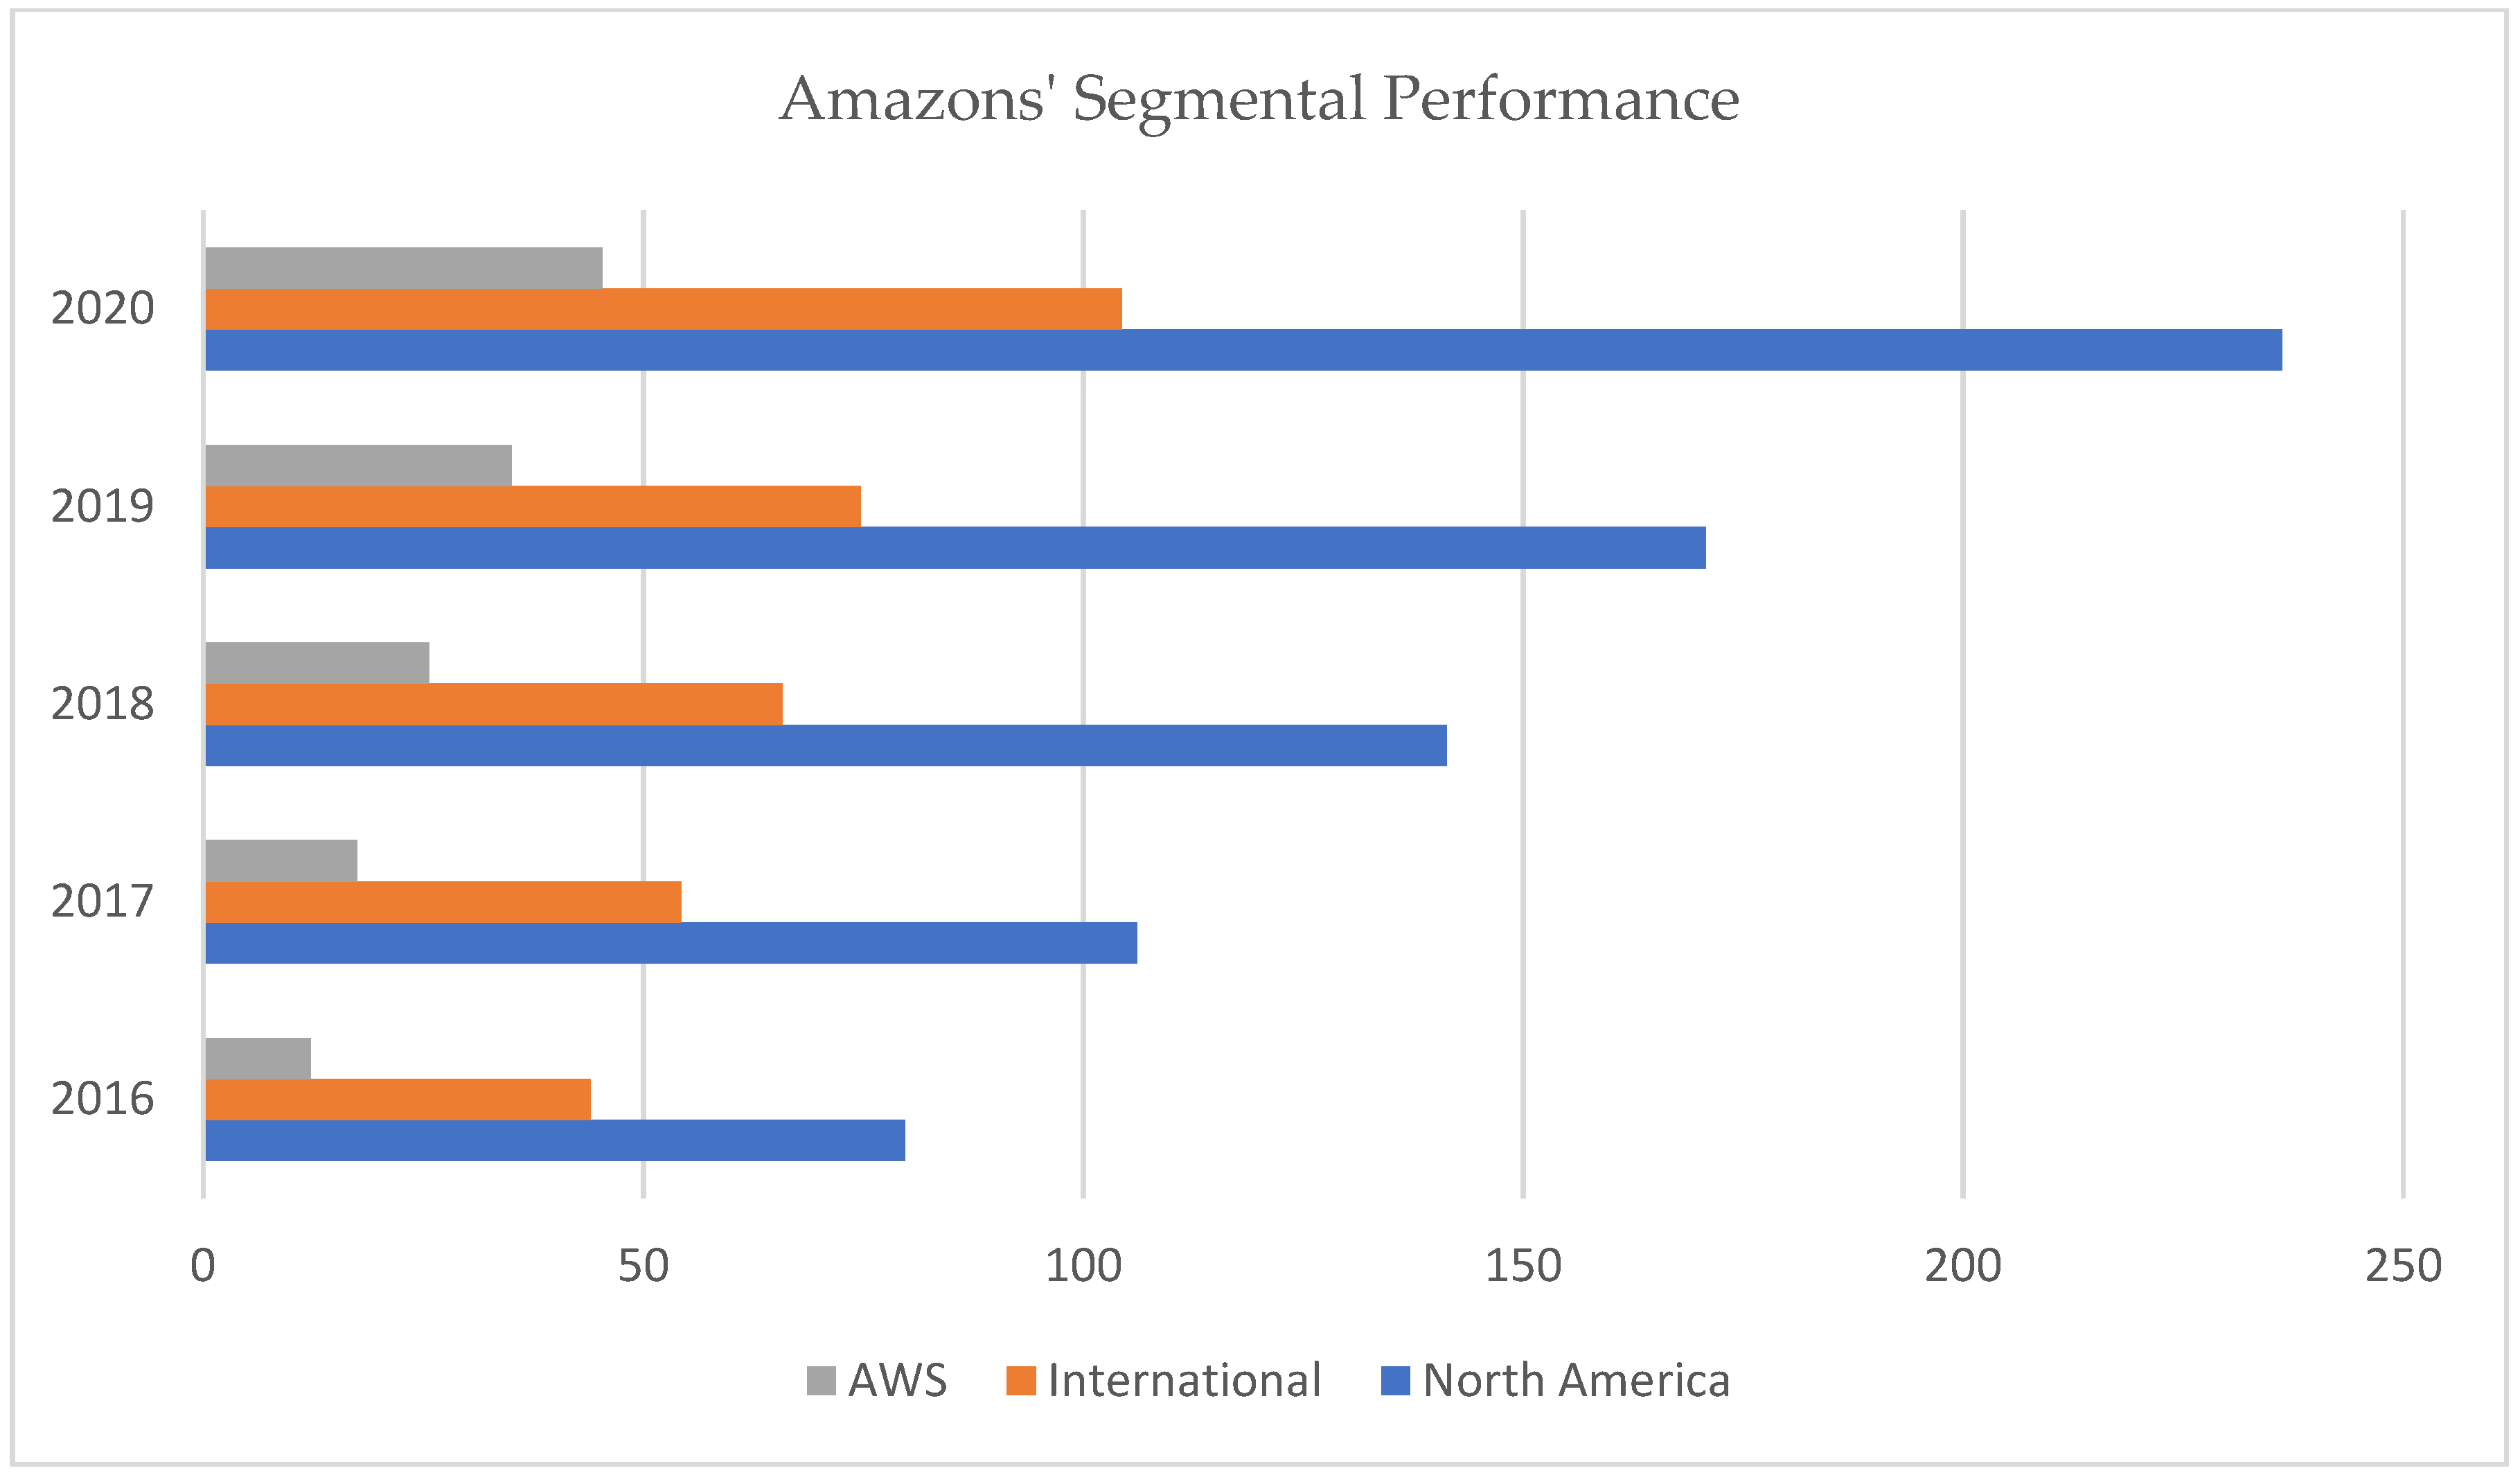
3.6. Comparison of Financial Performance and Position between Amazon and Walmart
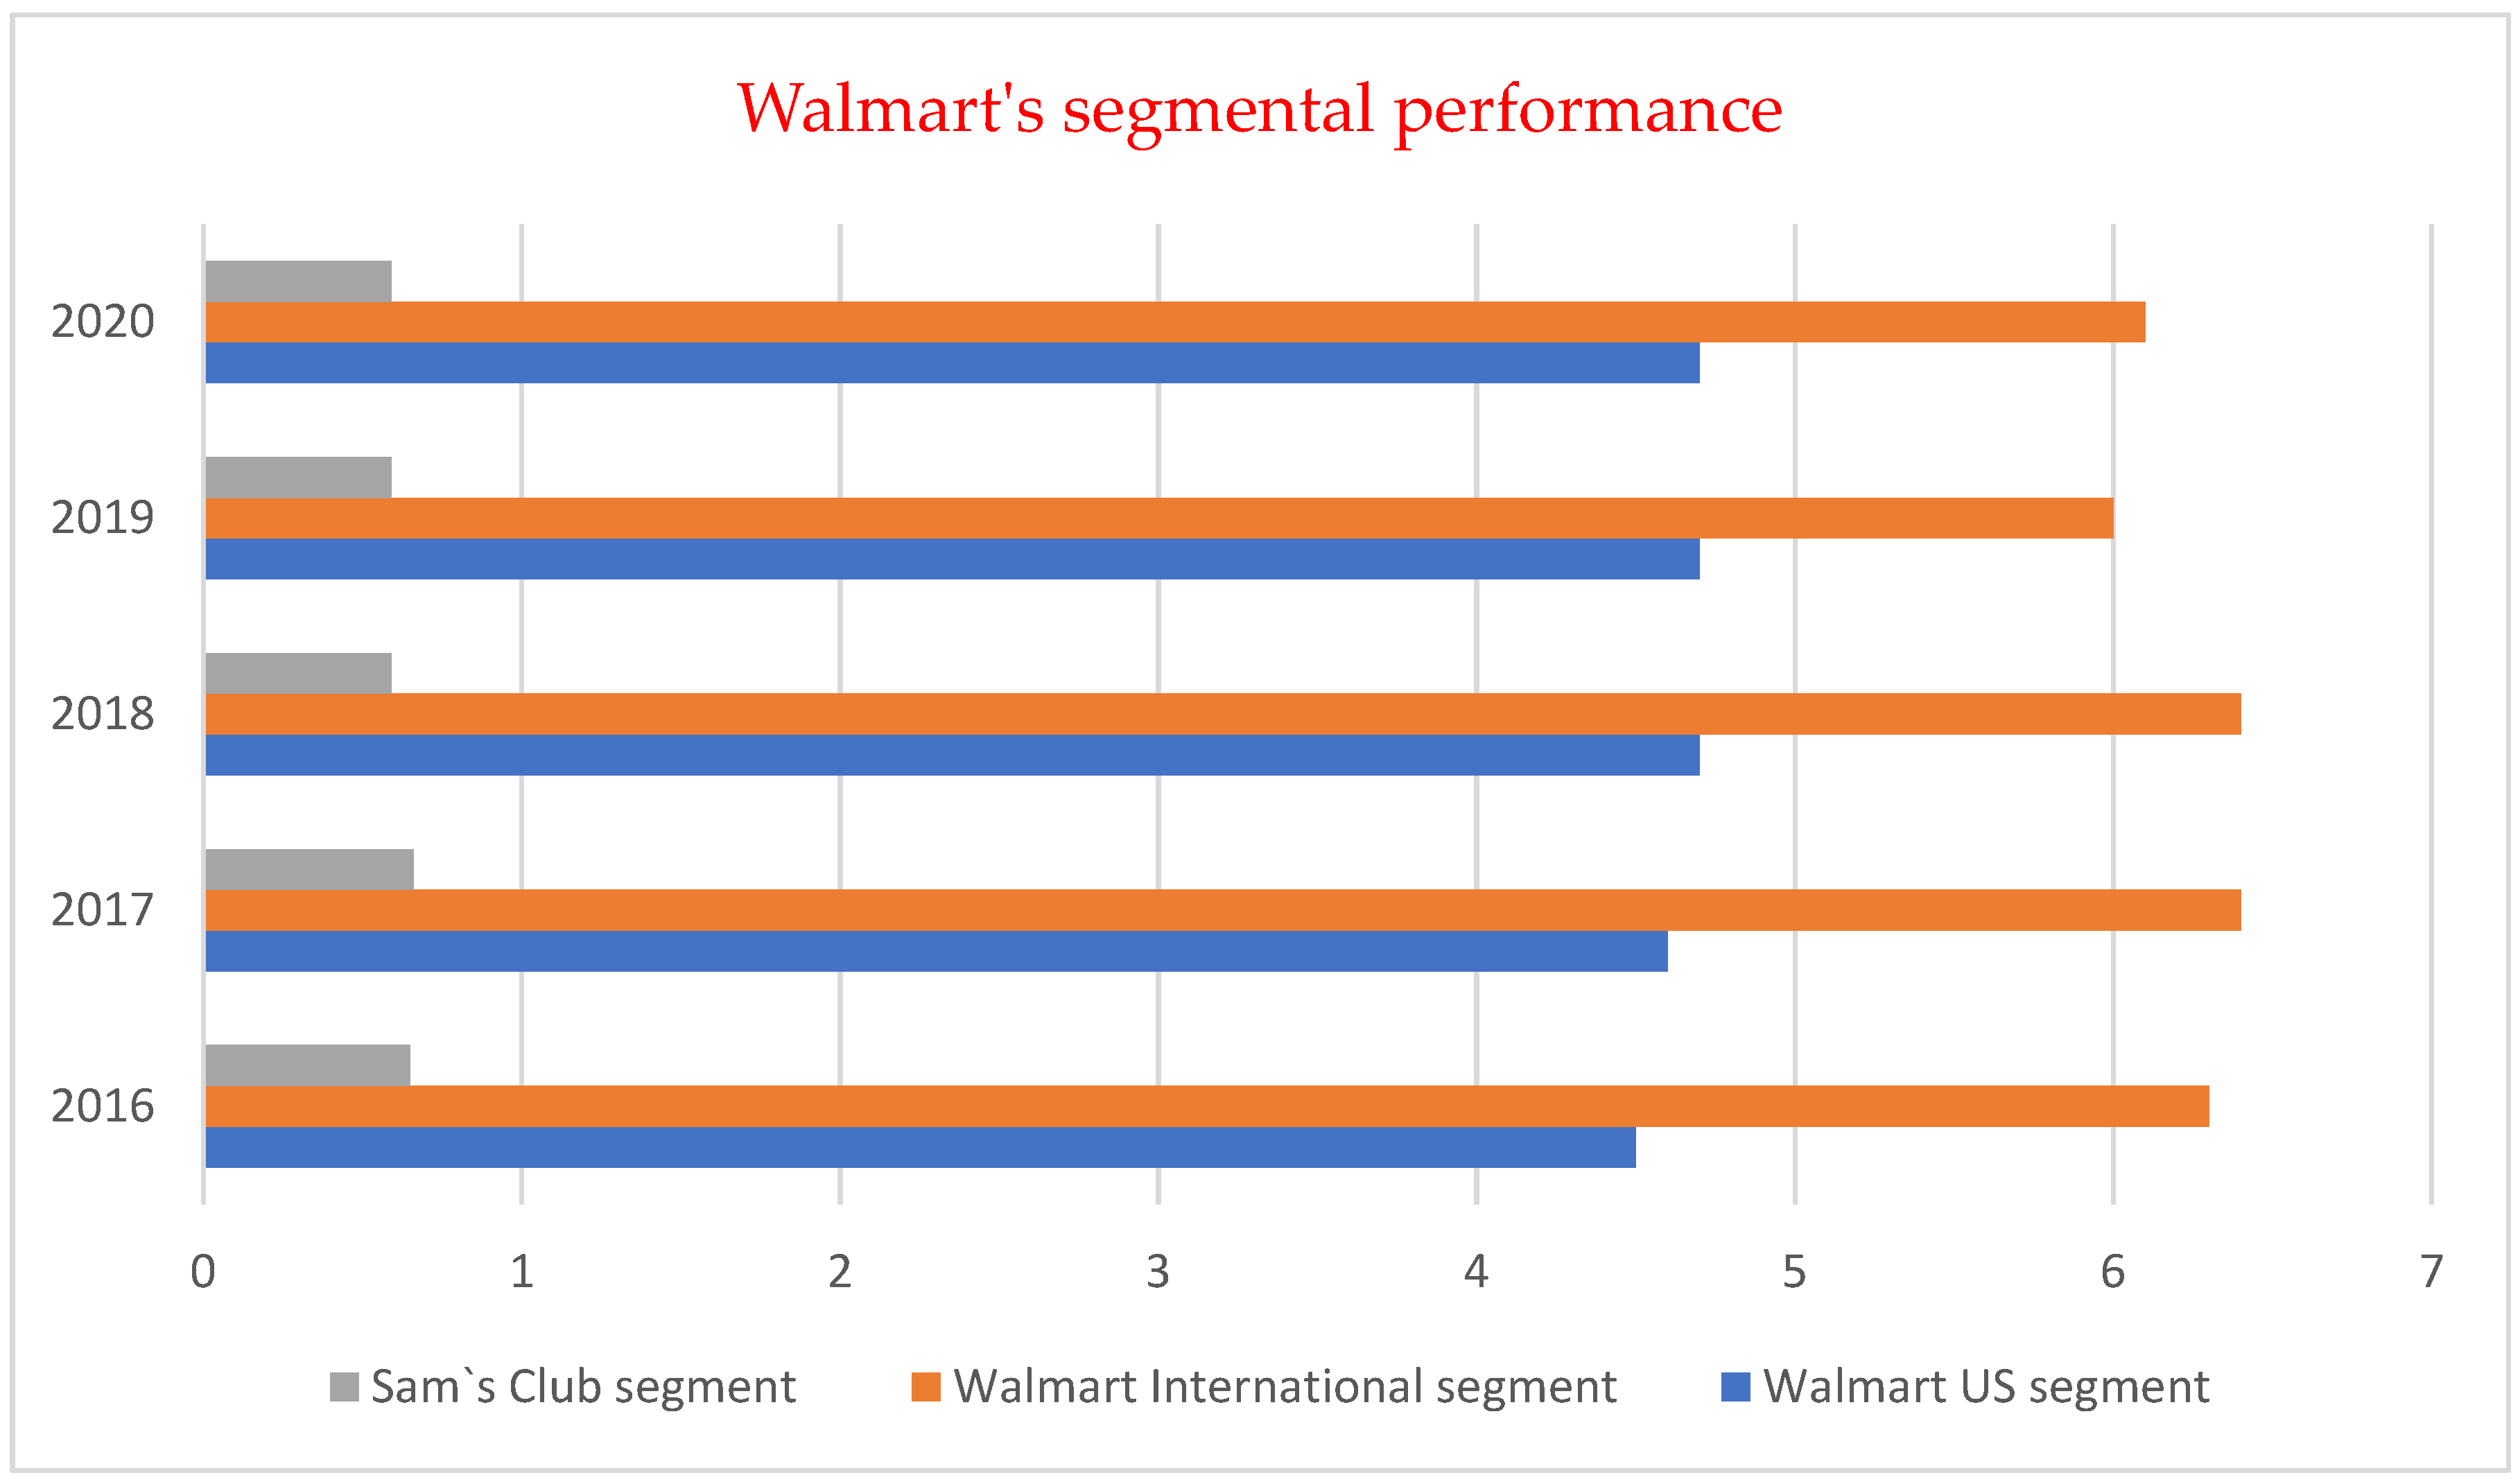
Comparative Analysis of Walmart’s Financial Performance and Position
4. Research Methods and Results Discussion
4.1. Dupont Analysis
4.1.1. Analysis of Return on Equity (ROE)
4.1.2. Two-Factor Analysis of Return on Equity (ROE)
4.1.3. Three-Factor Analysis of Return on Equity (ROE)
multiplier (EM)
4.2. Comparison of ROA, ROE, and EM between Amazon and Walmart
4.3. Problems and Countermeasures in Financial Management
4.3.1. Poor Cost Control
4.3.2. Poor Capital Operation Ability
4.3.3. Poor Management Level of Liabilities
4.3.4. Lack of Core Competitiveness
5. Conclusions
Author Contributions
Funding
Data Availability Statement
Conflicts of Interest
References
- Ahamed, Mohammad Jafaur. 2020. Comparison of the Financial Performance between Square Pharmaceuticals Limited and Beximco Pharmaceuticals Limited: DuPont Analysis. Global Disclosure of Economics and Business 9: 39–48. [Google Scholar] [CrossRef]
- Almazari, Ahmed Arif. 2012. Financial performance analysis of the Jordanian Arab bank by using the DuPont system of financial analysis. International Journal of Economics and Finance 4: 86–94. [Google Scholar] [CrossRef]
- Alzyadat, Jumah Ahmad, and Evan Asfoura. 2021. The effect of COVID-19 pandemic on stock market: An empirical study in Saudi Arabia. The Journal of Asian Finance, Economics and Business 8: 913–21. [Google Scholar]
- Annisa, Mutiara Lusiana, and Ruth Samantha Hamzah. 2020. Influence of Debt-to-Equity Ratio, Return on Asset Ratio, and Firm Size on Audit Delay. International Journal of Dynamic Economics and Business 4: 315–24. [Google Scholar] [CrossRef]
- Baud, Céline, and Cédric Durand. 2021. Making profits by leading retailers in the digital transition: A comparative analysis of Carrefour, Amazon and Wal-Mart (1996–2019). Available online: https://hal.archives-ouvertes.fr/hal-03332318 (accessed on 25 July 2022).
- Bernhardt, Dan, Tingjun Liu, and Robert Marquez. 2018. “Targeting target shareholders”. Management Science 64: 1489–1509. [Google Scholar] [CrossRef]
- Cabrera-Sánchez, Juan-Pedro Ramos-de-Luna, Elena Carvajal-Trujillo, and Ángel F. Villarejo-Ramos. 2020. Online recommendation systems: Factors influencing use in e-commerce. Sustainability 12: 8888. [Google Scholar] [CrossRef]
- Caraway, Brett. 2016. OUR Walmart: A case study of connective action. Information, Communication & Society 19: 907–20. [Google Scholar]
- Christian, Michael, Dewi Dewi, Glisina Dwinoor Rembulan, Eko Retno Indriyarti, Suryo Wibowo, and Yustinus Yuniarto. 2021. Business Performance Determinants of Salted Fish Distribution in Kapuk During the COVID-19. Journal of Distribution Science 19: 29–39. [Google Scholar]
- Churi, Prathamesh, Kamal Mistry, Muhammad Mujtaba Asad, Gaurav Dhiman, Mukesh Soni, and Utku Kose. 2022. Online learning in COVID-19 pandemic: An empirical study of Indian and Turkish higher education institutions. World Journal of Engineering 19: 58–71. [Google Scholar] [CrossRef]
- Dai, Na, and Louis R. Piccotti. 2020. Required return on equity when capital structure is dynamic. Financial Management Association 49: 265–89. [Google Scholar] [CrossRef]
- Deloof, Marc. 2003. Does working capital management affect profitability of Belgian firms? Journal of business finance & Accounting 30: 3–4. [Google Scholar]
- Easto, Peter D., and Steven J. Monahan. 2016. Review of Recent Research on Improving Earnings Forecasts and Evaluating Accounting-based Estimates of the Expected Rate of Return on Equity Capita. Abacus 52: 35–58. [Google Scholar] [CrossRef]
- Finch, Byron J. 1999. Internet discussions as a source for consumer product customer involvement and quality information: An exploratory study. Journal of Operations Management 17: 535–56. [Google Scholar] [CrossRef]
- Gardner, John C., Carl B. McGowan Jr., and Susan E. Moeller. 2011. Using Accounting Information For Financial Planning And Forecasting: An Application Of The Sustainable Growth Model Using Coca-Cola. Journal of Business Case Studies (JBCS) 7: 9–16. [Google Scholar] [CrossRef]
- Giantari, I Gusti Ayu Ketut, Ni Nyoman Kerti Yasa, Herkulanus Bambang Suprasto, and Putu Laksmita Dewi Rahmayanti. 2022. The role of digital marketing in mediating the effect of the COVID-19 pandemic and the intensity of competition on business performance. International Journal of Data and Network Science 6: 217–32. [Google Scholar] [CrossRef]
- Gore, Jennifer, Leanne Fray, Andrew Miller, Jess Harris, and Wendy Taggart. 2021. The impact of COVID-19 on student learning in New South Wales primary schools: An empirical study. The Australian Educational Researcher 48: 605–37. [Google Scholar] [CrossRef]
- Gray, Richard S. 2020. Agriculture, transportation, and the COVID-19 crisis. Canadian Journal of Agricultural Economics 68: 239–43. [Google Scholar] [CrossRef]
- Guo, Xinyue, Yixuan Liu, and Zheheng Liu. 2021. Study on Value Portfolio from the Perspective of COVID-19: A Case Study of Aviation, E-commerce and Retail Industry. In Proceedings of the 2021 International Conference on Financial Management and Economic Transition (FMET 2021), Guangzhou, China, August 27–29; pp. 255–59. [Google Scholar]
- Guterres, A. 2020. We Are All in This Together: Human Rights and COVID-19 Response and Recovery. Message by the United Nations Secretary-General. April 23. Available online: https://www.un.org/sg/en/content/sg/statement/2020-04-23/we-are-all-together-human-rights-and-covid-19-response-andrecovery-video-message-the-secretary-general-delivered (accessed on 31 August 2022).
- Hahn, Yoonah, Dongho Kim, and Myoung-Kil Youn. 2018. A brief analysis of Amazon and distribution strategy. Journal of Distribution Science 16: 17–20. [Google Scholar] [CrossRef]
- Hao, Yue, and Seung Uk Choi. 2019. Operating performance of Chinese online shopping companies: An analysis using DuPont components. Sustainability 11: 3602. [Google Scholar] [CrossRef]
- Hickson, Charles R., John D. Turner, and Qing Ye. 2011. The rate of return on equity across industrial sectors on the British stock market, 1825–70. Economic History Review 64: 1218–41. [Google Scholar] [CrossRef]
- Higgins, E. Tory. 1998. Promotion and prevention: Regulatory focus as a motivational principle. In Advances in Experimental Social Psychology. Cambridge: Academic Press, vol. 30, pp. 1–46. [Google Scholar]
- Kapoor, Rahul, and Shiva Agarwal. 2017. Sustaining superior performance in business ecosystems: Evidence from application software developers in the iOS and android smartphone ecosystems. Organization Science 28: 531–51. [Google Scholar] [CrossRef]
- Kasozi, Jason Stephen. 2018. Capital Structure and The Profitability of Listed Retail Firms. Journal of Economics and Behavioral Studies 10: 171–81. [Google Scholar] [CrossRef]
- Kim, Dong-Ho, and Myoung-Kil Youn. 2013. The Role of Information Technology on Distribution. In Proceedings of the International Conference on Economics and Business Research (ICEBR 2013), Kedah, Malaysia, May 14–16; pp. 65–71. [Google Scholar]
- Kotha, Sambasivarao. 1998. Competing on the Internet: The case of Amazon. com. European Management Journal 16: 212–22. [Google Scholar] [CrossRef]
- Kuckertz, Andreas, Leif Brändle, Anja Gaudig, Sebastian Hinderer, Carlos Arturo Morales Reyes, Alicia Prochotta, Kathrin M. Steinbrink, and Elisabeth S. C. Berger. 2020. Startups in times of crisis—A rapid response to the COVID-19 pandemic. Journal of Business Venturing Insights 13: e00169. [Google Scholar] [CrossRef]
- Kumar Das, Kishore, and Shalini Patnaik. 2020. The Impact of COVID-19 in Indian Economy—An Empirical Study (June 2020). International Journal of Electrical Engineering and Technology 11: 194–202. [Google Scholar]
- Latif, Madiha, Jawwad Hassan Jaskani, Tehreem Ilyas, Zohaib Khan Babar, and Hina Gulzar. 2014. Issues faced by Apple Inc in smart phones industry. International Journal of Accounting and Financial Reporting 4: 50. [Google Scholar] [CrossRef]
- Lee, Yee Ming. 2015. Study on e-commerce evaluation model: Focused on “internet business model”. Journal of Distribution Science 14: 85–91. [Google Scholar]
- Lin, Steve, Donel Martinez, Changjiang Wang, and Ya-wen Yang. 2018. Is Other Comprehensive Income Reported in the Income Statement More Value Relevant? The Role of Financial Statement Presentation. Journal of Accounting, Auditing & Finance 33: 626–46. [Google Scholar]
- Lízalová, Lenka, and Petra Kozáková. 2013. Effect of The Equity Multiplier Indicator in Companies According to Sectors. Acta Universitatis Agriculturae et Silviculturae Mendelianae Brunensis 61: 385–92. [Google Scholar] [CrossRef]
- Magretta, Joan. 2003. What Management Is: How It Works and Why Its Everyone Business, 1st ed. London: Profile Books Ltd. [Google Scholar]
- Maliszewska, Marayla, Mattoo Asditya, and Dominique Van Der Mensbrugghe. 2020. The Potential Impact of COVID-19 on GDP and Trade: A Preliminary Assessment. World Bank Policy Research Working Paper. Available online: https://ssrn.com/abstract=3573211 (accessed on 15 June 2022).
- Manjunatha, T., and Praveen J. Gujjar. 2018. Extended DuPont Ratio Analysis of Indian Information Technology Companies. Pacific Business Review International 11: 5–14. [Google Scholar]
- McNamara, Thomas, Sabry Shaaban, and Sarah Hudson. 2013. Simulation of unbalanced buffer allocation in unreliable unpaced production lines. International Journal of Production Research 51: 1922–1936. [Google Scholar] [CrossRef]
- Mellahi, Kamel, and Michael Johnson. 2000. Does it pay to be a first mover in e.commerce? The case of Amazon.com. Management Decision 38: 445–52. [Google Scholar] [CrossRef]
- Nielsen. 2010. Global Trends in Online Shopping—A Nielsen Global Consumer Report June 2010. Available online: www.nielsen.com/us/en/insights/reports-downloads/2010/Global-Trends-in-Online-Shopping-Nielsen-Consumer-Report (accessed on 31 May 2022).
- Onyusheva, Irina, and Tanatthon Seenalasataporn. 2018. Strategic analysis of global e-commerce and diversification technology: The case of amazon. com inc. The EUrASEANs: Journal on Global Socio-Economic Dynamics 1: 48–63. [Google Scholar] [CrossRef]
- Pandey, Rudresh, D. Dillip, Jigyasa Jayant, Kajal Vashishth, Nikhil Nikhil, Tin Jin Qi, Daisy Mui Hung Kee, Tan Cai Mei, Roselin Yong Kai Xin, and Looi Yong Qhi. 2021. Factors Influencing Organization Success: A Case Study of Walmart. International Journal of Tourism and Hospitality in Asia Pasific (IJTHAP) 4: 112–23. [Google Scholar] [CrossRef]
- Patin, Jeanne-Claire, Matuir Rahman, and Muhammad Mustafa. 2020. Impact of Total Asset Turnover Ratios on Equity Returns: Dynamic Panel Data Analyses. Journal of Accounting, Business & Management 27: 19–29. [Google Scholar]
- Pereira, Jorgina, Vitor Braga, Aldina Correia, and Aidin Salamzadeh. 2021. Unboxing organisational complexity: How does it affect business performance during the COVID-19 pandemic? Journal of Entrepreneurship and Public Policy 10: 424–44. [Google Scholar] [CrossRef]
- Ramlall, Indranarain. 2018. Tools and Techniques for Financial Stability Analysis, 1st ed. Bingley: Emerald Publishing. [Google Scholar]
- Soliman, Mark T. 2008. The use of DuPont analysis by market participants. The Accounting Review 83: 823–53. [Google Scholar] [CrossRef]
- Syaifullah, Jahid, Makmun Syaifudin, Markus Utomo Sukendar, and J. Junaedi. 2021. Social media marketing and business performance of MSMEs during the COVID-19 pandemic. The Journal of Asian Finance, Economics and Business 8: 523–31. [Google Scholar]
- The Tax Cuts and Jobs Act. 2017. Available online: https://taxfoundation.org/tax-reform-explained-tax-cuts-and-jobs-act/ (accessed on 19 June 2022).
- Vasile, Bura, and Mărginean Radu. 2014. The study of factors that may influence the performance by the Dupont analysis in the furniture industry. Paper presented at the 21st International Economic Conference, Sibiu, Romania, May 15–16. [Google Scholar]
- Walmart. 2020. 2020 Annual Report. Available online: https://corporate.walmart.com/media-library/document/2020-walmart-annual-report/_proxyDocument?id=00000171-a3ea-dfc0-af71-b3fea8490000#:~:text=Walmart%20U.S.%20had%20net%20sales,fiscal%202019%20and%202018%2C%20respectively (accessed on 25 August 2022).
- Wanasida, Albert Surya, Innocentius Bernarto, Niko Sudibjo, and Agus Purwanto. 2021. The role of business capabilities in supporting organization agility and performance during the COVID-19 pandemic: An empirical study in Indonesia. The Journal of Asian Finance, Economics and Business 8: 897–911. [Google Scholar]
- Wang, Wuting, Changhong Wang, Mengyang Li, Yifu Yu, and Bin Zhang. 2021. Performance Evaluation of Retail Enterprises Based on Principal Component Analysis. Modern Economy 12: 293. [Google Scholar] [CrossRef]
- Wright, Susan. 2017. A Case Study: Using The Dupont Approach For Formulating Managerial Decisions. Journal of Business Case Studies (JBCS) 13: 33–42. [Google Scholar] [CrossRef]
- Yu, Wenxuan, Abeer Hassan, and Mahalaxmi Adhikariparajuli. 2022. How Did Amazon Achieve CSR and Some Sustainable Development Goals (SDGs)—Climate Change, Circular Economy, Water Resources and Employee Rights during COVID-19? Journal of Risk and Financial Management 15: 364. [Google Scholar] [CrossRef]


| 31 December 2016 | 31 December 2017 | 31 December 2018 | 31 December 2019 | 31 December 2020 | |
|---|---|---|---|---|---|
| Current Assets | |||||
| Cash and Cash Equivalent | 19,334 | 20,522 | 31,750 | 36,092 | 42,122 |
| Marketable Securities | 6647 | 10,464 | 9500 | 18,929 | 42,274 |
| Inventories | 11,461 | 16,047 | 17,174 | 20,497 | 23,795 |
| Accounts Receivables | 8339 | 13,164 | 16,677 | 20,816 | 24,542 |
| Total Current Assets | 45,781 | 60,197 | 75,101 | 96,334 | 132,733 |
| Property and Equipment | 29,114 | 48,866 | 61,797 | 72,705 | 113,114 |
| Operating Leases | 25,141 | 37,553 | |||
| Goodwill | 3748 | 13,350 | 14,548 | 14,754 | 15,017 |
| Other Assets | 4723 | 8897 | 11,202 | 16,314 | 22,778 |
| Total Assets | 83,402 | 131,310 | 162,648 | 225,248 | 321,195 |
| Current Liabilities | |||||
| Accounts Payables | 25,309 | 34,616 | 38,192 | 47,183 | 72,539 |
| Accrued Expenses | 13,739 | 18,170 | 23,663 | 32,439 | 44,138 |
| Unearned Revenue | 4768 | 5097 | 6536 | 8190 | 9708 |
| Total Current Liabilities | 43,816 | 57,883 | 68,391 | 87,812 | 126,385 |
| Long-term Lease Liabilities | 9650 | 39,791 | 52,573 | ||
| Long-term Debt | 7694 | 24,743 | 23,495 | 23,414 | 31,816 |
| Other Long-term Liabilities | 12,607 | 20,975 | 17,563 | 12,171 | 17,017 |
| Treasury stock at cost | (1837) | (1837) | (1837) | (1837) | (1837) |
| Additional Paid-in Capital | 17,186 | 21,389 | 26,791 | 33,658 | 42,865 |
| Accumulated other comprehensive loss | (985) | (484) | (1035) | (986) | (180) |
| Retained Earnings | 4916 | 8636 | 19,625 | 31,220 | 52,551 |
| Total Shareholder’s Equity | 19,825 | 27,709 | 43,549 | 62,060 | 93,404 |
| Total Liabilities and Shareholders’ Equity | 83,402 | 131,310 | 162,648 | 225,248 | 321,195 |
| 31 December 2016 | 31 December 2017 | 31 December 2018 | 31 December 2019 | 31 December 2020 | |
|---|---|---|---|---|---|
| Net Product Sales | 94,665 | 118,573 | 141,915 | 160,408 | 215,915 |
| Net Service Sales | 41,332 | 59,293 | 90,972 | 120,114 | 170,149 |
| Total Net Sales | 135,987 | 177,866 | 232,887 | 280,522 | 386,064 |
| Operating Expenses | |||||
| Cost of Sales | 88,265 | 111,934 | 139,156 | 165,536 | 233,307 |
| Fulfillment | 17,619 | 25,249 | 34,027 | 40,232 | 58,517 |
| Marketing | 7233 | 10,069 | 13,814 | 18,878 | 22,008 |
| Technology and content | 16,085 | 22,620 | 28,837 | 35,931 | 42,470 |
| General and Administrative Expenses | 2432 | 3674 | 4336 | 5203 | 6668 |
| Other Operating Expenses | 167 | 214 | 296 | 201 | (75) |
| Total Operating Expenses | 131,801 | 173,760 | 220,466 | 265,981 | 363,165 |
| Operating income | 4186 | 4106 | 12,421 | 14,541 | 22,899 |
| Interest income | 100 | 202 | 440 | 832 | 555 |
| Interest expenses | (484) | (848) | (1417) | (1600) | (1647) |
| Other income/(expenses) | 90 | 346 | (183) | 203 | 2371 |
| Total non-operating income/(expenses) | (294) | (300) | (1160) | (565) | 1279 |
| Income before tax | 3892 | 3806 | 11,261 | 13,976 | 24,178 |
| Provision for income tax | (1425) | (769) | (1197) | (2374) | (2863) |
| Equity-method Investment activity | (96) | (4) | 9 | (14) | 16 |
| Net income | 2371 | 3033 | 10,073 | 11,588 | 22,331 |
| Other comprehensive income/(loss) | (262) | 501 | (547) | 49 | 806 |
| Comprehensive income | 2109 | 3534 | 9526 | 11,637 | 22,137 |
| Item/Year | 2016 | 2017 | 2018 | 2019 | 2020 |
|---|---|---|---|---|---|
| Cost of Sales/Total net sales | 64.91% | 62.93% | 59.75% | 59.00% | 60.43% |
| Marketing expenses/Total net sales | 5.32% | 5.66% | 5.93% | 6.72% | 5.60% |
| Administrative cost/total net sales | 13.62% | 14.78% | 14.24% | 14.66% | 12.79% |
| Net income/total net sales | 1.74% | 1.71% | 4.32% | 4.13% | 5.50% |
| 31 December 2016 | 31 December 2017 | 31 December 2018 | 31 December 2019 | 31 December 2020 | |
|---|---|---|---|---|---|
| Cash and cash equivalent, Beginning of the period | 15,890 | 19,334 | 21,856 | 32,173 | 36,410 |
| Operating activities | |||||
| Net income | 2371 | 3033 | 10,073 | 11,588 | 21,331 |
| Adjustments to reconcile net income to net cash from operating activities | |||||
| Depreciation of Property and equipment | 8116 | 11,478 | 15,341 | 21,789 | 25,251 |
| Stock-based compensation | 2975 | 4215 | 5418 | 6864 | 9208 |
| Other operating expenses | 160 | 202 | 274 | 164 | (71) |
| Other expenses/(income) | (20) | (292) | 219 | (249) | (2582) |
| Deferred income tax | (246) | (29) | 441 | 796 | (554) |
| Changes in other assets and liabilities | |||||
| Inventories | (1426) | (3583) | (1314) | 3278 | 2849 |
| Accounts receivables | (3367) | (4786) | (4615) | (7681) | (8169) |
| Accounts payable | 5030 | 7175 | 3263 | 8193 | 17,480 |
| Accrued expenses and other | 1724 | 283 | 472 | (1383) | 5754 |
| Unearned revenue | 1955 | 738 | 1151 | 1711 | 1265 |
| Net cash provided by (used in) operating activities | 17,272 | 18,434 | 30,723 | 38,514 | 66,064 |
| Investing activities | |||||
| Purchase of property and equipment | (7804) | (11,955) | (13,427) | (16,861) | (40,140) |
| Proceeds from property and equipment incentives | 1067 | 1897 | 2104 | 4172 | 5096 |
| Acquisitions, net of cash acquired | (116) | (13,972) | (2186) | (2461) | (2325) |
| Sales and maturities of marketable securities | 4733 | 9988 | 8240 | 22,681 | 50,237 |
| Purchase of marketable securities | (7756) | (13,777) | (7100) | (31,812) | (72,479) |
| Net cash provided by (used in) investing activities | (9876) | (27,819) | (12,369) | (24,281) | (59,611) |
| Financing activities | |||||
| Proceeds from short-terms debts and other | 886 | 1402 | 6796 | ||
| Repayments of short-term debts and others | (813) | (1518) | (6177) | ||
| Proceeds from long-term debts | 618 | 16,228 | 182 | 871 | 10,525 |
| Repayment of long-terms debts | (327) | (1301) | (155) | (1166) | (1553) |
| Principals of repayment of finance leases | (147) | (200) | (7449) | (9628) | (10,642) |
| Principal repayments of financing obligation | (3860) | (4799) | (337) | (27) | (53) |
| Net cash provided by (used in) financing activities | (3716) | 9928 | (7686) | (10,066) | (1104) |
| 31 January 2016 (USD m) | 31 January 2017 (USD m) | Amazon 31 January 2018 (USD m) | 31 January 2019 (USD m) | 31 January 2020 (USD m) | Walmart 31 January 2016 (USD m) | 31 January 2017 (USD m) | 31 January 2018 (USD m) | 31 January 2019 (USD m) 31 January 2020 (USD m) | |
|---|---|---|---|---|---|---|---|---|---|
| Statements of Operations | |||||||||
| Net Sales | 135,987 | 177,866 | 232,887 | 280,522 | 386,064 | 478,614 | 481,317 | 495,761 | 510,329 519,926 |
| Operating Income (loss) | 4186 | 4106 | 12,421 | 14,541 | 22,899 | 24,105 | 22,764 | 20,437 | 21,957 20,568 |
| Net Income/(loss) | 2371 | 3033 | 10,073 | 11,588 | 21,331 | 14,694 | 13,643 | 9862 | 6670 14,881 |
| Diluted earnings per share | 4.90 | 6.15 | 20.14 | 23.01 | 41.83 | 4.57 | 4.38 | 3.28 | 2.26 5.19 |
| Balance Sheets | |||||||||
| Total Assets | 83,402 | 131,310 | 162,648 | 225,248 | 321,195 | 199,581 | 198,825 | 204,522 | 219,295 236,495 |
| Long-term Liabilities | 20,301 | 45,718 | 50,708 | 75,376 | 101,406 | 44,030 | 42,018 | 36,825 | 50,203 64,192 |
| Amazon | Walmart | |||||||||
|---|---|---|---|---|---|---|---|---|---|---|
| Item/Year | 2016 | 2017 | 2018 | 2019 | 2020 | 2016 | 2017 | 2018 | 2019 | 2020 |
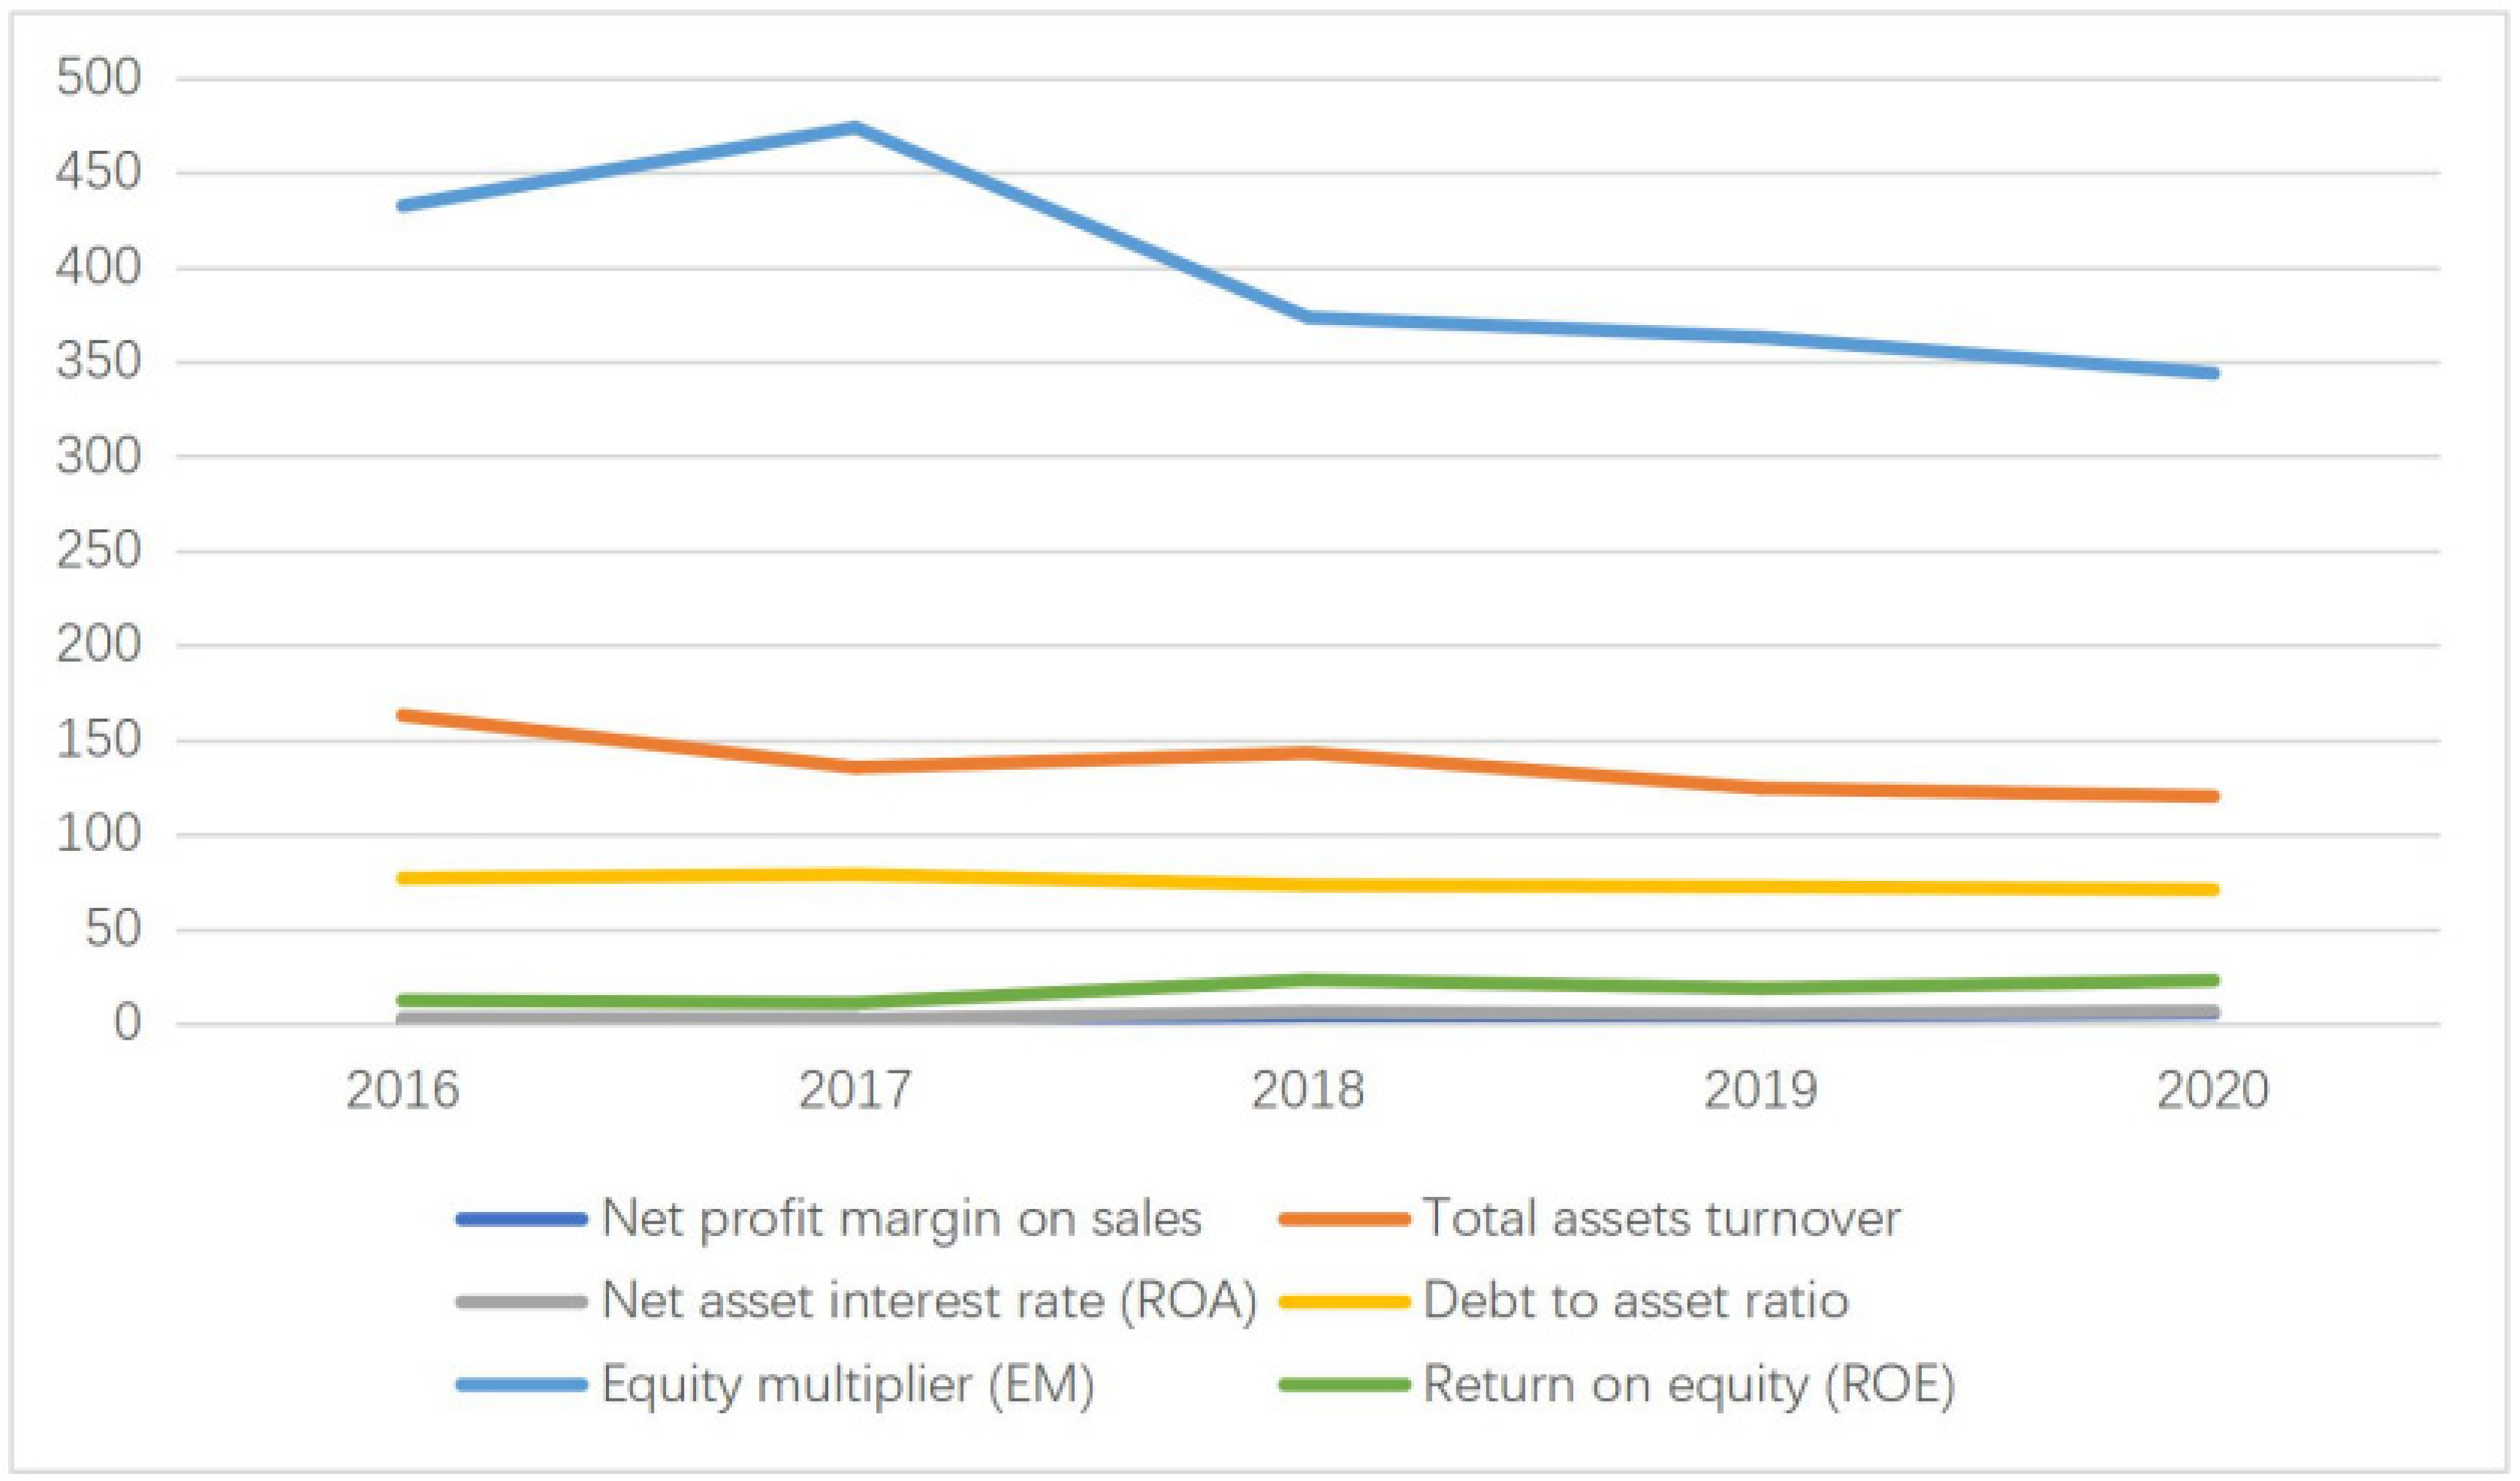
| ROA (net profit/Total average assets | 2.84% | 2.31% | 6.19% | 5.14% | 7.8% | 7.31% | 7.22% | 5.23% | 3.41% | 6.72% |
| ROE (net sales interest rate × total assets turnover rate × equity multiplier | 12.29% | 10.94% | 23.13% | 18.87% | 27.09% | 17.90% | 17.17% | 12.53% | 8.57% | 19.08% |
| EM (total assets/total shareholders’ equity) | 4.32 | 4.73 | 3.73 | 3.63 | 3.82 | 2.48 | 2.56 | 2.63 | 3.02 | 3.17 |
Publisher’s Note: MDPI stays neutral with regard to jurisdictional claims in published maps and institutional affiliations. |
© 2022 by the authors. Licensee MDPI, Basel, Switzerland. This article is an open access article distributed under the terms and conditions of the Creative Commons Attribution (CC BY) license (https://creativecommons.org/licenses/by/4.0/).
Share and Cite
Qin, Z.; Hassan, A.; Adhikariparajuli, M. Direct and Indirect Implications of the COVID-19 Pandemic on Amazon’s Financial Situation. J. Risk Financial Manag. 2022, 15, 414. https://doi.org/10.3390/jrfm15090414
Qin Z, Hassan A, Adhikariparajuli M. Direct and Indirect Implications of the COVID-19 Pandemic on Amazon’s Financial Situation. Journal of Risk and Financial Management. 2022; 15(9):414. https://doi.org/10.3390/jrfm15090414
Chicago/Turabian StyleQin, Zixuan, Abeer Hassan, and Mahalaxmi Adhikariparajuli. 2022. "Direct and Indirect Implications of the COVID-19 Pandemic on Amazon’s Financial Situation" Journal of Risk and Financial Management 15, no. 9: 414. https://doi.org/10.3390/jrfm15090414