
Neighborhood Effect on Elderly Depression in Republic of Korea
Abstract
:1. Introduction
2. Materials and Methods
2.1. Data
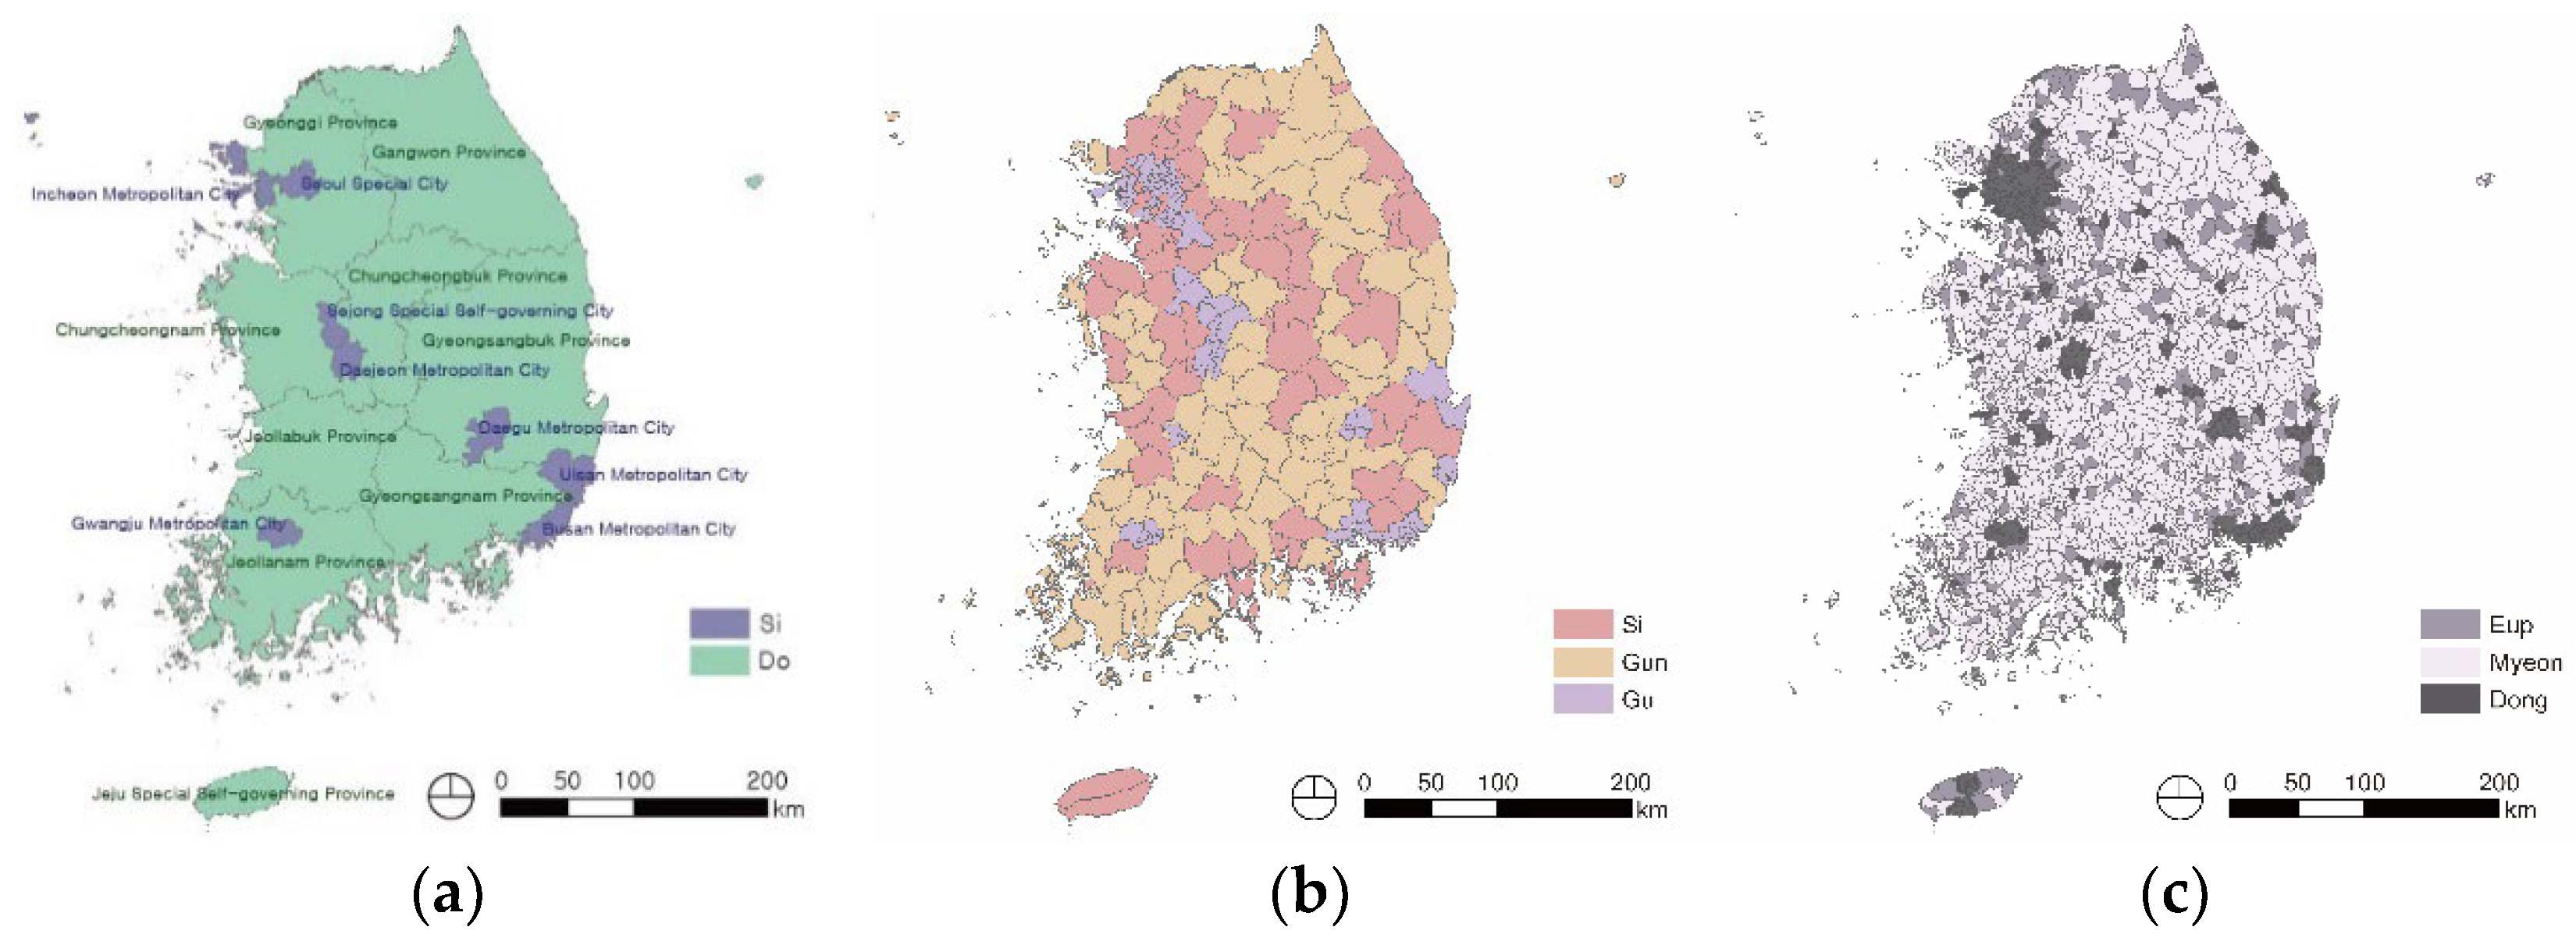
2.2. Study Area
2.3. Statistical Analysis
3. Results
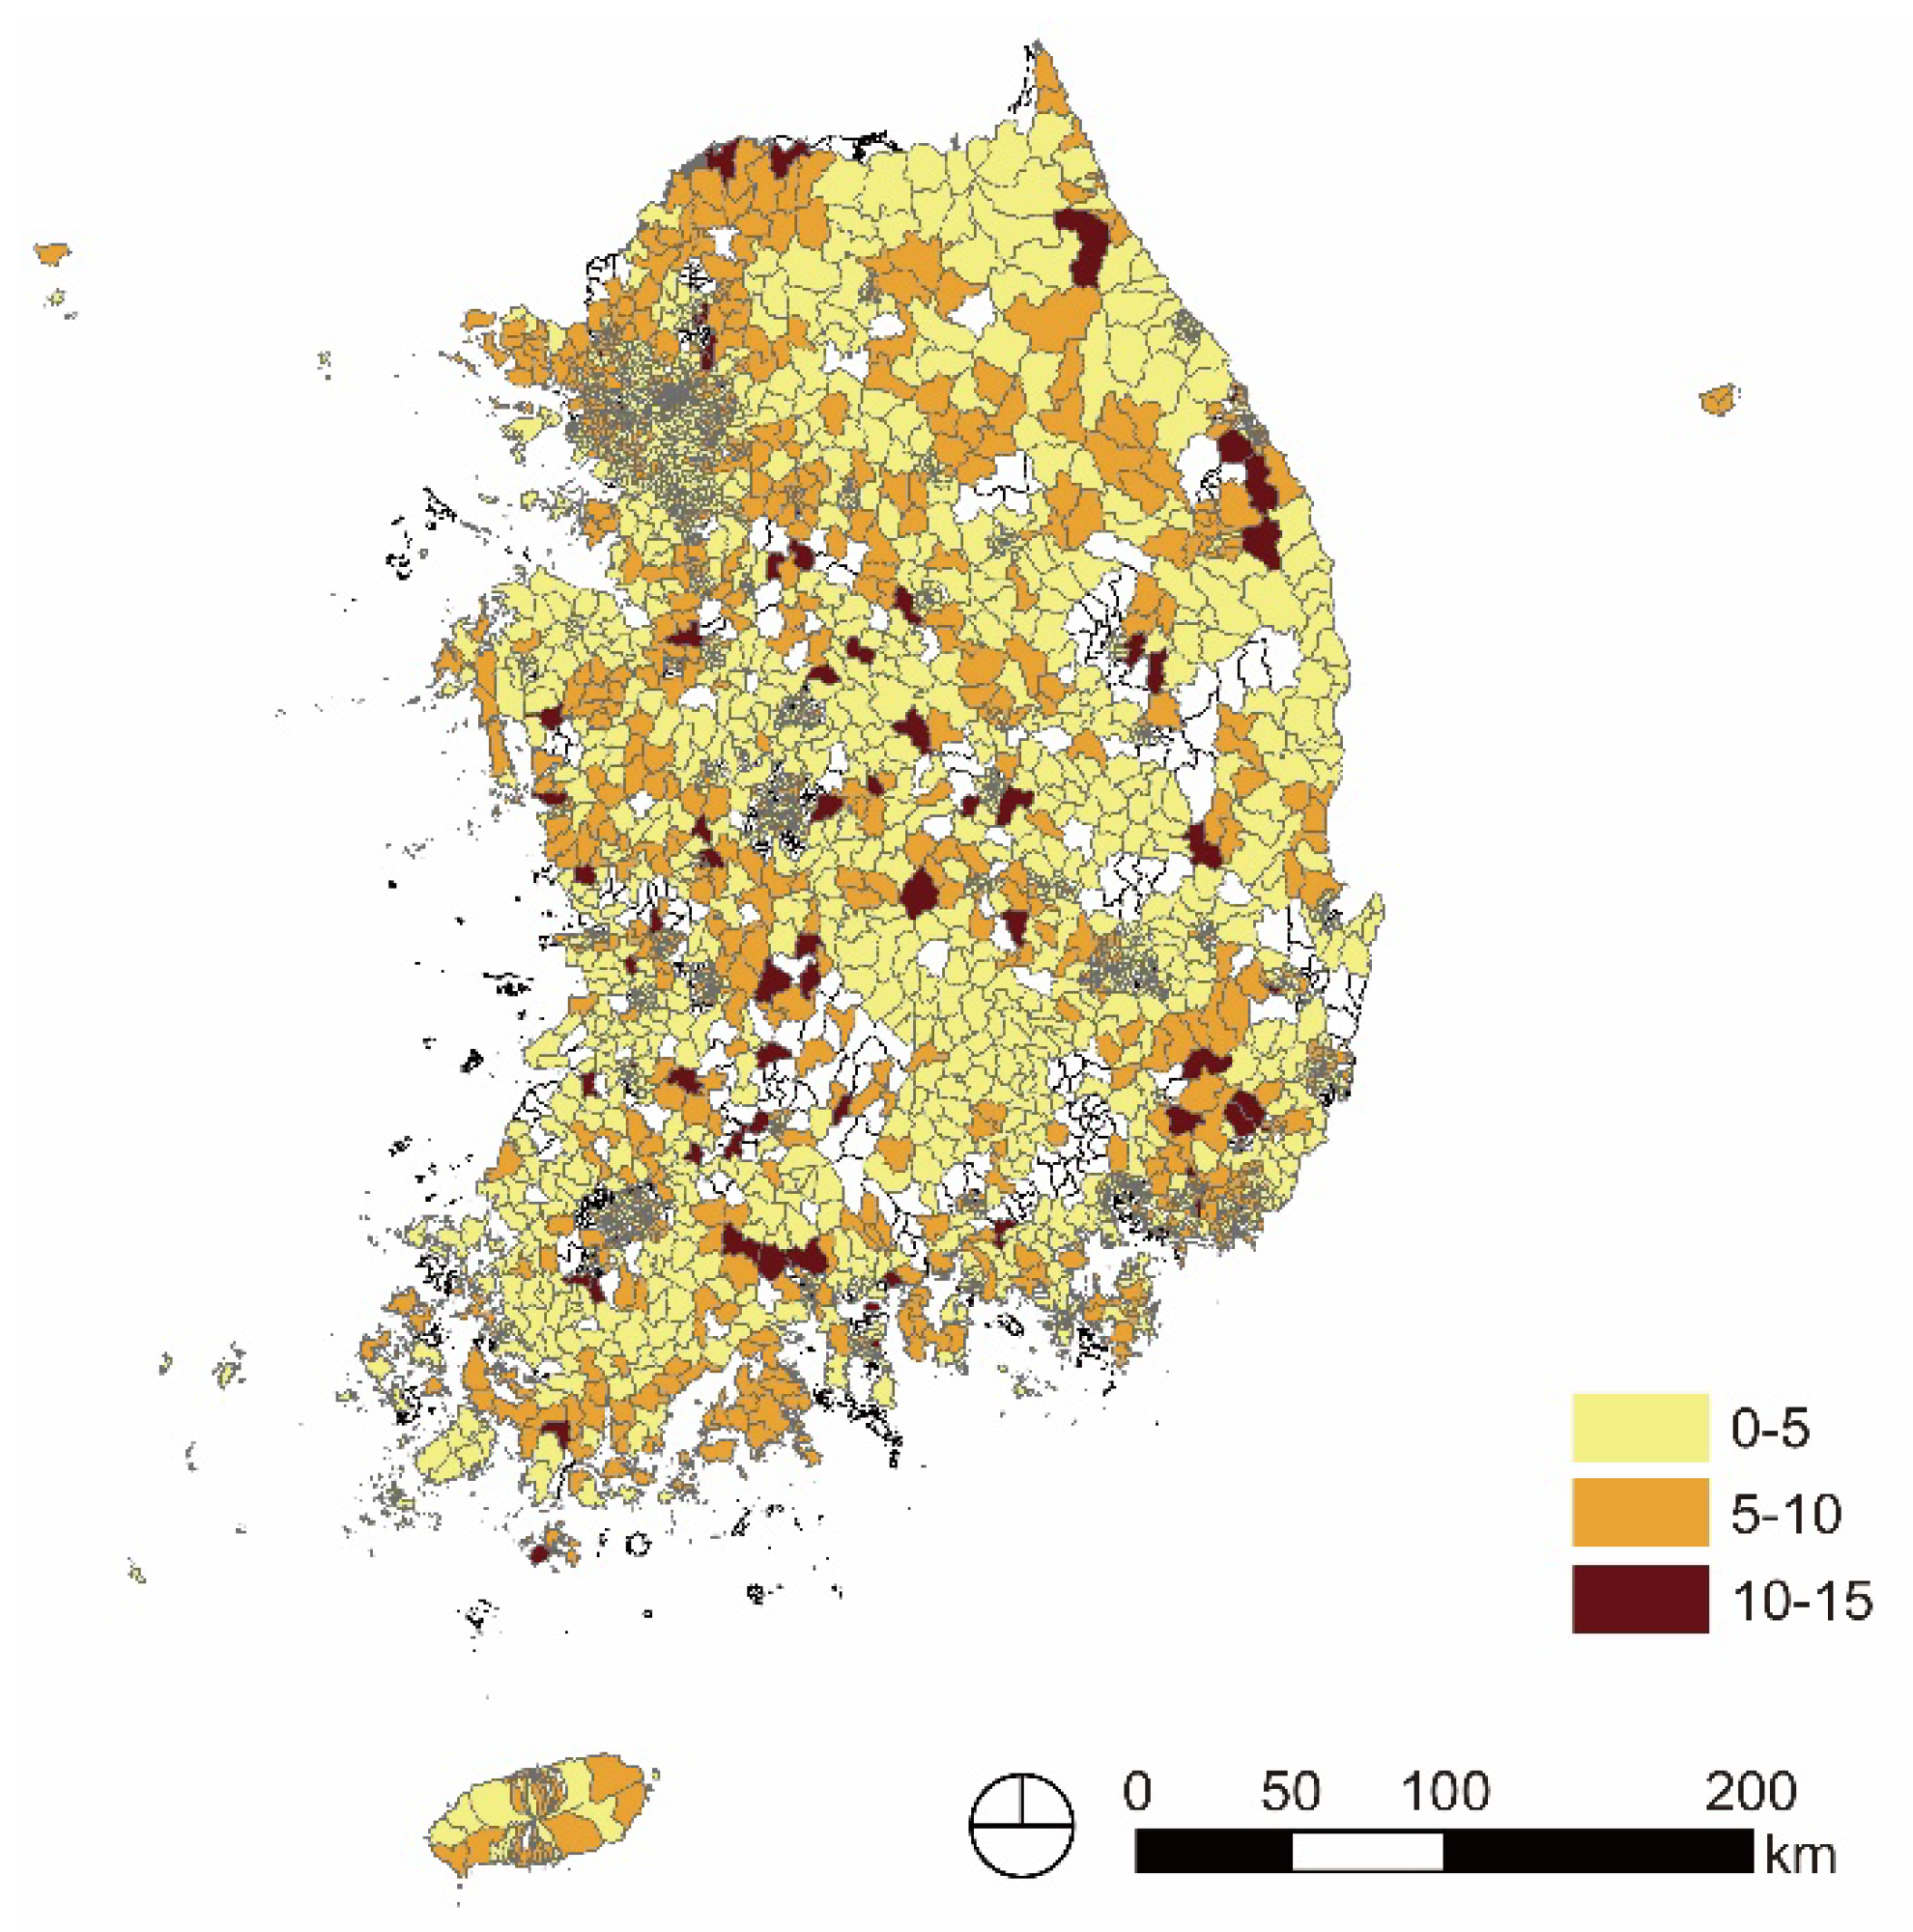
3.1. Depression Level of Vulnerable Older Adults by Region in Republic of Korea
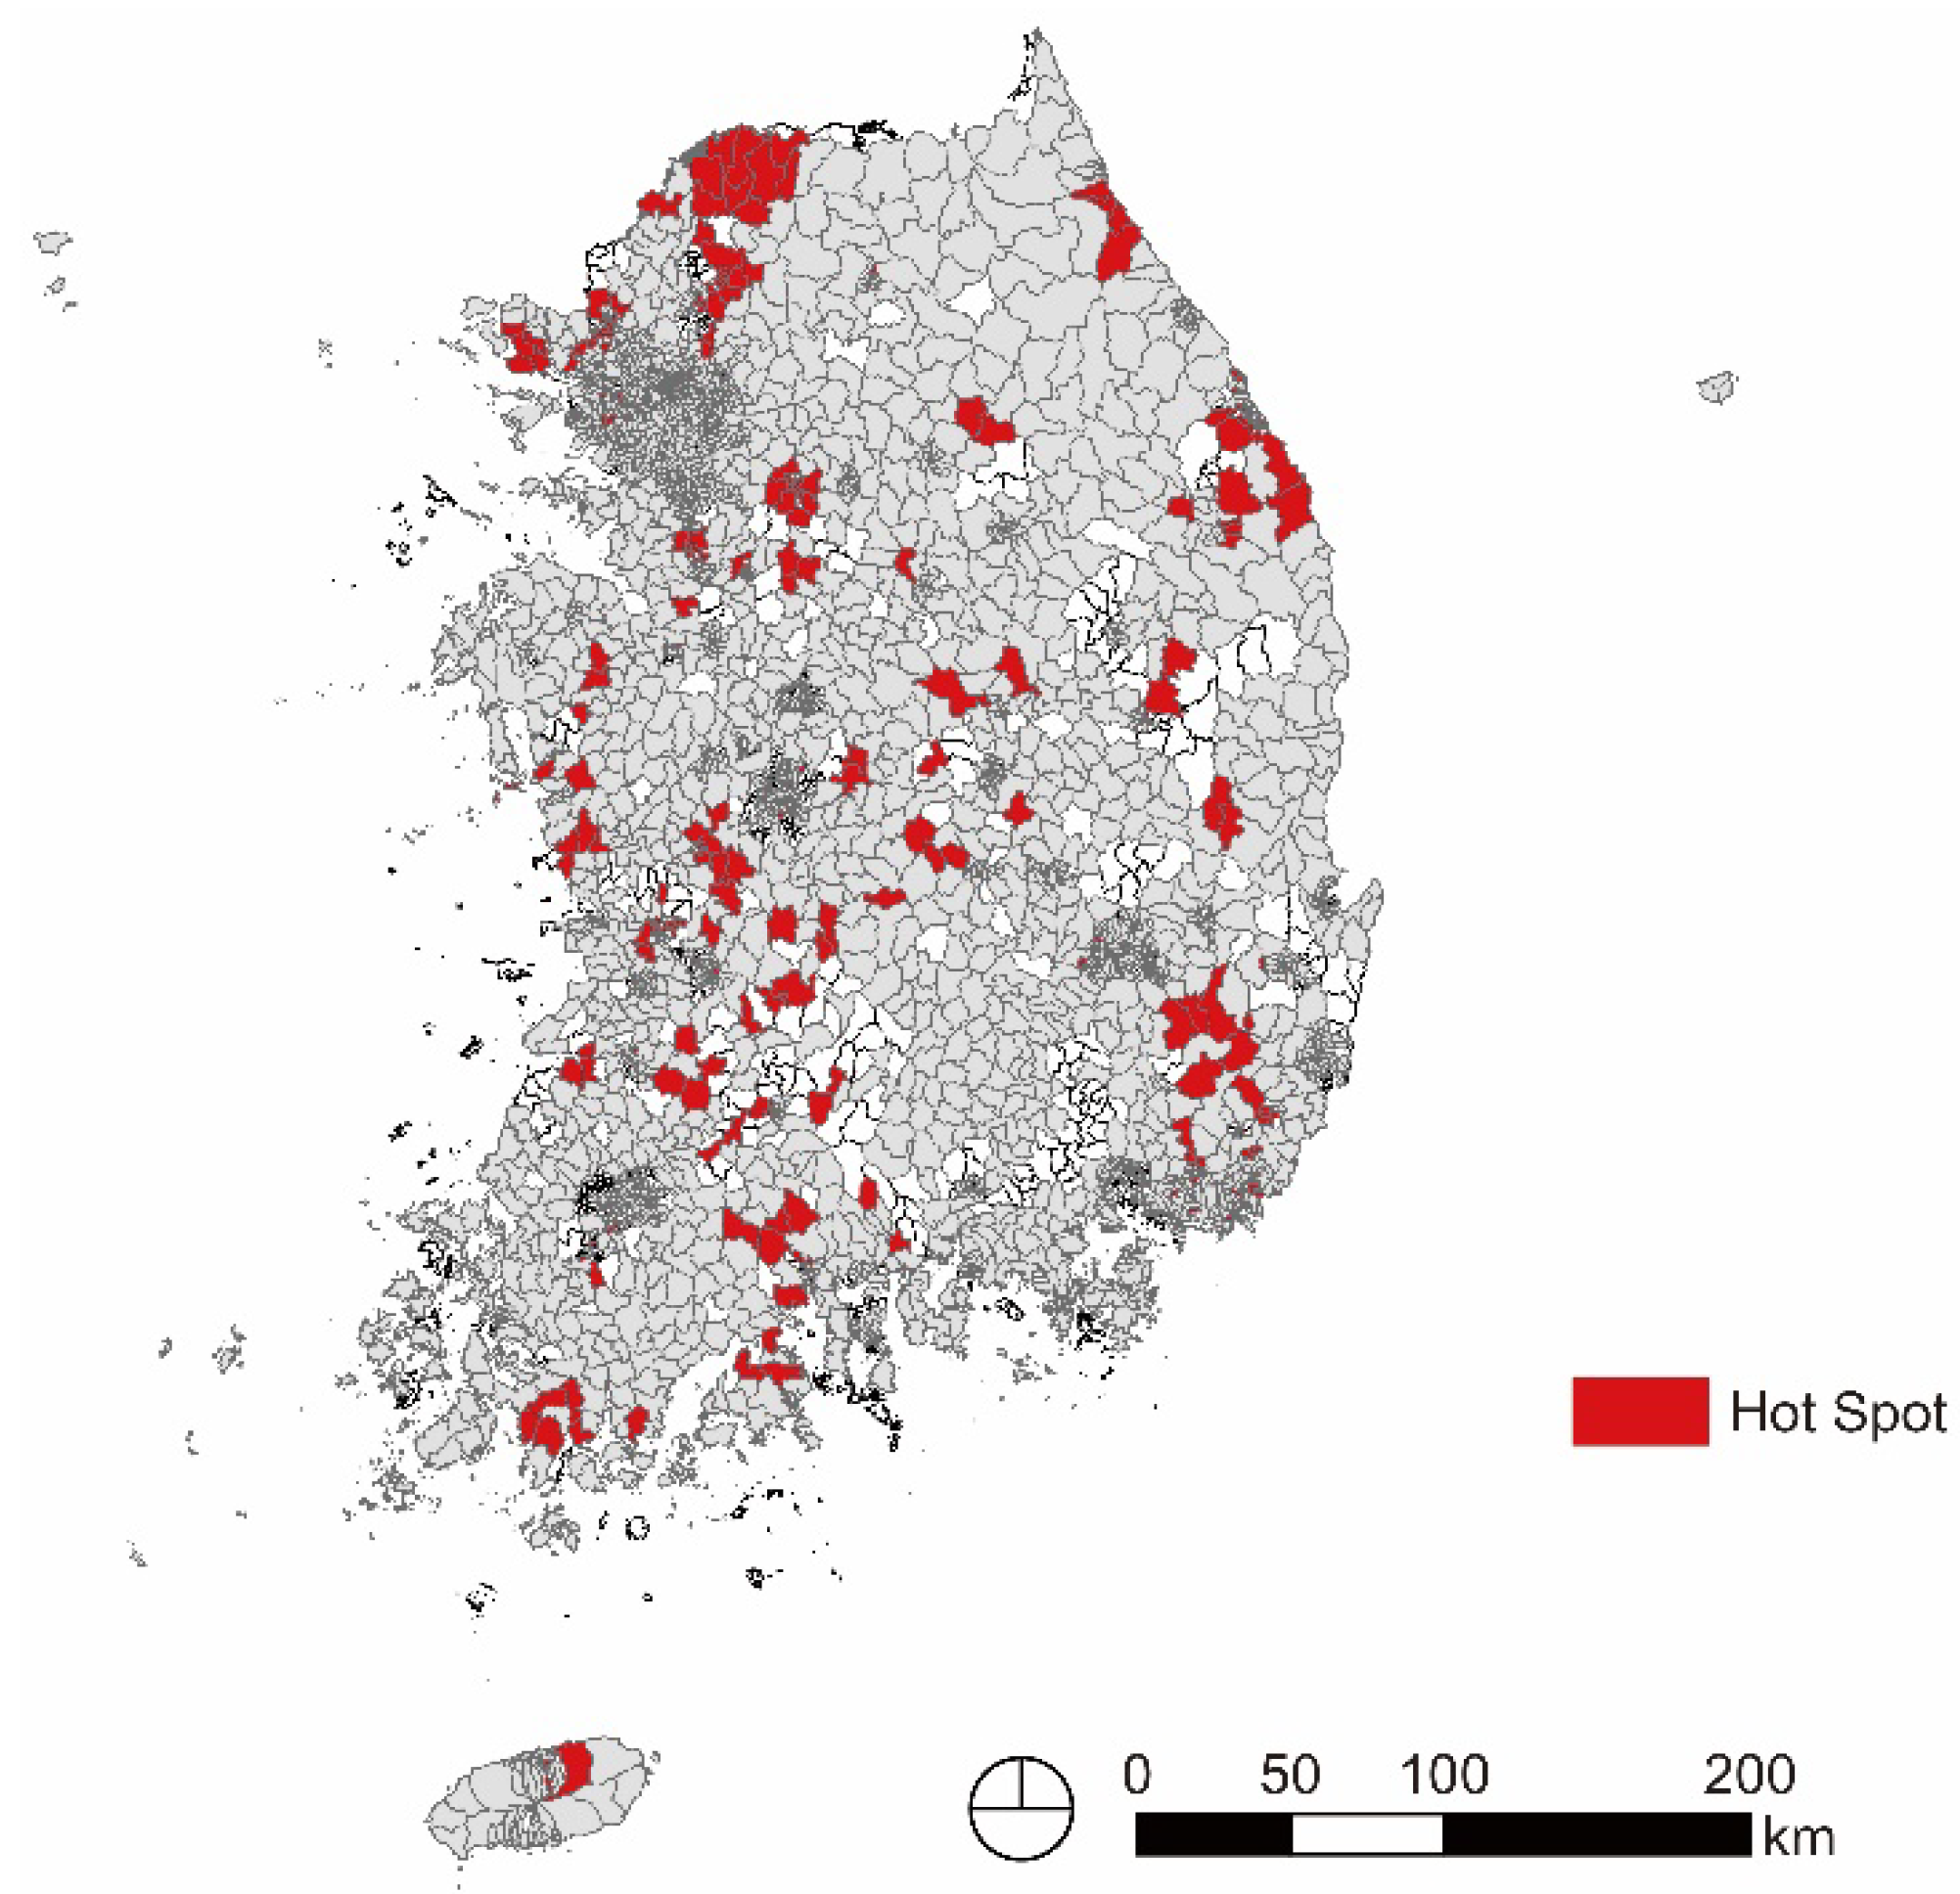
3.2. Spatial Patterns of Older Adults’ Depression in Republic of Korea
3.3. Environmental Characteristics of Areas Where Older Adult Depression Is Concentrated
4. Conclusions
Author Contributions
Funding
Informed Consent Statement
Data Availability Statement
Conflicts of Interest
References
- United Nations Department of Economic and Social Affairs. World Population Ageing 2020 Highlights: Living Arrangements of Older Persons; United Nations Publication: New York, NY, USA, 2021; pp. 1–2.
- Statistics Korea. Available online: http://kostat.go.kr/portal/korea/kor_nw/1/1/index.board?bmode=read&aSeq=385322 (accessed on 1 July 2021).
- Hur, J.S.; Yoo, S.H. Determinants of depression among elderly persons. Ment. Health Soc. Work 2002, 13, 7–22. [Google Scholar]
- Lee, I.S.; Kim, S.W. A study on factors influencing depression of medicaid recipients: Focus on social support. Korean J. Gerontol. Soc. Welf. 2005, 29, 285–308. [Google Scholar]
- Kim, D.B.; Sohn, E.S. A meta-analysis of the variables related to depression in elderly. J. Korean Gerontol. Soc. 2005, 25, 167–187. [Google Scholar]
- Jeong, J.H. The factors influencing the life satisfaction and depression between urban and rural elderly. J. Korean Inst. Inter. Des. 2012, 21, 121–128. [Google Scholar]
- Chang, S. Geological accessibility and mental health of urban elderly: Mediation effect of social participation. J. Korean Hous. Assoc. 2017, 28, 11–19. [Google Scholar] [CrossRef]
- Kim, J.H. A study for relationship between depression and chronic musculoskeletal pain in elderly by Geriatric Depression Scale. J. Korea Gerontol. Soc. 1998, 18, 90–102. [Google Scholar]
- Lee, S.A.; Lee, G.M. A study on the major factors influencing the depression among the elderly in rural area. J. Korea Gerontol. Soc. 2002, 22, 209–226. [Google Scholar]
- Yang, S.; Rim, C.S.; Oh, Y.J. A relative effect of Related-Variables on Depression of the Rural Elderly. Korean J. Gerontol. Soc. Welf. 2007, 36, 139–158. Available online: https://www.kci.go.kr/kciportal/ci/sereArticleSearch/ciSereArtiView.kci?sereArticleSearchBean.artiId=ART001065781 (accessed on 28 November 2022).
- Choi, M.Y. An empirical study of the effects of neighborhoods and social capital on elderly people depression. Korean J. Soc. Welf. Res. 2008, 18, 25–46. [Google Scholar]
- Yoon, M.S.; Lee, M.S. A Study on the Effects of Depression on Life Satisfaction and the Mediating Effect of Self-Esteem of Elderly Women. J. Commun. Welf. 2011, 36, 89–115. [Google Scholar]
- National Health Insurance Service. 2021 National Health Screening Statistical Yearbook; National Health Insurance Service: Wonju, Republic of Korea, 2022; pp. 172–175.
- Kim, D.B.; Yoo, B.S. A Study on the Neighborhood Environment, Social Relationship and Depression of the Elderly: In Case of Seoul Metropolitan Area. J. Korean Geronto. Soc. 2013, 33, 105–123. [Google Scholar]
- Choi, J.I. Neighborhood Effect on Depressive Symptoms among Older Adults in Busan Metropolitan City. Ph.D. Dissertation, Dong-eui University, Busan, Republic of Korea, 2016. [Google Scholar]
- Ko, J.E. The Neighborhood Effect on Depressive Symptoms Among Older Korean Adults in Seoul. Ph.D. Dissertation, Chung Ang University, Seoul, Republic of Korea, 2012. [Google Scholar]
- Kim, Y.S.; Suh, K.H. Living Arrangement, Satisfaction with Living, end Depression among the Korean Elderly. Korean J. Gerontol. Soc. Welf. 2002, 18, 273–290. [Google Scholar]
- Schulz, R.; Drayer, R.A.; Rollman, B.L. Depression as a risk factor for non-suicide mortality in the elderly. Biol. Psychiatry 2002, 52, 205–225. [Google Scholar] [CrossRef] [PubMed]
- Waerna, W.; Ruenowitzb, E.; Wihelmsonb, K. Predictors of suicide in the old elderly. Gerontology 2003, 49, 328–334. [Google Scholar] [CrossRef] [PubMed]
- Bae, J.Y.; Rho, B.I.; Kwak, H.K.; Yoo, H.S. An Exploratory Study on Social Exclusion and Depression of the Elderly. Korean J. Gerontol. Soc. Welf. 2006, 33, 7–27. [Google Scholar]
- Kim, K.T.; Choi, S.S.; Park, M.J. Effect of Psychosocial Resources in the relation between the Elderly’s Stress and Depression. Korean J. Gerontol. Soc. Welf. 2007, 36, 91–111. Available online: https://www.kci.go.kr/kciportal/ci/sereArticleSearch/ciSereArtiView.kci?sereArticleSearchBean.artiId=ART001065779 (accessed on 28 November 2022).
- Lee, I.J. Sex Differences in the Effects of Psychosocial Factors on Depression and Life satisfaction of Older Persons. Korean J. Gerontol. Soc. Welf. 2007, 36, 159–179. Available online: https://www.kci.go.kr/kciportal/ci/sereArticleSearch/ciSereArtiView.kci?sereArticleSearchBean.artiId=ART001065782 (accessed on 28 November 2022).
- Bazargan, M.; Hamm-Baugh, V.P. The Relationship between chronic illness and Depression in a Community of Urban Black Elderly Persons. J. Gerontol. B Psychol. Sci. Soc. Sci. 1995, 50B, S119–S127. [Google Scholar] [CrossRef] [Green Version]
- Alexopoulos, G.S. Depression in the elderly. Lancet 2005, 365, 4–10. [Google Scholar] [CrossRef]
- Djernes, J.K. Prevalence and predictors of depression in populations of elderly: A review. Acta Psychiatr. Scand. 2006, 113, 372–387. [Google Scholar] [CrossRef]
- Steffens, D.C.; Fisher, G.G.; Langa, K.M.; Potter, G.G.; Plassman, B.L. Prevalence of depression among older Americans: The Aging, Demographics and Memory Study. Int. Psychogeriatr. 2009, 21, 879–888. [Google Scholar] [CrossRef] [PubMed]
- Domènech-Abella, J.; Mundó, J.; Leonardi, M.; Chatterji, S.; Tobiasz-Adamczyk, B.; Koskinen, S.; Ayuso-Mateos, J.; Haro, J.M.; Olaya, B. Loneliness and depression among older European adults: The role of perceived neighborhood built environment. Health Place 2020, 62, 102280. [Google Scholar] [CrossRef] [PubMed]
- Sokale, I.O.; Conway, S.H.; Douphrate, D.I. Built Environment and Its Association with Depression among Older Adults: A Systematic Review. Open Public Health J. 2022, 15, e187494452202030. [Google Scholar] [CrossRef]
- Moussavi, S.; Chatterji, S.; Verdes, E.; Tandon, A.; Patel, V.; Ustun, B. Depression, chronic diseases, and decrements in health: Results from the World Health Surveys. Lancet 2007, 370, 851–858. [Google Scholar] [CrossRef] [PubMed]
- Zhang, Y.; Chen, Y.; Ma, L. Depression and cardiovascular disease in elderly: Current understanding. J. Clin. Neurol. 2018, 47, 1–5. [Google Scholar] [CrossRef] [PubMed]
- Kukull, W.A.; Koepsell, T.D.; Borson, I.S.; Okimoto, J.; Raskind, M.A.; Gale, J.L. Depression and physical illness among elderly general medical clinic patients. J. Affect. Disord. 1986, 10, 153–162. [Google Scholar] [CrossRef] [PubMed]
- Cummings, J.L.; Masterman, D.L. Depression in patients with Parkinson’s disease. Int. J. Geriatr. Psychiatry. 1999, 14, 711–718. [Google Scholar] [CrossRef]
- Kim, S.; Cho, S.; Morgan, M.R. Neighborhood and Depressive Symptoms in Older Adults Living in Rural and Urban Regions in Republic of Korea. Healthcare 2023, 11, 476. [Google Scholar] [CrossRef]
- Jung, E.; Chai, C.; Moon, H.; Song, N.K. The effect of Physical Environment on the depressive symptom of Middle-aged and Older adults: Focusing on the Mediating effects of Social Capital and Sense of Coherence. Korean J. Soc. Welf. Stud. 2018, 49, 181–209. [Google Scholar] [CrossRef]
- Koo, B.M.; Lim, Y.; Chai, C.G. The effect of the home environment on the relationship among walking limitation, disability and depression of older people. J. Korean Gerontol. Soc. 2020, 40, 543–563. [Google Scholar] [CrossRef]
- Jeon, B.J. A Short-term Longitudinal Study of Depression and Life Satisfaction of the Elderly: Focusing on Living Arrangement. J. Korean Geront. Soc. 2017, 37, 853–870. [Google Scholar]
- Kim, Y.J. Influences of Physical Neighborhood Environments on Elderly‘s Social Network. J. Archit. Inst. Korea Plan. Des. 2016, 32, 91–97. [Google Scholar] [CrossRef]
- Lee, S.R.; Park, I.K. The Effect of Settlement Inclusivity on Older People’s Mental Health. J. Korean Reg. Sci. Assoc. 2020, 36, 3–23. [Google Scholar] [CrossRef]
- Lawton, M.P. The impact of environment on aging and behaviour. In Handbook of the Psychology of Aging; Birren, J.E., Schaie, K.W., Eds.; Van Nostrand Reinhold: New York, NY, USA, 1977; pp. 276–301. [Google Scholar]
- Elreedy, S.; Krieger, N.; Ryan, P.B.; Sparrow, D.; Weiss, S.T.; Hu, H. Relations between individual and neighborhood-based measures of socioeconomic position and bone lead concentrations among community-exposed men. Am. J. Epidemiol. 1999, 150, 129–141. [Google Scholar] [CrossRef] [PubMed] [Green Version]
- Kim, Y.J.; Ahn, K.H. Influences of Neighborhoods Physical Environments on Physical and Mental Health to the Elderly. J. Urban Des. Inst. Korea 2011, 12, 89–99. [Google Scholar]
- Tobler, W. A computer movie simulating urban growth in the Detroit region. Econ. Geogr. 1970, 46, 234–240. [Google Scholar] [CrossRef]
- Sheikh, J.I.; Yesavage, J.A. Geriatric Depression Scale (GDS): Recent evidence and development of a shorter version. J. Aging Ment. Health 1986, 5, 165–173. [Google Scholar] [CrossRef]
- Hair, J.F.; Black, W.C. Cluster analysis. In Reading and Understanding More Multivariate Statistics.; Grim, L.G., Yarnold, P.R., Eds.; Psychological Association: Washington, DC, USA, 2000; pp. 147–205. [Google Scholar]
- Park, I.K.; Lee, M.; Hong, Z.; Lim, I.S. A Typology of Korean Cities Based on Urban Inclusivity—Evaluation and Characterization by Type. J. Korean Urban Manag. Assoc. 2017, 30, 111–130. [Google Scholar] [CrossRef]
- Seo, I.; Kee, Y.; Lee, S.J. A Study on the Exploratory Typology of Regional Communities via Community Wellbeing Indicators. Korean J. Public Adm. 2016, 25, 49–75. [Google Scholar]
- Lee, Y.Y. A Study on Regional Classification through Regional Characteristics Analysis—Focused on 31 Cities in Gyeonggi Province. J. Resid. Environ. Inst. Korea 2014, 12, 129–143. [Google Scholar]
- Kim, D. Blues from the Neighborhood? Neighborhood Characteristics and Depression. Epidemiol. Rev. 2008, 30, 101–117. [Google Scholar] [CrossRef] [PubMed] [Green Version]


| Group | Number of Respondents | Depression Level | ||
|---|---|---|---|---|
| Mean | Standard Deviation | |||
| Sex | Male | 137,463 | 4.36 | 3.25 |
| Female | 397,135 | 4.64 | 3.18 | |
| Age | 60s | 68,124 | 4.17 | 3.44 |
| 70s | 281,371 | 4.50 | 3.17 | |
| 80s | 167,747 | 4.79 | 3.12 | |
| Over 90s | 17,356 | 5.09 | 3.21 | |
| Total | 534,598 | 4.57 | 3.20 | |
| Depression Level | 0–5 | 6–9 | 10–15 | Total |
|---|---|---|---|---|
| Number of respondents | 376,793 (70.48%) | 114,683 (21.45%) | 43,122 (8.07%) | 534,598 (100.00%) |
| Spatial Units | Number of Spatial Units | Depression Level | |
|---|---|---|---|
| Mean | Standard Deviation | ||
| Eup and Myeon | 1180 | 4.97 | 2.64 |
| Dong | 2934 | 4.68 | 2.20 |
| Total | 4114 | 4.77 | 2.34 |
| Depression Level | ≥0 and ≤5 | >5 and <10 | ≥10 and ≤15 | Total |
|---|---|---|---|---|
| Number of spatial units | 2522 (61.30%) | 1458 (35.44%) | 134 (3.26%) | 4114 (100.00%) |
| Province and Metropolitan City | Average Level of Older Adults Depression | Number of Eup, Myeon, and Dongs with a Depression Score of 10 or More | Total Number of Eup, Myeon, and Dongs | |||
|---|---|---|---|---|---|---|
| Mean | St. Dev | N | % | N | % | |
| Seoul Special City | 4.59 | 1.54 | 3 | 0.75 | 400 | 100.00 |
| Busan Metropolitan City | 4.57 | 2.46 | 4 | 2.17 | 184 | 100.00 |
| Daegu Metropolitan City | 5.05 | 2.21 | 3 | 1.85 | 162 | 100.00 |
| Gwangju Metropolitan City | 5.00 | 2.22 | 5 | 4.10 | 122 | 100.00 |
| Incheon Metropolitan City | 5.23 | 1.42 | 0 | 0.00 | 142 | 100.00 |
| Daejeon Metropolitan City | 4.80 | 1.98 | 1 | 0.86 | 116 | 100.00 |
| Ulsan Metropolitan City | 4.99 | 1.16 | 0 | 0.00 | 68 | 100.00 |
| Sejong Special Self–governing City | 4.48 | 1.28 | 0 | 0.00 | 15 | 100.00 |
| Gyeonggi Province | 5.13 | 2.07 | 19 | 2.90 | 656 | 100.00 |
| Gangwon Province | 4.73 | 2.71 | 9 | 3.50 | 257 | 100.00 |
| Chungcheongnam Province | 4.63 | 2.48 | 11 | 4.37 | 252 | 100.00 |
| Chungcheongbuk Province | 4.15 | 2.31 | 9 | 4.57 | 197 | 100.00 |
| Jeollanam Province | 4.75 | 3.22 | 22 | 6.85 | 321 | 100.00 |
| Jeollabuk Province | 4.89 | 3.07 | 21 | 6.84 | 307 | 100.00 |
| Gyeongsangnam Province | 4.81 | 2.13 | 13 | 3.16 | 412 | 100.00 |
| Gyeongsangbuk Province | 4.26 | 2.29 | 13 | 3.00 | 433 | 100.00 |
| Jeju Special Self–governing Province | 5.52 | 1.25 | 1 | 1.43 | 70 | 100.00 |
| Total | 4.77 | 2.34 | 134 | 3.26 | 4114 | 100.00 |
| Province and Metropolitan City | Number of Eup, Myeon, and Dongs Defined as a Hot Spot | Total Number of Eup, Myeon, and Dongs | ||
|---|---|---|---|---|
| N | % | N | % | |
| Seoul Special City | 5 | 1.25 | 400 | 100.00 |
| Busan Metropolitan City | 12 | 6.52 | 184 | 100.00 |
| Daegu Metropolitan City | 13 | 8.02 | 162 | 100.00 |
| Gwangju Metropolitan City | 6 | 4.92 | 122 | 100.00 |
| Incheon Metropolitan City | 8 | 5.63 | 142 | 100.00 |
| Daejeon Metropolitan City | 5 | 4.31 | 116 | 100.00 |
| Ulsan Metropolitan City | 2 | 2.94 | 68 | 100.00 |
| Sejong Special Self–governing City | 0 | 0.00 | 15 | 100.00 |
| Gyeonggi Province | 75 | 11.43 | 656 | 100.00 |
| Gangwon Province | 32 | 12.45 | 257 | 100.00 |
| Chungcheongnam Province | 23 | 9.13 | 252 | 100.00 |
| Chungcheongbuk Province | 8 | 4.06 | 197 | 100.00 |
| Jeollanam Province | 32 | 9.97 | 321 | 100.00 |
| Jeollabuk Province | 52 | 16.94 | 307 | 100.00 |
| Gyeongsangnam Province | 19 | 4.61 | 412 | 100.00 |
| Gyeongsangbuk Province | 19 | 4.39 | 433 | 100.00 |
| Jeju Special Self–governing Province | 2 | 2.86 | 70 | 100.00 |
| Total | 313 | 7.61 | 4114 | 100.00 |
| Spatial Units | Number of Eup, Myeon, and Dongs Defined as a Hot Spot | Total Number of Eup, Myeon, and Dongs | |
|---|---|---|---|
| N | % | N | |
| Urban areas | 45 | 4.06 | 1109 |
| Urban-rural complex areas | 209 | 8.89 | 2352 |
| Rural areas | 59 | 9.04 | 653 |
| Total | 313 | 7.61 | 4114 |
| Spatial Units | Number of Eup, Myeon, and Dongs Defined as a Hot Spot | Total Number of Eup, Myeon, and Dongs | |
|---|---|---|---|
| N | % | N | |
| Large cities | 74 | 3.94 | 1878 |
| Small- and medium-sized cities | 180 | 11.37 | 1583 |
| Rural areas | 59 | 9.04 | 653 |
| Total | 313 | 7.61 | 4114 |
| Cluster | City Including Hot Spots | Number of Hot Spots | |
|---|---|---|---|
| City Type | City Name | ||
| Type 1 | Large cities | Seoul Special city, Gwangju Metropolitan city, Daegu Metropolitan city, Daejeon Metropolitan city, Busan Metropolitan city, Ulsan Metropolitan city, Goyang-Si, Changwon-Si, Pohang-Si | 42 |
| Small- and medium-sized cities | Donghae-Si, Samcheok-Si, Chuncheon-Si, Taebaek-Si, Bucheon-Si, Yangju-Si, Icheon-Si, Pyeongtaek-Si, Pocheon-Si, Gyeongju-Si, Mungyeong-Si, Andong-Si, Naju-Si, Mokpo-Si, Suncheon-Si, Namwon-Si, Iksan-Si, Jeongeup-Si, Jeju-Si, Nonsan-Si, Asan-Si, Jeonju-Si | 123 | |
| Rural areas | Namyangju-Si, Jeongseon-Gun, Cheorwon-Gun, Yeoncheon-Gun | 5 | |
| Type 2 | Large cities | Daegu Metropolitan city, Busan Metropolitan city, Incheon Metropolitan city | 6 |
| Small- and medium-sized cities | Pyeongtaek-Si, Pocheon-Si, Gimhae-Si, Iksan-Si, Jeonju-Si | 9 | |
| Rural areas | Gimpo-Si, Namyangju-Si, Icheon-Si, Paju-Si, Haenam-Gun, Wanju-Gun, Hongseong-Gun | 7 | |
| Type 3 | Large cities | Daegu Metropolitan city, Busan Metropolitan city | 2 |
| Small- and medium-sized cities | 0 | ||
| Rural areas | Samcheok-Si, Anseong-Si, Icheon-Si, Paju-Si, Pyeongtaek-Si, Pocheon-Si, Gimhae-Si, Miryang-Si, Yangsan-Si, Gumi-Si, Gimcheon-Si, Mungyeong-Si, Sangju-Si, Andong-Si, Naju-Si, Suncheon-Si, Gimje-Si, Namwon-Si, Iksan-Si, Jeongeup-Si, Jeju-Si, Nonsan-Si, Boryeong-Si, Asan-Si, Chungju-Si, Yangyang-Gun, Cheorwon-Gun, Hoengseong-Gun, Yeoncheon-Gun, Hadong-Gun, Cheongdo-Gun, Cheongsong-Gun, Ulju-Gun, Ganghwa-Gun, Goheung-Gun, Gokseong-Gun, Haenam-Gun, Gochang-Gun, Muju-Gun, Buan-Gun, Sunchang-Gun, Wanju-Gun, Imsil-Gun, Jinan-Gun, Buyeo-Gun, Seocheon-Gun, Yesan-Gun, Boeun-Gun, Yeongdong-Gun, Okcheon-Gun, Eumseong-Gun, Jincheon-Gun | 116 | |
| Variables | MST | df | MSE | df | F | p-Value |
|---|---|---|---|---|---|---|
| Average Slope | 21.255 | 2 | 0.871 | 307 | 24.405 | 0.000 |
| Number of Subway Line | 18.993 | 2 | 0.734 | 307 | 25.864 | 0.000 |
| Road Ratio | 106.779 | 2 | 0.319 | 307 | 334.696 | 0.000 |
| Number of Traditional Markets | 24.614 | 2 | 0.716 | 307 | 34.380 | 0.000 |
| Number of Hypermarkets | 3.509 | 2 | 0.127 | 307 | 27.623 | 0.000 |
| Number of convenience Stores | 60.714 | 2 | 0.458 | 307 | 132.674 | 0.000 |
| Number of Parks | 45.048 | 2 | 0.680 | 307 | 66.213 | 0.000 |
| Number of Senior Community Centers | 100.479 | 2 | 0.311 | 307 | 323.511 | 0.000 |
| Number of Senior Welfare Centers | 10.777 | 2 | 0.755 | 307 | 14.277 | 0.000 |
| Number of Health Centers | 19.284 | 2 | 0.826 | 307 | 23.356 | 0.000 |
| Number of General Hospitals | 18.707 | 2 | 0.655 | 307 | 28.554 | 0.000 |
| Number of Clinics | 20.330 | 2 | 0.336 | 307 | 60.488 | 0.000 |
| Population | 55.602 | 2 | 0.348 | 307 | 159.782 | 0.000 |
| Aged Population Ratio | 45.813 | 2 | 0.705 | 307 | 65.018 | 0.000 |
| Percentage of Buildings over 20 Years | 67.974 | 2 | 0.457 | 307 | 148.831 | 0.000 |
Disclaimer/Publisher’s Note: The statements, opinions and data contained in all publications are solely those of the individual author(s) and contributor(s) and not of MDPI and/or the editor(s). MDPI and/or the editor(s) disclaim responsibility for any injury to people or property resulting from any ideas, methods, instructions or products referred to in the content. |
© 2023 by the authors. Licensee MDPI, Basel, Switzerland. This article is an open access article distributed under the terms and conditions of the Creative Commons Attribution (CC BY) license (https://creativecommons.org/licenses/by/4.0/).
Share and Cite
Hwang, J.-H.; Kim, Y.-J. Neighborhood Effect on Elderly Depression in Republic of Korea. Int. J. Environ. Res. Public Health 2023, 20, 5200. https://doi.org/10.3390/ijerph20065200
Hwang J-H, Kim Y-J. Neighborhood Effect on Elderly Depression in Republic of Korea. International Journal of Environmental Research and Public Health. 2023; 20(6):5200. https://doi.org/10.3390/ijerph20065200
Chicago/Turabian StyleHwang, Ji-Hyon, and Yong-Jin Kim. 2023. "Neighborhood Effect on Elderly Depression in Republic of Korea" International Journal of Environmental Research and Public Health 20, no. 6: 5200. https://doi.org/10.3390/ijerph20065200