
Household Dietary Diversity among Households with and without Children with Disabilities in Three Low-Income Communities in Lusaka, Zambia

Abstract
:1. Introduction
2. Materials and Methods
2.1. Participants
2.2. Measures
2.3. Analysis
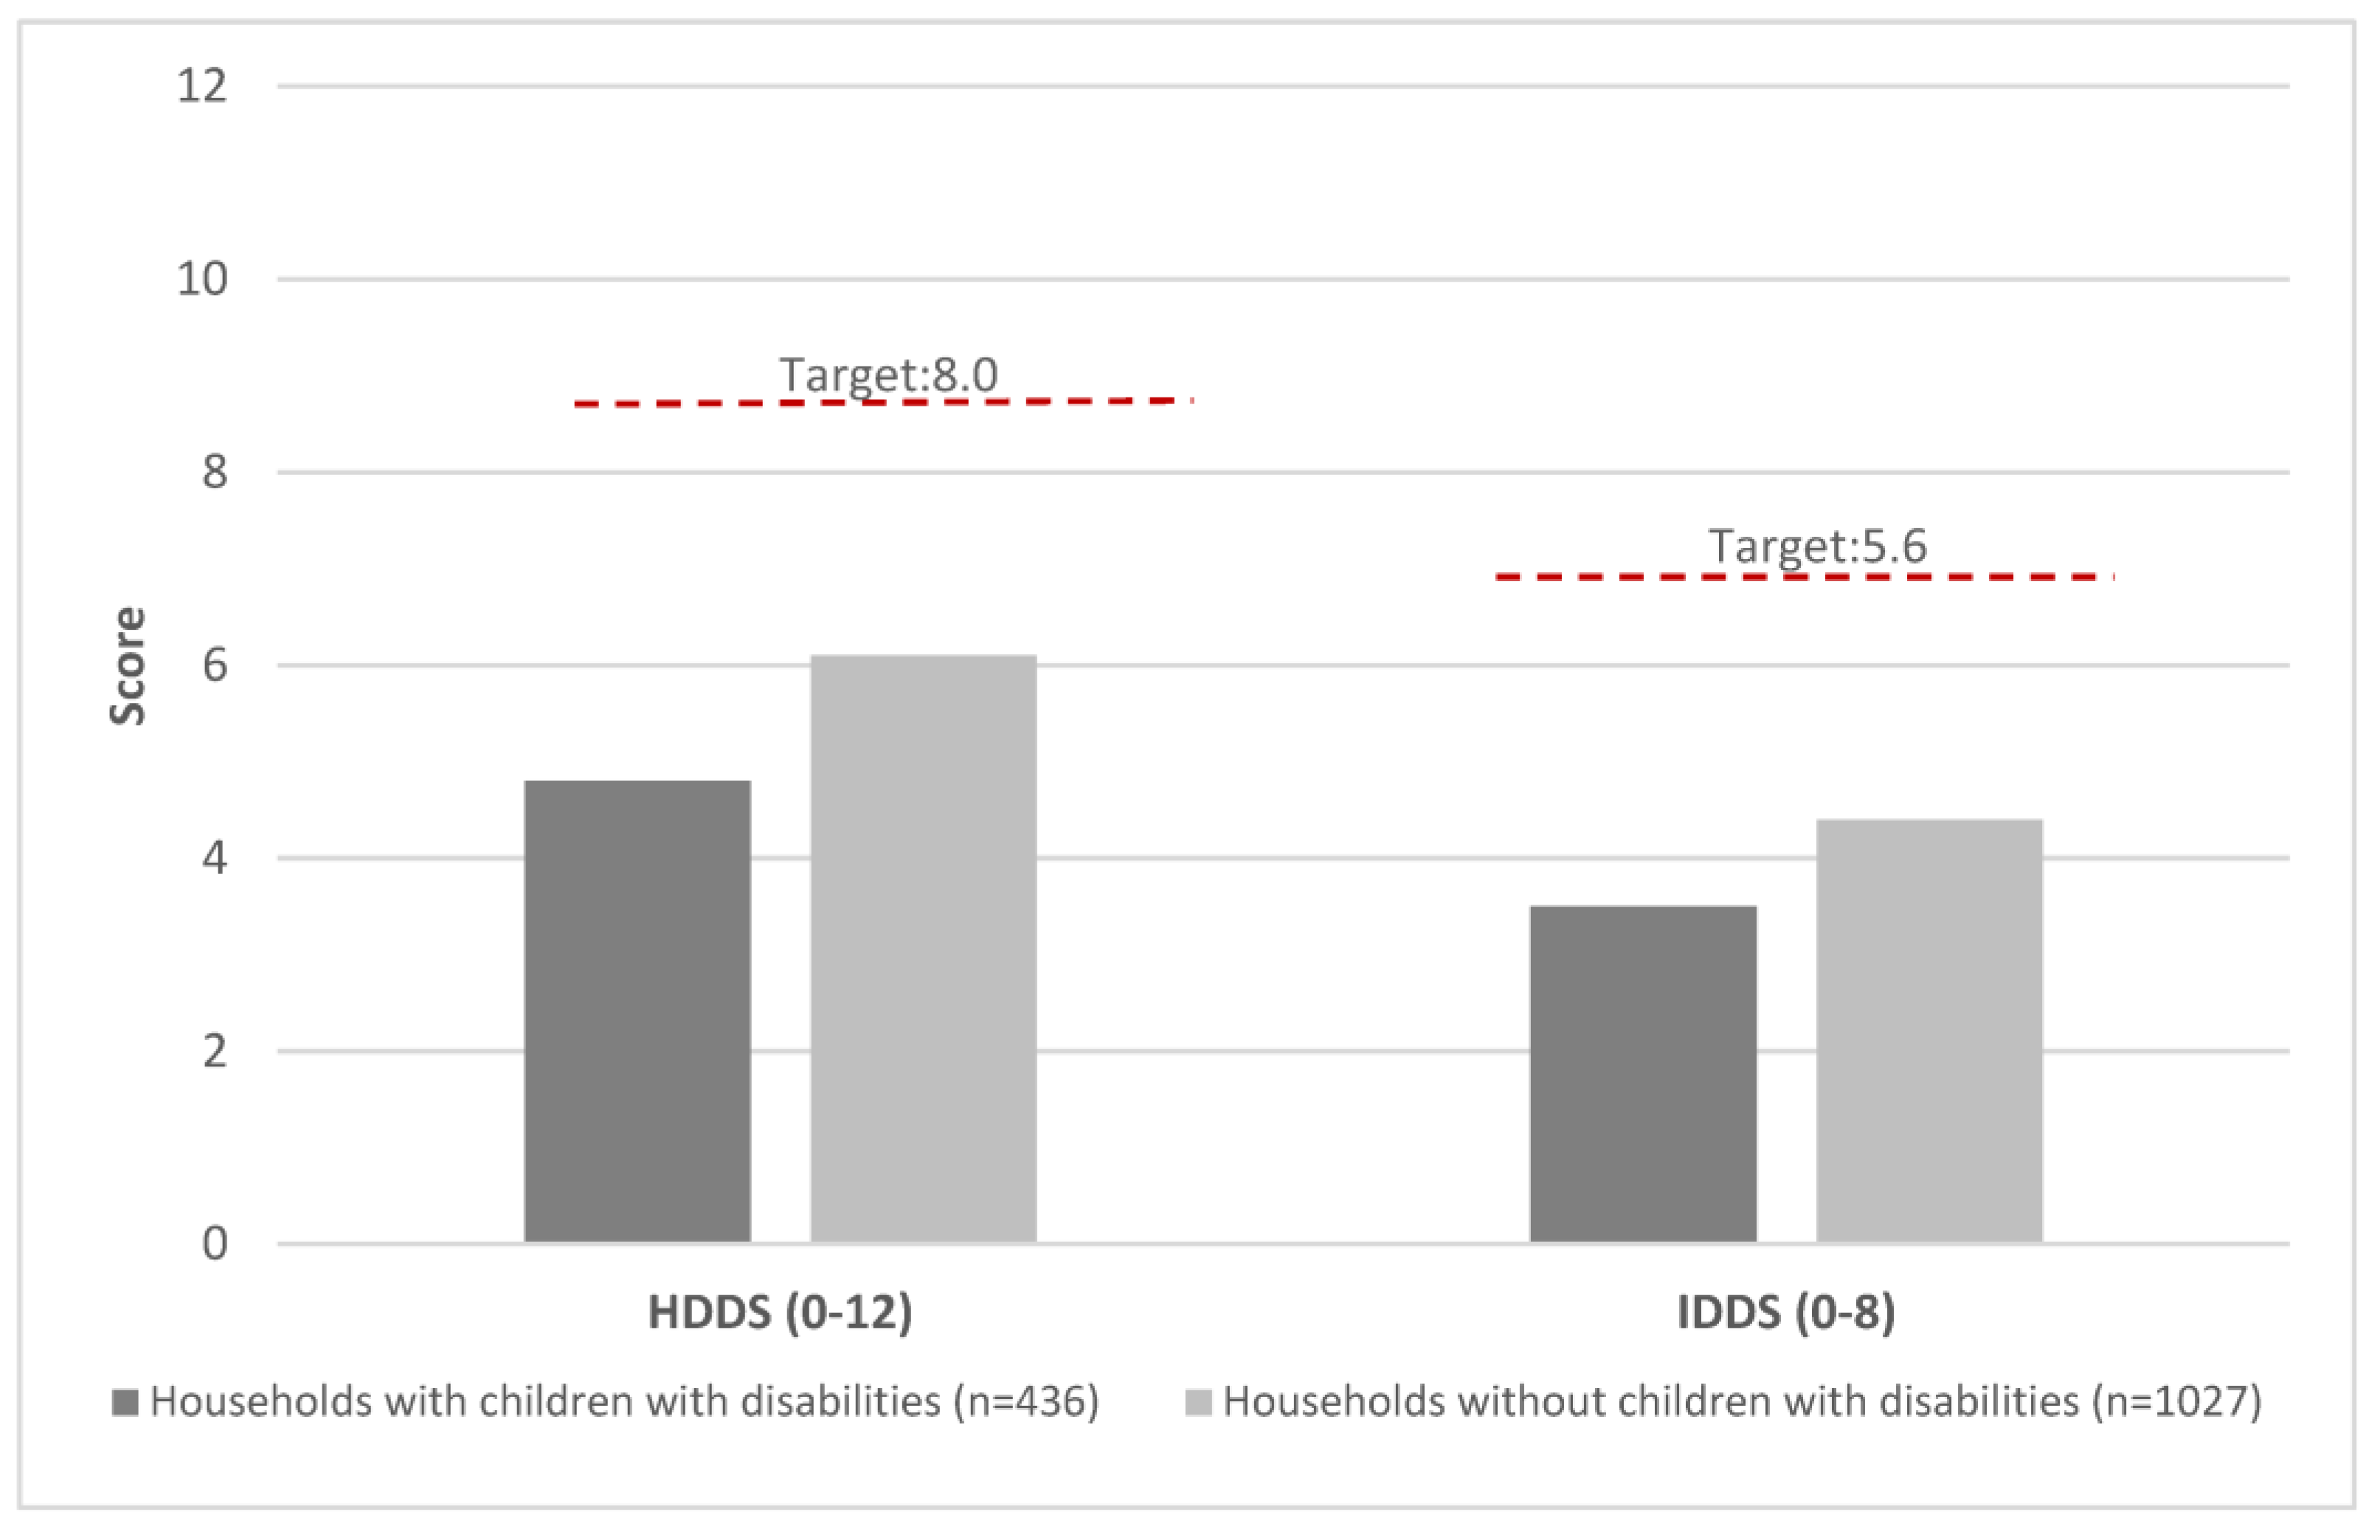
3. Results
4. Discussion
5. Conclusions
Author Contributions
Funding
Institutional Review Board Statement
Informed Consent Statement
Data Availability Statement
Acknowledgments
Conflicts of Interest
References
- Arimond, M.; Ruel, M.T. Dietary Diversity Is Associated with Child Nutritional Status: Evidence from 11 Demographic and Health Surveys. J. Nutr. 2004, 134, 2579–2585. [Google Scholar] [CrossRef] [Green Version]
- Marinda, P.A.; Genschick, S.; Khayeka-Wandabwa, C.; Kiwanuka-Lubinda, R.; Thilsted, S.H. Dietary diversity determinants and contribution of fish to maternal and under-five nutritional status in Zambia. PLoS ONE 2018, 13, e0204009. [Google Scholar] [CrossRef]
- Lubungu, M.; Singogo, F.K. 2021 Zambia Food Security And Nutrition Report. Available online: https://www.iapri.org.zm/wp-content/uploads/2022/04/2021_Zambia_food_security_and_nutrition.pdf (accessed on 12 November 2021).
- HIVOX Southern Africa. How COVID-19 Has Affected the Food Diversification Agenda in Zambia: A Rapid Assessment Study Report; Hivos: The Hague, The Netherlands, 2020; Available online: https://hivos.org/assets/southern-africa/2020/09/COVID-19-and-its-effect-on-food-divervisification-in-Zambia.pdf (accessed on 1 December 2022).
- Gona, J.K.; Mung’ala-Odera, V.; Newton, C.R.; Hartley, S. Caring for children with disabilities in Kilifi, Kenya: What is the carer’s experience?: Caring for children with disabilities. Child Care Health Dev. 2011, 37, 175–183. [Google Scholar] [CrossRef] [Green Version]
- AbdAllah, A.M.; El-Sherbeny, S.S.; Khairy, S. Nutritional status of mentally disabled children in Egypt. Egypt. J. Hosp. Med. 2007, 29, 604–615. [Google Scholar] [CrossRef]
- Tüzün, E.H.; Güven, D.K.; Eker, L.; Elbasan, B.; Bülbül, S.F. Nutritional status of children with cerebral palsy in Turkey. Disabil. Rehabil. 2013, 35, 413–417. [Google Scholar] [CrossRef]
- Groce, N.; Challenger, E.; Berman-Bieler, R.; Farkas, A.; Yilmaz, N.; Schultink, W.; Clark, D.; Kaplan, C. Malnutrition and disability: Unexplored opportunities for collaboration. Paediatr. Int. Child Health 2014, 34, 308–314. [Google Scholar] [CrossRef] [Green Version]
- Adams, M.S.; Khan, N.Z.; Begum, S.A.; Wirz, S.L.; Hesketh, T.; Pring, T.R. Feeding difficulties in children with cerebral palsy: Low-cost caregiver training in Dhaka, Bangladesh: Management of feeding difficulties in Bangladesh. Child Care Health Dev. 2012, 38, 878–888. [Google Scholar] [CrossRef]
- Khamis, A.G.; Mwanri, A.W.; Ntwenya, J.E.; Kreppel, K. The influence of dietary diversity on the nutritional status of children between 6 and 23 months of age in Tanzania. BMC Pediatr. 2019, 19, 518. [Google Scholar] [CrossRef] [Green Version]
- UNICEF. Fed to Fail? The Crisis of Children’s Diets in Early Life; UNICEF: New York, NY, USA, 2021; Available online: https://www.unicef.org/media/107221/file/Fed%20to%20Fail%20-%20FULL%20REPORT%20-%20Child%20Nutrition%20Report%202021%20.pdf (accessed on 12 November 2021).
- Vilar-Compte, M.; Burrola-Méndez, S.; Lozano-Marrufo, A.; Ferré-Eguiluz, I.; Flores, D.; Gaitán-Rossi, P.; Teruel, G.; Pérez-Escamilla, R. Urban poverty and nutrition challenges associated with accessibility to a healthy diet: A global systematic literature review. Int. J. Equity Health 2021, 20, 40. [Google Scholar] [CrossRef] [PubMed]
- Swindale, A.; Blilinsky, P. Household Dieatry Diversity Score (HDDS) for Measurement of Household Food Access: Indicator Guide (v.2.); FANTA: Washington, DC, USA, 2006. [Google Scholar]
- Hearst, M.O.; Hughey, L.; Magoon, J.; Mubukwanu, E.; Ndonji, M.; Ngulube, E.; Makhoul, Z. Rapid health impact assessment of COVID-19 on families with children with disabilities living in low-income communities in Lusaka, Zambia. PLoS ONE 2021, 16, e0260486. [Google Scholar] [CrossRef]
- Chipimo, P.J.; Barradas, D.T.; Kayeyi, N.; Zulu, P.; Muzala, K.; Mazaba, M.; Hamoonga, R.; Musonda, K.; Monze, M.; Kapata, N.; et al. First 100 Persons with COVID-19—Zambia, March 18–April 28, 2020. MMWR Morb. Mortal Wkly Rep. 2020, 69, 1547–1548. [Google Scholar] [CrossRef]
- World Food Program. COVID-19 Rapid Food Security Vulnerability Impact Assessment Report: Conducted in Lusaka and Kafue Districts; World Food Program: Rome, Italy, 2020; Available online: https://reliefweb.int/sites/reliefweb.int/files/resources/WFP-0000118961.pdf (accessed on 14 December 2022).
- Hearst, M.O.; Adelli, R.; Hepperlen, R.; Biggs, J.; DeGracia, D.; Ngulube, E.; Maluskiku-Mwewa, B.; Johnson, D.E. Community-based intervention to reduce stigma for children with disabilities in Lusaka, Zambia: A pilot. Disabil. Rehabil. 2022, 44, 2295–2304. [Google Scholar] [CrossRef] [PubMed]
- Hepperlen, R.A.; Biggs, J.; Mwandileya, W.; Rabaey, P.; Ngulube, E.; Hearst, M.O. Using community-based interventions to reduce public stigma of children with disabilities: A feasibility study. J. Appl. Res. Intellect. Disabil. 2021, 34, 1499–1510. [Google Scholar] [CrossRef] [PubMed]
- Chanda, D. Life in Misisi Township. Times of Zambia, 17 February 2014. Available online: https://www.times.co.zm/?p=10253(accessed on 28 December 2022).
- Yambayamba, M.; Tembo, T. Kanyama Compound—“Me and My World”. Development Education.ie, 1 June 2007. Available online: https://developmenteducation.ie/gallery/kanyama-compound-me-and-my-world/(accessed on 28 December 2022).
- Hoddinott, J.; Yohannes, Y. Dietary Diversity as a Household Food Security Indicator; FANTA: Washington, DC, USA, 2002. [Google Scholar]
- Rao, S.; Yajnik, C.S.; Kanade, A.; Fall, C.H.D.; Margetts, B.M.; Jackson, A.; Shier, R.; Joshi, S.; Rege, S.; Lubree, H.; et al. Intake of Micronutrient-Rich Foods in Rural Indian Mothers Is Associated with the Size of Their Babies at Birth: Pune Maternal Nutrition Study. J. Nutr. 2001, 131, 1217–1224. [Google Scholar] [CrossRef] [Green Version]
- Hatløy, A.; Hallund, J.; Diarra, M.M.; Oshaug, A. Food variety, socioeconomic status and nutritional status in urban and rural areas in Koutiala (Mali). Public Health Nutr. 2000, 3, 57–65. [Google Scholar] [CrossRef] [Green Version]
- Sié, A.; Tapsoba, C.; Dah, C.; Ouermi, L.; Zabre, P.; Bärnighausen, T.; Arzika, A.; Lebas, E.; Snyder, B.; Moe, C.; et al. Dietary diversity and nutritional status among children in rural Burkina Faso. Int. Health 2018, 10, 157–162. [Google Scholar] [CrossRef]
- Bhargava, A.; Bouis, H.E.; Scrimshaw, N.S. Dietary Intakes and Socioeconomic Factors Are Associated with the Hemoglobin Concentration of Bangladeshi Women. J. Nutr. 2001, 131, 758–764. [Google Scholar] [CrossRef] [Green Version]
- Ganpule-Rao, A.V.; Bhat, D.; Yajnik, C.S.; Rush, E. Dietary diversity scores, nutrient intakes and biomarkers vitamin B12, folate and Hb in rural youth from the Pune Maternal Nutrition Study. Br. J. Nutr. 2021, 126, 236–243. [Google Scholar] [CrossRef]
- McDonald, C.M.; McLean, J.; Kroeun, H.; Talukder, A.; Lynd, L.D.; Green, T.J. Household food insecurity and dietary diversity as correlates of maternal and child undernutrition in rural Cambodia. Eur. J. Clin. Nutr. 2015, 69, 242–246. [Google Scholar] [CrossRef]
- Mulumbi, M. Eat with Us: Insight into Household Food Habits in a Time of Food Price Volatility in Zambian Communities. IDS Bull. 2015, 46, 53–59. [Google Scholar] [CrossRef]
- Kennedy, G.; Ballard, T.; Dop, M. Guidelines for Measuring Household and Individual Dietary Diversity; Nutrition and Consumer Protection Division, Food and Agriculture Organization of the United Nations: Rome, Italy, 2011; Available online: https://www.fao.org/fileadmin/user_upload/wa_workshop/docs/FAO-guidelines-dietary-diversity2011.pdf (accessed on 14 December 2022).
- Banks, L.M.; Kuper, H.; Polack, S. Poverty and disability in low- and middle-income countries: A systematic review. PLoS ONE 2017, 12, e0189996. [Google Scholar] [CrossRef] [PubMed] [Green Version]
- Stein, A.D. 90th Anniversary Commentary: Dietary Diversity Is the Cornerstone of Good Nutrition. J. Nutr. 2018, 148, 1683–1685. [Google Scholar] [CrossRef] [PubMed] [Green Version]
- UNICEF. Combatting the Costs of Exclusion for Children with Disabilities and Their Families; UNICEF: New York, NY, USA, 2021. [Google Scholar]
- Schell, K. Nshima: A Staple Food in Zambia. The Turquoise Table. Available online: https://theturquoisetable.com/nshima-a-staple-food-in-zambia/ (accessed on 3 January 2023).
- Holden, J.; Corby, N. Nutrition Programming for People with Disabilities: Evidence and Learning; Research Report No. 6; Disability Inclusion Helpdesk: London, UK, 2019. [Google Scholar]
- Hume-Nixon, M.; Kuper, H. The association between malnutrition and childhood disability in low- and middle- income countries: Systematic review and meta-analysis of observational studies. Trop. Med. Int. Health 2018, 23, 1158–1175. [Google Scholar] [CrossRef] [PubMed]


| Variable | Household with a Child with a Disability n = 436 (30%) | Household without a Child with a Disability n = 1027 (70%) |
|---|---|---|
| Adult Age (mean (SD)) | 39.3 (0.54) * | 37.9 (0.38) |
| Female n (%) | 416 (95.3) ** | 700 (68.2) |
| Child age (mean (SD)) | 10.8 (5.4) | |
| Community n (%) | ||
| Kanyama | 116 (26.6) | 234 (22.8) |
| Kanyama West | 52 (11.9) | 115 (11.2) |
| Misisi | 88 (20.2) | 243 (23.7) |
| Chawama | 180 (41.3) | 434 (42.4) |
| Access to water from a community borehole n (%) | 218 (50) | 472 (46) |
| We have access to soap at home n (%) | 344 (79) ** | 924 (90) |
| My child has difficulties with feeding n (%) | 128 (29.4) | |
| Extent to which COVID-19 impacted ability to obtain food n (%) | ||
| To a great extent | 139 (31.8) ** | 226 (22.0) |
| To a small extent | 167 (38.3) | 510 (49.7) |
| It has not changed | 126 (29.0) | 275 (6.9) |
| It has improved | 4 (0.9) | 15 (1.5) |
| Household with a Child with a Disability (n = 436) | Household without a Child with a Disability (n = 1027) | |
|---|---|---|
| Item specific | n (%) | n (%) |
| Nshima | 432 (99.1) * | 990 (96.4) |
| Potato | 80 (18.4) * | 305 (29.7) |
| Vegetables | 408 (93.6) * | 893 (87.0) |
| Fruit | 49 (11.3) * | 338 (32.9) |
| Meat | 121 (27.8) * | 471 (45.9) |
| Eggs | 102 (23.4) * | 347 (33.8) |
| Fish | 94 (21.6) * | 303 (29.8) |
| Beans | 115 (26.4) * | 398 (38.8) |
| Dairy | 48 (11.0) * | 299 (29.1) |
| Fats | 172 (39.5) * | 562 (54.7) |
| Sweets | 245 (56.2) * | 716 (69.7) |
| Condiments | 220 (50.5) * | 676 (65.8) |
| Unadjusted | Adjusted | ||||
|---|---|---|---|---|---|
| Coef | 95% Confidence Interval | Coef | 95% Confidence Interval | ||
| IDDS | Respondent with or without a child with a disability | −0.97 | −1.12:−0.817 | −0.79 | −0.95:−0.63 |
| Age | −0.01 | −0.01:0.00 | |||
| Sex | −0.27 | −0.44:−0.09 | |||
| Compound | −0.08 | −0.14:−0.02 | |||
| Extent COVID-19 impact food—Great extent | 0.00 | ||||
| Small change | 0.42 | 0.24:0.60 | |||
| It has not changed | 0.43 | 0.24:0.63 | |||
| It has improved | 1.00 | 0.37:1.64 | |||
| Soap available | −0.50 | −0.71:−0.28 | |||
| HDDS | Respondent with or without a child with a disability | −1.34 | −1.58:−1.10 | −1.08 | −1.33:−0.84 |
| Age | −0.01 | −0.02:−0.0002 | |||
| Sex | −0.23 | −0.49:0.34 | |||
| Compound | −0.15 | −0.24:-0.07 | |||
| Extent COVID-19 impact food—Great extent | 0 | ||||
| Small change | 0.62 | 0.35:0.89 | |||
| It has not changed | 0.70 | 0.41−1.00 | |||
| It has improved | 1.64 | 0.69:2.56 | |||
| Soap available | −1.04 | −1.37:−0.72 | |||
Disclaimer/Publisher’s Note: The statements, opinions and data contained in all publications are solely those of the individual author(s) and contributor(s) and not of MDPI and/or the editor(s). MDPI and/or the editor(s) disclaim responsibility for any injury to people or property resulting from any ideas, methods, instructions or products referred to in the content. |
© 2023 by the authors. Licensee MDPI, Basel, Switzerland. This article is an open access article distributed under the terms and conditions of the Creative Commons Attribution (CC BY) license (https://creativecommons.org/licenses/by/4.0/).
Share and Cite
Hearst, M.O.; Wells, L.; Hughey, L.; Makhoul, Z. Household Dietary Diversity among Households with and without Children with Disabilities in Three Low-Income Communities in Lusaka, Zambia. Int. J. Environ. Res. Public Health 2023, 20, 2343. https://doi.org/10.3390/ijerph20032343
Hearst MO, Wells L, Hughey L, Makhoul Z. Household Dietary Diversity among Households with and without Children with Disabilities in Three Low-Income Communities in Lusaka, Zambia. International Journal of Environmental Research and Public Health. 2023; 20(3):2343. https://doi.org/10.3390/ijerph20032343
Chicago/Turabian StyleHearst, Mary O., Leah Wells, Lauren Hughey, and Zeina Makhoul. 2023. "Household Dietary Diversity among Households with and without Children with Disabilities in Three Low-Income Communities in Lusaka, Zambia" International Journal of Environmental Research and Public Health 20, no. 3: 2343. https://doi.org/10.3390/ijerph20032343