
Heart Rate Variability Measurement through a Smart Wearable Device: Another Breakthrough for Personal Health Monitoring?

 , and
, and
Abstract
:1. Introduction
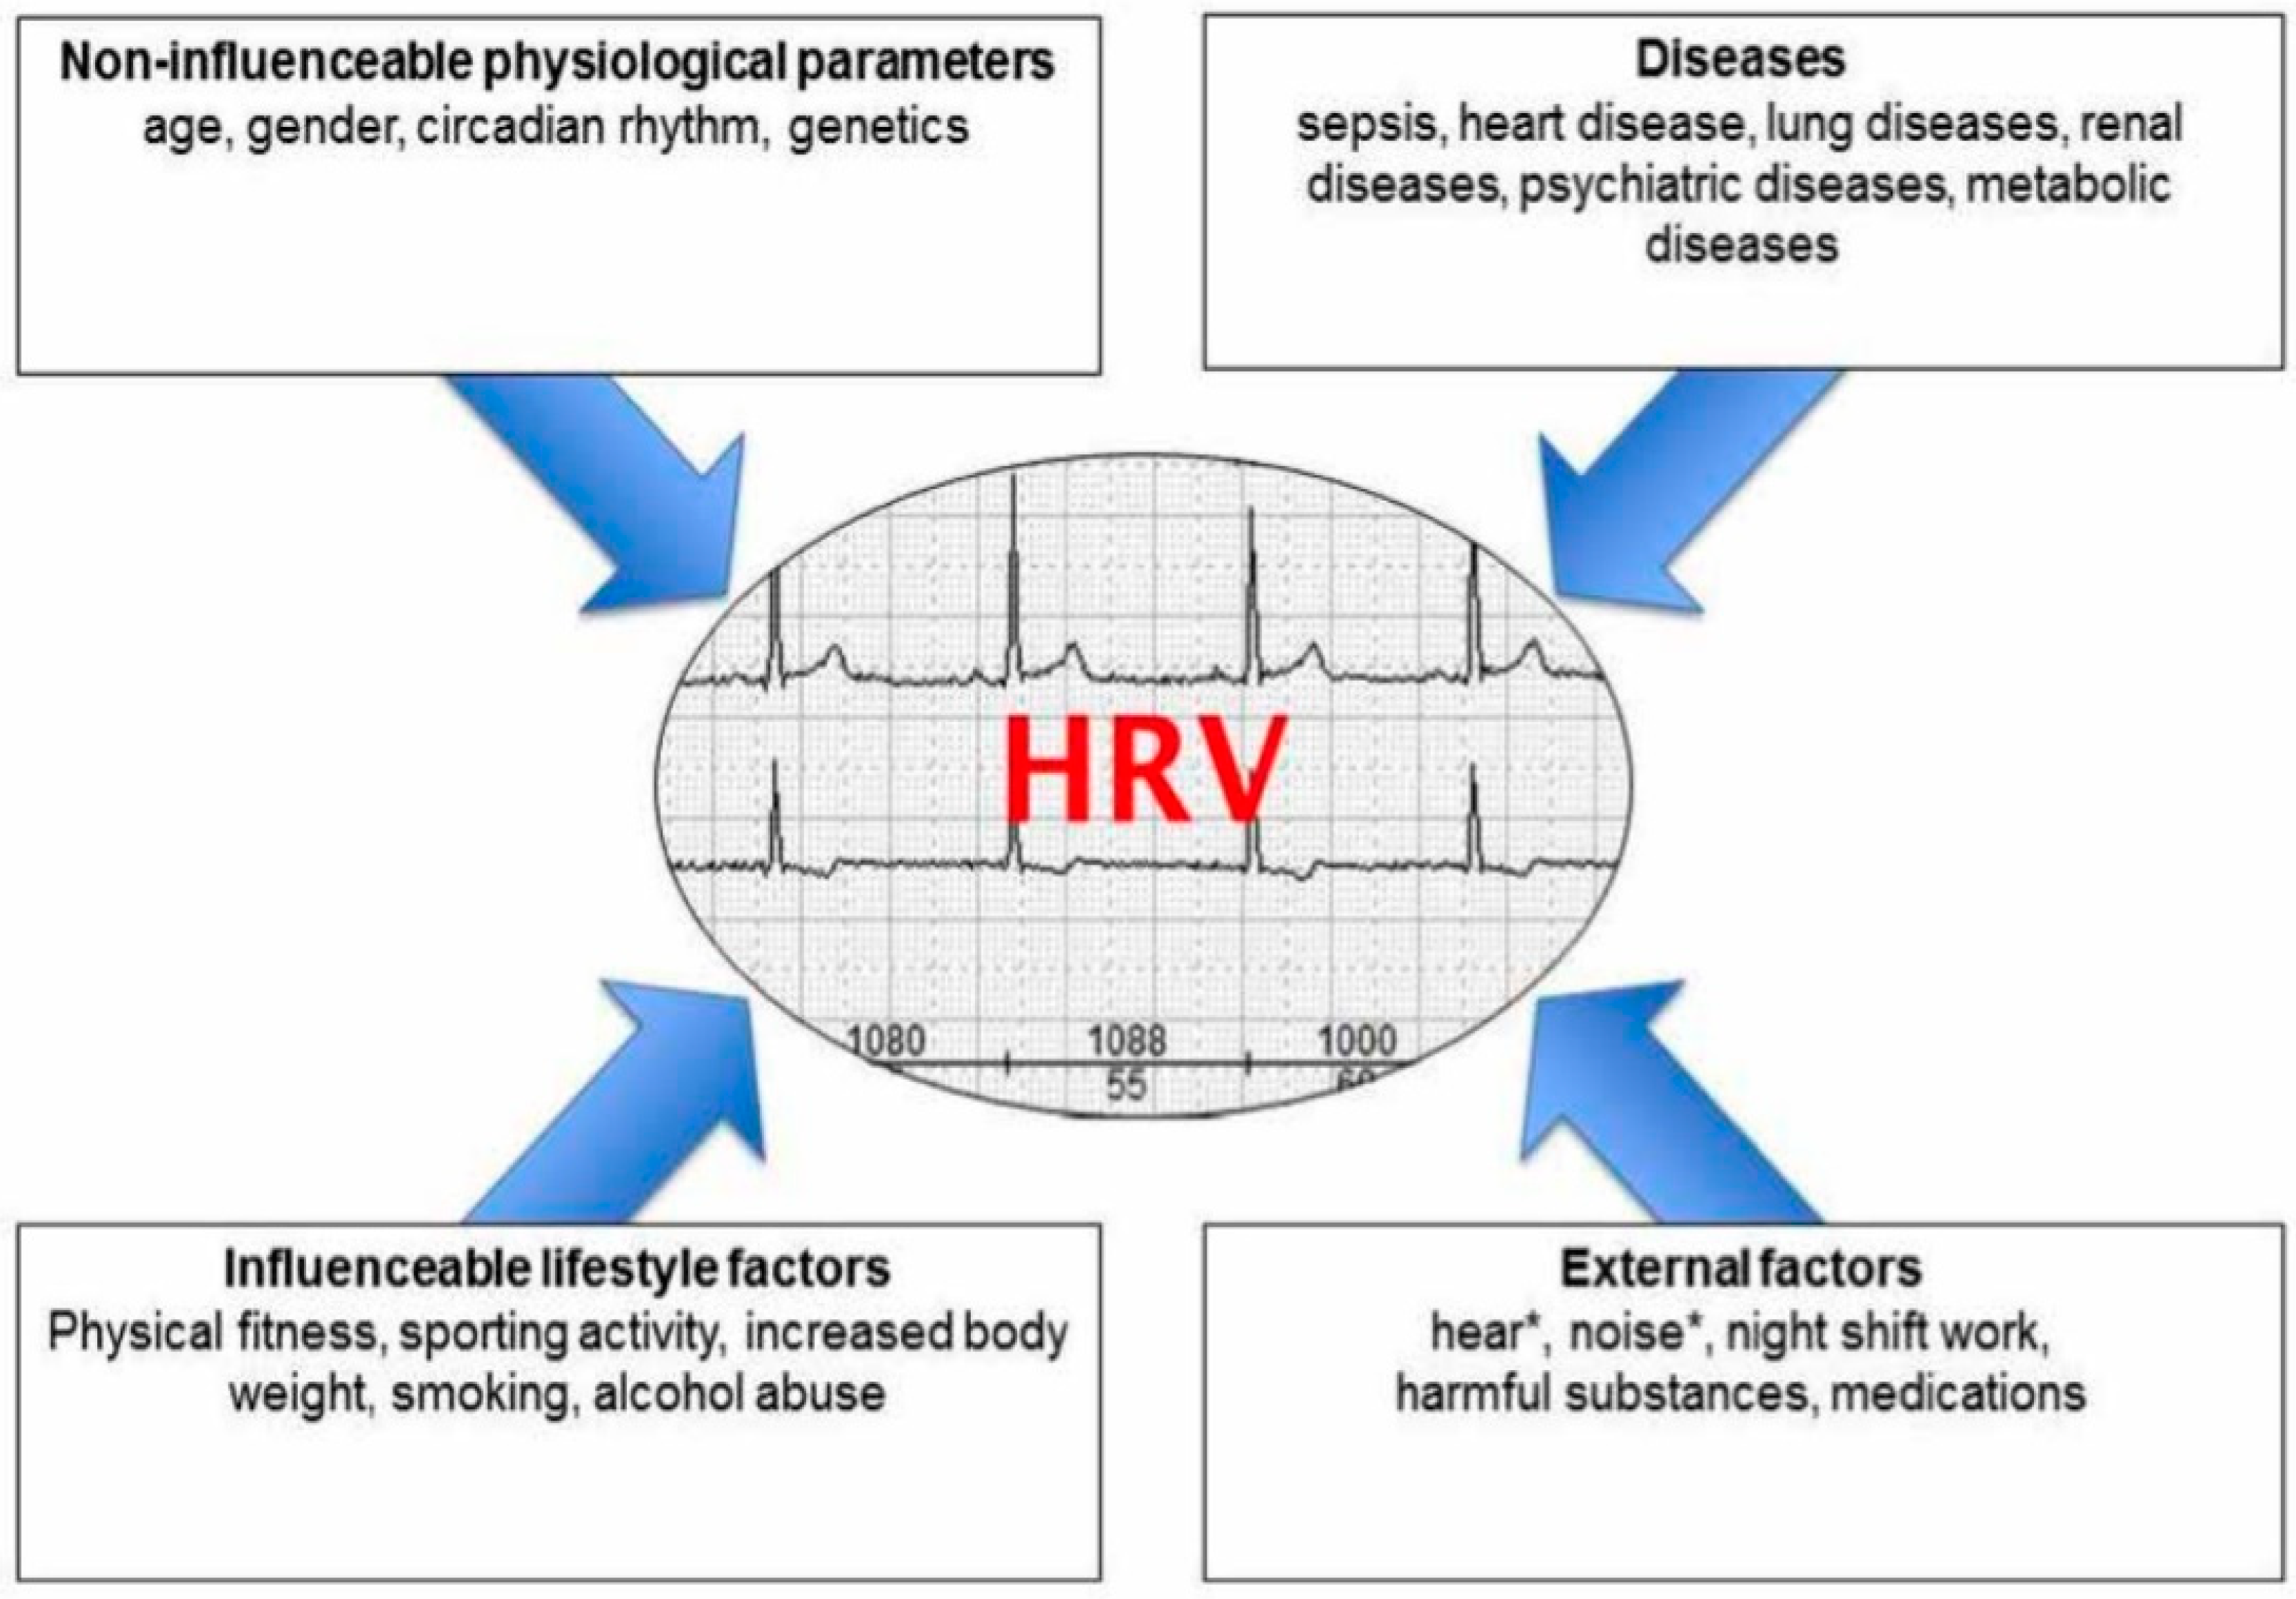
2. Heart Rate Variability
3. Methods
Search Strategy
- Device type: studies that analyze data from commercially available wearable devices for HRV monitoring that were targeted for the personal use device market.
- Objective: studies with a primary objective to investigate HRV and its measurement using wearable devices.
- Data: studies that included reports on HRV measurements obtained from wearable devices, along with associated health or clinical outcomes.
- Outdated technology: studies that exclusively used outdated or obsolete wearable devices that do not represent current technology.
- Animal studies: any study conducted on animals.
- Objective: studies that did not focus on HRV or the use of wearable devices for HRV assessment.
4. HRV Metrics

| Variable | Units | Description |
|---|---|---|
| SDNN | msec | Standard deviation of all NN intervals |
| SDANN | msec | Standard deviation of averages all NN intervals in all 5 min segments of the entire recording |
| RMSDD | msec | Square root of the mean of the sum of squares of differences between adjacent NN intervals |
| SDNN Index | msec | Mean of standard deviations of all NN intervals for all 5 min segments of the entire recording |
| SDSD | msec | Standard deviation of differences between adjacent NN intervals |
| NN50 count | msec | Numbers of pairs of adjacent NN intervals differing by more than 50 msec in the entire recording; three variants are possible, counting all such NN intervals in which the first or second interval is longer |
| pNN50 | % | NN50 count divided by the total number of all NN intervals |
5. HRV Analysis Methods in Smart Devices
5.1. ECG
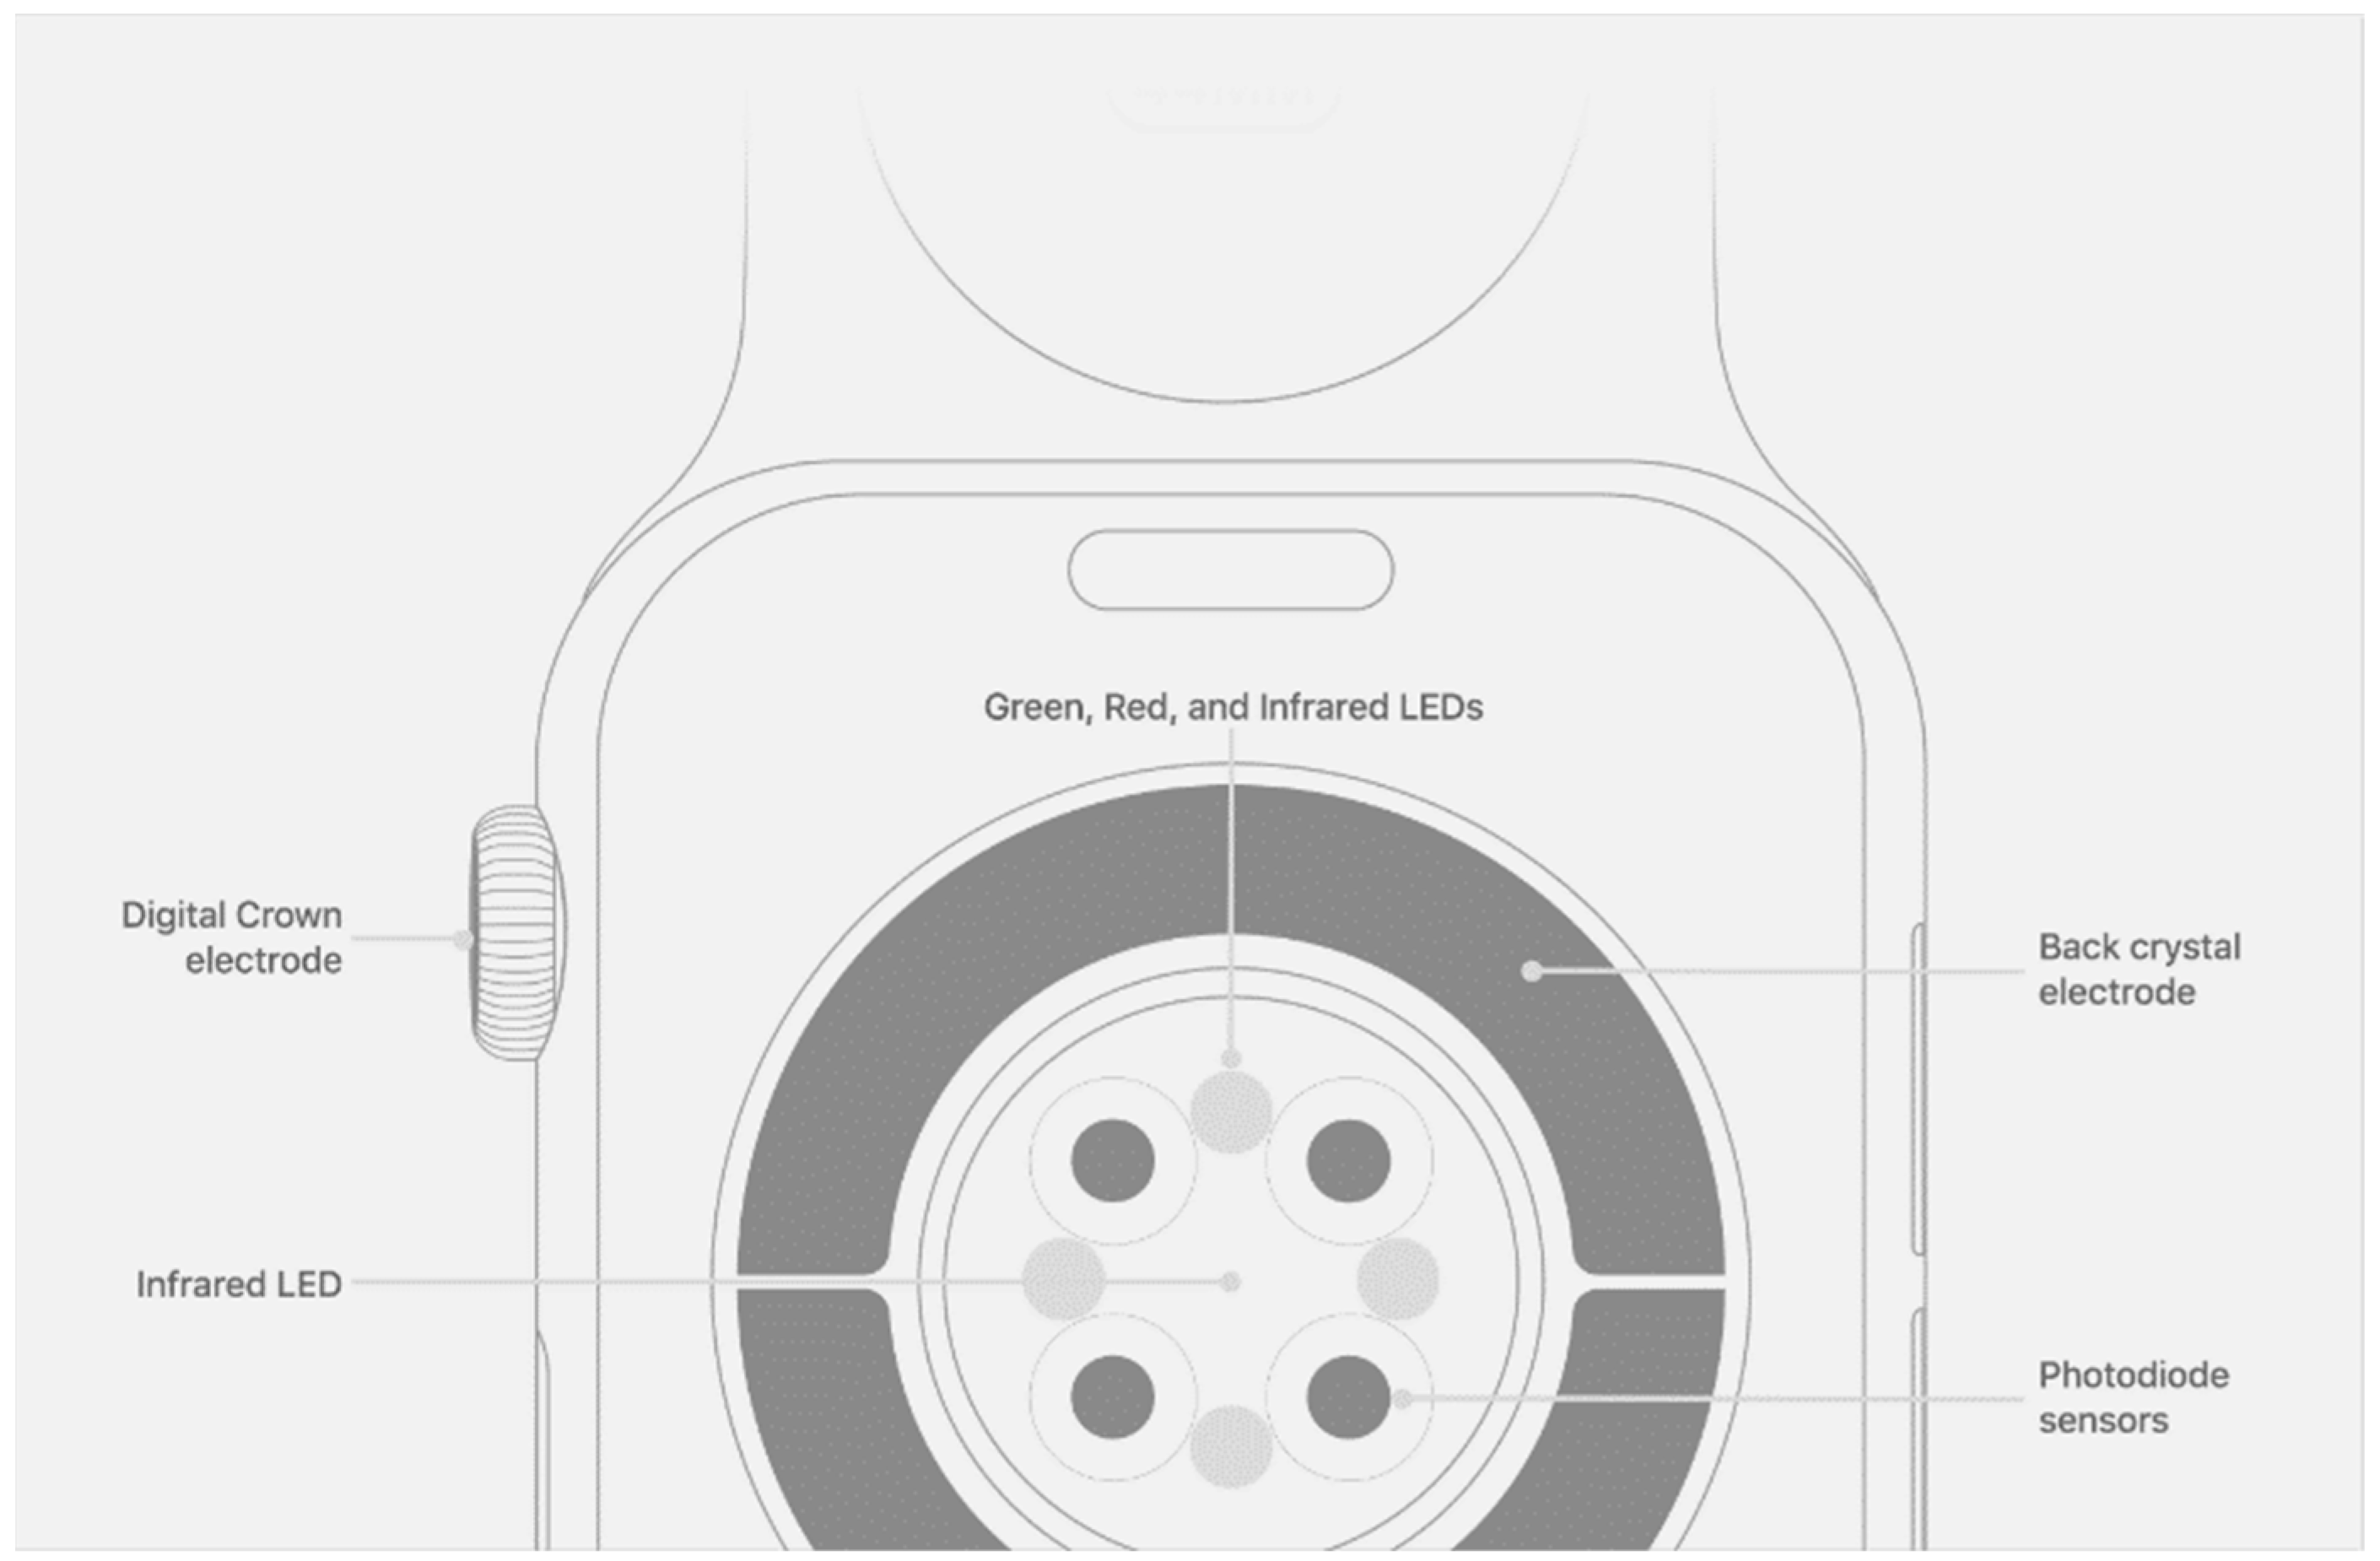
5.2. PPG
6. Consumer Device Brands and Apps

7. Verification of Wearable HRV Measurement
8. Application of HRV Tracking through Wearable Devices
8.1. Stress
8.2. Mental Health
8.3. Heart Disease
8.4. Cardiac Rehabilitation
8.5. Diabetes
8.6. Inflammation
9. Advantages of Using Wearable Devices for HRV Tracking
10. Challenges
11. Conclusions
Author Contributions
Funding
Institutional Review Board Statement
Informed Consent Statement
Data Availability Statement
Acknowledgments
Conflicts of Interest
References
- Ernst, G. Heart-rate variability-more than heart beats? Front. Public Health 2017, 5, 240. [Google Scholar] [CrossRef] [PubMed]
- Rodrigues, E.; Lima, D.; Barbosa, P.; Gonzaga, K.; Guerra, R.O.; Pimentel, M.; Barbosa, H.; Maciel, A. HRV monitoring using commercial wearable devices as a health indicator for older persons during the pandemic. Sensors 2022, 22, 2001. [Google Scholar] [CrossRef] [PubMed]
- Sajadieh, A.; Nielsen, O.W.; Rasmussen, V.; Hein, H.O.; Abedini, S.; Hansen, J.F. Increased heart rate and reduced heart-rate variability are associated with subclinical inflammation in middle-aged and elderly subjects with no apparent heart disease. Eur. Heart J. 2004, 25, 363–370. [Google Scholar] [CrossRef] [PubMed]
- Shah, S.A.; Kambur, T.; Chan, C.; Herrington, D.M.; Liu, K.; Shah, S.J. Relation of short-term heart rate variability to incident heart failure (from the Multi-Ethnic Study of Atherosclerosis). Am. J. Cardiol. 2013, 112, 533–540. [Google Scholar] [CrossRef] [PubMed]
- Sammito, S.; Böckelmann, I. Factors influencing heart rate variability. Int. Cardiovasc. Forum J. 2016, 6, 18–22. [Google Scholar] [CrossRef]
- Dantas, E.M.; Sant’Anna, M.L.; Andreao, R.V.; Goncalves, C.P.; Morra, E.A.; Baldo, M.P.; Rodrigues, S.L.; Mill, J.G. Spectral analysis of heart rate variability with the autoregressive method: What model order to choose? Comput. Biol. Med. 2012, 42, 164–170. [Google Scholar] [CrossRef] [PubMed]
- Camm, A.J.; Malik, M.; Bigger, J.T.; Breithardt, G.; Cerutti, S.; Cohen, R.J.; Coumel, P.; Fallen, E.L.; Kennedy, H.L.; Kleiger, R.E.; et al. Heart rate variability: Standards of measurement, physiological interpretation and clinical use. Task Force of the European Society of Cardiology and the North American Society of Pacing and Electrophysiology. Circulation 1996, 93, 1043–1065. [Google Scholar]
- Alian, A.A.; Shelley, K.H. Photoplethysmography. Best Pract. Res. Clin. Anaesthesiol. 2014, 28, 395–406. [Google Scholar] [CrossRef]
- Kuusela, T. Methodological aspects of heart rate variability analysis. In Heart Rate Variability (HRV) Signal Analysis; Kamath, M.V., Watanabe, M.A., Upton, A.R.M., Eds.; CRC Press: Boca Raton, FL, USA, 2013; pp. 9–42. [Google Scholar]
- Umetani, K.; Singer, D.H.; McCraty, R.; Atkinson, M. Twenty-four hour time domain heart rate variability and heart rate: Relations to age and gender over nine decades. J. Am. Coll. Cardiol. 1998, 31, 593–601. [Google Scholar] [CrossRef]
- Grant, C.C.; van Rensburg, D.C.; Strydom, N.; Viljoen, M. Importance of tachogram length and period of recording during noninvasive investigation of the autonomic nervous system. Ann. Noninvasive Electrocardiol. 2011, 16, 131–139. [Google Scholar] [CrossRef]
- Politano, L.; Palladino, A.; Nigro, G.; Scutifero, M.; Cozza, V. Usefulness of heart rate variability as a predictor of sudden cardiac death in muscular dystrophies. Acta Myol. 2008, 27, 114–122. [Google Scholar] [PubMed]
- Malliani, A.; Lombardi, F.; Pagani, M. Power spectrum analysis of heart rate variability: A tool to explore neural regulatory mechanisms. Br. Heart J. 1994, 71, 1–2. [Google Scholar] [CrossRef] [PubMed]
- Sharma, V. Deterministic chaos and fractal complexity in the dynamics of cardiovascular behavior: Perspectives on a new frontier. Open Cardiovasc. Med. J. 2009, 3, 110–123. [Google Scholar] [CrossRef] [PubMed]
- Iannaccone, P.M.; Khokha, M. Fractal Geometry in Biological Systems: An Analytical Approach, 1st ed.; CRC Press: Boca Raton, FL, USA, 1996. [Google Scholar]
- Karavaev, A.S.; Ishbulatov, Y.M.; Ponomarenko, V.I.; Bezruchko, B.P.; Kiselev, A.R.; Prokhorov, M.D. Autonomic control is a source of dynamical chaos in the cardiovascular system. Chaos 2019, 29, 121101. [Google Scholar] [CrossRef] [PubMed]
- Billman, G.E. Heart rate variability—A historical perspective. Front. Physiol. 2011, 2, 86. [Google Scholar] [CrossRef]
- Castaneda, D.; Esparza, A.; Ghamari, M.; Soltanpur, C.; Nazeran, H. A review on wearable photoplethysmography sensors and their potential future applications in health care. Int. J. Biosens. Bioelectron. 2018, 4, 195–202. [Google Scholar] [CrossRef] [PubMed]
- Allen, J. Photoplethysmography and its application in clinical physiological measurement. Physiol. Meas. 2007, 28, R1. [Google Scholar] [CrossRef]
- Elgendi, M. On the analysis of fingertip photoplethysmogram signals. Curr. Cardiol. Rev. 2012, 8, 14–25. [Google Scholar] [CrossRef]
- Wang, C.; Li, Z.; Wei, X. Monitoring heart and respiratory rates at radial artery based on PPG. Optik 2013, 124, 3954–3956. [Google Scholar] [CrossRef]
- Bellenger, C.R.; Miller, D.J.; Halson, S.L.; Roach, G.D.; Sargent, C. Wrist-based photoplethysmography assessment of heart rate and heart rate variability: Validation of WHOOP. Sensors 2021, 21, 3571. [Google Scholar] [CrossRef]
- Kinnunen, H.; Rantanen, A.; Kentta, T.; Koskimaki, H. Feasible assessment of recovery and cardiovascular health: Accuracy of nocturnal HR and HRV assessed via ring PPG in comparison to medical grade ECG. Physiol. Meas. 2020, 41, 04NT01. [Google Scholar] [CrossRef] [PubMed]
- Schafer, A.; Vagedes, J. How accurate is pulse rate variability as an estimate of heart rate variability? A review on studies comparing photoplethysmographic technology with an electrocardiogram. Int. J. Cardiol. 2013, 166, 15–29. [Google Scholar] [CrossRef] [PubMed]
- Yuda, E.; Shibata, M.; Ogata, Y.; Ueda, N.; Yambe, T.; Yoshizawa, M.; Hayano, J. Pulse rate variability: A new biomarker, not a surrogate for heart rate variability. J. Physiol. Anthropol. 2020, 39, 21. [Google Scholar] [CrossRef] [PubMed]
- Monitor Your Heart Rate with Apple Watch. Available online: https://support.apple.com/en-us/HT204666 (accessed on 29 March 2023).
- Dagher, L.; Shi, H.; Zhao, Y.; Marrouche, N.F. Wearables in cardiology: Here to stay. Heart Rhythm 2020, 17, 889–895. [Google Scholar] [CrossRef]
- Etiwy, M.; Akhrass, Z.; Gillinov, L.; Alashi, A.; Wang, R.; Blackburn, G.; Gillinov, S.M.; Phelan, D.; Gillinov, A.M.; Houghtaling, P.L.; et al. Accuracy of wearable heart rate monitors in cardiac rehabilitation. Cardiovasc. Diagn. Ther. 2019, 9, 262–271. [Google Scholar] [CrossRef] [PubMed]
- Mejia-Mejia, E.; May, J.M.; Torres, R.; Kyriacou, P.A. Pulse rate variability in cardiovascular health: A review on its applications and relationship with heart rate variability. Physiol. Meas. 2020, 41, 07TR01. [Google Scholar] [CrossRef] [PubMed]
- Giardino, N.D.; Lehrer, P.M.; Edelberg, R. Comparison of finger plethysmograph to ECG in the measurement of heart rate variability. Psychophysiology 2002, 39, 246–253. [Google Scholar] [CrossRef]
- Jan, H.-Y.; Chen, M.-F.; Fu, T.-C.; Lin, W.-C.; Tsai, C.-L.; Lin, K.-P. Evaluation of coherence between ECG and PPG derived parameters on heart rate variability and respiration in healthy volunteers with/without controlled breathing. J. Med. Biol. Eng. 2019, 39, 783–795. [Google Scholar] [CrossRef]
- Lin, W.-H.; Wu, D.; Li, C.; Zhang, H.; Zhang, Y.-T. Comparison of Heart Rate Variability from PPG with That from ECG; Springer: Cham, Switzerland, 2014; pp. 213–215. [Google Scholar]
- Pernice, R.; Javorka, M.; Krohova, J.; Czippelova, B.; Turianikova, Z.; Busacca, A.; Faes, L. Reliability of short-term heart rate variability indexes assessed through photoplethysmography. In Proceedings of the 2018 40th Annual International Conference of the IEEE Engineering in Medicine and Biology Society (EMBC), Honolulu, HI, USA, 18–21 July 2018. [Google Scholar] [CrossRef]
- Shin, H. Ambient temperature effect on pulse rate variability as an alternative to heart rate variability in young adult. J. Clin. Monit. Comput. 2016, 30, 939–948. [Google Scholar] [CrossRef]
- Welykholowa, K.; Hosanee, M.; Chan, G.; Cooper, R.; Kyriacou, P.A.; Zheng, D.; Allen, J.; Abbott, D.; Menon, C.; Lovell, N.H.; et al. Multimodal photoplethysmography-based approaches for improved detection of hypertension. J. Clin. Med. 2020, 9, 1203. [Google Scholar] [CrossRef]
- Elgendi, M.; Fletcher, R.; Liang, Y.; Howard, N.; Lovell, N.H.; Abbott, D.; Lim, K.; Ward, R. The use of photoplethysmography for assessing hypertension. NPJ Digit. Med. 2019, 2, 60. [Google Scholar] [CrossRef] [PubMed]
- Karavaev, A.S.; Borovik, A.S.; Borovkova, E.I.; Orlova, E.A.; Simonyan, M.A.; Ponomarenko, V.I.; Skazkina, V.V.; Gridnev, V.I.; Bezruchko, B.P.; Prokhorov, M.D.; et al. Low-frequency component of photoplethysmogram reflects the autonomic control of blood pressure. Biophys. J. 2021, 120, 2657–2664. [Google Scholar] [CrossRef] [PubMed]
- Kim, S.H.; Lim, K.R.; Seo, J.H.; Ryu, D.R.; Lee, B.K.; Cho, B.R.; Chun, K.J. Higher heart rate variability as a predictor of atrial fibrillation in patients with hypertension. Sci. Rep. 2022, 12, 3702. [Google Scholar] [CrossRef] [PubMed]
- Khan, A.A.; Lip, G.Y.H.; Shantsila, A. Heart rate variability in atrial fibrillation: The balance between sympathetic and parasympathetic nervous system. Eur. J. Clin. Investig. 2019, 49, e13174. [Google Scholar] [CrossRef] [PubMed]
- Barrios, L.; Oldrati, P.; Santini, S.; Lutterotti, A. Evaluating the accuracy of heart rate sensors based on photoplethysmography for in-the-wild analysis. In Proceedings of the 13th EAI International Conference on Pervasive Computing Technologies for Healthcare, Trento, Italy, 20–23 May 2019. [Google Scholar]
- Georgiou, K.; Larentzakis, A.V.; Khamis, N.N.; Alsuhaibani, G.I.; Alaska, Y.A.; Giallafos, E.J. Can wearable devices accurately measure heart rate variability? A systematic review. Folia Med. 2018, 60, 7–20. [Google Scholar] [CrossRef]
- Morrin, N.M.; Stone, M.R.; Henderson, K.J. Reproducibility of 24-h ambulatory blood pressure and measures of autonomic function. Blood Press. Monit. 2017, 22, 169–172. [Google Scholar] [CrossRef]
- Hinde, K.; White, G.; Armstrong, N. Wearable devices suitable for monitoring twenty four hour heart rate variability in military populations. Sensors 2021, 21, 1061. [Google Scholar] [CrossRef]
- Plews, D.J.; Scott, B.; Altini, M.; Wood, M.; Kilding, A.E.; Laursen, P.B. Comparison of heart-rate-variability recording with smartphone photoplethysmography, Polar H7 chest strap, and electrocardiography. Int. J. Sports Physiol. Perform. 2017, 12, 1324–1328. [Google Scholar] [CrossRef]
- Shaffer, F.; Meehan, Z.M. A practical guide to resonance frequency assessment for heart rate variability biofeedback. Front. Neurosci. 2020, 14, 570400. [Google Scholar] [CrossRef]
- Lehrer, P.; Vaschillo, B.; Zucker, T.; Graves, J.; Katsamanis, M.; Aviles, M.; Wamboldt, F. Protocol for heart rate variability biofeedback training. Biofeedback 2013, 41, 98–109. [Google Scholar] [CrossRef]
- Hallman, D.M.; Olsson, E.M.; von Scheele, B.; Melin, L.; Lyskov, E. Effects of heart rate variability biofeedback in subjects with stress-related chronic neck pain: A pilot study. Appl. Psychophysiol. Biofeedback 2011, 36, 71–80. [Google Scholar] [CrossRef] [PubMed]
- Henriques, G.; Keffer, S.; Abrahamson, C.; Horst, S.J. Exploring the effectiveness of a computer-based heart rate variability biofeedback program in reducing anxiety in college students. Appl. Psychophysiol. Biofeedback 2011, 36, 101–112. [Google Scholar] [CrossRef] [PubMed]
- Siepmann, M.; Aykac, V.; Unterdorfer, J.; Petrowski, K.; Mueck-Weymann, M. A pilot study on the effects of heart rate variability biofeedback in patients with depression and in healthy subjects. Appl. Psychophysiol. Biofeedback 2008, 33, 195–201. [Google Scholar] [CrossRef] [PubMed]
- Lin, G.; Xiang, Q.; Fu, X.; Wang, S.; Wang, S.; Chen, S.; Shao, L.; Zhao, Y.; Wang, T. Heart rate variability biofeedback decreases blood pressure in prehypertensive subjects by improving autonomic function and baroreflex. J. Altern. Complement. Med. 2012, 18, 143–152. [Google Scholar] [CrossRef] [PubMed]
- Meule, A.; Freund, R.; Skirde, A.K.; Vogele, C.; Kubler, A. Heart rate variability biofeedback reduces food cravings in high food cravers. Appl. Psychophysiol. Biofeedback 2012, 37, 241–251. [Google Scholar] [CrossRef] [PubMed]
- Chan, P.H.; Wong, C.K.; Poh, Y.C.; Pun, L.; Leung, W.W.; Wong, Y.F.; Wong, M.M.; Poh, M.Z.; Chu, D.W.; Siu, C.W. Diagnostic performance of a smartphone-based photoplethysmographic application for atrial fibrillation screening in a primary care setting. J. Am. Heart Assoc. 2016, 5, e003428. [Google Scholar] [CrossRef]
- Bolanos, M.; Nazeran, H.; Haltiwanger, E. Comparison of heart rate variability signal features derived from electrocardiography and photoplethysmography in healthy individuals. In Proceedings of the 2006 International Conference of the IEEE Engineering in Medicine and Biology Society, New York, NY, USA, 30 August–3 September 2006; pp. 4289–4294. [Google Scholar] [CrossRef]
- Jeyhani, V.; Mahdiani, S.; Peltokangas, M.; Vehkaoja, A. Comparison of HRV parameters derived from photoplethysmography and electrocardiography signals. In Proceedings of the 2015 37th Annual International Conference of the IEEE Engineering in Medicine and Biology Society (EMBC), Milan, Italy, 25–29 August 2015; pp. 5952–5955. [Google Scholar] [CrossRef]
- Rinne, J.K.A.; Miri, S.; Oksala, N.; Vehkaoja, A.; Kossi, J. Evaluation of a wrist-worn photoplethysmography monitor for heart rate variability estimation in patients recovering from laparoscopic colon resection. J. Clin. Monit. Comput. 2023, 37, 45–53. [Google Scholar] [CrossRef]
- Sarhaddi, F.; Kazemi, K.; Azimi, I.; Cao, R.; Niela-Vilen, H.; Axelin, A.; Liljeberg, P.; Rahmani, A.M. A comprehensive accuracy assessment of Samsung smartwatch heart rate and heart rate variability. PLoS ONE 2022, 17, e0268361. [Google Scholar] [CrossRef]
- Van Voorhees, E.E.; Dennis, P.A.; Watkins, L.L.; Patel, T.A.; Calhoun, P.S.; Dennis, M.F.; Beckham, J.C. Ambulatory heart rate variability monitoring: Comparisons between the Empatica E4 wristband and Holter electrocardiogram. Psychosom. Med. 2022, 84, 210–214. [Google Scholar] [CrossRef]
- Dobbs, W.C.; Fedewa, M.V.; MacDonald, H.V.; Holmes, C.J.; Cicone, Z.S.; Plews, D.J.; Esco, M.R. The accuracy of acquiring heart rate variability from portable devices: A systematic review and meta-analysis. Sports Med. 2019, 49, 417–435. [Google Scholar] [CrossRef]
- Cao, R.; Azimi, I.; Sarhaddi, F.; Niela-Vilen, H.; Axelin, A.; Liljeberg, P.; Rahmani, A.M. Accuracy assessment of oura ring nocturnal heart rate and heart rate variability in comparison with electrocardiography in time and frequency domains: Comprehensive analysis. J. Med. Internet Res. 2022, 24, e27487. [Google Scholar] [CrossRef] [PubMed]
- Miller, D.J.; Sargent, C.; Roach, G.D. A validation of six wearable devices for estimating sleep, heart rate and heart rate variability in healthy adults. Sensors 2022, 22, 6317. [Google Scholar] [CrossRef] [PubMed]
- Hernando, D.; Roca, S.; Sancho, J.; Alesanco, A.; Bailon, R. Validation of the Apple Watch for heart rate variability measurements during relax and mental stress in healthy subjects. Sensors 2018, 18, 2619. [Google Scholar] [CrossRef] [PubMed]
- Stone, J.D.; Ulman, H.K.; Tran, K.; Thompson, A.G.; Halter, M.D.; Ramadan, J.H.; Stephenson, M.; Finomore, V.S., Jr.; Galster, S.M.; Rezai, A.R.; et al. Assessing the accuracy of popular commercial technologies that measure resting heart rate and heart rate variability. Front. Sports Act. Living 2021, 3, 585870. [Google Scholar] [CrossRef]
- Koskinen, T.; Kahonen, M.; Jula, A.; Laitinen, T.; Keltikangas-Jarvinen, L.; Viikari, J.; Valimaki, I.; Raitakari, O.T. Short-term heart rate variability in healthy young adults: The Cardiovascular Risk in Young Finns Study. Auton. Neurosci. 2009, 145, 81–88. [Google Scholar] [CrossRef] [PubMed]
- Nunan, D.; Sandercock, G.R.; Brodie, D.A. A quantitative systematic review of normal values for short-term heart rate variability in healthy adults. Pacing Clin. Electrophysiol. 2010, 33, 1407–1417. [Google Scholar] [CrossRef] [PubMed]
- Thayer, J.F.; Ahs, F.; Fredrikson, M.; Sollers, J.J., 3rd; Wager, T.D. A meta-analysis of heart rate variability and neuroimaging studies: Implications for heart rate variability as a marker of stress and health. Neurosci. Biobehav. Rev. 2012, 36, 747–756. [Google Scholar] [CrossRef]
- Natarajan, A.; Pantelopoulos, A.; Emir-Farinas, H.; Natarajan, P. Heart rate variability during mindful breathing meditation. Lancet Digit. Health 2022, 13, 1017350. [Google Scholar] [CrossRef]
- Shaffer, F.; Ginsberg, J.P. An overview of heart rate variability metrics and norms. Front. Public Health 2017, 5, 258. [Google Scholar] [CrossRef]
- Kim, H.G.; Cheon, E.J.; Bai, D.S.; Lee, Y.H.; Koo, B.H. Stress and heart rate variability: A meta-analysis and review of the literature. Psychiatry Investig. 2018, 15, 235–245. [Google Scholar] [CrossRef]
- Tsigos, C.; Chrousos, G.P. Hypothalamic-pituitary-adrenal axis, neuroendocrine factors and stress. J. Psychosom. Res. 2002, 53, 865–871. [Google Scholar] [CrossRef] [PubMed]
- Hellhammer, J.; Schubert, M. The physiological response to Trier Social Stress Test relates to subjective measures of stress during but not before or after the test. Psychoneuroendocrinology 2012, 37, 119–124. [Google Scholar] [CrossRef] [PubMed]
- Stalder, T.; Tietze, A.; Steudte, S.; Alexander, N.; Dettenborn, L.; Kirschbaum, C. Elevated hair cortisol levels in chronically stressed dementia caregivers. Psychoneuroendocrinology 2014, 47, 26–30. [Google Scholar] [CrossRef] [PubMed]
- Martinez, G.J.; Grover, T.; Mattingly, S.M.; Mark, G.; D’Mello, S.; Aledavood, T.; Akbar, F.; Robles-Granda, P.; Striegel, A. Alignment between heart rate variability from fitness trackers and perceived stress: Perspectives from a large-scale in situ longitudinal study of information workers. JMIR Hum. Factors 2022, 9, e33754. [Google Scholar] [CrossRef] [PubMed]
- Brosschot, J.F.; Van Dijk, E.; Thayer, J.F. Daily worry is related to low heart rate variability during waking and the subsequent nocturnal sleep period. Int. J. Psychophysiol. 2007, 63, 39–47. [Google Scholar] [CrossRef]
- Moshe, I.; Terhorst, Y.; Opoku Asare, K.; Sander, L.B.; Ferreira, D.; Baumeister, H.; Mohr, D.C.; Pulkki-Raback, L. Predicting symptoms of depression and anxiety using smartphone and wearable data. Front. Psychiatry 2021, 12, 625247. [Google Scholar] [CrossRef]
- Moya-Ramon, M.; Mateo-March, M.; Pena-Gonzalez, I.; Zabala, M.; Javaloyes, A. Validity and reliability of different smartphones applications to measure HRV during short and ultra-short measurements in elite athletes. Comput. Methods Programs Biomed. 2022, 217, 106696. [Google Scholar] [CrossRef]
- Cheng, Y.C.; Su, M.I.; Liu, C.W.; Huang, Y.C.; Huang, W.L. Heart rate variability in patients with anxiety disorders: A systematic review and meta-analysis. Psychiatry Clin. Neurosci. 2022, 76, 292–302. [Google Scholar] [CrossRef]
- Schneider, M.; Schwerdtfeger, A. Autonomic dysfunction in posttraumatic stress disorder indexed by heart rate variability: A meta-analysis. Psychol. Med. 2020, 50, 1937–1948. [Google Scholar] [CrossRef]
- Rabin, D.L.; Siegle, G.J. S87. Toward emotion prosthetics: Emotion regulation through wearable vibroacoustic stimulation. Biol. Psychiatry 2018, 83, S380–S381. [Google Scholar] [CrossRef]
- U. S. National Library of Medicine. Wearable Emotion Prosthetics for Post Traumatic Stress Disorder (EP-PTSD). Available online: https://clinicaltrials.gov/ct2/show/NCT03529981 (accessed on 29 March 2023).
- U. S. National Library of Medicine. Acceptability and Feasibility of Apollo in Veterans with a History of PTSD (Apollo PTSD). Available online: https://clinicaltrials.gov/ct2/show/NCT05019651 (accessed on 29 March 2023).
- U. S. National Library of Medicine. Sustaining Remission from PTSD Using Tuned Vibroacoustic Stimulation (TVS) Following MDMA-Assisted Psychotherapy. Available online: https://clinicaltrials.gov/ct2/show/NCT05274230 (accessed on 29 March 2023).
- Criswell, S.R.; Sherman, R.; Krippner, S. Cognitive behavioral therapy with heart rate variability biofeedback for adults with persistent noncombat-related posttraumatic stress disorder. Perm. J. 2018, 22, 17–207. [Google Scholar] [CrossRef] [PubMed]
- An, E.; Nolty, A.A.T.; Amano, S.S.; Rizzo, A.A.; Buckwalter, J.G.; Rensberger, J. Heart rate variability as an index of resilience. Mil. Med. 2020, 185, 363–369. [Google Scholar] [CrossRef] [PubMed]
- Pizzoli, S.F.M.; Marzorati, C.; Gatti, D.; Monzani, D.; Mazzocco, K.; Pravettoni, G. A meta-analysis on heart rate variability biofeedback and depressive symptoms. Sci. Rep. 2021, 11, 6650. [Google Scholar] [CrossRef] [PubMed]
- Zhang, L.; Qiu, S.; Zhao, C.; Wang, P.; Yu, S. Heart rate variability analysis in episodic migraine: A cross-sectional study. Front. Neurol. 2021, 12, 647092. [Google Scholar] [CrossRef] [PubMed]
- Azam, M.A.; Katz, J.; Mohabir, V.; Ritvo, P. Individuals with tension and migraine headaches exhibit increased heart rate variability during post-stress mindfulness meditation practice but a decrease during a post-stress control condition—A randomized, controlled experiment. Int. J. Psychophysiol. 2016, 110, 66–74. [Google Scholar] [CrossRef] [PubMed]
- Schroeder, E.B.; Liao, D.; Chambless, L.E.; Prineas, R.J.; Evans, G.W.; Heiss, G. Hypertension, blood pressure, and heart rate variability: The Atherosclerosis Risk in Communities (ARIC) study. Hypertension 2003, 42, 1106–1111. [Google Scholar] [CrossRef] [PubMed]
- Bolin, L.P.; Saul, A.D.; Bethune Scroggs, L.L.; Horne, C. A pilot study investigating the relationship between heart rate variability and blood pressure in young adults at risk for cardiovascular disease. Clin. Hypertens. 2022, 28, 2. [Google Scholar] [CrossRef]
- Hillebrand, S.; Gast, K.B.; de Mutsert, R.; Swenne, C.A.; Jukema, J.W.; Middeldorp, S.; Rosendaal, F.R.; Dekkers, O.M. Heart rate variability and first cardiovascular event in populations without known cardiovascular disease: Meta-analysis and dose-response meta-regression. Europace 2013, 15, 742–749. [Google Scholar] [CrossRef]
- Goldenberg, I.; Goldkorn, R.; Shlomo, N.; Einhorn, M.; Levitan, J.; Kuperstein, R.; Klempfner, R.; Johnson, B. Heart rate variability for risk assessment of myocardial ischemia in patients without known coronary artery disease: The HRV-DETECT (Heart Rate Variability for the Detection of Myocardial Ischemia) study. J. Am. Heart Assoc. 2019, 8, e014540. [Google Scholar] [CrossRef]
- Tsai, C.H.; Ma, H.P.; Lin, Y.T.; Hung, C.S.; Huang, S.H.; Chuang, B.L.; Lin, C.; Lo, M.T.; Peng, C.K.; Lin, Y.H. Usefulness of heart rhythm complexity in heart failure detection and diagnosis. Sci. Rep. 2020, 10, 14916. [Google Scholar] [CrossRef]
- Pradhapan, P.; Tarvainen, M.P.; Nieminen, T.; Lehtinen, R.; Nikus, K.; Lehtimaki, T.; Kahonen, M.; Viik, J. Effect of heart rate correction on pre- and post-exercise heart rate variability to predict risk of mortality-an experimental study on the FINCAVAS cohort. Front. Physiol. 2014, 5, 208. [Google Scholar] [CrossRef] [PubMed]
- La Rovere, M.T.; Pinna, G.D.; Maestri, R.; Mortara, A.; Capomolla, S.; Febo, O.; Ferrari, R.; Franchini, M.; Gnemmi, M.; Opasich, C.; et al. Short-term heart rate variability strongly predicts sudden cardiac death in chronic heart failure patients. Circulation 2003, 107, 565–570. [Google Scholar] [CrossRef] [PubMed]
- Goel, K.; Lennon, R.J.; Tilbury, R.T.; Squires, R.W.; Thomas, R.J. Impact of cardiac rehabilitation on mortality and cardiovascular events after percutaneous coronary intervention in the community. Circulation 2011, 123, 2344–2352. [Google Scholar] [CrossRef] [PubMed]
- Goel, K.; Pack, Q.R.; Lahr, B.; Greason, K.L.; Lopez-Jimenez, F.; Squires, R.W.; Zhang, Z.; Thomas, R.J. Cardiac rehabilitation is associated with reduced long-term mortality in patients undergoing combined heart valve and CABG surgery. Eur. J. Prev. Cardiol. 2015, 22, 159–168. [Google Scholar] [CrossRef] [PubMed]
- Jiménez-Navarro, M.F.; Lopez-Jimenez, F.; Pérez-Belmonte, L.M.; Lennon, R.J.; Diaz-Melean, C.; Rodriguez-Escudero, J.P.; Goel, K.; Crusan, D.; Prasad, A.; Squires, R.W.; et al. Benefits of cardiac rehabilitation on cardiovascular outcomes in patients with diabetes mellitus after percutaneous coronary intervention. J. Am. Heart Assoc. 2017, 6, e006404. [Google Scholar] [CrossRef] [PubMed]
- Jelinek, H.F.; Huang, Z.Q.; Khandoker, A.H.; Chang, D.; Kiat, H. Cardiac rehabilitation outcomes following a 6-week program of PCI and CABG Patients. Front. Physiol. 2013, 4, 302. [Google Scholar] [CrossRef]
- Lin, I.M.; Lin, P.Y.; Fan, S.Y. The effects of heart rate variability (HRV) biofeedback on HRV reactivity and recovery during and after anger recall task for patients with coronary artery disease. Appl. Psychophysiol. Biofeedback 2022, 47, 131–142. [Google Scholar] [CrossRef]
- Lin, I.M.; Fan, S.Y.; Lu, H.C.; Lin, T.H.; Chu, C.S.; Kuo, H.F.; Lee, C.S.; Lu, Y.H. Randomized controlled trial of heart rate variability biofeedback in cardiac autonomic and hostility among patients with coronary artery disease. Behav. Res. Ther. 2015, 70, 38–46. [Google Scholar] [CrossRef]
- Climov, D.; Lysy, C.; Berteau, S.; Dutrannois, J.; Dereppe, H.; Brohet, C.; Melin, J. Biofeedback on heart rate variability in cardiac rehabilitation: Practical feasibility and psycho-physiological effects. Acta Cardiol. 2014, 69, 299–307. [Google Scholar] [CrossRef]
- Szmigielska, K.; Jegier, A. The influence of cardiac rehabilitation on heart rate variability indices in men with type 2 diabetes and coronary artery disease. Diabetes Vasc. Dis. Res. 2021, 18, 14791641211020184. [Google Scholar] [CrossRef]
- Olde Bekkink, M.; Koeneman, M.; de Galan, B.E.; Bredie, S.J. Early detection of hypoglycemia in type 1 diabetes using heart rate variability measured by a wearable device. Diabetes Care 2019, 42, 689–692. [Google Scholar] [CrossRef] [PubMed]
- Zhang, L.; Zhou, J.; Ke, L.; Nie, Y.; Tong, Z.; Li, W.; Li, J. Role of heart rate variability in predicting the severity of severe acute pancreatitis. Dig. Dis. Sci. 2014, 59, 2557–2564. [Google Scholar] [CrossRef] [PubMed]
- Koeneman, M.; Koch, R.; van Goor, H.; Pickkers, P.; Kox, M.; Bredie, S. Wearable patch heart rate variability is an early marker of systemic inflammation during experimental human endotoxemia. Shock 2021, 56, 537–543. [Google Scholar] [CrossRef] [PubMed]
- Hirten, R.P.; Danieletto, M.; Tomalin, L.; Choi, K.H.; Zweig, M.; Golden, E.; Kaur, S.; Helmus, D.; Biello, A.; Pyzik, R.; et al. Use of physiological data from a wearable device to identify SARS-CoV-2 infection and symptoms and predict COVID-19 diagnosis: Observational study. J. Med. Internet Res. 2021, 23, e26107. [Google Scholar] [CrossRef] [PubMed]
- Natarajan, A.; Su, H.W.; Heneghan, C. Assessment of physiological signs associated with COVID-19 measured using wearable devices. NPJ Digit. Med. 2020, 3, 156. [Google Scholar] [CrossRef]
- Kamaleswaran, R.; Sadan, O.; Kandiah, P.; Li, Q.; Coopersmith, C.M.; Buchman, T.G. Altered heart rate variability early in ICU admission differentiates critically ill coronavirusdisease 2019 and all-cause sepsis patients. Crit. Care Explor. 2021, 3, e0570. [Google Scholar] [CrossRef] [PubMed]
- Eysenck, W.; Freemantle, N.; Sulke, N. A randomized trial evaluating the accuracy of AF detection by four external ambulatory ECG monitors compared to permanent pacemaker AF detection. J. Interv. Card. Electrophysiol. 2020, 57, 361–369. [Google Scholar] [CrossRef] [PubMed]
- Lubitz, S.A.; Faranesh, A.Z.; Atlas, S.J.; McManus, D.D.; Singer, D.E.; Pagoto, S.; Pantelopoulos, A.; Foulkes, A.S. Rationale and design of a large population study to validate software for the assessment of atrial fibrillation from data acquired by a consumer tracker or smartwatch: The Fitbit heart study. Am. Heart J. 2021, 238, 16–26. [Google Scholar] [CrossRef]
- Perez, M.V.; Mahaffey, K.W.; Hedlin, H.; Rumsfeld, J.S.; Garcia, A.; Ferris, T.; Balasubramanian, V.; Russo, A.M.; Rajmane, A.; Cheung, L.; et al. Large-scale assessment of a smartwatch to identify atrial fibrillation. N. Engl. J. Med. 2019, 381, 1909–1917. [Google Scholar] [CrossRef]
- Attia, Z.I.; Harmon, D.M.; Dugan, J.; Manka, L.; Lopez-Jimenez, F.; Lerman, A.; Siontis, K.C.; Noseworthy, P.A.; Yao, X.; Klavetter, E.W.; et al. Prospective evaluation of smartwatch-enabled detection of left ventricular dysfunction. Nat. Med. 2022, 28, 2497–2503. [Google Scholar] [CrossRef]
- Edward, K.L.; Garvey, L.; Aziz Rahman, M. Wearable activity trackers and health awareness: Nursing implications. Int. J. Nurs. Sci. 2020, 7, 179–183. [Google Scholar] [CrossRef] [PubMed]
- Altini, M.; Plews, D. What is behind changes in resting heart rate and heart rate variability? A large-scale analysis of longitudinal measurements acquired in free-living. Sensors 2021, 21, 7932. [Google Scholar] [CrossRef] [PubMed]
- Flatt, A.A.; Esco, M.R.; Allen, J.R.; Robinson, J.B.; Earley, R.L.; Fedewa, M.V.; Bragg, A.; Keith, C.M.; Wingo, J.E. Heart rate variability and training load among national collegiate athletic association division 1 college football players throughout spring camp. J. Strength Cond. Res. 2018, 32, 3127–3134. [Google Scholar] [CrossRef] [PubMed]
- Kemp, A.H.; Quintana, D.S. The relationship between mental and physical health: Insights from the study of heart rate variability. Int. J. Psychophysiol. 2013, 89, 288–296. [Google Scholar] [CrossRef]
- Manresa-Rocamora, A.; Sarabia, J.M.; Javaloyes, A.; Flatt, A.A.; Moya-Ramon, M. Heart rate variability-guided training for enhancing cardiac-vagal modulation, aerobic fitness, and endurance performance: A methodological systematic review with meta-analysis. Int. J. Environ. Res. Public Health 2021, 18, 10299. [Google Scholar] [CrossRef] [PubMed]
- Duking, P.; Zinner, C.; Trabelsi, K.; Reed, J.L.; Holmberg, H.C.; Kunz, P.; Sperlich, B. Monitoring and adapting endurance training on the basis of heart rate variability monitored by wearable technologies: A systematic review with meta-analysis. J. Sci. Med. Sport 2021, 24, 1180–1192. [Google Scholar] [CrossRef]
- Coutts, L.V.; Plans, D.; Brown, A.W.; Collomosse, J. Deep learning with wearable based heart rate variability for prediction of mental and general health. J. Biomed. Inform. 2020, 112, 103610. [Google Scholar] [CrossRef]
- Shi, M.; He, H.; Geng, W.; Wu, R.; Zhan, C.; Jin, Y.; Zhu, F.; Ren, S.; Shen, B. Early detection of sudden cardiac death by using ensemble empirical mode decomposition-based entropy and classical linear features from heart rate variability signals. Front. Physiol. 2020, 11, 118. [Google Scholar] [CrossRef]
- Morgan, C.A., 3rd; Aikins, D.E.; Steffian, G.; Coric, V.; Southwick, S. Relation between cardiac vagal tone and performance in male military personnel exposed to high stress: Three prospective studies. Psychophysiology 2007, 44, 120–127. [Google Scholar] [CrossRef]
- Plews, D.J.; Laursen, P.B.; Kilding, A.E.; Buchheit, M. Evaluating training adaptation with heart-rate measures: A methodological comparison. Int. J. Sports Physiol. Perform. 2013, 8, 688–691. [Google Scholar] [CrossRef]


| Device | Recording Method | Recording Period | Recording Length | Analysis |
|---|---|---|---|---|
| Apple Watch | PPG | Automatic when the wearer works out | 1 min | SDNN over the entire recording |
| Automatic when the wearer starts the Breathe app | Determined by user, up to 5 min | SDNN over the entire recording | ||
| Automatic every 10–15 min when the wearer enables the AF history | 1 min | SDNN over the entire recording | ||
| Fitbit Watch/Band | PPG | Automatic when the wearer sleeps | Whole sleep | RMSDD over the entire recording |
| Garmin Watch | PPG | Automatic when the wearer sleeps | Whole sleep | RMSDD for every 5 min length |
| Oura Ring | PPG | Automatic when the wearer sleeps | Whole sleep | RMSDD for every 5 min length |
| Automatic when the wearer starts unguided sessions | Determined by user, up to 180 min | RMSDD over the entire recording | ||
| Whoop Band | PPG | Automatic when the wearer sleeps | Whole sleep | Average of RR intervals over the entire recording |
| Automatic when the wearer switches the mode to “broadcasting” and connects to third party HRV apps | Determined by user | Beat-to-beat intervals | ||
| AIO Smart Sleeve | ECG | Manual start by the wearer | Determined by user | Beat-to-beat intervals |
| Firstbeat Sport Sensor | ECG | Manual start by the wearer | Determined by user | Beat-to-beat intervals |
| Polar H10 Strip | ECG | Manual start by the wearer | Determined by user | Beat-to-beat intervals |
| Zephyr Bioharness | ECG | Manual start by the wearer | Determined by user | Beat-to-beat intervals |
Disclaimer/Publisher’s Note: The statements, opinions and data contained in all publications are solely those of the individual author(s) and contributor(s) and not of MDPI and/or the editor(s). MDPI and/or the editor(s) disclaim responsibility for any injury to people or property resulting from any ideas, methods, instructions or products referred to in the content. |
© 2023 by the authors. Licensee MDPI, Basel, Switzerland. This article is an open access article distributed under the terms and conditions of the Creative Commons Attribution (CC BY) license (https://creativecommons.org/licenses/by/4.0/).
Share and Cite
Li, K.; Cardoso, C.; Moctezuma-Ramirez, A.; Elgalad, A.; Perin, E. Heart Rate Variability Measurement through a Smart Wearable Device: Another Breakthrough for Personal Health Monitoring? Int. J. Environ. Res. Public Health 2023, 20, 7146. https://doi.org/10.3390/ijerph20247146
Li K, Cardoso C, Moctezuma-Ramirez A, Elgalad A, Perin E. Heart Rate Variability Measurement through a Smart Wearable Device: Another Breakthrough for Personal Health Monitoring? International Journal of Environmental Research and Public Health. 2023; 20(24):7146. https://doi.org/10.3390/ijerph20247146
Chicago/Turabian StyleLi, Ke, Cristiano Cardoso, Angel Moctezuma-Ramirez, Abdelmotagaly Elgalad, and Emerson Perin. 2023. "Heart Rate Variability Measurement through a Smart Wearable Device: Another Breakthrough for Personal Health Monitoring?" International Journal of Environmental Research and Public Health 20, no. 24: 7146. https://doi.org/10.3390/ijerph20247146