
Prospective Associations between Maternal Depressive Symptoms during Early Infancy and Growth Deficiency from Childhood to Adolescence

 , ,
, ,
Abstract
:1. Prospective Associations between Maternal Depressive Symptoms during Early Infancy and Growth Deficiency from Childhood to Adolescence
2. Methods
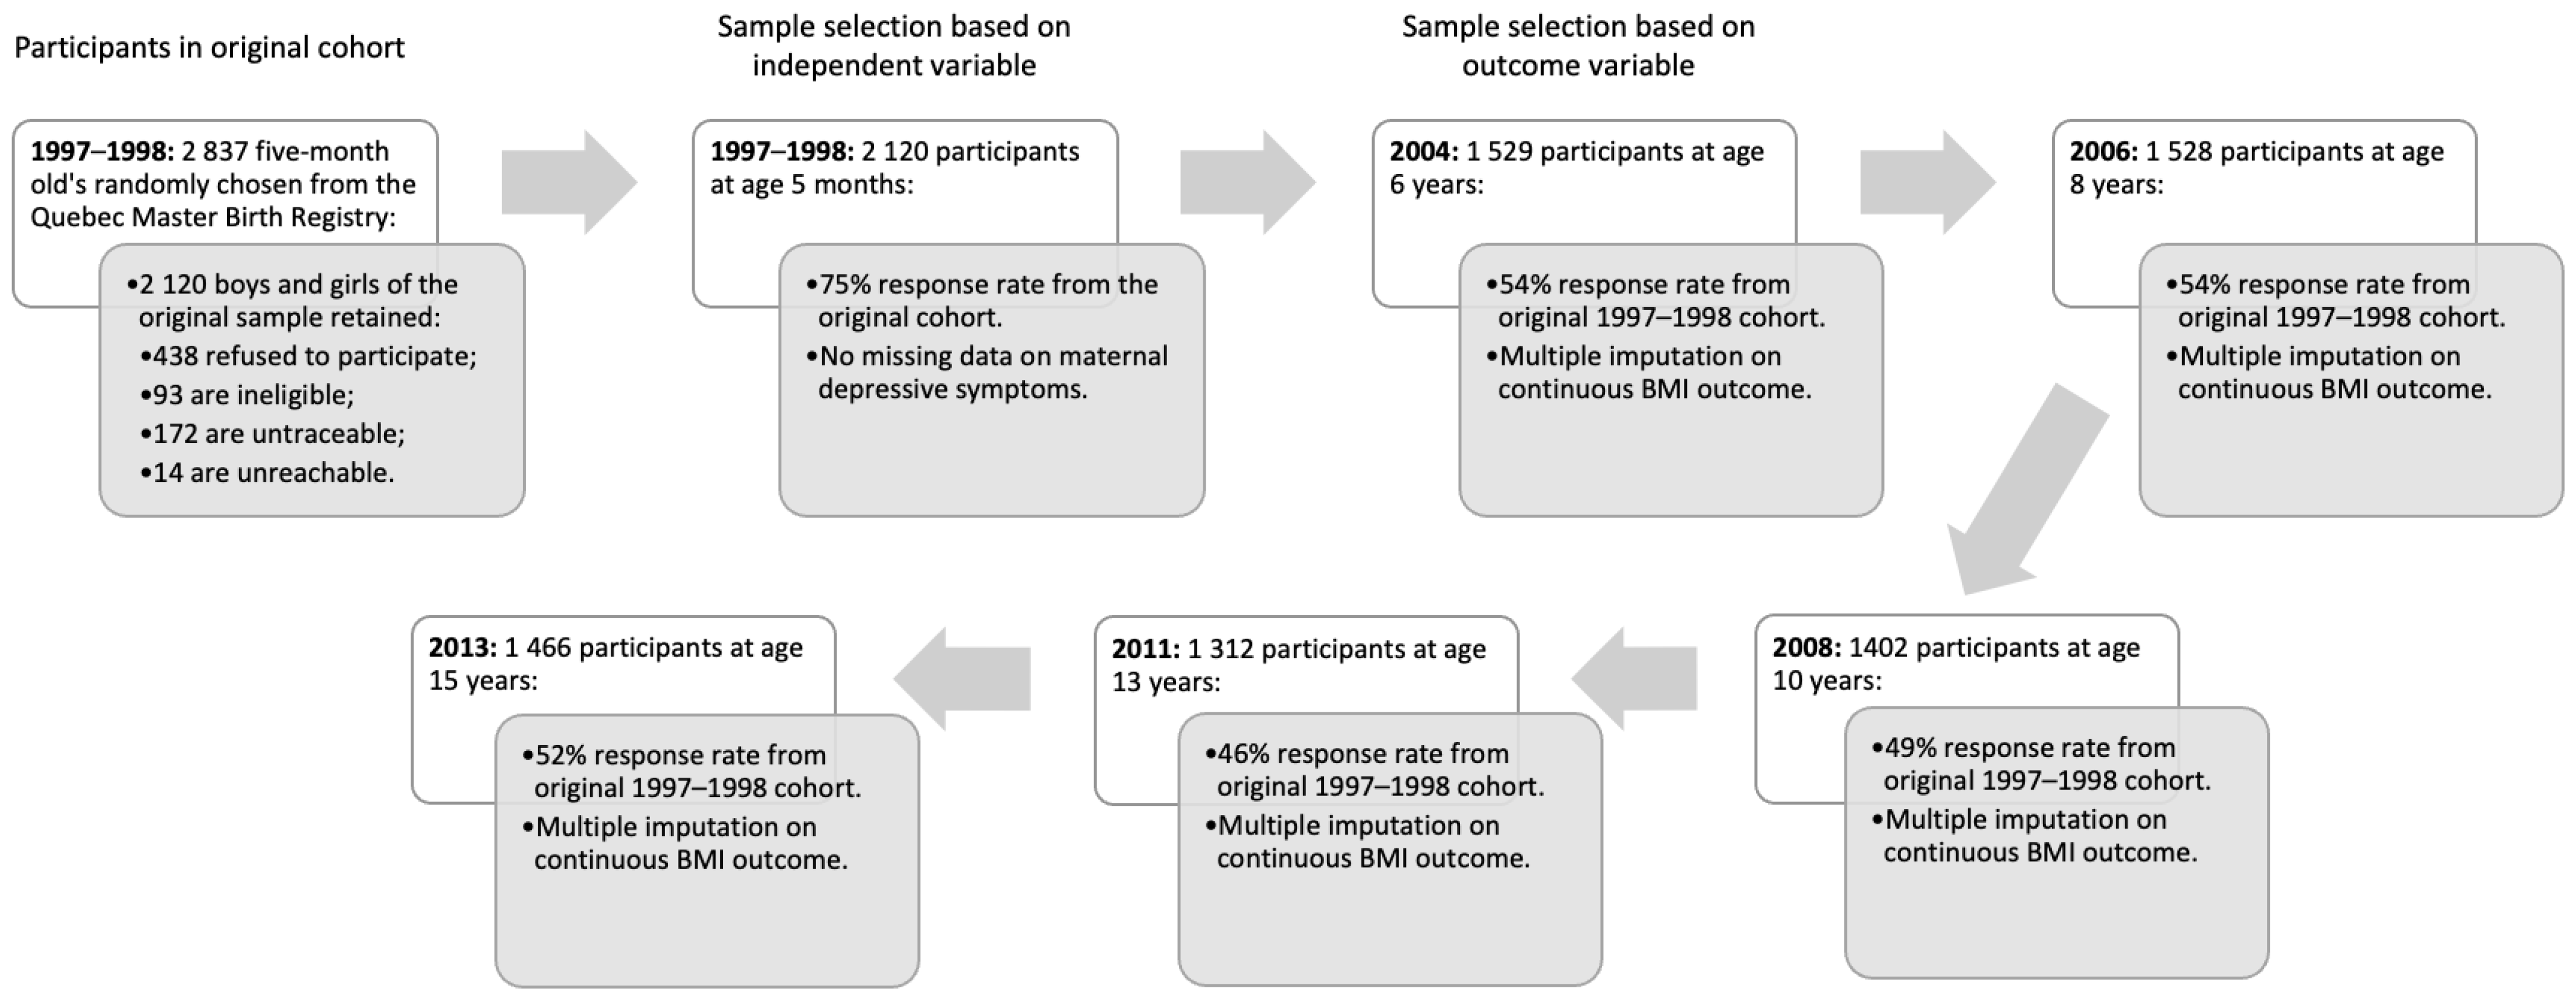
2.1. Participants
2.2. Measures
2.3. Data Analytic Procedures
3. Results
3.1. Descriptive Analyses
3.2. Baseline Characteristics as a Predictor of Severity of Maternal Depressive Symptoms in Infancy
3.3. Relationship between Baseline Characteristics and Subsequent Child BMI
3.4. Relationship between Maternal Depressive Symptoms in Infancy and Subsequent Child BMI
4. Discussion
5. Conclusions
Author Contributions
Funding
Institutional Review Board Statement
Informed Consent Statement
Data Availability Statement
Acknowledgments
Conflicts of Interest
References
- Alderdice, F. Supporting psychological well-being around the time of birth: What can we learn from maternity care? World Psychiatry 2020, 19, 332–333. [Google Scholar] [CrossRef] [PubMed]
- Gelaye, B.; Rondon, M.B.; Araya, R.; Williams, M.A. Epidemiology of maternal depression, risk factors, and child outcomes in low-income and middle-income countries. Lancet Psychiatry 2016, 3, 973–982. [Google Scholar] [CrossRef]
- Slomian, J.; Honvo, G.; Emonts, P.; Reginster, J.Y.; Bruyère, O. Consequences of maternal postpartum depression: A systematic review of maternal and infant outcomes. Women’s Health 2019, 15, 1745506519844044. [Google Scholar] [CrossRef]
- World Health Organization. WHO Recommendations on Maternal Health: Guidelines Approved by the WHO Guidelines Review Committee; WHO: Geneva, Switzerland, 2017; Available online: https://www.who.int/publications-detail-redirect/WHO-MCA-17.10 (accessed on 5 January 2023).
- Meltzer-Brody, S.; Howard, L.M.; Bergink, V.; Vigod, S.; Jones, I.; Munk-Olsen, T.; Honikman, S.; Milgrom, J. Postpartum psychiatric disorders. Nat. Rev. Dis. Primers 2018, 26, 18022. [Google Scholar] [CrossRef] [PubMed]
- American Psychiatric Association. Diagnostic and Statistical Manual of Mental Disorders, 5th ed.; American Psychiatric Association: Arlington, VA, USA, 2013. [Google Scholar] [CrossRef]
- Bernard, K.; Nissim, G.; Vaccaro, S.; Harris, J.L.; Lindhiem, O. Association between maternal depression and maternal sensitivity from birth to 12 months: A meta-analysis. Attach. Human Dev. 2018, 20, 578–599. [Google Scholar] [CrossRef]
- Jacques, N.; Mesenburg, M.A.; Matijasevich, A.; Domingues, M.R.; Bertoldi, A.D.; Stein, A.; Silveira, M.F. Trajectories of maternal depressive symptoms from the antenatal period to 24-months postnatal follow-up: Findings from the 2015 Pelotas birth cohort. BMC Psychiatry 2020, 20, 233. [Google Scholar] [CrossRef] [PubMed]
- Lampard, A.M.; Franckle, R.L.; Davison, K.K. Maternal depression and childhood obesity: A systematic review. Prev. Med. 2014, 59, 60–67. [Google Scholar] [CrossRef]
- Duarte, C.S.; Shen, S.; Wu, P.; Must, A. Maternal depression and child BMI: Longitudinal findings from a US sample. Pediatr. Obes. 2012, 7, 124–133. [Google Scholar] [CrossRef]
- Surkan, P.J.; Kennedy, C.E.; Hurley, K.M.; Black, M.M. Maternal depression and early childhood growth in developing countries: Systematic review and meta-analysis. Bull. World Health Organ. 2011, 89, 607–615. [Google Scholar] [CrossRef]
- McCurdy, K.; Tovar, A.; Kaar, J.L.; Vadiveloo, M. Pathways between maternal depression, the family environment, and child BMI z scores. Appetite 2019, 134, 148–154. [Google Scholar] [CrossRef]
- Lezo, A.; Baldini, L.; Asteggiano, M. Failure to thrive in the outpatient clinic: A new insight. Nutrients 2020, 12, 2202. [Google Scholar] [CrossRef] [PubMed]
- Wells, J.C.; Briend, A.; Boyd, E.M.; Berkely, J.A.; Hall, A.; Isanaka, S.; Webb, P.; Khara, T.; Dolan, C. Beyond wasted and stunted—A major shift to fight child undernutrition. Lancet Child. Adolesc. Health 2019, 3, 831–834. [Google Scholar] [CrossRef] [PubMed]
- Tang, M.N.; Adolphe, S.; Rogers, S.R.; Frank, D.A. Failure to thrive or growth faltering: Medical, developmental/behavioral, nutritional, and social dimensions. Pediatr. Rev. 2021, 42, 590–603. [Google Scholar] [CrossRef] [PubMed]
- Netsi, E.; Coll, C.V.; Stein, A.; Silveira, M.F.; Bertoldi, A.D.; Bassani, D.G.; Wehrmeister, F.C.; Domingues, M.R. Female infants are more susceptible to the effects of maternal antenatal depression; findings from the Pelotas (Brazil) Birth Cohort Study. J. Affect. 2020, 267, 315–324. [Google Scholar] [CrossRef]
- Trussell, T.M.; Ward, W.L.; Conners Edge, N.A. The impact of maternal depression on children: A call for maternal depression screening. Clin. Pediatr. 2018, 57, 1137–1147. [Google Scholar] [CrossRef] [PubMed]
- Howard, L.M.; Khalifeh, H. Perinatal mental health: A review of progress and challenges. World Psychiatry 2020, 19, 313–327. [Google Scholar] [CrossRef]
- Rich-Edwards, J.W.; Kaiser, U.B.; Chen, G.L.; Manson, J.E.; Goldstein, J.M. Sex and gender differences research design for basic, clinical, and population studies: Essentials for investigators. Endocr. Rev. 2018, 39, 424–439. [Google Scholar] [CrossRef]
- Schore, A.N. All our sons: The developmental neurobiology and neuroendocrinology of boys at risk. Infant Ment. Health J. 2017, 38, 15–52. [Google Scholar] [CrossRef]
- Letourneau, N.; Dewey, D.; Kaplan, B.J.; Ntanda, H.; Novick, J.; Thomas, J.C.; Deane, A.J.; Leung, B.; Pon, K.; Giesbrecht, G.F.; et al. Intergenerational transmission of adverse childhood experiences via maternal depression and anxiety and moderation by child sex. J. Dev. Orig. Health Dis. 2019, 10, 88–99. [Google Scholar] [CrossRef]
- Cho, J.; Holditch-Davis, D.; Miles, M.S. Effects of gender on the health and development of medically at-risk infants. J. Obstet. Gynecol. Neonatal Nurs. 2010, 39, 536–549. [Google Scholar] [CrossRef]
- Radloff, L.S. The CES-D scale: A self-report depression scale for research in the general population. Appl. Psychol. Meas. 1977, 1, 385–401. [Google Scholar] [CrossRef]
- Morin, A.J.; Moullec, G.; Maiano, C.; Layet, L.; Just, J.L.; Ninot, G. Psychometric properties of the Center for Epidemiologic Studies Depression Scale (CES-D) in French clinical and nonclinical adults. Rev. Epidemiol. Sante Publique 2011, 59, 327–340. [Google Scholar] [CrossRef] [PubMed]
- Himes, J.H. Challenges of accurately measuring and using BMI and other indicators of obesity in children. Pediatrics 2009, 124 (Suppl. S1), s3–s22. [Google Scholar] [CrossRef]
- Shekar, M.; Popkin, B. (Eds.) Obesity: Health and Economic Consequences of an Impending Global Challenge; World Bank Publications: Washington, DC, USA, 2020. [Google Scholar]
- Robins, L.N.; Helzer, J.E.; Croughan, J.; Ratcliff, K.S. National Institute of Mental Health diagnostic interview schedule: Its history, characteristics, and validity. Arch. Gen. Psychiatry 1981, 38, 381–389. [Google Scholar] [CrossRef]
- Epstein, N.B.; Baldwin, L.M.; Bishop, D.S. The McMaster Family Assessment Device. J. Marital. Fam. Ther. 1983, 9, 171–180. [Google Scholar] [CrossRef]
- Fitzpatrick, C.; Archambault, I.; Janosz, M.; Pagani, L.S. Early childhood working memory forecasts high school dropout risk. Intelligence 2015, 53, 160–165. [Google Scholar] [CrossRef]
- Bates, J.E.; Freeland, C.A.; Lounsbury, M.L. Measurement of infant difficultness. Child Dev. 1979, 1, 794–803. [Google Scholar] [CrossRef]
- Cummings, P. Missing data and multiple imputation. JAMA Pediatr. 2013, 167, 656–661. [Google Scholar] [CrossRef] [PubMed]
- Van Buuren, S. Flexible Imputation of Missing Data; CRC Press, Taylor and Francis Group: Boca Raton, FL, USA, 2018. [Google Scholar]
- Madley-Dowd, P.; Hughes, R.; Tilling, K.; Heron, J. The proportion of missing data should not be used to guide decisions on multiple imputation. J. Clin. Epidemiol. 2019, 110, 63–73. [Google Scholar] [CrossRef]
- Choe, D.E.; McDonough, S.C.; Sameroff, A.J.; Lawrence, A.C. Postnatal trajectories of maternal depressive symptoms: Postpartum antecedents and differences in toddler adjustment. Infant Ment. Health J. 2020, 41, 278–293. [Google Scholar] [CrossRef] [PubMed]
- Bonapersona, V.; Kentrop, J.; Van Lissa, C.J.; Van Der Veen, R.; Joëls, M.; Sarabdjitsingh, R.A. The behavioral phenotype of early life adversity: A 3-level meta-analysis of rodent studies. Neurosci. Biobehav. Rev. 2019, 102, 299–307. [Google Scholar] [CrossRef] [PubMed]
- al’Absi, M.; Ginty, A.T.; Lovallo, W.R. Neurobiological mechanisms of early life adversity, blunted stress reactivity and risk for addiction. Neuropharmacology 2021, 188, 108519. [Google Scholar] [CrossRef] [PubMed]
- Wall-Wieler, E.; Roos, L.L.; Gotlib, I.H. Maternal depression in early childhood and developmental vulnerability at school entry. Pediatrics 2020, 146, e20200794. [Google Scholar] [CrossRef] [PubMed]
- Śliwerski, A.; Kossakowska, K.; Jarecka, K.; Świtalska, J.; Bielawska-Batorowicz, E. The effect of maternal depression on infant attachment: A systematic review. Int. J. Environ. Res. Public Health 2020, 17, 2675. [Google Scholar] [CrossRef]
- Gómez-López, M.; Viejo, C.; Ortega-Ruiz, R. Well-being and romantic relationships: A systematic review in adolescence and emerging adulthood. Int. J. Environ. Res. Public Health 2019, 16, 2415. [Google Scholar] [CrossRef]
- Waters, L. Using positive psychology interventions to strengthen family happiness: A family systems approach. J. Posit. 2020, 15, 645–652. [Google Scholar] [CrossRef]


| Boys | Girls | |||||
|---|---|---|---|---|---|---|
| M (SD) | Categorical Variables (%) | Range | M (SD) | Categorical Variables (%) | Range | |
| Predictors (5 months) | ||||||
| Maternal depressive symptoms | 1.44 (1.40) | - | 0.00–10.00 | 1.37 (1.29) | - | 0.00–10.00 |
| Outcomes (ages 6 to 15 years) | ||||||
| Child BMI (age 6 years) | 15.88 (1.52) | - | 11.10–27.14 | 15.74 (1.78) | - | 11.92–31.00 |
| Child BMI (age 8 years) | 16.70 (2.08) | - | 9.69–29.45 | 16.72 (2.25) | - | 9.88–29.27 |
| Child BMI (age 10 years) | 18.48 (2.68) | - | 12.90–33.10 | 18.47 (2.84) | - | 13.00–41.30 |
| Child BMI (age 13 years) | 20.85 (3.34) | - | 13.70–40.60 | 21.05 (3.35) | - | 14.20–46.00 |
| Child BMI (age 15 years) | 21.20 (3.39) | - | 12.80–41.30 | 21.30 (3.48) | - | 14.60–46.60 |
| Control variables | ||||||
| Maternal antisocial antecedents (age 5 months) 1 = above the median | - | 25.8 | - | - | 25.0 | - |
| Paternal antisocial antecedents (age 5 months) 1 = above the median | - | 44.7 | - | - | 41.3 | - |
| Family configuration (age 5 months) 1 = non-intact | - | 18.4 | - | - | 19.6 | - |
| Family income (age 5 months) 1 = insufficient | - | 25.8 | - | - | 22.2 | - |
| Family dysfunction (age 5 months) 1 = above the median | - | 48.0 | - | - | 47.6 | - |
| Maternal education (age 5 months) 1 = did not finish high school | - | 15.9 | - | - | 16.1 | - |
| Paternal education (age 5 months) 1 = did not finish high school | - | 21.9 | - | - | 23.5 | - |
| Neurocognitive abilities (age 5 months) 1 = below the median | - | 52.1 | - | - | 51.9 | - |
| Preterm birth (age 5 months) 1 = preterm (<37 weeks) | - | 5.3 | - | - | 4.5 | - |
| Weight for gestational age (age 5 months) | 56.43 (8.58) | - | 15.23–86.15 | 55.29 (8.03) | - | 18.47–82.83 |
| Temperament problems (age 17 months) 1 = above the median | - | 48.3 | - | - | 47.3 | - |
| Maternal Depressive Symptoms (Age 5 Months) | ||
|---|---|---|
| Boys | Girls | |
| b (SE) [95% CI] | b (SE) [95% CI] | |
| Maternal antisocial antecedents (age 5 months) | 0.13 (0.11) [−0.09; 0.35] | 0.38 (0.11) *** [0.16; 0.59] |
| Paternal antisocial antecedents (age 5 months) | 0.08 (0.10) [−0.11; 0.27] | 0.15 (0.10) [−0.04; 0.34] |
| Family configuration (age 5 months) | 0.08 (0.15) [−0.23; 0.38] | −0.16 (0.14) [−0.43; 0.12] |
| Family income (age 5 months) | 0.41 (0.13) ** [0.15; 0.67] | 0.23 (0.13) [−0.03; 0.49] |
| Family dysfunction (age 5 months) | 0.80 (0.10) *** [0.61; 0.99] | 0.73 (0.09) *** [0.55; 0.91] |
| Maternal education (age 5 months) | 0.03 (0.15) [−0.27; 0.32] | −0.9 (0.15) [−0.38; 0.21] |
| Paternal education (age 5 months) | 0.11 (0.12) [−0.13; 0.36] | 0.13 (0.12) [−0.12; 0.37] |
| Neurocognitive abilities (age 5 months) | 0.00 (0.09) [−0.19; 0.18] | −0.08 (0.09) [−0.09; 0.26] |
| Preterm birth (age 5 months) | −0.07 (0.25) [−0.57; 0.42] | 0.09 (0.28) [−0.45; 0.64] |
| Weight for gestational age (age 5 months) | 0.01 (0.01) [−0.01; 0.02] | 0.00 (0.01) [−0.01; 0.01] |
| Temperament problems (age 17 months) | 0.15 (0.09) [−0.04; 0.33] | 0.00 (0.09) [−0.18; 0.17] |
| Adjusted R2 | 0.134 *** | 0.115 *** |
| BMI | ||||||
|---|---|---|---|---|---|---|
| Age 6 Years | Age 8 Years | Age 10 Years | Age 13 Years | Age 15 Years | ||
| b (SE) [95% CI] | b (SE) [95% CI] | b (SE) [95% CI] | b (SE) [95% CI] | b (SE) [95% CI] | ||
| Boys | Maternal depressive symptoms (age 5 months) | −0.04 (0.02) * [−0.08; −0.001] | −0.02 (0.02) [−0.06; 0.03] | 0.01 (0.02) [−0.03; 0.05] | −0.01 (0.02) [−0.05; 0.03] | −0.01 (0.02) [−0.06; 0.03] |
| Maternal antisocial antecedents (age 5 months) | −0.02 (0.07) [−0.15; 0.12] | −0.01 (0.07) [−0.14; 0.13] | 0.06 (0.07) [−0.08; 0.19] | 0.10 (0.07) [−0.04; 0.23] | 0.15 (0.07) * [0.01; 0.28] | |
| Paternal antisocial antecedents (age 5 months) | 0.15 (0.06) * [0.02; 0.27] | 0.07 (0.06) [−0.06; 0.19] | 0.08 (0.07) [−0.05; 0.20] | −0.02 (0.06 [−0.14; 0.11] | −0.02 (0.06) [−0.14; 0.11] | |
| Family configuration (age 5 months) | 0.16 (0.08) * [0.01; 0.31] | 0.20 (0.08) ** [0.05; 0.35] | 0.14 (0.08) [−0.01; 0.29] | 0.17 (0.08) * [0.02; 0.32] | 0.18 (0.08) * [0.03; 0.33] | |
| Family income (age 5 months) | 0.27 (0.07) *** [0.14; 0.41] | 0.21 (0.07) ** [0.08; 0.34] | 0.30 (0.07) *** [0.17; 0.44] | 0.22 (0.07) *** [0.08; 0.35] | 0.31 (0.07) *** [0.17; 0.44] | |
| Family dysfunction (age 5 months) | −0.02 (0.06) [−0.14; 0.09] | 0.14 (0.06) * [0.02; 0.25] | 0.04 (0.06) [−0.07; 0.16] | −0.01 (0.06) [−0.13; 0.11] | 0.01 (0.06) [−0.11; 0.12] | |
| Maternal education (age 5 months) | 0.06 (0.08) [−0.10; 0.22] | −0.03 (0.08) [−0.19; 0.13] | 0.13 (0.08) [−0.03; 0.29] | −0.07 (0.08) [−0.23; 0.09] | 0.33 (0.08) *** [0.17; 0.49] | |
| Paternal education (age 5 months) | 0.09 (0.07) [−0.06; 0.23] | 0.26 (0.07) *** [0.11; 0.40] | 0.26 (0.07) *** [0.12; 0.40] | 0.35 (0.07) *** [0.21; 0.49] | 0.23 (0.07) ** [0.09; 0.37] | |
| Neurocognitive abilities (age 5 months) | −0.01 (0.07) [−0.12; 0.14] | 0.01 (0.07) [−0.14; 0.13] | 0.02 (0.07) [−0.15; 0.12] | −0.04 (0.07) [−0.09; 0.17] | −0.06 (0.07) [−0.07; 0.19] | |
| Preterm birth (age 5 months) | 0.50 (0.13) *** [0.24; 0.76] | 0.08 (0.13) [−0.18; 0.34] | 0.11 (0.13) [−0.15; 0.37] | 0.48 (0.13) *** [0.22; 0.74] | 0.46 (0.13) *** [0.20; 0.72] | |
| Weight for gestational age (age 5 months) | 0.01 (0.00) ** [0.002; 0.02] | 0.02 (0.00) *** [0.01; 0.02] | 0.01 (0.00) ** [0.002; 0.02] | 0.01 (0.00) ** [0.003; 0.02] | 0.01 (0.00) ** [0.004; 0.02] | |
| Temperament problems (age 17 months) | −0.09 (0.07) [−0.23; 0.05] | −0.25 (0.07) *** [−0.39; −0.11] | −0.21 (0.07) ** [−0.35; −0.08] | −0.22 (0.07) *** [−0.36; −0.09] | 0.01 (0.07) [−0.13; 0.15] | |
| Girls | Maternal depressive symptoms (age 5 months) | −0.02 (0.02) [−0.07; 0.03] | 0.04 (0.02) [−0.01; 0.08] | 0.06 (0.02) ** [0.02; 0.11] | 0.05 (0.02) * [0.000; 0.09] | 0.03 (0.02) [−0.01; 0.08] |
| Maternal antisocial antecedents (age 5 months) | 0.09 (0.07) [−0.05; 0.23] | 0.19 (0.07) ** [0.05; 0.33] | 0.08 (0.07) [−0.06; 0.22] | 0.19 (0.07) ** [0.05; 0.33] | 0.14 (0.07) * [0.000; 0.28] | |
| Paternal antisocial antecedents (age 5 months) | 0.06 (0.07) [−0.07; 0.19] | 0.04 (0.07) [−0.09; 0.17] | 0.11 (0.07) [−0.02; 0.24] | 0.15 (0.07)* [0.02; 0.28] | 0.08 (0.06) [−0.05; 0.21] | |
| Family configuration (age 5 months) | 0.34 (0.08) *** [0.19; 0.49] | 0.25 (0.08) *** [0.10; 0.40] | 0.44 (0.08) *** [0.29; 0.59] | 0.23 (0.08) ** [0.08; 0.38] | 0.10 (0.08) [−0.06; 0.25] | |
| Family income (age 5 months) | −0.06 (0.07) [−0.20; 0.09] | 0.14 (0.07) [−0.01; 0.28] | 0.38 (0.07) *** [0.23; 0.52] | 0.29 (0.07) *** [0.14; 0.43] | 0.28 (0.07) *** [0.14; 0.42] | |
| Family dysfunction (age 5 months) | 0.18 (0.06) ** [0.06; 0.30] | 0.12 (0.06) * [0.001; 0.24] | 0.19 (0.06) ** [0.07; 0.31] | 0.13 (0.06) * [0.01; 0.25] | 0.17 (0.06) ** [0.05; 0.29] | |
| Maternal education (age 5 months) | 0.19 (0.08) * [0.02; 0.35] | 0.10 (0.08) [−0.06; 0.27] | 0.46 (0.08) *** [0.30; 0.62] | 0.40 (0.08) *** [0.24; 0.56] | 0.37 (0.08) *** [0.21; 0.53] | |
| Paternal education (age 5 months) | 0.28 (0.08) *** [0.13; 0.42] | 0.34 (0.07) *** [0.20; 0.48] | 0.31 (0.07) *** [0.16; 0.45] | 0.40 (0.07) *** [0.25; 0.54] | 0.26 (0.07) *** [0.12; 0.40] | |
| Neurocognitive abilities (age 5 months) | 0.16 (0.07) ** [−0.29; −0.03] | 0.20 (0.07) ** [−0.33; −0.06] | 0.14 (0.07) * [−0.27; −0.01] | 0.02 (0.07) [−0.16; 0.11] | 0.02 (0.07) [−0.15; 0.12] | |
| Preterm birth (age 5 months) | −0.14 (0.15) [−0.43; 0.15] | 0.08 (0.15) [−0.21; 0.37] | 0.40 (0.15) ** [0.11; 0.68] | 0.24 (0.15) [−0.05; 0.52] | 0.24 (0.15) * [0.05; 0.63] | |
| Weight for gestational age (age 5 months) | 0.02 (0.00) *** [0.02; 0.03] | 0.02 (0.00) *** [0.01; 0.02] | 0.02 (0.00) *** [0.01; 0.02] | 0.01 (0.00) *** [0.01; 0.02] | 0.01 (0.00) [−0.001; 0.01] | |
| Temperament problems (age 17 months) | −0.01 (0.07) [−0.15; 0.13] | 0.05 (0.07) [−0.09; 0.19] | 0.08 (0.07) [−0.06; 0.22] | 0.02 (0.07) [−0.12; 0.16] | −0.08 (0.07) [−0.21; 0.06] | |
| BMI | ||||||
|---|---|---|---|---|---|---|
| Age 6 Years | Age 8 Years | Age 10 Years | Age 13 Years | Age 15 Years | ||
| b (SE) [95% CI] | b (SE) [95% CI] | b (SE) [95% CI] | b (SE) [95% CI] | b (SE) [95% CI] | ||
| Boys | Maternal depressive symptoms (age 5 months) | −0.11 (0.03) *** [−0.17; −0.04] | −0.09 (0.03) ** [−0.16; −0.03] | −0.07 (0.03) * [−0.13; 0.002] | −0.08 (0.03) * [−0.14; −0.01] | −0.09 (0.03) ** [−0.16; −0.03] |
| Maternal antisocial antecedents (age 5 months) | −0.17 (0.09) [−0.35; 0.01] | −0.11 (0.10) [−0.29; 0.08] | −0.08 (0.10) [−0.27; 0.11] | 0.00 (0.09) [−0.19; 0.19] | 0.04 (0.09) [−0.14; 0.22] | |
| Paternal antisocial antecedents (age 5 months) | 0.19 (0.08) * [0.04; 0.35] | 0.13 (0.08) [−0.03; 0.29] | 0.13 (0.08) [−0.04; 0.29] | 0.02 (0.08) [−0.14; 0.18] | −0.02 (0.08) [−0.18; 0.13] | |
| Family configuration (age 5 months) | 0.04 (0.13) [−0.21; 0.28] | 0.03 (0.13) [−0.23; 0.28] | 0.01 (0.13) [−0.26; 0.27] | −0.01 (0.13) [−0.27; 0.24] | 0.11 (0.13) [−0.13; 0.36] | |
| Family income (age 5 months) | 0.17 (0.11) [−0.05; 0.39] | 0.21 (0.11) [−0.02; 0.43] | 0.29 (0.12) ** [0.06; 0.51] | 0.23 (0.11) * [0.01; 0.45] | 0.28 (0.11) ** [0.07; 0.50] | |
| Family dysfunction (age 5 months) | 0.00 (0.08) [−0.17; 0.16] | 0.22 (0.09) ** [0.05; 0.39] | −0.01 (0.09) [−0.19; 0.16] | −0.01 (0.09) [−0.17; 0.16] | 0.02 (0.08) [−0.14; 0.18] | |
| Maternal education (age 5 months) | 0.04 (0.12) [−0.21; 0.28] | −0.25 (0.13) * [−0.50; −0.002] | −0.15 (0.13) [−0.40; 0.11] | −0.36 (0.13) ** [−0.61; −0.11] | 0.13 (0.12) [−0.11; 0.37] | |
| Paternal education (age 5 months) | 0.07 (0.10) [−0.13; 0.27] | 0.31 (0.10) ** [0.11; 0.51] | 0.22 (0.11) * [0.005; 0.43] | 0.41 (0.10) *** [0.20; 0.61] | 0.12 (0.10) [−0.08; 0.32] | |
| Neurocognitive abilities (age 5 months) | 0.08 (0.08) [−0.23; 0.07] | 0.03 (0.08) [−0.19; 0.12] | 0.07 (0.08) [−0.23; 0.09] | −0.04 (0.08) [−0.12; 0.19] | −0.05 (0.08) [−0.10; 0.20] | |
| Preterm birth (age 5 months) | 0.80 (0.21) *** [0.40; 1.21] | 0.45 (0.21) * [0.03; 0.86] | 0.40 (0.22) [−0.02; 0.83] | 0.74 (0.21) *** [0.32; 1.15] | 0.51 (0.21) ** [0.11; 0.91] | |
| Weight for gestational age (age 5 months) | 0.02 (0.01) *** [0.01; 0.03] | 0.02 (0.01) *** [0.01; 0.03] | 0.01 (0.01) * [0.002; 0.02] | 0.02 (0.01) *** [0.01; 0.03] | 0.02 (0.01) ** [0.006; 0.03] | |
| Temperament problems (age 17 months) | −0.09 (0.08) [−0.25; 0.06] | −0.25 (0.08) ** [−0.41; −0.09] | −0.19 (0.08) * [−0.35; −0.03] | −0.19 (0.08) ** [−0.35; −0.04] | −0.01 (0.08) [−0.16; 0.14] | |
| Adjusted R2 | 0.052 *** | 0.065 *** | 0.030 *** | 0.079 *** | 0.031 *** | |
| Girls | Maternal depressive symptoms (age 5 months) | −0.02 (0.04) [−0.09; 0.05] | 0.01 (0.04) [−0.07; 0.07] | 0.01 (0.04) [−0.06; 0.08] | 0.03 (0.04) [−0.04; 0.10] | −0.01 (0.03) [−0.07; 0.06] |
| Maternal antisocial antecedents (age 5 months) | 0.10 (0.10) [−0.09; 0.29] | 0.20 (0.10) * [0.003; 0.39] | 0.07 (0.10) [−0.12; 0.26] | 0.13 (0.10) [−0.06; 0.32] | 0.08 (0.09) [−0.10; 0.27] | |
| Paternal antisocial antecedents (age 5 months) | −0.02 (0.08) [−0.19; 0.14] | −0.04 (0.09) [−0.21; 0.13] | 0.13 (0.08) [−0.04; 0.29] | 0.07 (0.08) [−0.10; 0.23] | 0.07 (0.08) [−0.09; 0.23] | |
| Family configuration (age 5 months) | 0.48 (0.12) *** [0.24; 0.72] | 0.36 (0.13) * [0.01; 0.50] | 0.33 (0.12) ** [0.09; 0.57] | −0.01 (0.12) [−0.25; 0.23] | −0.08 (0.12) [−0.31; 0.16] | |
| Family income (age 5 months) | −0.25 (0.12) * [−0.48; −0.02] | −0.05 (0.12) [−0.29; 0.18] | −0.08 (0.12) [−0.31; 0.15] | 0.00 (0.12) [−0.23; 0.23] | 0.13 (0.12) [−0.10; 0.36] | |
| Family dysfunction (age 5 months) | 0.22 (0.08) ** [0.05; 0.38] | 0.16 (0.09) [−0.01; 0.33] | 0.17 (0.08) * [0.004; 0.33] | 0.10 (0.08) [−0.07; 0.27] | 0.14 (0.08) [−0.02; 0.30] | |
| Maternal education (age 5 months) | 0.05 (0.13) [−0.21; 0.31] | −0.18 (0.13) [−0.44; 0.08] | 0.12 (0.13) [−0.14; 0.38] | 0.18 (0.13) [−0.08; 0.44] | 0.16 (0.13) [−0.09; 0.41] | |
| Paternal education (age 5 months) | 0.26 (0.11) * [0.05; 0.47] | 0.46 (0.11) *** [0.24; 0.67] | 0.16 (0.11) [−0.05; 0.38] | 0.32 (0.11) ** [0.11; 0.53] | 0.17 (0.11) [−0.04; 0.38] | |
| Neurocognitive abilities (age 5 months) | 0.17 (0.08) * [−0.32; −0.01] | 0.20 (0.08) ** [−0.35; −0.04] | 0.12 (0.08) [−0.27; 0.04] | −0.01 (0.08) [−0.14; 0.17] | 0.08 (0.08) [−0.23; 0.07] | |
| Preterm birth (age 5 months) | 0.24 (0.24) [−0.24; 0.72] | 0.50 (0.25) * [0.01; 0.98] | 0.78 (0.24) *** [0.31; 1.26] | 0.72 (0.25) ** [0.23; 1.20] | 0.58 (0.24) ** [0.11; 1.05] | |
| Weight for gestational age (age 5 months) | 0.03 (0.01) *** [0.01; 0.04] | 0.02 (0.01) *** [0.01; 0.03] | 0.03 (0.01) *** [0.02; 0.04] | 0.02 (0.01) *** [0.01; 0.03] | 0.01 (0.01) * [0.003; 0.02] | |
| Temperament problems (age 17 months) | −0.05 (0.08) [−0.20; 0.11] | 0.00 (0.08) [−0.16; 0.15] | 0.07 (0.08) [−0.08; 0.22] | 0.01 (0.08) [−0.15; 0.16] | −0.14 (0.08) [−0.29; 0.01] | |
| Adjusted R2 | 0.075 *** | 0.065 *** | 0.073 *** | 0.049 *** | 0.029 ** | |
Disclaimer/Publisher’s Note: The statements, opinions and data contained in all publications are solely those of the individual author(s) and contributor(s) and not of MDPI and/or the editor(s). MDPI and/or the editor(s) disclaim responsibility for any injury to people or property resulting from any ideas, methods, instructions or products referred to in the content. |
© 2023 by the authors. Licensee MDPI, Basel, Switzerland. This article is an open access article distributed under the terms and conditions of the Creative Commons Attribution (CC BY) license (https://creativecommons.org/licenses/by/4.0/).
Share and Cite
Pagani, L.S.; Harandian, K.; Necsa, B.; Harbec, M.-J. Prospective Associations between Maternal Depressive Symptoms during Early Infancy and Growth Deficiency from Childhood to Adolescence. Int. J. Environ. Res. Public Health 2023, 20, 7117. https://doi.org/10.3390/ijerph20237117
Pagani LS, Harandian K, Necsa B, Harbec M-J. Prospective Associations between Maternal Depressive Symptoms during Early Infancy and Growth Deficiency from Childhood to Adolescence. International Journal of Environmental Research and Public Health. 2023; 20(23):7117. https://doi.org/10.3390/ijerph20237117
Chicago/Turabian StylePagani, Linda S., Kianoush Harandian, Beatrice Necsa, and Marie-Josée Harbec. 2023. "Prospective Associations between Maternal Depressive Symptoms during Early Infancy and Growth Deficiency from Childhood to Adolescence" International Journal of Environmental Research and Public Health 20, no. 23: 7117. https://doi.org/10.3390/ijerph20237117