Article

Sports Utility Vehicles: A Public Health Model of Their Climate and Air Pollution Impacts in the United Kingdom

1
Centre for Climate and Health Security, UK Health Security Agency, London SW1P 3HX, UK
2
Department of Public Health, Environments and Society, London School of Hygiene and Tropical Medicine, London WC1E 7HT, UK
3
Centre on Climate Change and Planetary Health, London School of Hygiene and Tropical Medicine, London WC1E 7HT, UK
4
Department of Public Health, London Borough of Enfield Council, London EN1 3XA, UK
5
Environmental Epidemiology Team, UK Health Security Agency, Chilton OX11 0RQ, UK
*
Author to whom correspondence should be addressed.
Deceased.
Int. J. Environ. Res. Public Health 2023, 20(11), 6043; https://doi.org/10.3390/ijerph20116043
Submission received: 30 March 2023 / Revised: 29 May 2023 / Accepted: 31 May 2023 / Published: 2 June 2023
(This article belongs to the Section Environmental Science and Engineering)

Abstract

:
The emission benefits of shifting towards battery electric vehicles have so far been hampered by a trend towards sports utility vehicles (SUVs). This study assesses the current and future emissions from SUVs and their potential impact on public health and climate targets. We modelled five scenarios of varying SUV sales and electrification rates, and projected associated carbon dioxide (CO2) and nitrogen oxide (NOx) emissions. Multiple linear regression was used to determine the relationship between vehicle characteristics and emissions. Cumulative CO2 emissions were valued using the social cost of carbon approach. Life table analyses were used to project and value life years saved from NOx emission reductions. Larger SUVs were disproportionately high emitters of CO2 and NOx. Replacing these with small SUVs achieved significant benefits, saving 702 MtCO2e by 2050 and 1.8 million life years from NO2 reductions. The largest benefits were achieved when combined with electrification, saving 1181 MtCO2e and gaining 3.7 million life years, with a societal value in the range of GBP 10–100s billion(s). Downsizing SUVs could be associated with major public health benefits from reduced CO2 and NOx emissions, in addition to the benefits of electrification. This could be achieved by demand-side mass-based vehicle taxation and supply-side changes to regulations, by tying emission limits to a vehicle’s footprint rather than its mass.

1. Introduction

Internal combustion engine (ICE) cars are major drivers of climate change and air pollution, both of which harm public health [1]. Climate change is considered one of the greatest threats to global public health and requires urgent adaptation and mitigation responses [2]. The United Kingdom (UK) has committed to achieving net zero, i.e., zero greenhouse gas (GHG) emissions or balanced by removal from the atmosphere, by 2050 under the Climate Change Act 2008 [3]. Decarbonising road transport is vital to achieving this, as, in 2021, it was responsible for 23.5% of net GHG emissions, the highest of any sector [4].
Similarly, transport-related air pollutants are known to be a major determinant of ill-health worldwide [5], with increased health risks, including respiratory, cardiovascular and neoplastic diseases [6]. Exposure to nitrogen dioxide (NO2), a product of fossil fuel combustion, is thought to have a causal detrimental impact on health [7,8]. In 2015, the UK Government estimated that long-term NO2 exposure increased mortality by up to 23,500 deaths per year nationally [9]. Following repeated NO2 concentration limit breaches, subsequent legal action [10,11] and public anger following the diesel emission scandals [12], controlling NO2 remains a policy priority [13]. In 2021, road transport was responsible for 27.3% of UK annual nitrogen oxides (NOx) (a collective term for nitric oxide and NO2 emissions), again the largest contributing sector [14].
Technological advances have enabled the implementation of policies aiming to decarbonise transport, such as the UK Government plan to ban ICE passenger vehicles by 2035 [15]. This policy could realise major co-benefits for public health by also reducing air pollution. Battery electric vehicles (BEVs) are expected to be the dominant replacement for ICE vehicles [15] and have zero tailpipe emissions. However, whilst a transition to BEVs would generally be expected to reduce CO2 and air pollution emissions, there are several limitations and caveats [16]. For example, the overall environmental health impacts of BEVs depend on both the source of electricity [17,18,19] and pollution relating to the production of components [17,18,19,20]. There is also uncertainty regarding non-tailpipe emissions (brake, tyre, and road surface wear particles), which could worsen with the increased weight of BEVs [21,22] or conversely improve due to regenerative braking and improved tyre design [23]. Despite these issues, a net mortality benefit of electrification has been projected in France [24], the United States [25,26], and Australia [27]. In California, BEVs have already been associated with improved air quality [28], with related possible morbidity improvements [29].
However, these potential benefits of electrification have been negated by the increasing market share of heavier vehicles, especially sports utility vehicles (SUVs) [30]. In 2019, SUVs accounted for over 44% of car sales globally, up from 20% in 2010, with a similar trend seen in the UK [31]. The International Energy Agency (IEA) estimates that SUVs were the second largest cause of energy-related GHG emission growth over the last decade (after electricity generation) [31]. This GHG emission growth more than offset savings in improvements in energy efficiency and electrification of vehicles. The popularity of SUVs has risen due to consumers’ preference for a high-riding position, style, perceived and real utility gains, and strong advertising by auto-manufactures, reflecting the higher profit margins for SUVs over other segments [32,33,34]. As SUVs are typically heavy, large, and powerful vehicles, they tend to have increased inertia and rolling resistance [35,36,37] and worse aerodynamics [35,36,37]. As a result, they tend to have poorer fuel efficiency than smaller and lighter vehicles of the same fuel type [38]. This would be expected to increase tailpipe emissions and be at odds with the government’s ambitions to address air pollution and climate change.
Despite the potential for the growth of SUVs to undermine decarbonisation and air quality policies, this issue has not been extensively investigated from a public health perspective. Investigations into the health impact of SUVs have instead concentrated on safety in collisions. They suggest a marked increased risk of mortality for pedestrians, cyclists [39,40,41], and occupants of conventional cars when involved in collisions with an SUV [42,43]. To our knowledge, there are no peer-reviewed studies in the literature assessing the public health impact of SUVs from their tailpipe emissions. Whilst health impact assessments from abated particulate matter have been conducted on multisectoral UK climate mitigation pathways [44], the health impact of the UK’s planned phase out of new ICE vehicles by 2035 has not been studied in isolation or with regard to NOx. Understanding the impact of SUVs is of urgent importance due to the rapidly increasing popularity of SUVs at the same time as the need for bold decarbonisation of the sector.
This study aims, for the first time, to model the current and future public health and climate impact of SUVs, in relation to NOx and CO2 emissions, to inform UK decarbonisation and air pollution policies. To achieve this aim, the novel objectives of the study are as follows. First, we aim to determine the absolute contribution of SUV tailpipe NOx and CO2 emissions, and their relative contribution to the total UK passenger vehicle fleet emissions. Second, we aim to investigate the relationship between SUV characteristics (such as vehicle mass) and CO2 and NOx emissions. Third, we aim to explore how passenger vehicle CO2 and NOx emissions could differ by 2050 by projecting various policy scenarios that change SUV sales during the phase out of ICE vehicles. Fourth, we aim to quantify the relative potential public health impacts between projections. Finally, this study will also estimate, for the first time, the public health impact of changes in NO2 from the UK policy to phase out ICE passenger vehicles by 2035.

2. Materials and Methods

2.1. Conceptual Framework

This study uses a bottom-up approach to model the current and future tailpipe emissions of the UK passenger vehicle fleet under various scenarios. The model is built from data on the emission profiles of individual cars registered for road use in the UK. The CO2 and NOx model have differing aims (to compare cumulative CO2 emissions and to inform life table health calculations) and, therefore, differ in their conceptual construction. The scenarios are designed to mimic a diversity of possible policy approaches. Multiple linear regression is used to determine which vehicle characteristics may explain the differences in emissions between policies.
The CO2 model assesses the climate impact of new cars added to the UK fleet overtime from the end of 2020. The model does not measure emissions from the existing UK fleet. This is because it is the cumulative CO2 that is generated following the introduction of a policy (in this model introduced at the end of 2020) that affects new car sales in which we are interested. For example, this could be a policy switching from larger to smaller SUVs, or a proportional replacement of ICE vehicles with BEVs. This model allows the interrogation of the relative performance of a policy as a climate mitigation measure, at any point in the future. The CO2 model controls for vehicle stock turnover from 2020 onwards, using historical data patterns. It also includes the carbon emitted from the generation of electricity used to power BEVs in the fleet.
The NOx model is more complicated as emissions from the entire UK fleet need to be calculated to project relative atmospheric changes in NO2. First the NOx emissions for all passenger vehicles registered in previous years are calculated. Older vehicles produce significantly more NOx as they would have complied with earlier and less stringent European (EURO) emission standards. Then, the NOx emissions of new vehicles each subsequent year are added whilst older vehicles are phased out using the same stock turnover model as for the CO2 model. The changes in total fleet NOx emissions can then be compared to a baseline of business as usual and translated to proportional changes in atmospheric NO2 concentrations. The change in atmospheric NO2 concentrations can then inform life table calculations to calculate the public health impact.

2.2. Data Handling and Multiple Linear Regression

All passenger vehicle models with 250 or more new registrations recorded by the Driver and Vehicle Licensing Agency (DVLA) in the fourth quarter (Q4) of 2020 were selected for analysis (dataset VEH0161) [45]. Data on the real driving emissions (RDE) test for NOx emissions by make and model of vehicle was sourced from the UK’s Vehicle Certification Agency [46]. Vehicle characteristics and worldwide harmonised light vehicles test procedure (WLTP) CO2 emissions were sourced from the European Environment Agency (EEA) database on all new passenger vehicles registered in the EU and Great Britain [47]. Data extracted included kerb weight, WLTP test weight, fuel type, engine capacity, wheelbase length, and WLTP CO2 emissions for make, as well as specific model variants. The bestselling variant of any generic car model was assumed to be indicative of all variants sold. These three data sources were manually combined so that for each vehicle model, its characteristics, pollutant profile, and number of registrations were known.
Each vehicle model in the database was assigned a EURO segment category according to the manufacturer’s website (examples in Table 1). The SUV segment was sub-categorised by mass, with small defined as <1500 kg (similar to A, B, and C segments), medium as 1500–2000 kg (similar to D, E, and F segments) and large SUVs as >2000 kg, to reflect the diverse vehicle models within this segment.
The relationship between vehicle CO2 or NOx emissions and vehicle characteristics (mass, fuel type, engine capacity, and wheelbase) was characterised by multiple linear regression using the regress command in Stata17® (StataCorp, College Station, TX, USA).

2.3. Scenarios

We modelled five scenarios designed to represent contrasting levels of SUV sales and fleet electrification. All scenarios assume that 2021 sales return to 2.5 million units (pre-pandemic average for 2016–2019) following the COVID-19 pandemic impact on new vehicle sales in 2020, then remain constant into future years, in line with approximate future industry expectations [48]. Scenarios were extended into the future until a steady state of emissions was achieved for all scenarios.
Scenario 1 represented business as usual (BAU): EURO segments proportions, fuel types, and fuel efficiency for new passenger vehicles registrations remain constant from 2020. In Scenario 2, the ‘Small SUV’ scenario, medium and large SUV sales are replaced exclusively by small SUV sales from 2020 on a 1:1 basis. It incorporated the same assumptions as Scenario 1.
In contrast for Scenario 3, the ‘No SUV’ scenario, small, medium, and large SUVs are replaced by segment B, C, and D average cars, respectively, on a 1:1 basis. This is to reflect the fact that SUVs are often bought for increased space and that these segments maintain similar internal space but without the high-riding positions characteristic of SUVs.
The next two scenarios incorporated electrification plans. Scenario 4, ‘Electrified’, is consistent with UK Government policy to ban exclusively diesel or petrol passenger vehicles (but not plug-in hybrids, or PHEVs) by 2030 and to ban PHEVs by 2035. This model is based on the Society of Motor Manufacturers and Traders’ projections that BEV sales will represent 25% of the market in 2025, 70% by 2030, and 100% by 2035 [48]. It is assumed that the diesel and petrol proportions of the non-electrified sales remain constant from 2020 until 2030. From 2030–2035, non-fully electrified vehicles are assumed to all be petrol PHEVs, reflecting the negligible number of diesel PHEVs currently in the UK fleet (<2%) and the continued fall in diesel popularity in recent years. Hydrogen cars are not considered as only two models are available in the UK, with a total of 200 vehicles licensed on UK roads in 2020 [45].
Scenario 5, ‘Electrified and small SUV’, envisages the gradual electrification pathway of scenario 4 combined with the immediate and total replacement of new large and medium SUVs with small SUVs seen in scenario 2. This scenario aims to estimate the public health benefit of reducing the mass of SUVs without fundamentally changing their aesthetic as an extension to the UK Government’s electrification policy.

2.4. CO2 Emission Calculations

All petrol cars were assumed to drive 10,137 km and diesel cars 15,125 km per annum, using the mean estimates for England, according to the National Travel Survey 2019 [49]. The annual distance driven for electric cars was assumed to be 15,180 km based on an estimate of the Royal Automobile Club Foundation [50]. Similar data were not publicly available for other UK nations, so it was assumed to be the same across the UK in this analysis. CO2 emissions were calculated for each vehicle model in 2020 using the following equation.
Equation (1) is as follows:
C × R × D/1,000,000 = T
where:
  • C = WLTP CO2 emissions (g/km);
  • R = number of model vehicle registrations in 2020;
  • D = average distanced travelled for fuel type (km);
  • T = Total annual CO2 emissions for model sold in 2020 (tonnes).
T was then summed over all models to calculate the total emissions for all models of a segment to give segment emissions. Average CO2 emissions per vehicle by segment was calculated by dividing total segment CO2 emissions by segment vehicle count. This then gave an emission value that could be used in modelling changing vehicle segment sizes over time. Future emissions from vehicles registered in previous years were included, and gradually reduced as the vehicles were phased out, according to patterns of stock replacement in 2020 (which indicate a median vehicle lifespan of 14 years).
BEVs have zero tailpipe GHG emissions but have indirect emissions from the electricity used to power the vehicles. These can be calculated by the carbon intensity of the grid from which BEVs are charged. The future carbon intensity of the UK grid in g/kWh was calculated from the Climate Change Committee’s ‘Balanced Net Zero Pathway’ projections for electricity generation and electricity sector CO2e emissions to 2050 [51]. It is assumed that all BEVs had a fuel efficiency of the best-selling BEV in the UK in 2020, the Tesla Model 3, of 6.5 km/kWh [52]. This value was then applied to the average annual carbon intensity of the UK grid to give a predicted gCO2e/km for BEV adjusted for the expected continued decarbonisation of the electricity sector until the year 2050, using the following formula.
Equation (2) is as follows:
Annual CO2e emissions for BEV:
E × Iyear × D/1,000,000 = T
where:
  • E = efficiency (set at 6.5 km/kWh for BEVs);
  • Iyear = mean annual electric grid carbon intensity of that year (gCO2e/kWh);
  • D = distance travelled (set at 15,180 km for BEVs);
  • T = annual CO2e (tonnes).
Total CO2e emissions for a BEV could then be calculated by summing the annual CO2e for a vehicle’s lifetime (median 14 years) or a specific time point (2035 and 2050 in this analysis).
For example:
T2020 + T2021… + T2033 = L2020
where L2020 is the lifetime emissions for a BEV registered in 2020 reported at the end of 2035 or 2050 (last year of service would be 2033), whilst for a BEV registered in 2049:
T2049 + T2050 = L2049
where L2049 is the lifetime emissions for a BEV registered in 2049 reported at the end of 2050.
The lifetime emissions of a BEV could then be multiplied by the number of registrations of BEVs in that year to give lifetime emissions of BEV fleet of any given year.
For example:
L2020 × R2020 = F2020
where:
  • R = number of vehicle registrations;
  • Fyear = Total BEV fleet emissions for that year.
The total CO2e from BEVs at a given time point (e.g., 2050) in a given scenario could then be given by:
F2020 + F2021…+ F2050 = Total CO2e by 2050
CO2 changes were valued using the UK Government’s marginal CO2e abatement projected costs, which estimate the value that society places on 1 tonne of CO2e emitted for a given year. Low, central, and high estimates are published to reflect underlying uncertainties and are designed to be consistent with the marginal cost of meeting net zero by 2050 target [53].

2.5. NOx Emission Calculations

Modelling annual NOx emissions of the UK fleet requires calculating the emissions from the existing stock plus new vehicles added that year, minus vehicles decommissioned. To accomplish this, a stock turnover model was created based on historic patterns of UK vehicle lifetimes (by combining DVLA datasets VEH0124 [45] and VEH1153a [45]). to calculate the yearly NOx emissions of existing vehicles on the UK roads that had been registered in previous years. This allowed the NOx emission contribution of the pre-2020 UK fleet to be calculated for future years as the vehicles are slowly phased out, assuming they emit the corresponding maximum EURO emission standard legal limit of their first year of registration. This also provided a means to estimate the lifespan of future vehicles in the model. It suggested that, for a policy applied to new vehicles from 2020 onwards, it would cover 41% of the total UK fleet by 2025, 77% by 2030, and 96% by 2035. The implication of this is that any policy introduced for new cars would take many years to have a its full impact, because of the approximately 14-year median lifespan of a UK passenger vehicle. It is important to note that this is even slower for electrification, which is a transition rather than an abrupt policy change.
The contribution from new vehicles can be added each year to this model. Annual predicted NOx emissions for a vehicle model registered in 2020 were calculated using Equation (7), as follows:
N × R × D/1,000,000,000 = T
where:
  • N = RDE NOx emissions (mg/km);
  • R = number of registrations of vehicle model in 2020;
  • D = average distanced travelled for fuel type (km);
  • T = Total annual NOx emissions for vehicle model sold in 2020 in first year of use (tonnes).
The mean NOx emissions per vehicle by segment were calculated by summing T for all models of a segment and then dividing by the total number of registrations in that segment. This was used to model future scenarios in the same fashion as in the CO2 model above. Future ICE cars were assumed to continue to produce the same mass of NOx as in 2020.
The relative change in NO2 for each scenario relative to BAU was calculated by assuming that under the BAU scenario the urban background concentration of NO2 from UK passenger cars would remain constant at 2.59 mg/cm3 [54]. As a result, the proportional change relative to the BAU scenario could be applied for each year to calculate the projected change in NO2 in mg/cm3. The absolute changes in NO2 concentrations then informed the life table calculations (below).

2.6. Life Table Analysis for NOx Scenarios

The Institute of Occupational Medicine’s IOMLIFET (version 2013) package of Microsoft Excel™ spreadsheets was used to perform life table calculations to quantify the predicted impact on mortality of changes in NO2 exposure under each scenario [55]. The life table models change in population survival over time, resulting from changes in underlying mortality rates. The strength of IOMLIFET is that it allows for changes in air pollutant coefficients each year to be combined with lagged effects of air pollutants from previous years. It calculates separate hazards for each future year and age group.
The life table model was populated with UK population data for 2019 by sex and year of age [56], as well as counts of deaths by each year of age and sex [57] (the model assumed the hazards are the same for ages 90–105 inclusive). Data from 2019 were used instead of 2020 because of the increased number of deaths during the COVID-19 pandemic in 2020. This provided an all-cause annual baseline hazard of death for each year of life and by sex. The annual population, birth rate, and baseline hazard of 2019 were kept constant into future years. The main outputs were life years gained by 2126 and the total value of the life years gained. This study used the current UK Government guidance recommended value of a life year (VOLY) of GBP 60,000 per year and a discount rate of 1.5% for health-related interventions [58].
This study used the unadjusted NO2 coefficient of 1.023 (95% CI: 1.008, 1.037) per 10 μg/m3 as per the UK’s Committee on the Medical Effects of Air Pollutants (COMEAP) guidance ‘to assess the health benefits of interventions that reduce a mixture of traffic-related pollutants’ [8].
This means that, for a given NO2 reduction (∆), a new relative risk of mortality was calculated for each age group and for each year, into the future, using the following Equation (8):
Relative risk = 1.023(−∆/10)
The relative risk was multiplied by the baseline mortality rate to calculate the mortality rate. From this, survival probability, cumulative survival, and expected life years can be calculated [55]. Relative risks were applied at all ages of 30 years and above, reflecting a lack of evidence of air pollution effects in those younger than 30 and common practice for air pollution mortality calculations [7]. A sensitivity analysis was conducted using alternative values of VOLY and discount rates commonly used in the UK [58,59] and the upper and lower 95% confidence interval unadjusted NO2 coefficient limits.
It is expected that a change in concentration of an air pollutant (in this analysis, background urban annual mean NO2 concentrations) will be followed by a lag before mortality impacts are observed. Given a lack of empirical evidence, lag functions for air pollution are generally derived from expert consensus rather than experimentally. We applied the US Environment Protection Agency (EPA) proposed lag structure [60], which sees 30% of the effect seen within the first year and the full effect seen after 20 years.
All data used are from secondary sources fully in the public domain, and the study was assessed by the London School of Hygiene and Tropical Medicine Research Governance and Integrity Office as not requiring ethical approval.

3. Results

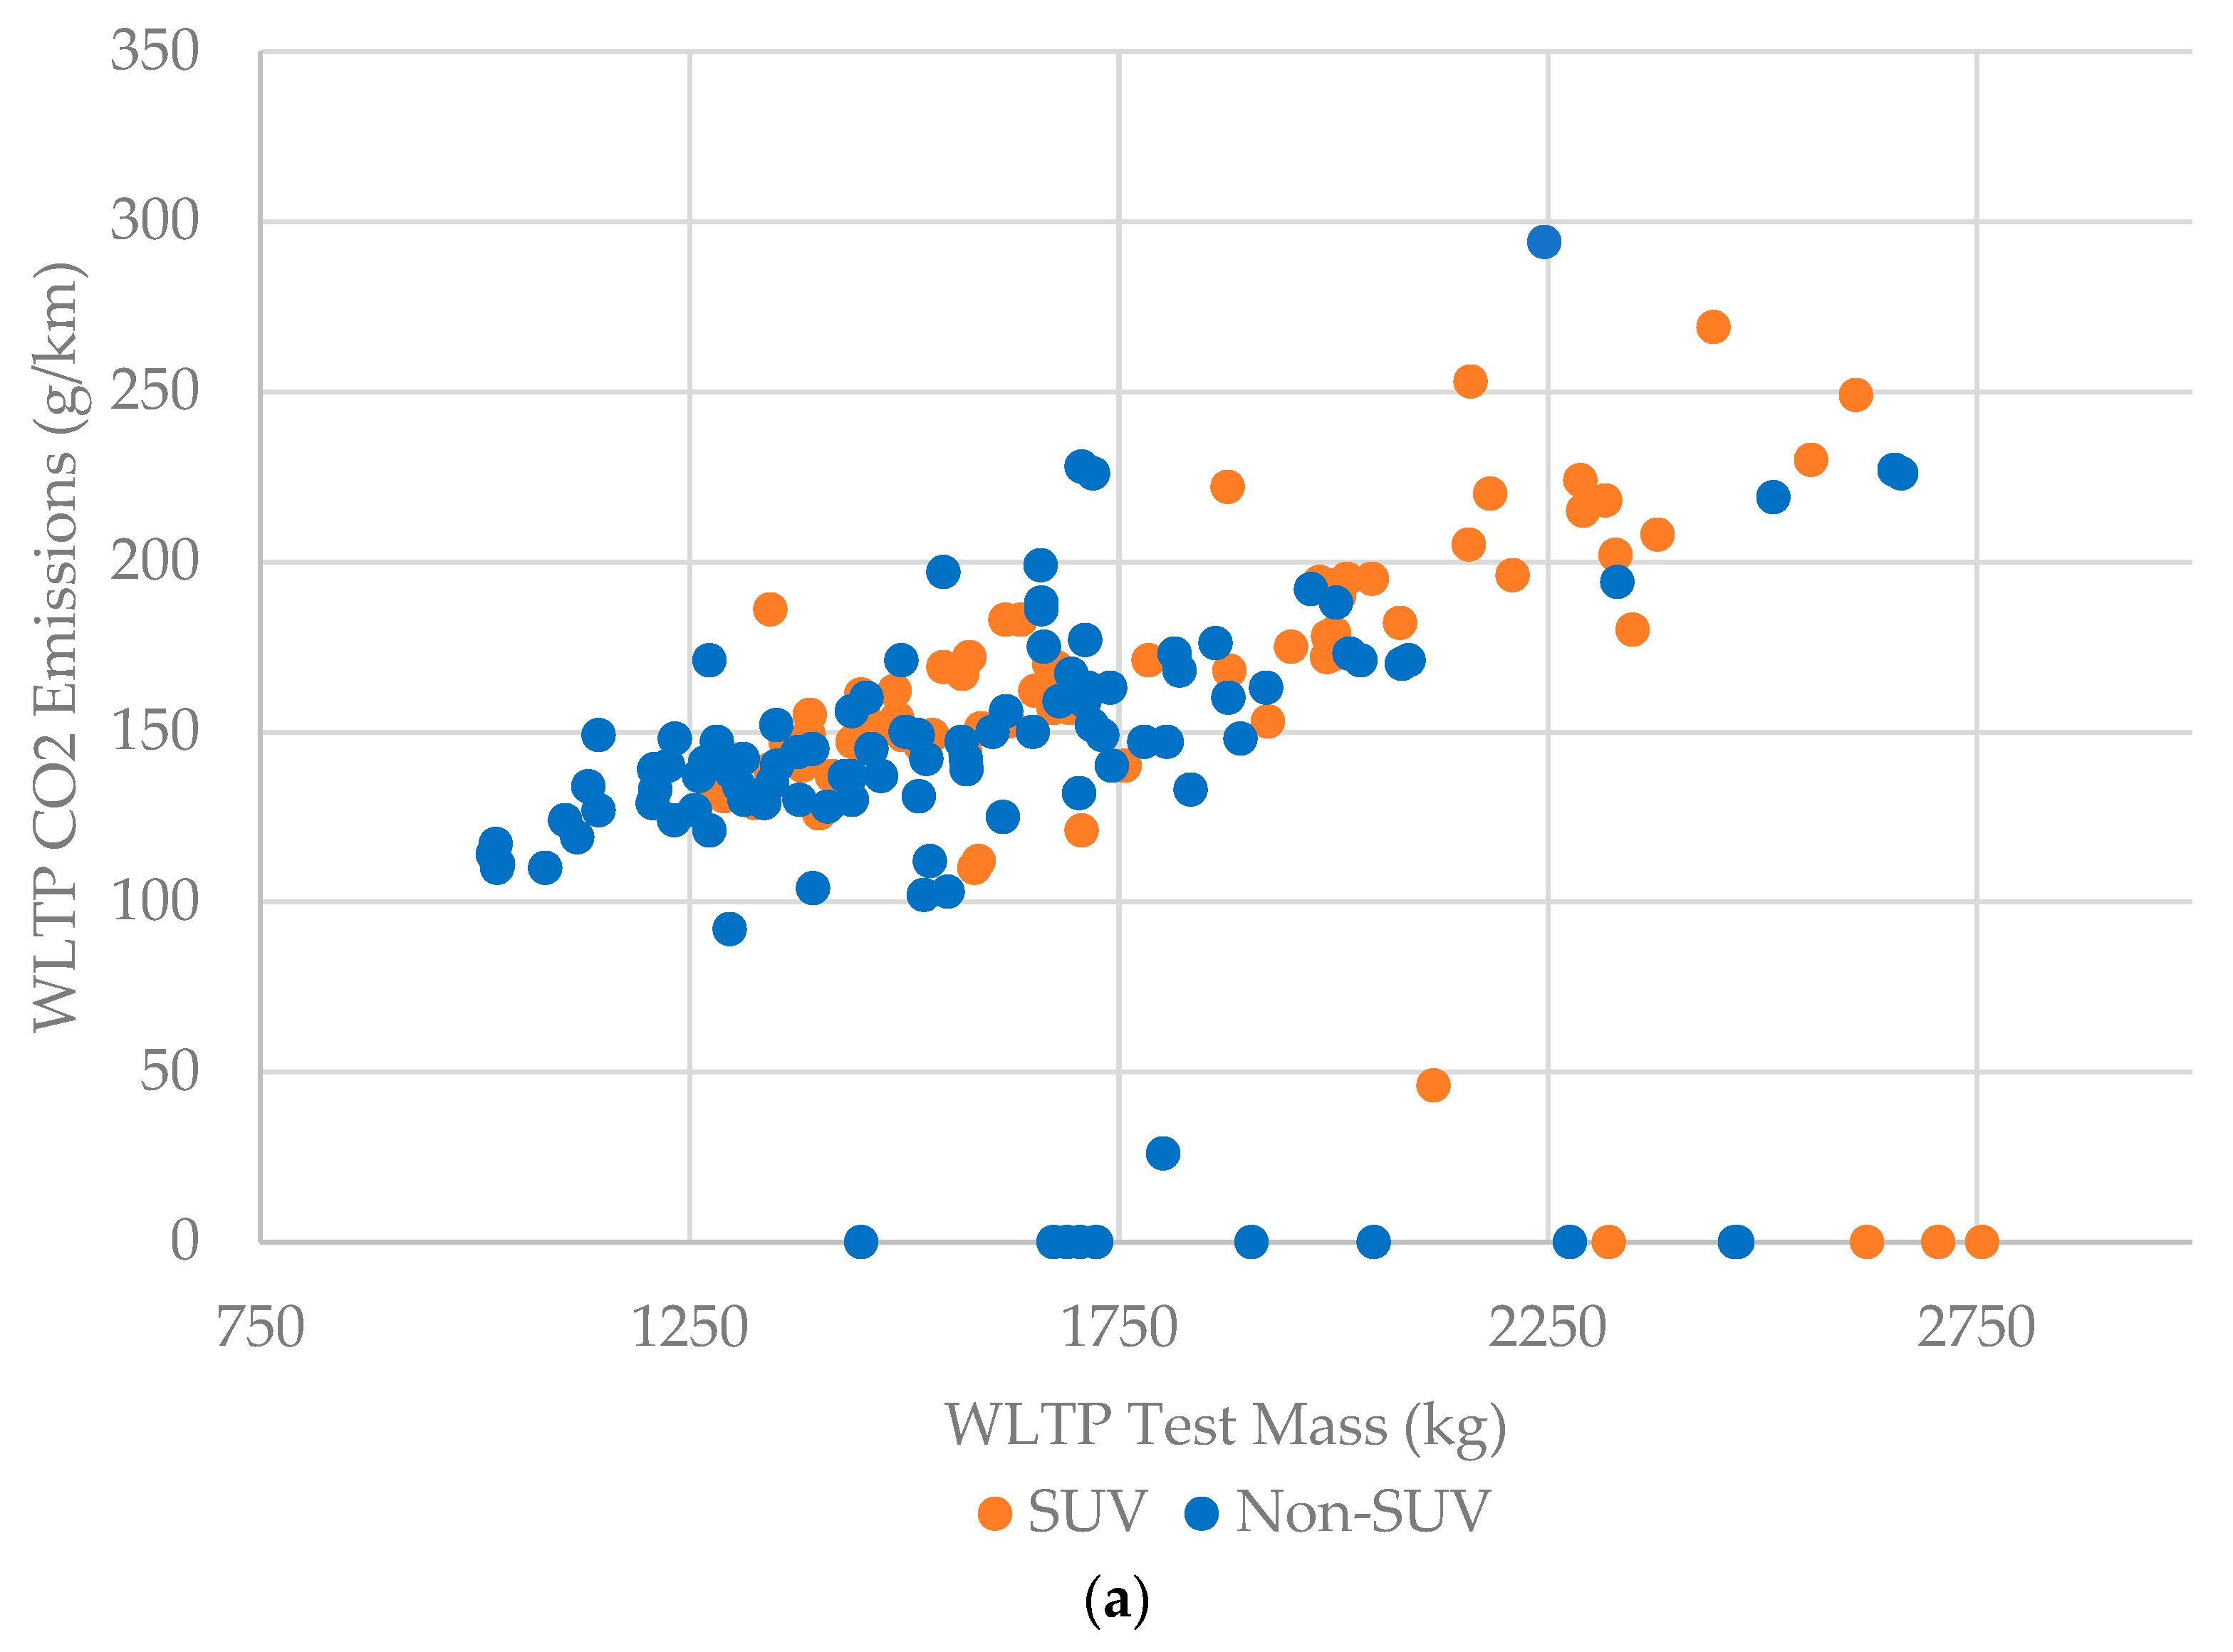
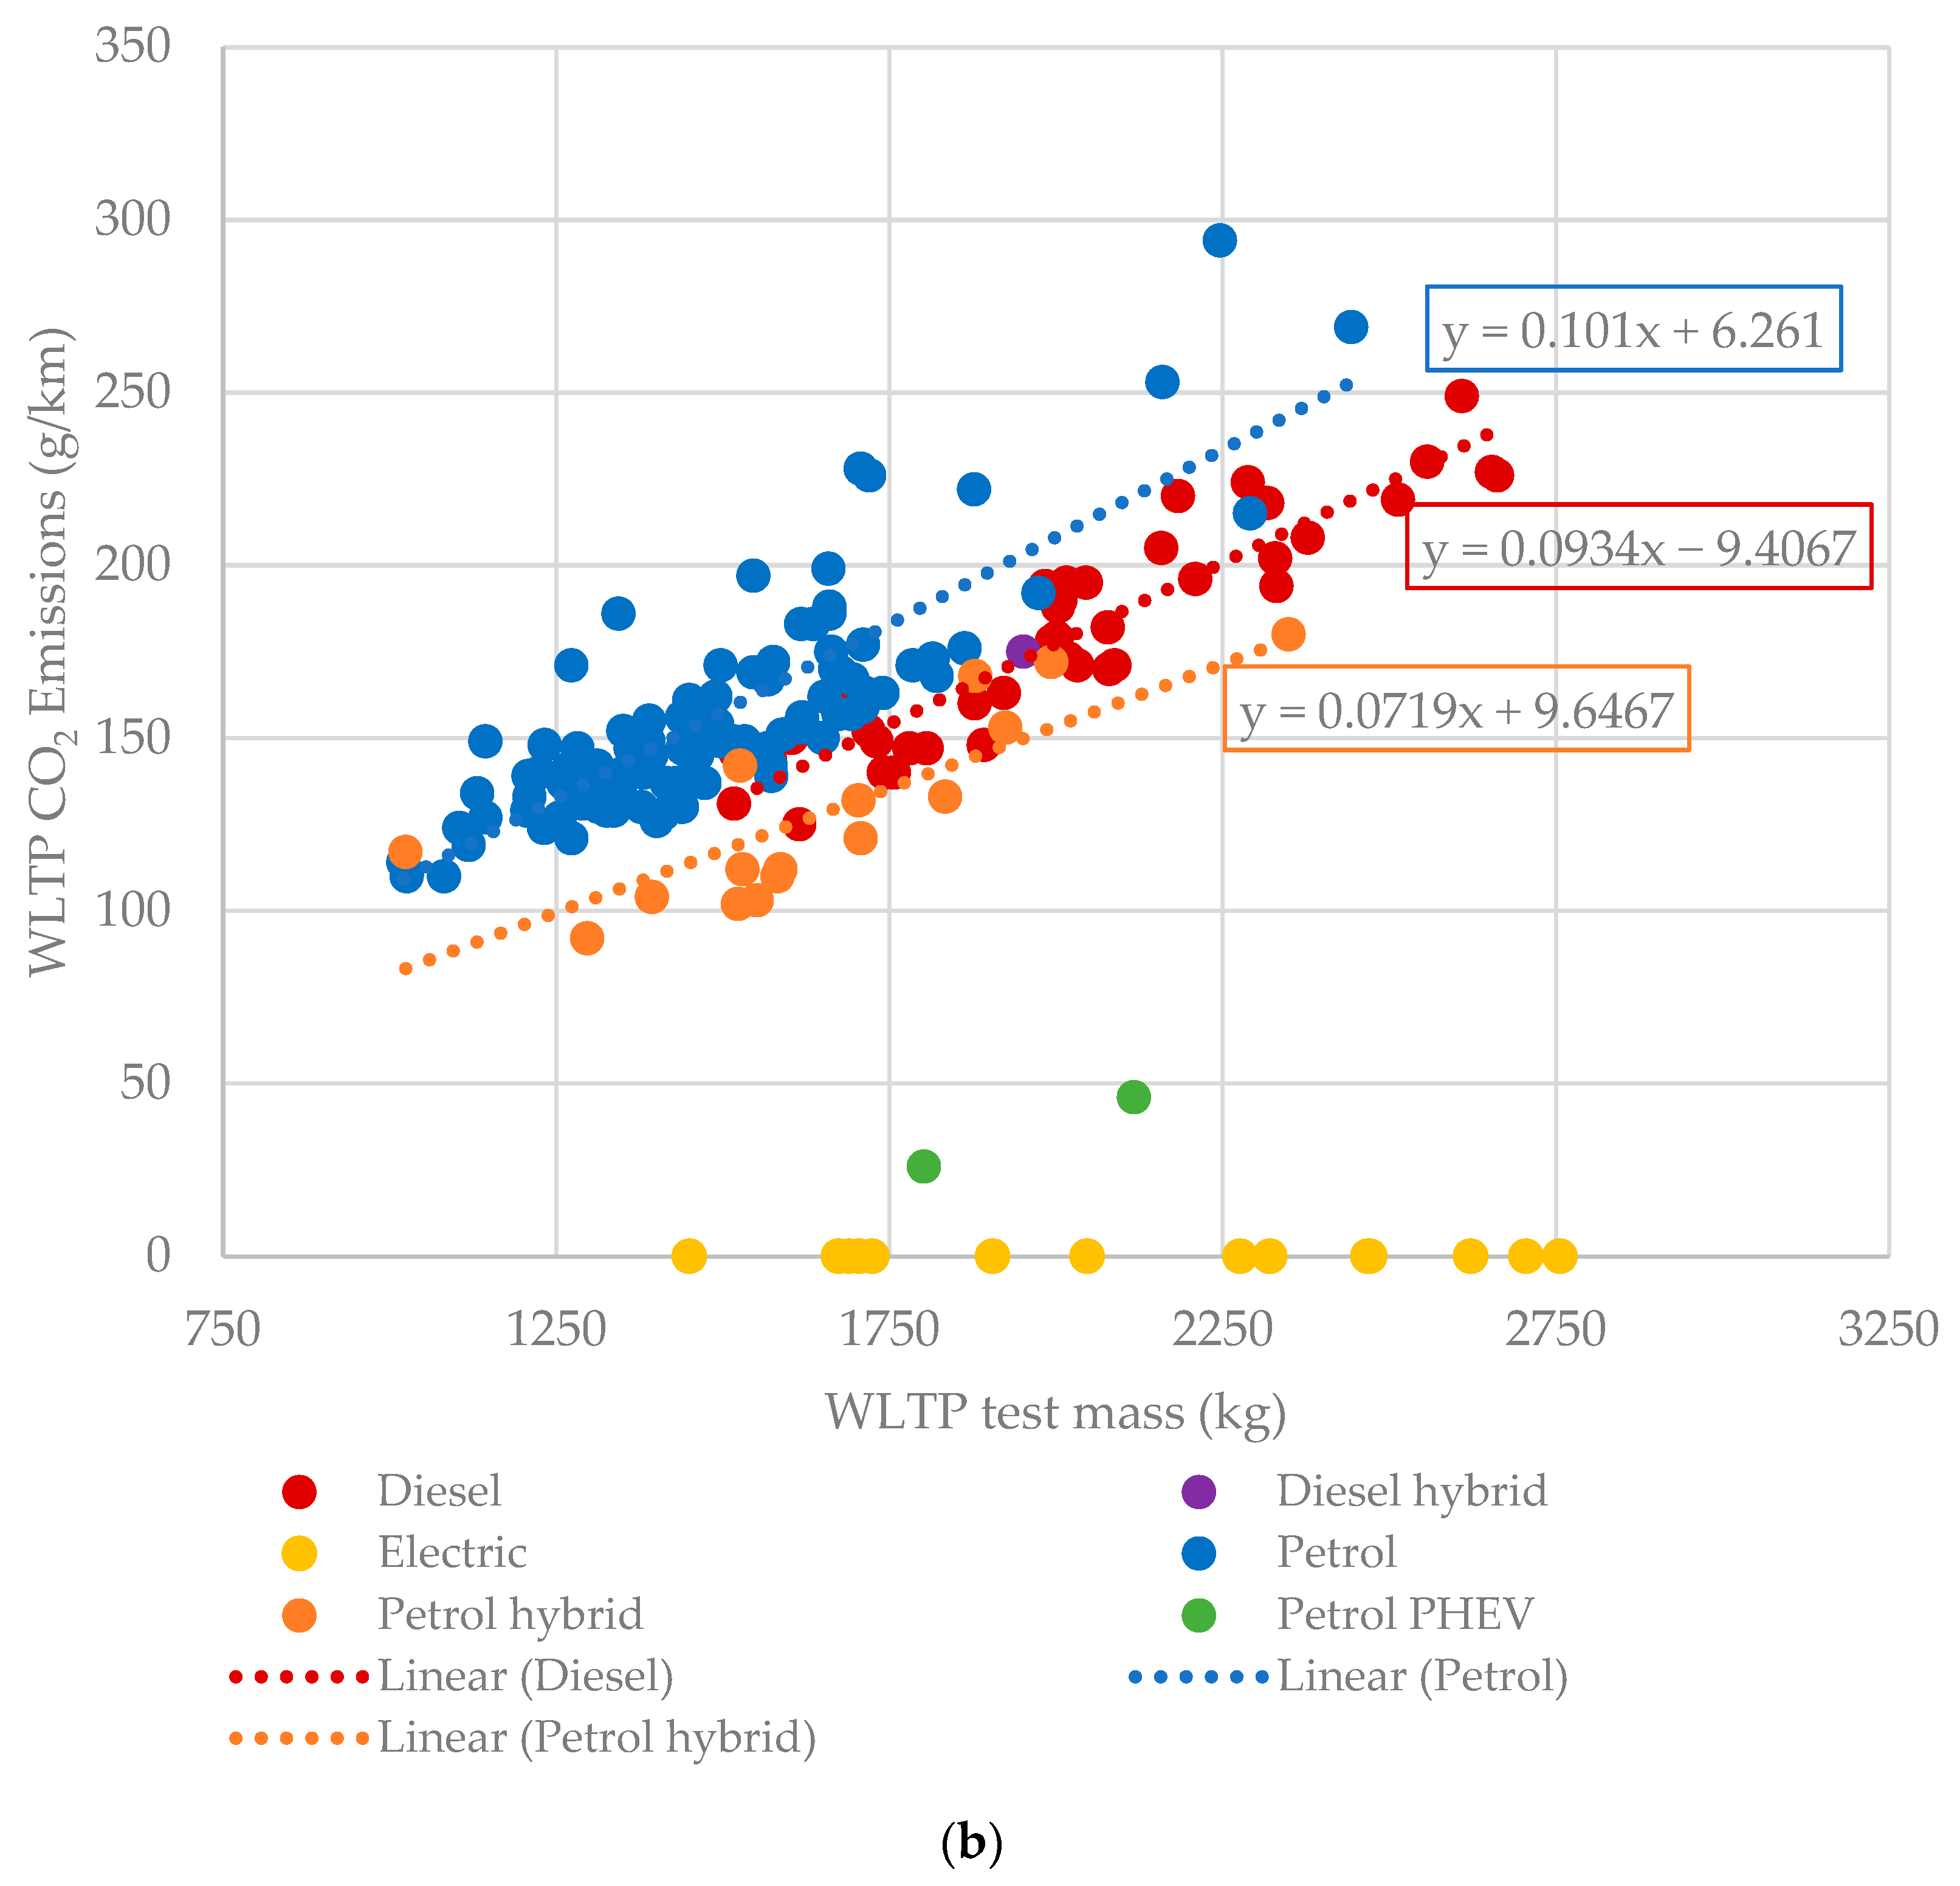
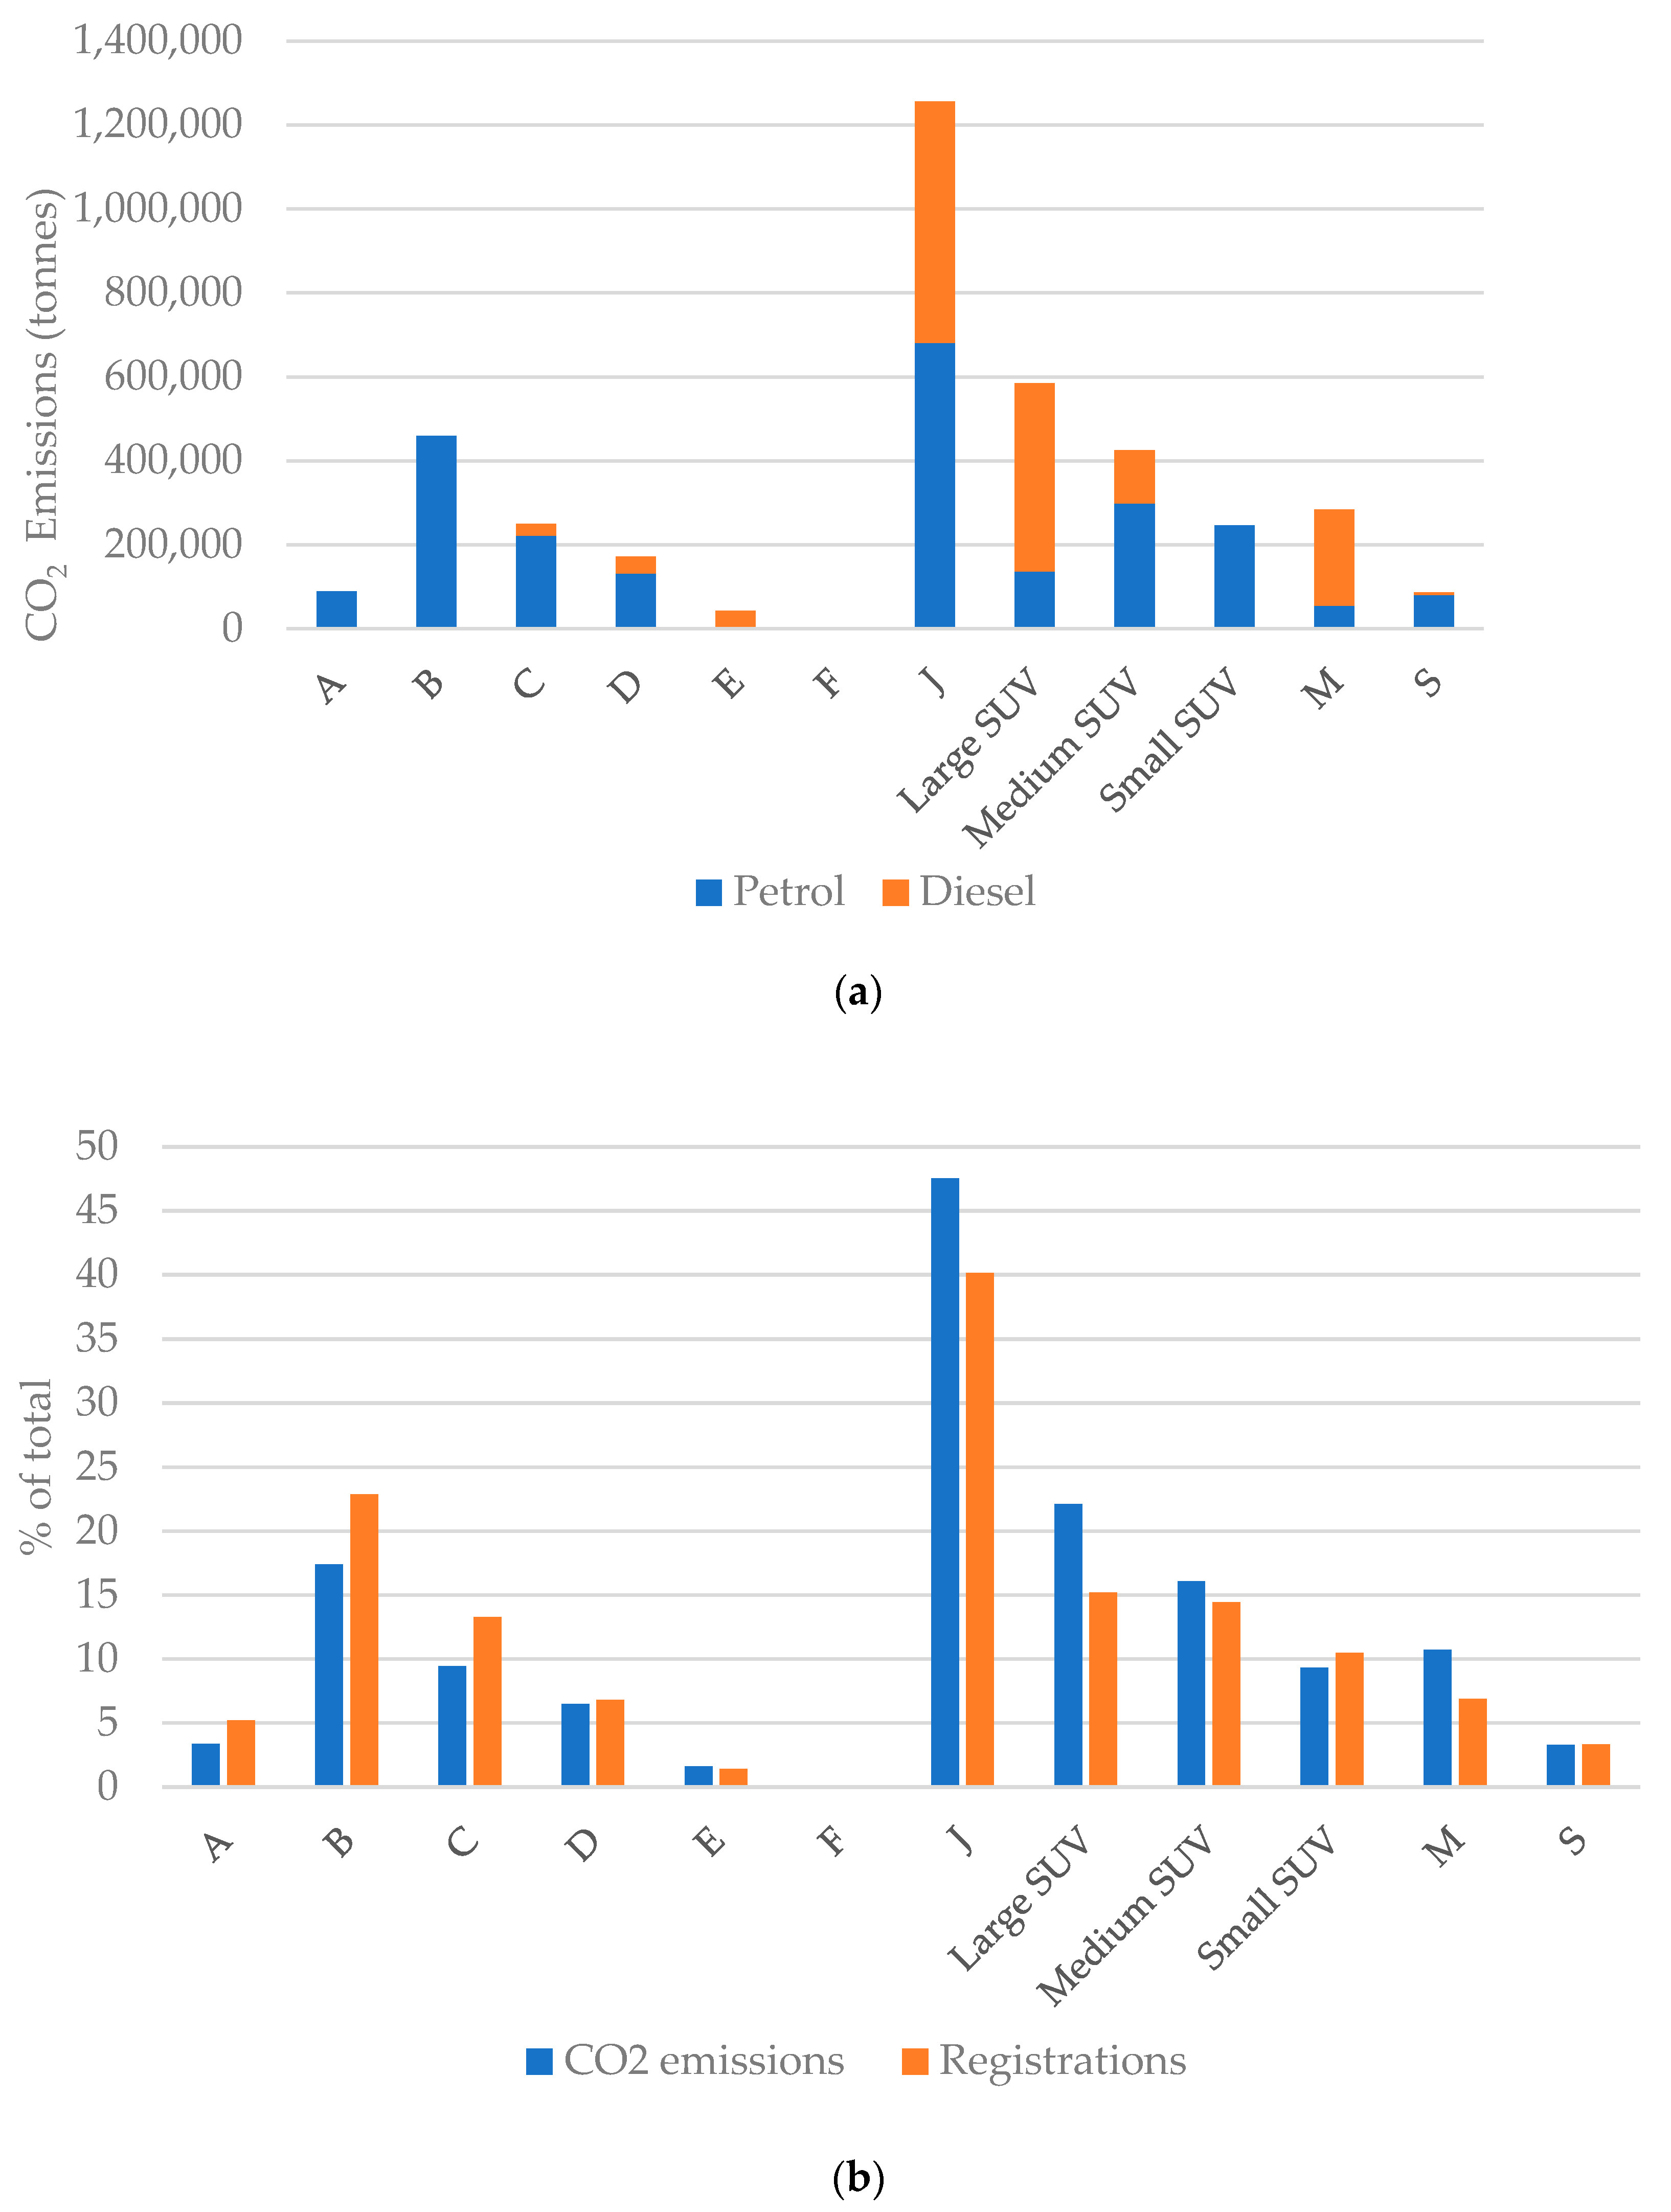
3.1. Vehicle Mass Impact on CO2 and NOx Emissions

ICE SUVs were disproportionately represented in heavier segments of the UK fleet, making up 63% of vehicles of 2000 kg and above, 38% from 1500–1999 kg, and only 35% of those below 1500 kg (Figure 1a).
There was a positive correlation, with a broadly linear relationship, between vehicle mass and CO2 emissions for diesel, petrol, and petrol hybrid vehicles (Figure 1b), in keeping with other analyses [31]. The CO2 model consisted of 181 vehicle models, equating to 1,560,452 out of 1,656,403 (94.2%) 2020-registered passenger vehicles (Table 2).
Overall, 61.5% of the vehicles included were petrol, 20.3% were diesel (reflecting the rapid decline in diesel sales since 2016), and 4.7% were BEVs. The most popular segment was SUVs (J segment) at 40.2%, followed by small cars (B segment) at 22.9%. Multiple linear regression analysis suggested that vehicle mass was a strong predictor of CO2 emissions (Table 3). All else being equal, a 100 kg increase in vehicle weight was associated with a CO2 emission increase of 10.3 g/km for ICE passenger vehicles.
There was a similar but weaker correlation between ICE vehicle mass and NOx emissions. The NOx emission model was created from RDE values available for 985,560 vehicles registered in 2020 (59.5% of the total). This lower coverage than the CO2 model was due to the absence of submitted data by the Volkswagen Group and Bayerische Motoren Werke (BMW) auto-manufacturers at the time of analysis. Multiple linear regression showed mass and engine capacity were predictors of NOx emissions (Table 4), but not as strongly as for the CO2 analysis. All else being equal, a 100 kg increase in vehicle mass is associated with an RDE NOx emission increase of 6.7 mg/km for diesel vehicles and a 7.4 mg/km increase for petrol.
The results of the regression analysis suggests that policies that transition away from heavy ICE vehicles (e.g., larger ICE SUVs) to lighter vehicles could be associated with significant CO2 savings. The model showed that SUV vehicles contributed most to the overall CO2 emissions of the 2020 registered fleet in the UK and that diesel vehicles are more common in the larger and heavier vehicle segments (J and M). The large proportion of CO2 emissions from SUVs is due, firstly, to the high popularity of SUVs (Figure 2b) and secondly, to the high per unit CO2 emissions for large and medium SUVs (Table 5). This data suggests the mean large SUV emits 127% (1.6 tonnes) more CO2 annually than the mean A segment vehicle per year.

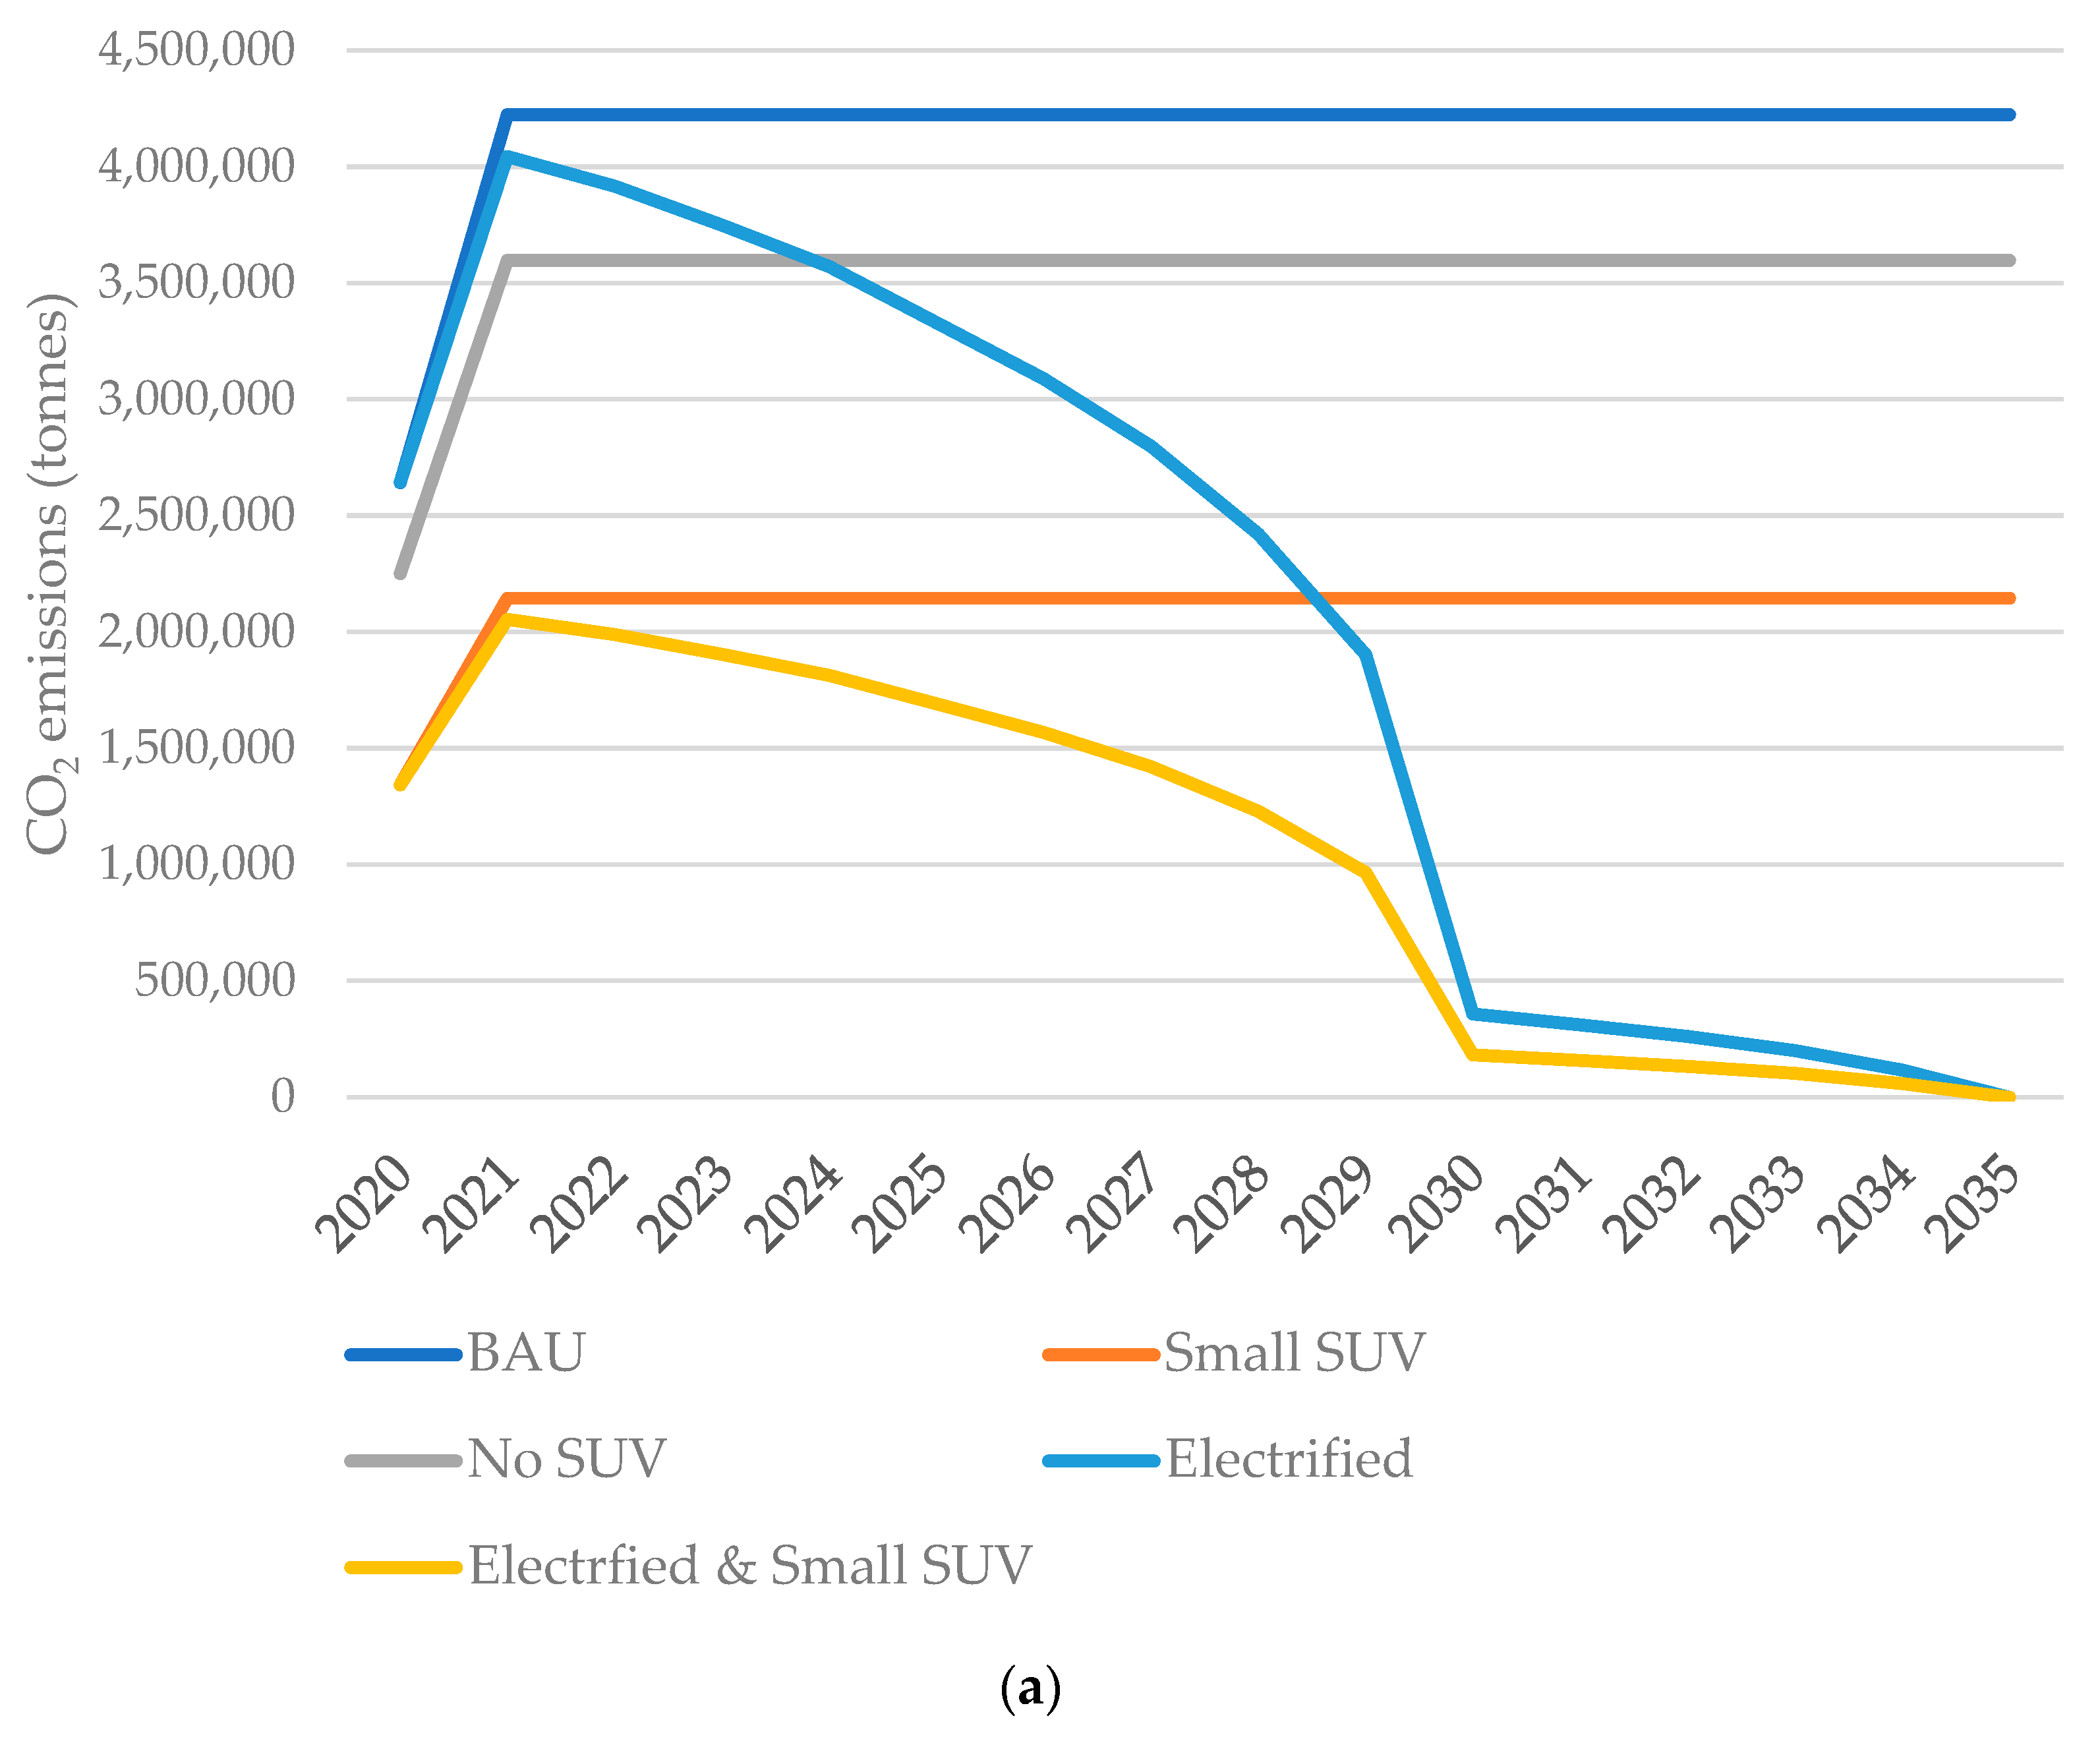
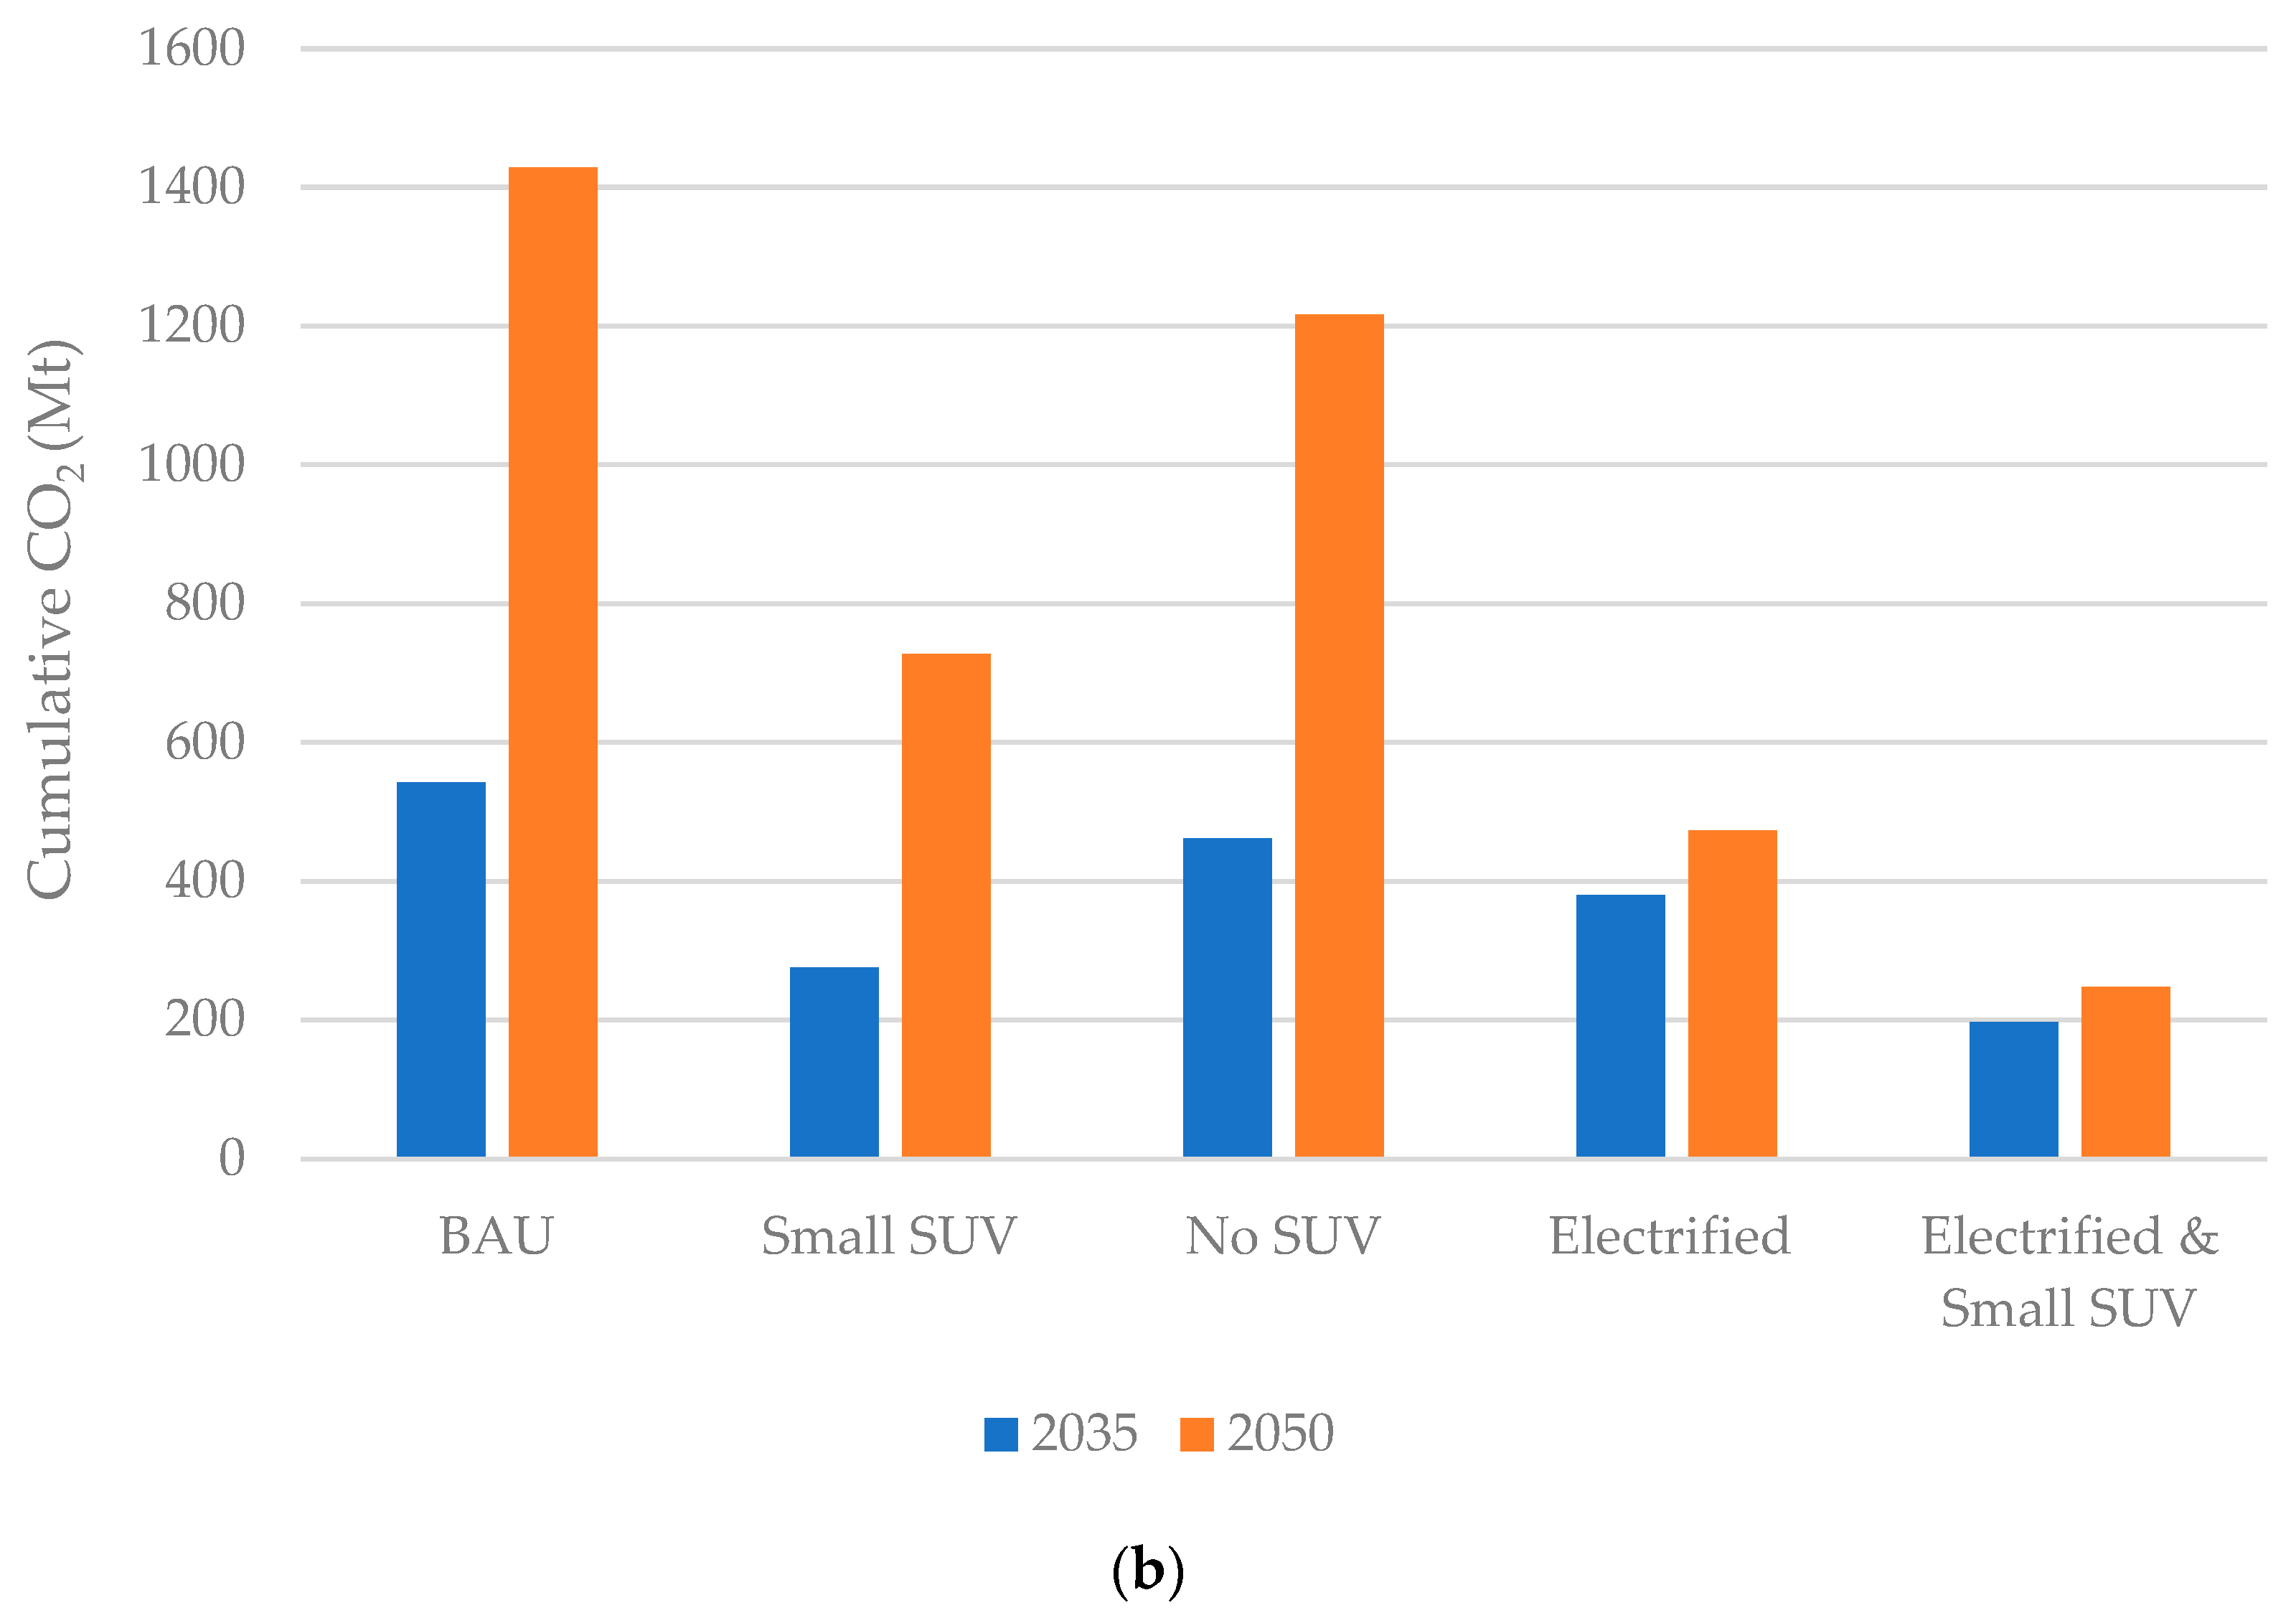
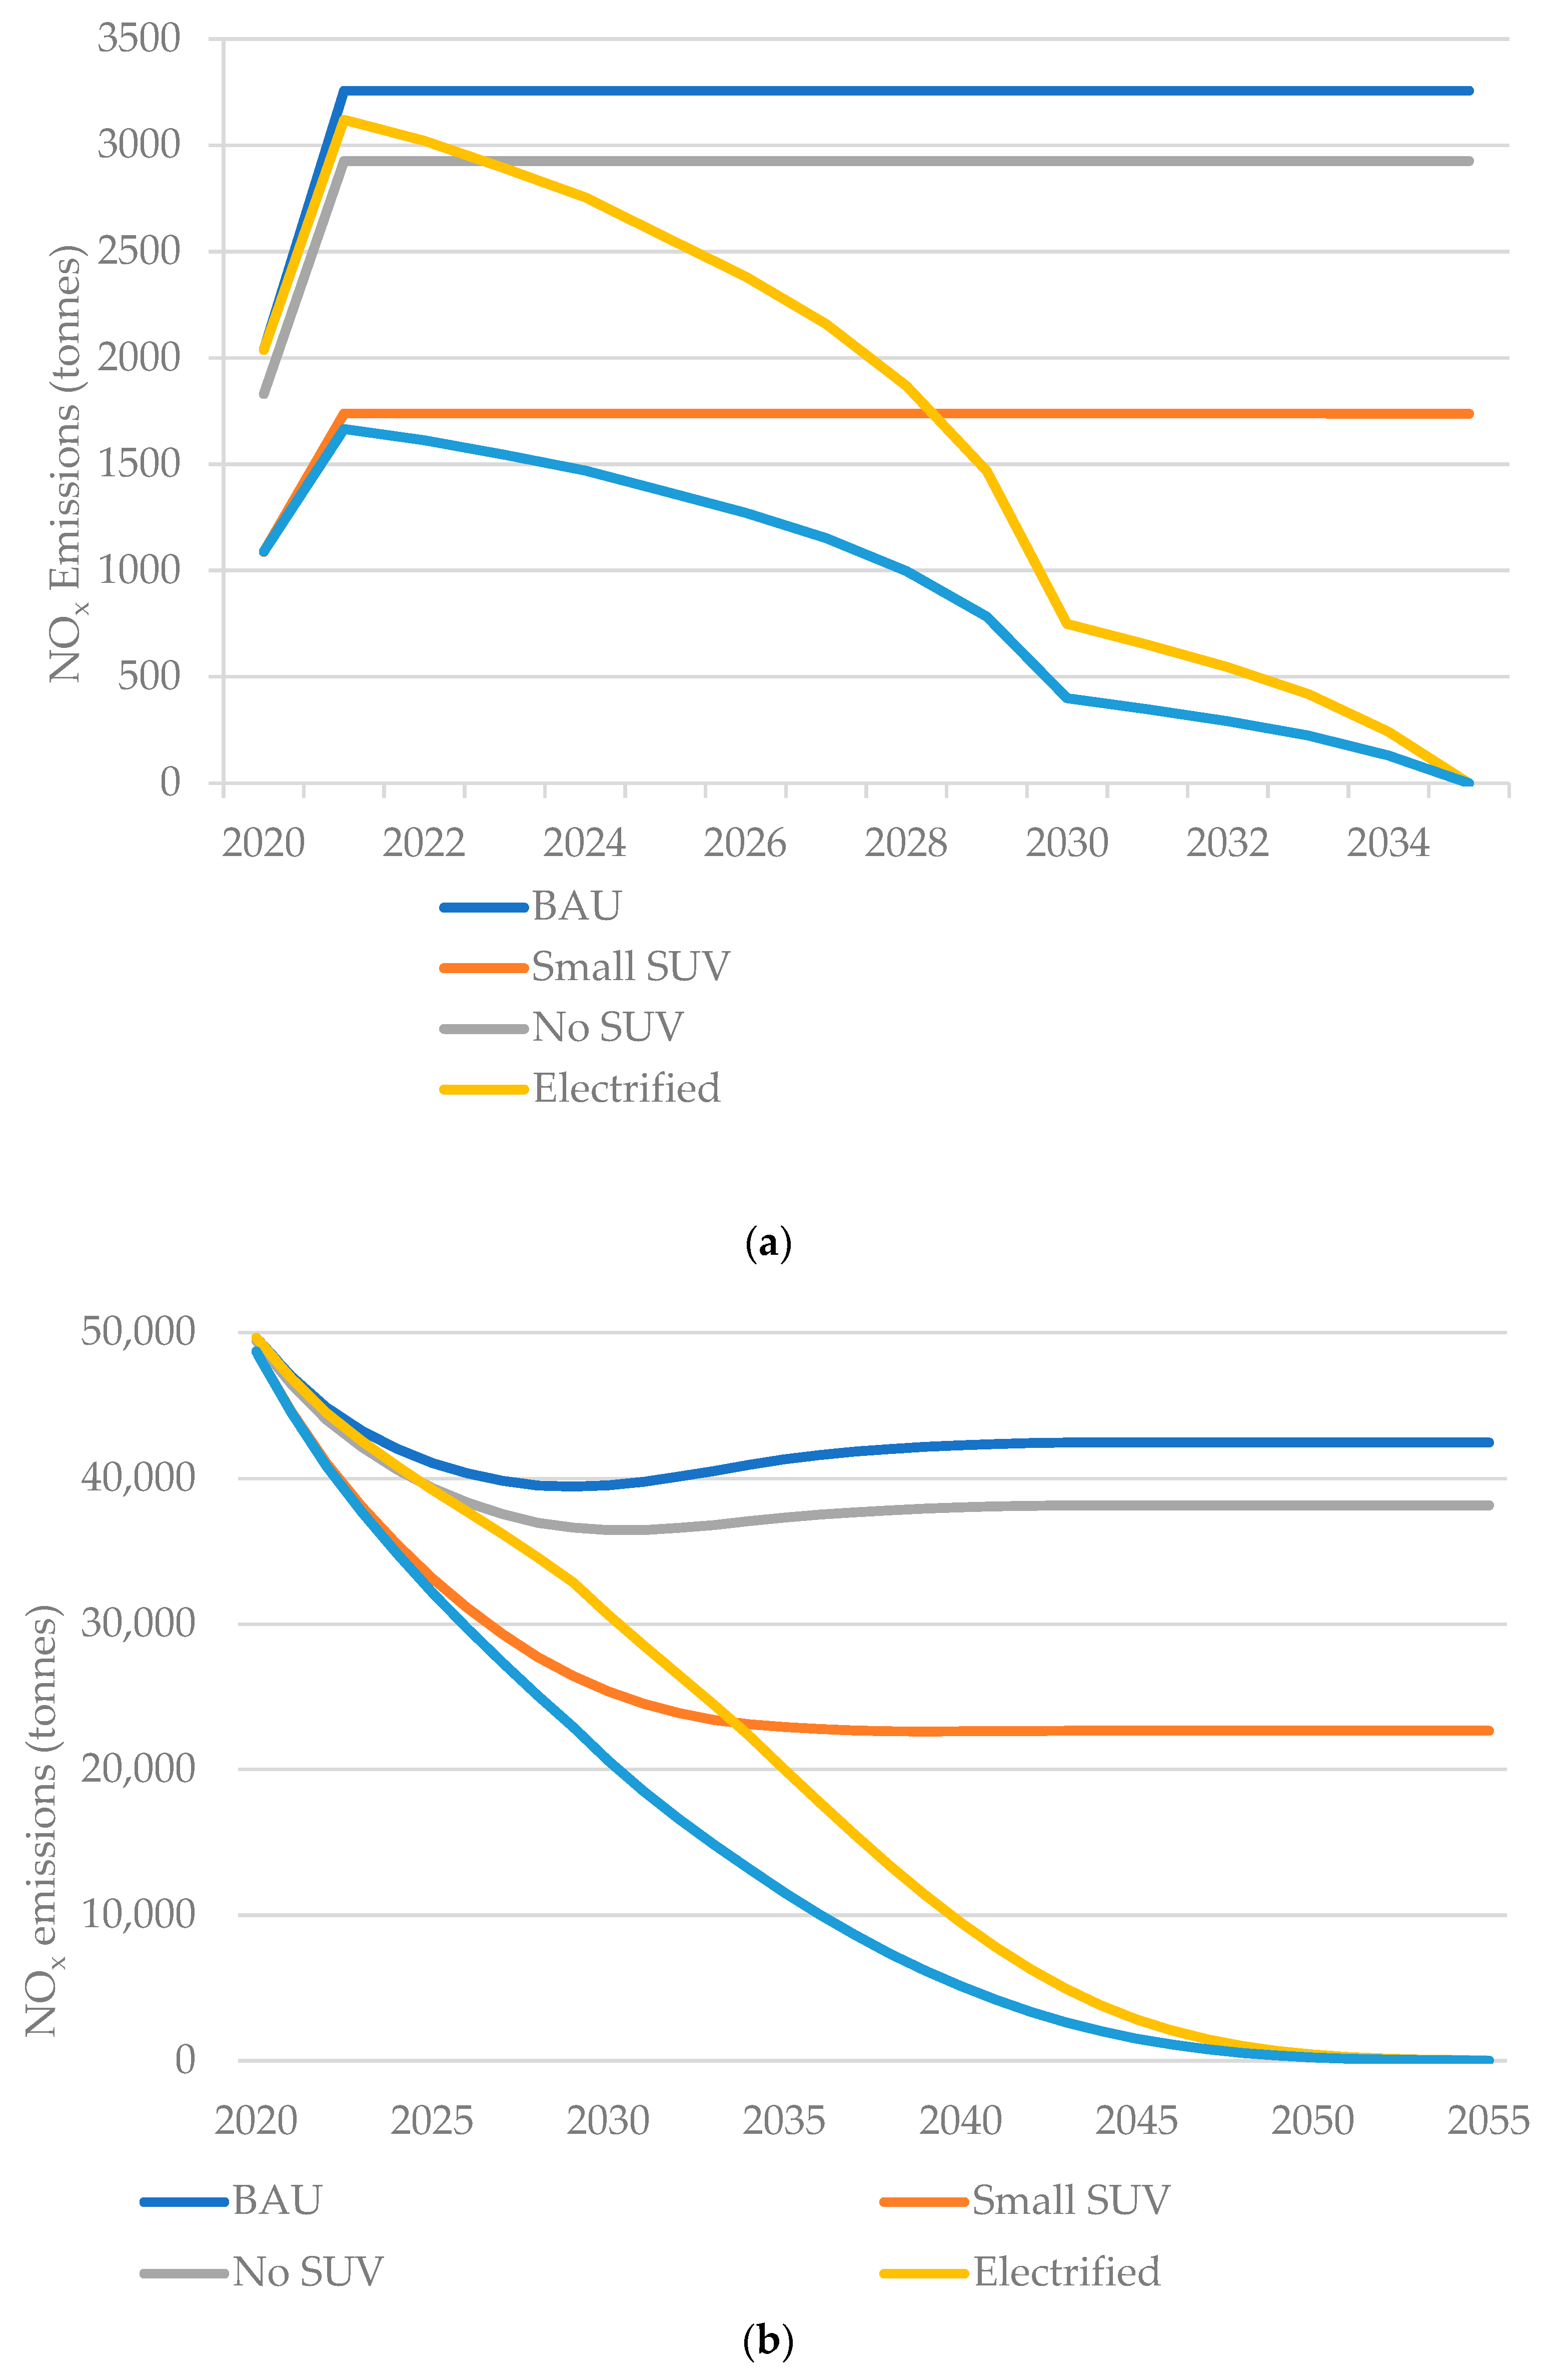
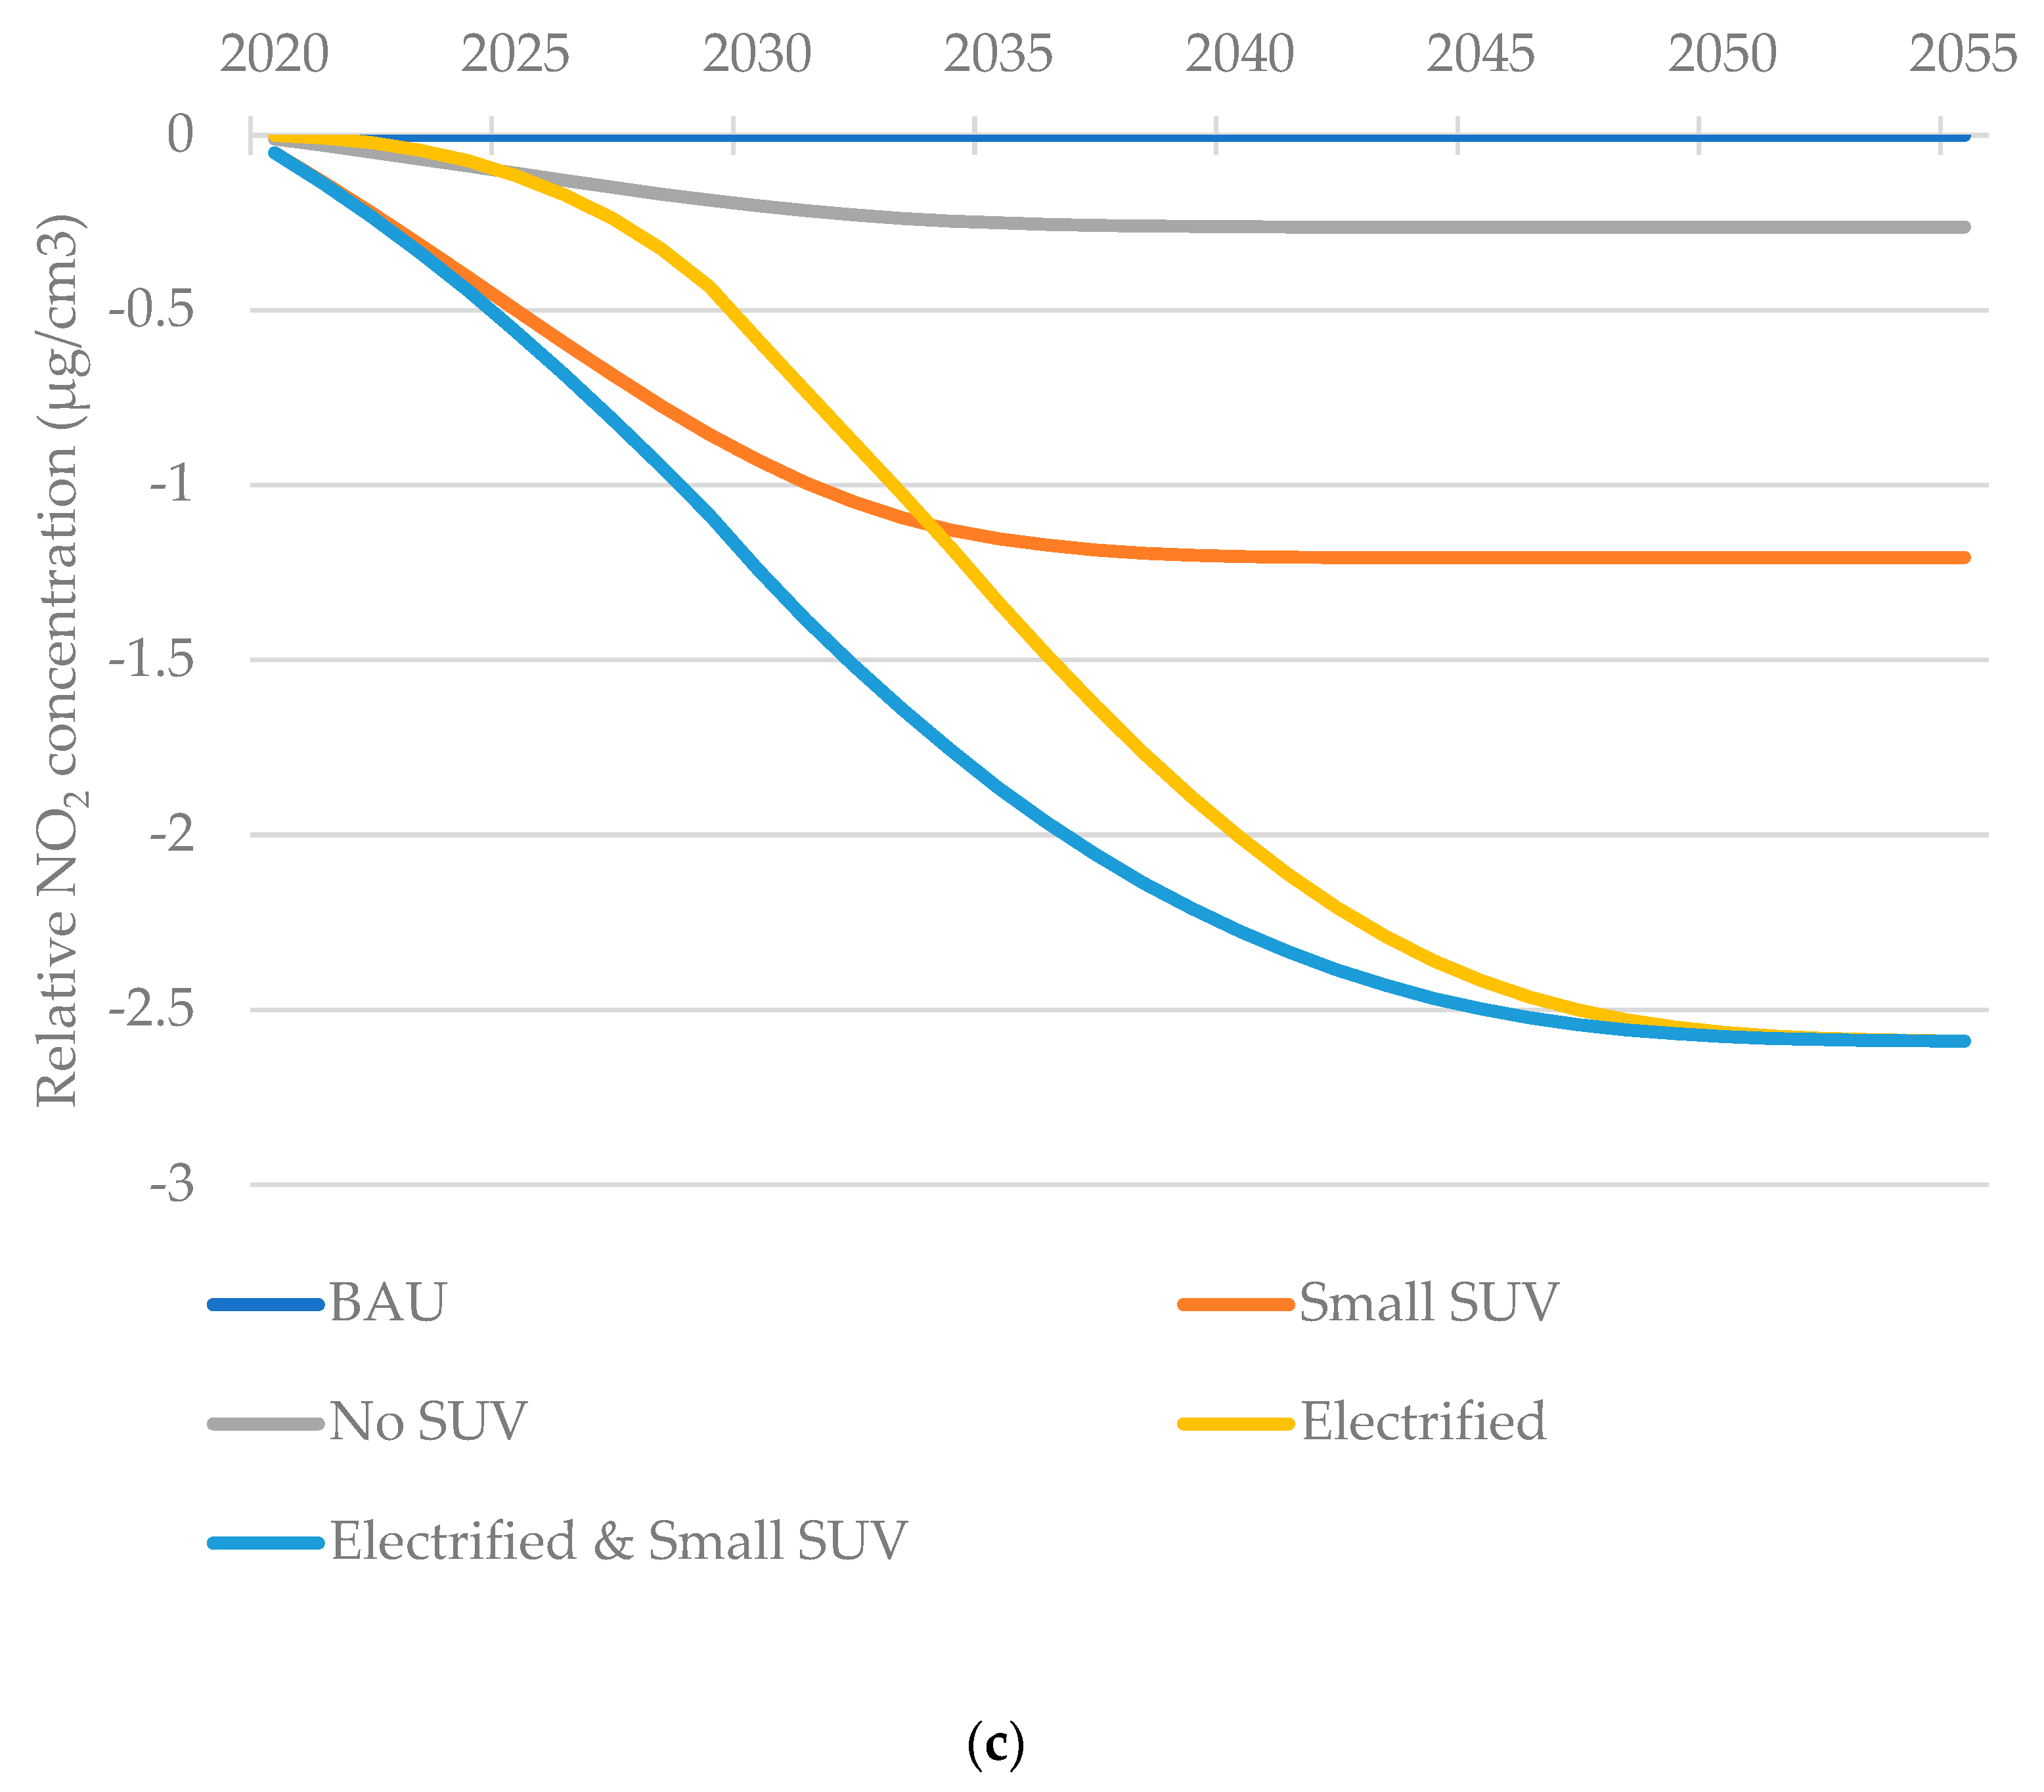
3.2. Scenario Projections for CO2 and NOx Emissions

Scenarios incorporating the transition from larger to small SUVs have an immediate and major annual CO2 saving, and those that include electrification have a more gradual saving (Figure 3a). The ‘Small SUV’ scenario achieves CO2 emission reductions greater than the UK Government’s ‘Electrified’ scenario by 2035, but the benefit of the ‘Electrified’ scenario is larger by 2050 (Figure 3b). However, there is a 16% added benefit in incorporating an immediate shift to smaller SUVs versus electrification alone by 2050 (Table 6). To put this in context, the saving for the ‘Electrified and Small SUV’ scenario versus the BAU of 1181 MtCO2 from 2020 to 2050, is equivalent to 2.2 times the GHG emissions of the entire UK economy for the year 2019 [61].
The CO2 emissions associated with charging BEVs were also included in these calculations but were found to be insignificant, reducing the emissions savings by less than 1% by 2050 in electrification pathways.
The modelling for NOx changes was more complex given the need to project atmospheric changes (Figure 4). Figure 4a shows the expected NOx emissions of passenger vehicles in their first year of use from 2020–2035 under the five scenarios and shows a similar pattern to the CO2 model. Figure 4b shows the annual NOx emissions for all UK passenger vehicles, which shows how emissions fall in all scenarios (due to the phasing out of more polluting older cars) but with the greatest reductions in electrified pathways (reaching negligible tailpipe NOx emissions by 2051). Figure 4c shows how these changes translate to reductions in urban atmospheric concentrations of vehicle-related NO2 pollution relative to BAU, assuming direct proportionality between the reduction in NOx and NO2.

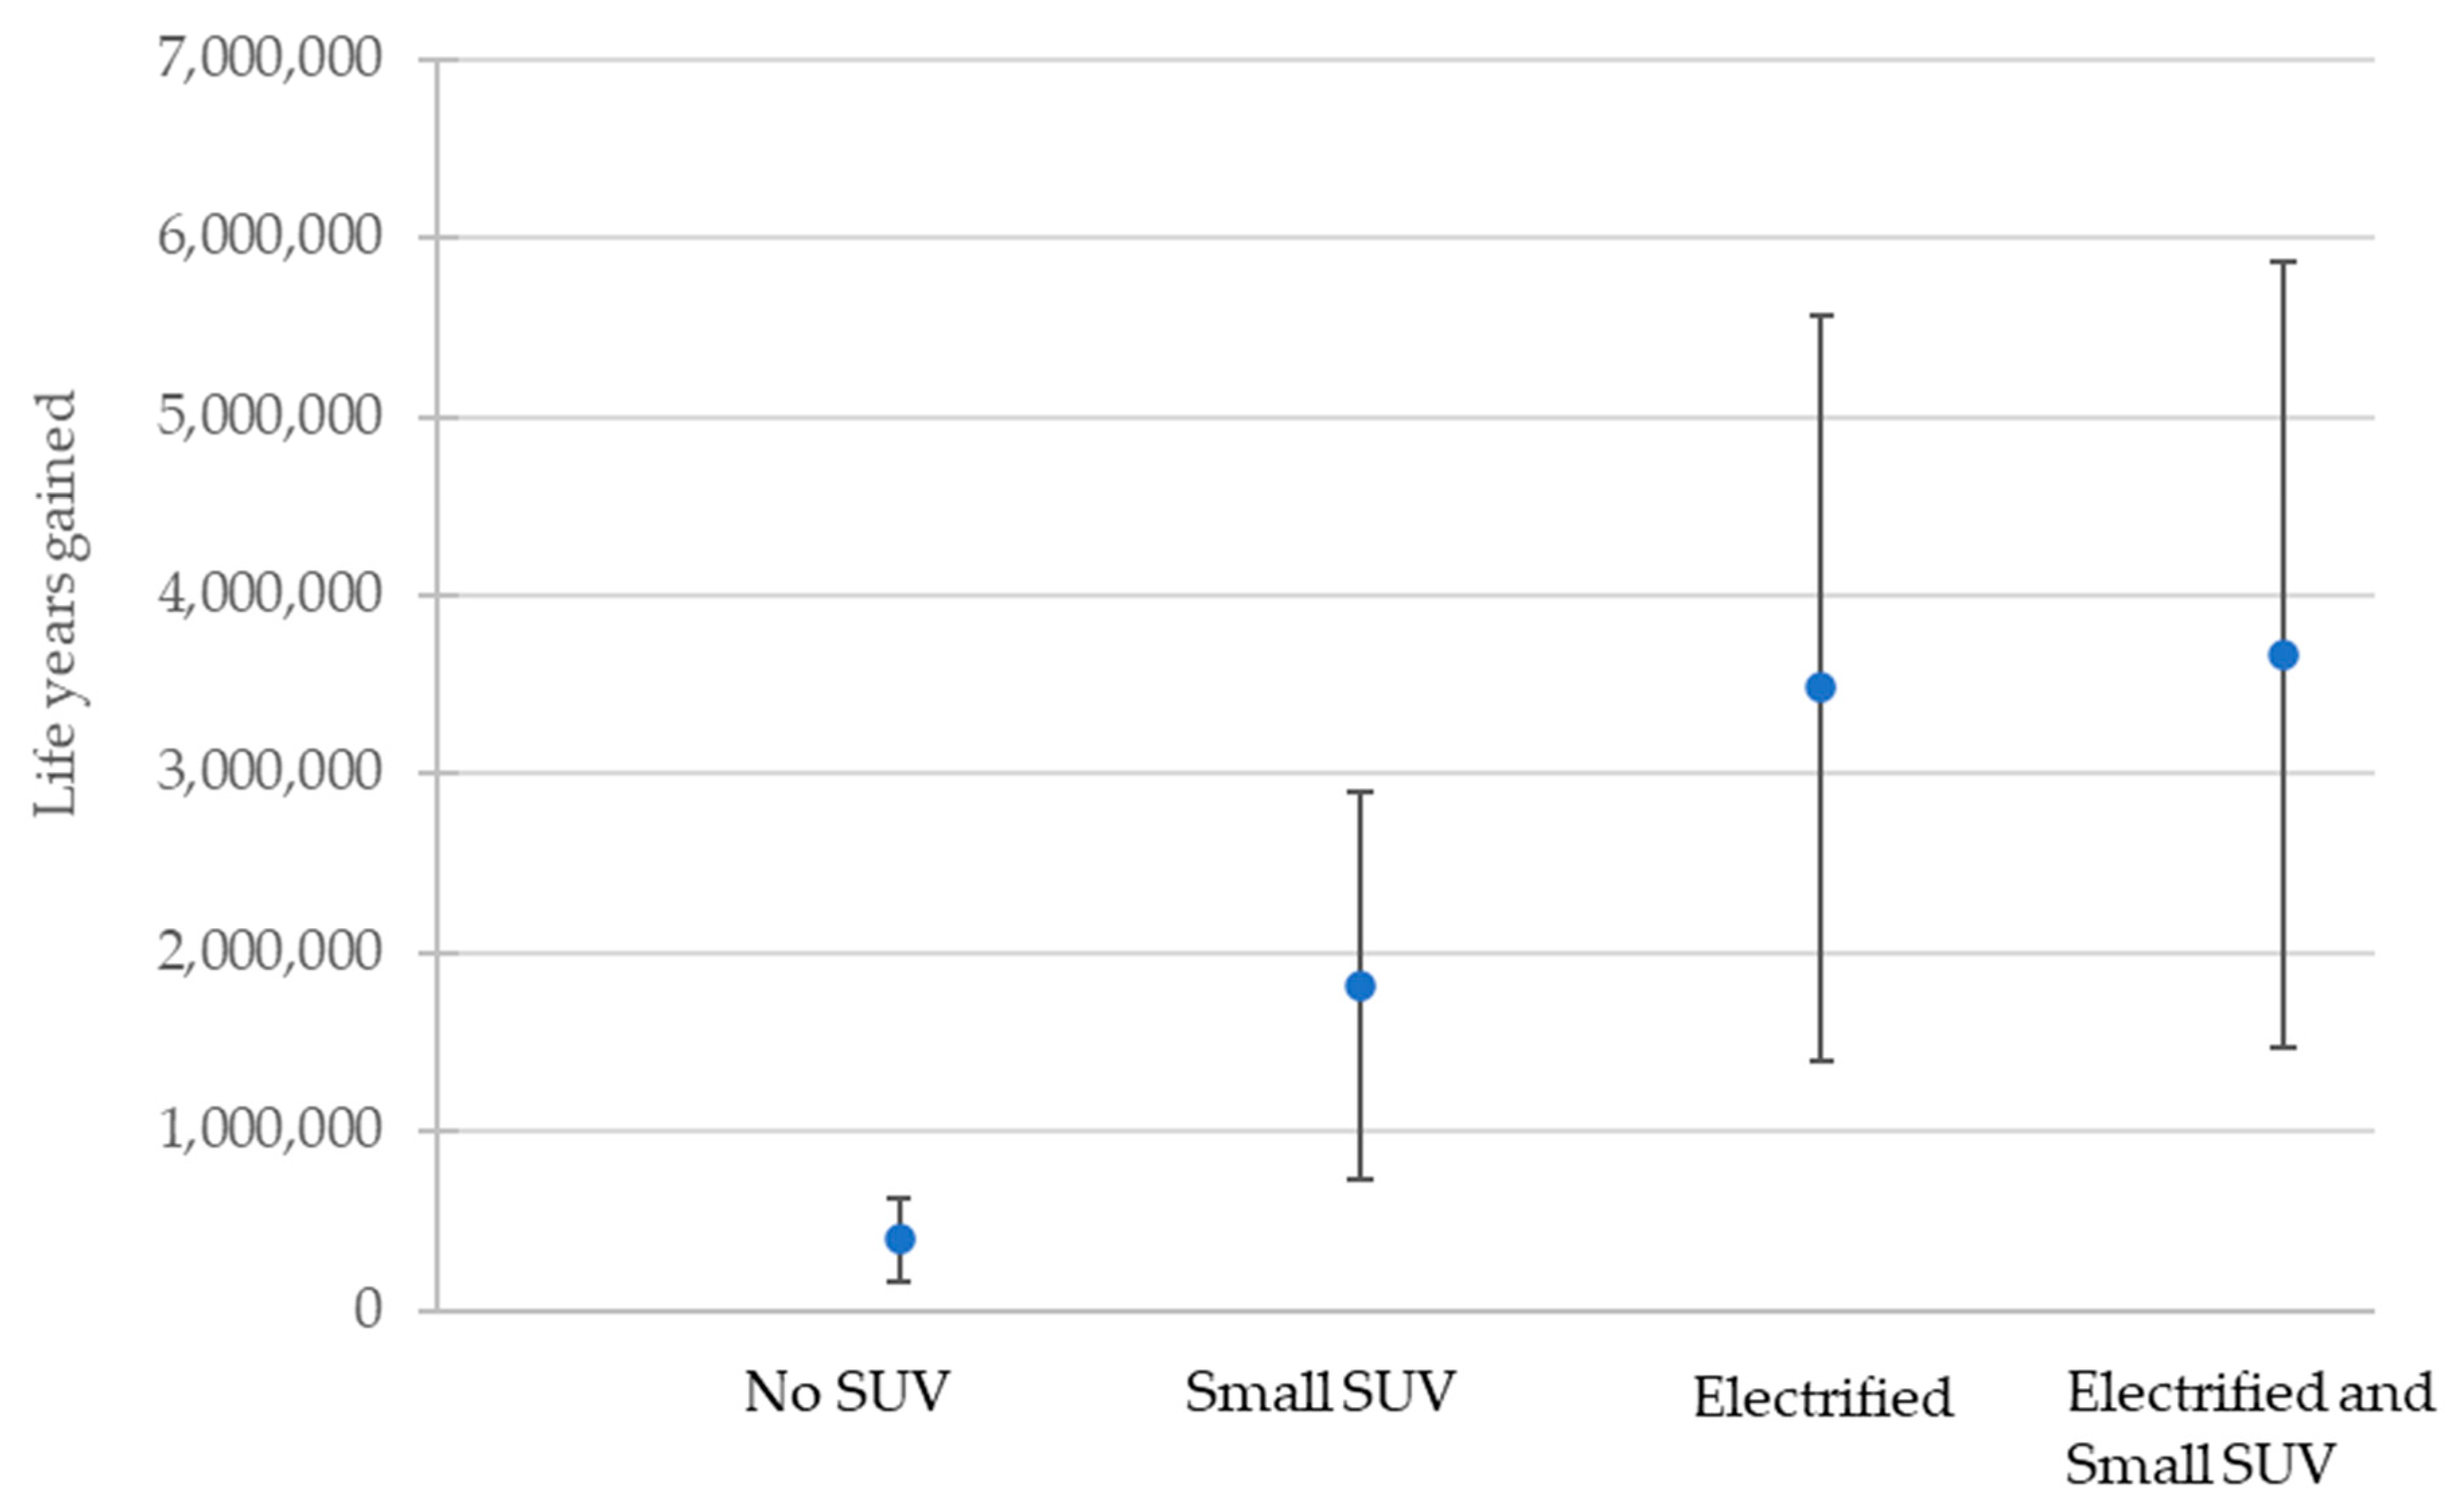
3.3. Health and Monetary Impacts

The marginal abatement costs of making equivalent CO2 emission reductions to those in the scenarios in 2035 or 2050 are shown in Table 7. The central estimate suggests that UK society would be willing to pay up to GBP 447 bn in 2050 to achieve the same carbon savings as projected by the electrified and small SUV scenario implemented from 2020.
All scenarios were associated with gains in life years (i.e., positive health benefits) compared to business as usual, with the largest gains for the electrified and small SUV scenario of approximately 3.7 million life years. The impact of inception lags was small and associated with a decrease in the life years gained of 4–5% (as such lagged estimates are used in all data shown).
By applying the UK Government (HM Treasury) recommended discount rate for health-related interventions of 1.5% and value of VOLY of GBP 60,000 to the lagged estimates of life year gained, reasonable summary estimates of the scenarios can be made (Table 8). The results suggest the that ‘Electrified and Small SUV’ scenario has the greatest number of life years gained and associated value. Interestingly, because the benefit of the change to small SUVs occurs sooner than the benefit of electrification, the monetary value is proportionally greater than the life years gained (9.1% versus 5.4%).
The model was sensitive to the choice of NO2 coefficient (Figure 5), VOLY value, and discount rate (demonstrated in Table 9 for the most ambitious scenario, ‘Electrified and Small SUV’). Overall, this showed that the value of life years gained was highly dependent on the NO2 coefficient used, as well as the discount rate. The value assigned to a single life year had a proportional multiplicative effect on total value.

4. Discussion

Modelling studies, such as this one, can only provide broad estimates of impacts, but our study suggests that large and heavy SUVs are detrimental to the climate (through their greater CO2 emissions) as well as to health (through excessive NOx emissions). When combined with the popularity of SUVs, the model suggests the SUV segment emits more CO2 and NOx pollution than any other, which is in keeping with other analyses [31]. Importantly, this study shows that medium and large SUVs, which are heavier and more likely to be diesel, are responsible for the majority of the SUV segment’s emissions.
Vehicle mass was shown to be the key predictor of CO2 emissions and a significant but weaker predictor of NOx emissions, adding to previous work showing the importance of mass to fuel efficiency [35,36,37,62]. Increasing mass increases the inertia and rolling resistance that must be overcome to accelerate a vehicle and, therefore, increases the energy expended. This study did not investigate the role of potential increased aerodynamic drag for SUVs. However, this is only a significant form of energy loss at higher speeds, such as motorway driving, and previous studies have shown vehicle mass to be a more significant cause of energy loss during typical car journeys [36] and under controlled driving cycles [37].
For CO2 emissions, the model suggests that promoting lighter vehicles, even if they are still SUVs, would offer major emission benefits (‘Small SUV’ scenario). The emissions averted are largest when lighter vehicles are combined with electrification (‘Electrification and Small SUV’ scenario) and provide a substantial additional benefit. This is an important finding as it emphasises that the overall impact of the electrification transition can be significantly improved by incentivising switching to smaller vehicles. The cumulative CO2 difference between the ‘Electrified’ and ‘Electrified and Small SUV’ scenarios from 2020–2050 is 225 Mt. To give that context, 225 MtCO2e is equivalent to 55% of the UK’s entire CO2e emissions for the year 2020 [63].
For NOx emissions, large public health benefits were projected by switching to smaller vehicles. The ‘Small SUV’ scenario resulted in immediate and major improvements in NOx emissions, with a central estimate of around 1.8 million life years gained. The greatest benefits in NO2 reduction and life years were achieved, when this was combined with electrification, with a central estimate of 3.7 million life years gained.
This study has suggested that, in the UK, a shift from heavier SUVs to lighter and smaller vehicles, even if still classed as an SUV, would lead to benefits for the climate and health. Importantly these benefits could be realised more quickly than and in addition to those expected by electrification alone. Such vehicle downsizing achieves greater fuel efficiency by reducing energy loss to inertia (by reducing mass), rolling resistance (using thinner tyres and reduced mass), and aerodynamic drag (with a smaller frontal area). An alternative is light-weighting, which describes the use of lighter materials to produce a vehicle of the same dimensions, which would reduce energy loss by overcoming inertia and rolling resistance.

4.1. Policy Implications

The findings suggest significant societal benefits in moving away from heavy SUVs, in addition to electrification, with immediate policy implications. This study adds nuance to the current policy priority of electrification, highlighting that the vehicle segment, as well as fuel type, is important in meeting our climate and air pollution goals.
The ‘Small SUV’ scenario mimics the introduction of a policy with an immediate switch to small SUVs compared with the graduated transition to BEVs in electrified scenarios. Although this is a simplification, it is not entirely unrealistic, as consumer preference for cars can shift suddenly. For example, from 2016–2021, new diesel registrations collapsed by 85% in the UK [45]. A similar shift to lighter SUVs could occur in the UK, if incentivised, as most consumers seek the SUV aesthetic and high-riding position but most do not require the added utilities of the larger, more powerful SUVs, such as off-roading capability [31]. The ‘Small SUV’ scenario achieves greater reductions than electrification policies by 2035. This improved rate of change is important considering current UK air quality plans have been found to be illegal under UK law [11] and earlier climate mitigation is more effective than later [2].
A further benefit of policies promoting lighter SUVs is the reduced relative disruption compared to electrification. To achieve the UK Government’s electrification transition there must be major changes to society (e.g., consumer education, charging stations, electrical grid improvements) and the auto-manufacturer industry (research and development, supply lines, and retooling factories) [64]. These changes are likely to take longer than incentivising a shift from heavy to lighter SUVs. This could occur from supply-side regulatory changes and demand-side interventions, such as tax incentives.
Regarding supply-side measures, a principle aim of auto-manufacture regulators is to promote vehicle efficiency whilst maintaining a diversity of vehicles that suit different needs, such as varying passenger or cargo capacity [65]. To achieve this in the European market, CO2 emission limits for individual manufacturers are adjusted by the average mass of the manufacturer’s fleet [38]. This allows heavier fleets to have disproportionately higher CO2 emission targets. In practice, targets between manufacturers differed by up to 11 g/km in 2021 [38]. As lighter vehicles are subject to stricter CO2 limits, it can lead to manufacturers designing heavier cars to avoid these limits [38], introducing a perverse incentive towards heavier vehicles. This is then compounded by the less stringent emission targets for heavier vehicles, allowing higher power (and often diesel) engines to be fitted, worsening emissions [65]. This policy further accentuates the correlation of vehicle mass and CO2 emissions due to the role of mass in inertia and rolling resistance forces.
The flaw in this regulation is choosing a proxy measure of utility (vehicle mass) that is also an independent predictor of CO2 emissions [66]. A better utility parameter might be vehicle footprint, calculated by multiplying wheelbase by track width (i.e., the area between the four points where the wheels touch the ground [67]), which is not directly related to CO2 emissions. This should incentivise the use of light-weighting to reduce CO2 emissions. A further benefit of light-weighting could be the use of less material and, therefore, reduced supply chain-related emissions, although this would be highly dependent on the materials and manufacturing process.
For demand-side measures, several European countries use vehicle tax to adjust consumer behaviour towards actions to promote decarbonisation and reduce air pollution, but only a few countries link the tax to vehicle mass. In the UK, new passenger vehicles must pay a graduated ‘vehicle emissions duty; based on CO2 emissions but not mass. In contrast, French vehicle tax is designed to penalise high CO2 emitting vehicles and has additional tax for cars over 1800 kg, charged at a rate of €10/kg [68]. In Norway, which boasts the highest BEV market share of any country, ICE vehicles must pay additional taxes for CO2, NOx, and mass, whilst BEVs benefit from a range of incentives [69,70]. The policies of France and Norway show that it can be politically and practically feasible to tax vehicle mass to achieve both CO2 and air quality aims.
Such policy changes could be supported by further research, such as extending the modelling to other pollutants, especially particulate matter, including from non-tailpipe sources, and considering morbidity as well as mortality [71].

4.2. Strengths and Limitations

This study demonstrates a novel way to combine publicly available databases to interrogate the climate and health impacts of a specific vehicle segment. This is the first study to model the NOx pollution and resultant population health effects of SUVs. For CO2, whilst it was known that SUVs were high emitters, this is the first study to attempt to quantify annual emissions for a national fleet and to model this in relation to electrification and decarbonisation policies and then assess the resulting health impact.
The study used the best available but imperfect data and the model required assumptions and simplifications that could both over- and underestimate the findings. For example, there are well recognised limitations in the measurement of tailpipe emissions. The use of WLTP-derived CO2 emission data is known to be overly optimistic of real-world driving [72]. For NOx emissions, independent roadside testing suggests that using WLTP reported data is also likely to underestimate emissions [73]. However, no single test can describe real-world driving emissions which are dependent on multiple highly variable factors (e.g., driving style, road conditions, temperature, vehicle condition, and loads).
The sensitivity analysis showed that the estimation of the public health impact of NO2 was sensitive to the chosen exposure–response coefficient (Figure 5), the discount rate and monetary value assigned to a life year. The estimates were not particularly sensitive to the use of an inception lag. This study did not adjust for rebound effects that often result from energy efficiency interventions. A policy promoting smaller car use lowers CO2 and NOx emissions by decreasing fuel consumption, but this may encourage more driving, or other carbon intensive activities, such as flying [74]. However, this effect should lessen as all sectors of the economy decarbonise, and is difficult to quantify.
This study considered emissions from tailpipes for ICE vehicles and the electrical grid for charging BEVs. It did not consider embedded emissions from the manufacture and supply chains of any vehicle. It is thought that BEVs have greater manufacturing emissions, but lifetime emissions are much lower [51] and will shrink as economies decarbonise. However, for any given fuel type, larger and heavier vehicles are likely to have larger life-cycle emissions than smaller and lighter cars, as fewer materials are used [31].
The public health dangers of SUVs are not just limited to CO2 and NOx. Particulate matter, noise, and injury risk to other road users all potentially increase with vehicle size and weight [35,36,37]. Particulate matter is excluded in this investigation due to the lack of publicly available data for passenger vehicles registered in the UK. Separating the health effects of NOx and particulate matter is controversial and uncertain, as the pollutants are often highly correlated [7]. This is partly controlled for in this study by the use of unadjusted NOx coefficients, with the assumption that actions that reduce NOx may also reduce particulate matter. There is growing scrutiny on non-exhaust particulate emissions, such as those from brakes, tires, and road wear, especially as the trend towards heavier vehicles, including SUVs and electric vehicles, is likely to result in higher levels of these emissions [75]. However, comprehensive data for these variables are not publicly available for analysis.
Finally, this study assumes a car-centric future to 2050, with continued annual new car sales of 2.5 million per year, in line with industry projections [48]. Although it was not the focus of this work, it is likely that the greatest health benefits could be achieved by shifting to active and public transportation systems [44,76], whilst shared mobility could reduce vehicle life-cycle emissions per traveller [77]. However, the benefits of downsizing SUVs identified in this analysis could occur alongside, and compliment, a structural shift towards active and shared mobility.

5. Conclusions

This modelling study indicates that SUVs contribute a large and disproportionate share to CO2 and NOx emissions from passenger vehicles in the UK, mainly related to their greater mass. Future policy actions that reduce the mass of SUVs sold in the UK could lead to major CO2 and NOx emission reductions. These could be similar in magnitude to but achieved more quickly than the benefits from the electrification of the passenger vehicle fleet. Such changes would be associated with significant public health benefits from improved air quality and mitigation of climate change over the longer-term. To help enable these changes, current manufacturer regulations could be amended so that vehicle CO2 limits are decoupled from vehicle mass and instead based on other measures, such as vehicle footprint. Consumer behaviour change could be achieved by directly taxing vehicle mass to disincentivise heavier SUV purchases.

Author Contributions

Conceptualization, C.D. and P.W.; methodology, C.D. and P.W.; software, C.D.; validation, C.D., J.M. and P.W.; formal analysis, C.D.; investigation, C.D.; resources, C.D.; data curation, C.D.; writing—original draft preparation, C.D.; writing—review and editing, G.S., J.M., G.S.L. and J.T.; visualization, C.D.; supervision, P.W.; project administration, C.D. All authors have read and agreed to the published version of the manuscript.

Funding

This research received no external funding.

Institutional Review Board Statement

Not applicable.

Data Availability Statement

Publicly available datasets were analysed in this study. The datasets used to develop the underlying model can be found here: Vehicle licensing statistics data tables. Available online: https://www.gov.uk/government/statistical-data-sets/vehicle-licensing-statistics-data-tables (accessed on 1 March 2023); for fuel and emissions information: Vehicle Certification Agency. Directgov: https://carfueldata.vehicle-certification-agency.gov.uk/downloads/default.aspx (accessed on 1 March 2023); for vehicle characteristics: https://www.eea.europa.eu/en/datahub (accessed on 1 March 2023).

Acknowledgments

The co-authors would like to honour the memory of the late Paul Wilkinson, who sadly died in September 2022. He was a brilliant teacher and mentor and he oversaw this work. The views represented in this manuscript do not necessarily reflect those of UK Health Security Agency.

Conflicts of Interest

The authors declare no conflict of interest.

References

  1. Romanello, M.; Mcgushin, A.; Di Napoli, C.; Drummond, P.; Hughes, N.; Jamart, L.; Kennard, H.; Lampard, P.; Solano Rodriguez, B.; Arnell, N.; et al. The 2021 report of the Lancet Countdown on health and climate change: Code red for a healthy future. Lancet 2021, 398, 1619–1662. [Google Scholar] [CrossRef] [PubMed]
  2. Shukla, P.; Skea, J.; Resinger, A.; Slade, R.; Pathak, M.; Al Khourdajie, A.; van Diemen, R.; Abdulla, A.; Akimoto, K.; Babiker, M.; et al. Climate Change 2022 Mitigation of Climate Change: Summary for Policymakers; Intergovernmental Panel on Climate Change: Geneva, Switzerland, 2022. [Google Scholar]
  3. Department for Business Energy & Industrial Strategy. Net Zero Strategy: Build Back Greener; Department for Business Energy & Industrial Strategy: London, UK, 2021. [Google Scholar]
  4. Department for Business Energy & Industrial Strategy. 2021 UK Greenhouse Gas Emissions, Final Figures; Department for Business Energy & Industrial Strategy: London, UK, 2023. [Google Scholar]
  5. Forouzanfar, M.H.; Afshin, A.; Alexander, L.T.; Anderson, H.R.; Bhutta, Z.A.; Biryukov, S.; Brauer, M.; Burnett, R.; Cercy, K.; Charlson, F.J.; et al. Global, regional, and national comparative risk assessment of 79 behavioural, environmental and occupational, and metabolic risks or clusters of risks, 1990–2015: A systematic analysis for the Global Burden of Disease Study 2015. Lancet 2016, 388, 1659–1724. [Google Scholar] [CrossRef] [PubMed] [Green Version]
  6. World Health Organisation. Review of Evidence on Health Aspects of Air Pollution–REVIHAAP Project; WHO Regional Office for Europe: Copenhagen, Denmark, 2013. [Google Scholar]
  7. Committee on the Medical Effects of Air Pollutants (COMEAP). Statement on the Evidence for the Effect of Nitrogen Dioxide on Health; Public Health England: London, UK, 2015. [Google Scholar]
  8. Kelly, F.; Harrison, R. Associations of Long Term Average Concentrations of Nitrogen Dioxide with Mortality; Committee on the Medical Effects of Air Pollutants (COMEAP): Oxford, UK, 2018. [Google Scholar]
  9. Department for Environment Food & Rural Affairs. Air Pollution in the UK 2015; Department for Environment Food & Rural Affairs: London, UK, 2016. [Google Scholar]
  10. Davies, G. Tackling Local Breaches of Air Quality; National Audit Office: London, UK, 2022. [Google Scholar]
  11. Garnham, M.J. ClientEarth (No.3) v SoSEFRA, SoSfT, WM; Royal Courts of Justice: London, UK, 2018. [Google Scholar]
  12. Jung, J.C.; Sharon, E. The Volkswagen emissions scandal and its aftermath. GBOE 2019, 38, 6–15. [Google Scholar] [CrossRef]
  13. Whitty, C. Chief Medical Officer’s Annual Report 2022: Air Pollution; Department of Health and Social Care: London, UK, 2022. [Google Scholar]
  14. Department for Environment Food & Rural Affairs. Emissions of Air Pollutants in the UK–Nitrogen Oxides (NOx). Available online: https://www.gov.uk/government/statistics/emissions-of-air-pollutants/emissions-of-air-pollutants-in-the-uk-nitrogen-oxides-nox#major-emission-sources-for-nitrogen-oxides-in-the-uk (accessed on 23 May 2023).
  15. Department for Transport. Transitioning to Zero Emission Cars and Vans: 2035 Delivery Plan; ICCT: Washingtom, DC, USA, 2021. [Google Scholar]
  16. Requia, W.J.; Mohamed, M.; Higgins, C.D.; Arain, A.; Ferguson, M. How clean are electric vehicles? Evidence-based review of the effects of electric mobility on air pollutants, greenhouse gas emissions and human health. Atmos. Environ. 2018, 185, 64–77. [Google Scholar] [CrossRef]
  17. Tessum, C.W.; Hill, J.D.; Marshall, J.D. Life cycle air quality impacts of conventional and alternative light-duty transportation in the United States. Proc. Natl. Acad. Sci. USA 2014, 111, 18490–18495. [Google Scholar] [CrossRef] [Green Version]
  18. Schnell, J.L.; Naik, V.; Horowitz, L.W.; Paulot, F.; Ginoux, P.; Zhao, M.; Horton, D.E. Air quality impacts from the electrification of light-duty passenger vehicles in the United States. Atmos. Environ. 2019, 208, 95–102. [Google Scholar] [CrossRef]
  19. Machedon-Pisu, M.; Borza, P.N. Is the Transition to Electric Passenger Cars Sustainable? A Life Cycle Perspective. Sustainability 2023, 15, 2614. [Google Scholar] [CrossRef]
  20. Dirnaichner, A.; Rottoli, M.; Sacchi, R.; Rauner, S.; Cox, B.; Mutel, C.; Bauer, C.; Luderer, G. Life-cycle impacts from different decarbonization pathways for the European car fleet. Environ. Res. Lett. 2022, 17, 044009. [Google Scholar] [CrossRef]
  21. Timmers, V.R.J.H.; Achten, P.A.J. Non-exhaust PM emissions from electric vehicles. Atmos. Environ. 2016, 134, 10–17. [Google Scholar] [CrossRef]
  22. Oroumiyeh, F.; Zhu, Y. Brake and tire particles measured from on-road vehicles: Effects of vehicle mass and braking intensity. Atmos. Environ. X 2021, 12, 100121. [Google Scholar] [CrossRef]
  23. Beddows, D.C.S.; Harrison, R.M. PM10 and PM2.5 emission factors for non-exhaust particles from road vehicles: Dependence upon vehicle mass and implications for battery electric vehicles. Atmos. Environ. 2021, 244, 117886. [Google Scholar] [CrossRef]
  24. Maesano, C.N.; Morel, G.; Matynia, A.; Ratsombath, P.; Bonnety, J.; Legros, G.; Da Costa, P.; Prud’homme, J.; Annesi-Maesano, I. Impacts on human mortality due to reductions in PM10 concentrations through different traffic scenarios in Paris, France. Sci. Total Environ. 2020, 698, 134257. [Google Scholar] [CrossRef] [PubMed]
  25. Choma, E.F.; Evans, J.S.; Hammitt, J.K.; Gómez-Ibáñez, J.A.; Spengler, J.D. Assessing the health impacts of electric vehicles through air pollution in the United States. Environ. Int. 2020, 144, 106015. [Google Scholar] [CrossRef] [PubMed]
  26. Peters, D.R.; Schnell, J.L.; Kinney, P.L.; Naik, V.; Horton, D.E. Public Health and Climate Benefits and Trade-Offs of U.S. Vehicle Electrification. GeoHealth 2020, 4, e2020GH000275. [Google Scholar] [CrossRef]
  27. Moglia, M.; Nygaard, C.A.; Dembek, K.; Dia, H. Air quality as a game-changer: Pathways towards large-scale vehicle electrification in Australia. Transp. Res. Part D Transp. Environ. 2022, 109, 103400. [Google Scholar] [CrossRef]
  28. Skipper, T.N.; Lawal, A.S.; Hu, Y.; Russell, A.G. Air quality impacts of electric vehicle adoption in California. Atmos. Environ. 2023, 294, 119492. [Google Scholar] [CrossRef]
  29. Garcia, E.; Johnston, J.; McConnell, R.; Palinkas, L.; Eckel, S.P. California’s early transition to electric vehicles: Observed health and air quality co-benefits. Sci. Total Environ. 2023, 867, 161761. [Google Scholar] [CrossRef]
  30. Cozzi, L.; Petropoulos, A. Global SUV Sales Set Another Record in 2021, Setting Back Efforts to Reduce Emissions; International Energy Agency: Paris, France, 2021. [Google Scholar]
  31. Global Fuel Economy Initiative. Working Paper 22: Vehicle Fuel Economy in Major Markets 2005–2019; International Energy Agency: Paris, France, 2021. [Google Scholar]
  32. Kasser, T.; Royo, M.G.; Bardoelt, C.; Simms, A. Advertising and Demand for Sports Utility Vehicles; New Weather Institute Badvertising: London, UK, 2021. [Google Scholar]
  33. Guan, M.; Kostring, J.-C.; Middleton, S.; Moller, T. Luxury-Car Sales Continue to Surpass the Mass Market in Terms of Growth, Profitability, and Buzz. Here’s Why. Available online: https://www.mckinsey.com/industries/automotive-and-assembly/our-insights/five-trends-shaping-tomorrows-luxury-car-market (accessed on 1 March 2023).
  34. Axsen, J.; Long, Z. Sport utility vehicles and willingness-to-downsize: A mixed-method exploration of functional, symbolic, and societal consumer perceptions in Canada. Energy Res. Soc. Sci. 2022, 92, 102776. [Google Scholar] [CrossRef]
  35. Carslaw, D.C. New Directions: A heavy burden for heavy vehicles: Increasing vehicle weight and air pollution. Atmos. Environ. 2006, 40, 1561–1562. [Google Scholar] [CrossRef]
  36. Burgess, S.C.; Choi, J.M.J. A parametric study of the energy demands of car transportation: A case study of two competing commuter routes in the UK. Transp. Res. Part D Transp. Environ. 2003, 8, 21–36. [Google Scholar] [CrossRef]
  37. Tolouei, R.; Titheridge, H. Vehicle mass as a determinant of fuel consumption and secondary safety performance. Transp. Res. Part D Transp. Environ. 2009, 14, 385–399. [Google Scholar] [CrossRef]
  38. Mock, P.; Tietge, U.; Dornoff, J. Adjusting for Vehicle Mass and Size in European Post-2020 CO2 Targets for Passenger Cars; The International Council on Clean Transportation: Washington, DC, USA, 2018. [Google Scholar]
  39. Desapriya, E.; Subzwari, S.; Sasges, D.; Basic, A.; Alidina, A.; Turcotte, K.; Pike, I. Do Light Truck Vehicles (LTV) Impose Greater Risk of Pedestrian Injury Than Passenger Cars? A Meta-analysis and Systematic Review. Traffic Inj. Prev. 2010, 11, 48–56. [Google Scholar] [CrossRef] [PubMed]
  40. Edwards, M.; Leonard, D. Effects of large vehicles on pedestrian and pedalcyclist injury severity. J. Saf. Res. 2022, 82, 275–282. [Google Scholar] [CrossRef] [PubMed]
  41. Tyndall, J. Pedestrian deaths and large vehicles. Econ. Transp. 2021, 26–27, 100219. [Google Scholar] [CrossRef]
  42. Toy, E.L.; Hammitt, J.K. Safety Impacts of SUVs, Vans, and Pickup Trucks in Two-Vehicle Crashes. Risk Anal. 2003, 23, 641–650. [Google Scholar] [CrossRef]
  43. Fredette, M.; Mambu, L.S.; Chouinard, A.; Bellavance, F. Safety impacts due to the incompatibility of SUVs, minivans, and pickup trucks in two-vehicle collisions. Accid. Anal. Prev. 2008, 40, 1987–1995. [Google Scholar] [CrossRef]
  44. Milner, J.; Turner, G.; Ibbetson, A.; Eustachio Colombo, P.; Green, R.; Dangour, A.D.; Haines, A.; Wilkinson, P. Impact on mortality of pathways to net zero greenhouse gas emissions in England and Wales: A multisectoral modelling study. Lancet Planet. Health 2023, 7, e128–e136. [Google Scholar] [CrossRef]
  45. Department for Transport and Driving and Vehicle Licenisng Agency. Vehicle Licensing Statistics Data Tables. Available online: https://www.gov.uk/government/statistical-data-sets/vehicle-licensing-statistics-data-tables (accessed on 1 March 2023).
  46. Agency, V.C. Directgov-Download Car Fuel and Emissions Information. Available online: https://carfueldata.vehicle-certification-agency.gov.uk/downloads/default.aspx (accessed on 1 March 2023).
  47. European Environment Agency. Dataset: CO2 Emissions from New Passenger Cars; European Environment Agency: Copenhagen, Denmark, 2022. [Google Scholar]
  48. Society of Motor Manufacturers and Traders. SMMT New Car Market and Parc Outlook to 2035 by Powertrain Type at 11 June 2021; SMMT: London, UK, 2021. [Google Scholar]
  49. National Travel Survey: 2019. Available online: https://www.gov.uk/government/statistics/national-travel-survey-2019 (accessed on 1 March 2023).
  50. Wengraf, I. New Car Mileage Based on Analysis of MOT Data; RAC: Walsall, UK, 2020. [Google Scholar]
  51. Climate Change Committee. Sixth Carbon Budget-Climate Change Committee; Climate Change Committee: London, UK, 2020. [Google Scholar]
  52. EV Database. Available online: https://ev-database.uk/cheatsheet/energy-consumption-electric-car (accessed on 29 May 2023).
  53. Department for Business, Energy & Industrial Strategy. Valuation of Greenhouse Gas Emissions: For Policy Appraisal and Evaluation; UK Government: London, UK, 2021.
  54. Department for Environment Food & Rural Affairs. Pollutant Information; Department for Environment Food & Rural Affairs: London, UK, 2022. [Google Scholar]
  55. Miller, B.; Hurley, J.F. Comparing Estimated Risks for Air Pollution with Risks for Other Health Effects; Institute of Occupational Medicine: Edinburgh, UK, 2006. [Google Scholar]
  56. Office for National Statistics. Estimates of the Population for the UK, England and Wales, Scotland and Northern Ireland. Available online: https://www.ons.gov.uk/peoplepopulationandcommunity/populationandmigration/populationestimates/datasets/populationestimatesforukenglandandwalesscotlandandnorthernireland (accessed on 1 March 2023).
  57. Deaths Registered in England and Wales. Available online: https://www.ons.gov.uk/peoplepopulationandcommunity/birthsdeathsandmarriages/deaths/bulletins/deathsregistrationsummarytables/2019 (accessed on 1 March 2023).
  58. HM Treasury. The Green Book-Central Government Guidance on Appraisal and Evaluation; UK Government: London, UK, 2022.
  59. National Institute of Clinical Excellence. The Appraisal of the Evidence and Structured Decision-Making Guide to the Methods of Technology Appraisal 2013. Available online: https://www.nice.org.uk/process/pmg9/chapter/foreword (accessed on 29 May 2023).
  60. Cameron, T.; Ostro, B. Advisory Council on Clean Air Compliance Analysis Response to Agency Request on Cessation Lag; Environmental Protection Agency: Washington, DC, USA, 2004. [Google Scholar]
  61. Clarke, L. Atmospheric Emissions: Greenhouse Gases by Industry and Gas; Office for National Statistics: Newport, UK, 2022. [Google Scholar]
  62. Tolouei, R. Carbon Policies Targeting Road Transport: Is There a Safety Consequence? Transp. Res. Procedia 2015, 8, 259–271. [Google Scholar] [CrossRef] [Green Version]
  63. Department for Business, Energy & Industrial Strategy. 2020 UK Greenhouse Gas Emissions, Final Figures; UK Government: London, UK, 2022.
  64. Lienert, L.; Bellon, T. Global Carmakers now Target $515 Billion for EVs, Batteries; Reuters: London, UK, 2021. [Google Scholar]
  65. German, J.; Lutsey, N. Size or Mass? The Technical Rationale for Selecting Size as an Attribute for Vehicle Efficiency Standards; International Council on Clean Transportation: Washington, DC, USA, 2010. [Google Scholar]
  66. Meszler, D.; German, J.; Mock, P.; Bandivadel, A. CO2 Reduction Technologies for the European Car And Van Fleet, A 2025–2030 Assessment Impact of Mass Reduction Discounting on Compliance Costs for Future EU CO2 Standards; International Council on Clean Transportation: Washington, DC, USA, 2018. [Google Scholar]
  67. Mock, P. Evaluation of Parameter-Based Vehicle Emissions Targets in the EU; The International Council on Clean Transportation: Washington, DC, USA, 2011. [Google Scholar]
  68. Public Service of France. Calculate the Amount of the Penalty to the Weight (Tax on the Mass in Running Order) (Simulator). Available online: https://www.service-public.fr/particuliers/vosdroits/R60869 (accessed on 29 May 2023).
  69. Norwegian EV Policy. Available online: https://elbil.no/english/norwegian-ev-policy/ (accessed on 1 March 2023).
  70. Eskeland, G.; Yan, S. The Norwegian CO2-Differentiated Motor Vehicle Registration Tax, an Extended Cost-Benefit Analysis; Organisation for Economic Coperation and Development: Paris, France, 2021. [Google Scholar]
  71. Tailpipe Emissions—Emissions Analytics. Available online: https://www.emissionsanalytics.com/tailpipe-emissions (accessed on 1 May 2023).
  72. Wappelhorst, S. Germany’s Vehicle Tax System: Small Steps towards Future-Proof Incentives for Low-Emission Vehicles-International Council on Clean Transportation; International Council on Clean Transportation: Washington, DC, USA, 2020. [Google Scholar]
  73. Jens Borken-Kleefeld, T.D. Remote Sensing of Motor Vehicle Exhaust Emissions; The ICCT: Washington, DC, USA, 2018. [Google Scholar]
  74. Brockway, P.; SOrrell, S.; Semieniuk, G.; Heun, M.; Court, V. Energy efficiency and economy-wide rebound effects: A review of the evidence and its implications. Renew. Sustain. Energy Rev. 2021, 141, 110781. [Google Scholar] [CrossRef]
  75. Monks, P. Air Quality Expert Group: Non-Exhaust Emissions from Road Traffic; Department for Environment Food & Rural Affairs: London, UK, 2019. [Google Scholar]
  76. Mihaylova, N. How Transport Offers a Route to Better Health. Available online: https://www.health.org.uk/publications/long-reads/how-transport-offers-a-route-to-better-health (accessed on 1 March 2023).
  77. Morfeldt, J.; Johansson, D.J.A. Impacts of shared mobility on vehicle lifetimes and on the carbon footprint of electric vehicles. Nat. Commun. 2022, 13, 6400. [Google Scholar] [CrossRef]
Figure 1. (a) Passenger vehicle CO2 emissions by mass stratified by SUV status; (b) passenger vehicle CO2 emissions by mass stratified by fuel type. Note: BEVs have zero tailpipe CO2 emissions.
Ijerph 20 06043 g001aIjerph 20 06043 g001b
Figure 2. (a) Predicted annual CO2 emissions for 2020 registrations by fuel type; (b) Percentage of annual CO2 emissions versus percentage of total registrations in 2020.
Ijerph 20 06043 g002
Figure 3. (a) Annual CO2 emissions from new passenger vehicles. Note the impact of COVID on CO2 emissions in 2020 and assumed recovery to pre-pandemic car sales in 2021; (b) cumulative CO2 emissions of new passenger vehicles from 2020 onwards at 2035 or 2050.
Ijerph 20 06043 g003aIjerph 20 06043 g003b
Figure 4. (a) NOx emissions in first year of use for new registrations; (b) annual NOx emissions from UK passenger vehicle fleet; (c) projected NO2 decrease relative to the BAU from the UK passenger vehicle fleet.
Ijerph 20 06043 g004aIjerph 20 06043 g004b
Figure 5. Low, central, and high estimates of life years gained by scenario based on low, central and high NO2 coefficients.
Ijerph 20 06043 g005
Table 1. Overview of EURO segments, other names, and bestselling examples.
EURO SegmentOther NamesBestselling 2020 UK Generic Model Examples
AMini, city car, minicompactFiat 500
BSmall, supermini, subcompactVauxhall Corsa
CMedium, small family, compactVolkswagen Golf
DLarge, large-family,BMW 3 Series
EExecutive, full-sizeBMW 5 Series
FLuxury, full-size luxury BMW 7 Series
JSports utility vehicles, 4 × 4, crossoverSmall SUV: Ford Puma
Medium SUV: VW Tiguan
Large SUV: Land Rover Defender
MMulti-purposeFord Tourneo
SSportsPorsche Taycan
Table 2. Count of vehicle units by EURO segment and fuel type used in CO2 model.
EURO
Segment
DieselDiesel
Hybrid
BEVPetrolPetrol
Hybrid
Petrol PHEVRow Total % of Fleet
A 10,35170,790 81,1415.2
B 2756260,11293,976 356,84422.9
C12,917 11,399116,00231,16435,580207,06213.3
D18,035 908176,8072326 106,2496.8
E15,691 31302948 21,7691.4
F1186 11860.1
J194,116113031,146353,03742,1724932626,53340.2
Large SUV141,705 31,14640,57618,8934932237,25215.2
Medium SUV52,4111130 148,52623,279 225,34614.4
Small SUV 163,935 163,93510.5
M72,263 35,292 107,5556.9
S2285 483644,992 52,1133.3
Column totals 316,493113072,699959,980169,63840,5121,560,452
% of fleet 20.30.14.761.510.92.6
Table 3. Results of multiple linear regression for WLTP CO2 emissions. The overall regression was statistically significant (R2 = 0.8857, F = 276.9, p < 0.0001).
Coefficient95% CIp-Value
WLTP test mass (kg)0.10280.090, 0.116<0.001
Engine capacity (cm3)0.01980.015, 0.025<0.001
Wheelbase (mm)−0.0793−0.10, −0.582<0.001
Fuel type (1 = Diesel, 0 = Petrol)−24.366−29.92, −18.81<0.001
Constant181.546137.7, 225.4<0.001
Table 4. Regression results for RDE NOx emissions for diesel and petrol vehicles. Diesel: R2 = 0.513, F = 12.59, p = 0.0003. Petrol: R2 = 0.122 F = 4.13, p = 0.0228.
DieselPetrol
Coefficient95% CIp-ValueCoefficient95% CIp-Value
WLTP test mass (kg)0.06770.028, 0.1080.0020.06770.028, 0.1080.002
Engine capacity (cm3)0.02990.004, 0.0560.0260.02990.004, 0.0560.026
Constant−57.04−140.54, 26.460.17−57.04−140.54, 26.460.17
Table 5. CO2 and NOx emissions ratios (F and E segment omitted as only represented by two or fewer car models).
EURO
Segment
Vehicles
Registered in 2020 (n)
CO2/
Registration Ratio
NOx/
Registration
Ratio
CO2
Emissions/Vehicle
(Tonnes/Year)
NOx per
Vehicle (kg/pa)
A35,7160.740.5991.250.816
B220,2250.770.9371.301.276
C174,6290.760.9411.281.283
D74,6331.040.7341.761.000
J443,7131.251.1232.111.530
Large SUV114,3781.681.5152.842.064
Medium SUV187,9011.121.0481.891.428
Small SUV141,4340.890.9051.501.232
M19,2671.561.3172.641.794
S11,1871.090.5531.850.754
Table 6. Cumulative CO2 by 2035 or 2050.
ScenarioCumulative CO2 Emitted (Mt)% Change from BAU
2020 to 20352020 to 2050By 2035By 2050
BAU5421,42900
Small SUV276727−49−49
No SUV4621217−15−15
Electrified 380473−30−67
Electrified and small SUV197248−63−83
Table 7. Value of CO2 abated by 2035 and 2050 (GBP billions at 2020 prices).
At 2035At 2050
Low (GBP 151.1/t)Central (GBP 302.3/t)High (GBP 453.4/t)Low (GBP 189.2/t)Central (GBP 378.3/t)High (GBP 567.5/t)
Small SUV4080121133266398
No SUV1224364080120
Electrified 244973181362543
Electrified and small SUV52104156224447671
Table 8. Central estimates of life years and valued gained using HM Treasury’s recommended discount and VOLY.
ScenarioLife Years Gained vs. BAU% Change from
Electrified Scenario
Value
(GBP 000,000s)
% Change from
Electrified Scenario
No SUV393,455 −88.710,052−87.9
Small SUV1,810,500−50.746,255−48.9
Electrified3,482,183082,9370
Electrified and Small SUV3,669,2525.490,5249.1
Table 9. Summary of the electrified and small SUV sensitivity analysis (values in GBP 000,000s).
VOLYDiscount RateNO2 Coefficient (95% CI)
Lower Limit (1.008)Central
(1.023)
Upper Limit (1.037)
GBP 20,0001.5%10,57430,17548,211
3.50%388911,09917,732
GBP 60,0001.5%31,72190,524144,633
3.50%11,66733,29653,195
Disclaimer/Publisher’s Note: The statements, opinions and data contained in all publications are solely those of the individual author(s) and contributor(s) and not of MDPI and/or the editor(s). MDPI and/or the editor(s) disclaim responsibility for any injury to people or property resulting from any ideas, methods, instructions or products referred to in the content.

