1. Introduction
Varying driving behaviors influence traffic flow patterns and cause the occurrence of stopping shock waves. This response leads to traffic flow instability, which may be a longstanding cause of crashes [
1,
2,
3]. In the United States, the statistical results show that 32,999 people died in car crashes according to National Highway Traffic Safety Administration in 2010. In addition, 58,523 people died in road traffic accidents in 2014 [
4]. Rear-end collisions (RECs) are the most common accident type in the world [
5]. For instance, RECs of 35.9% occurred in Washington State. Refs. [
6,
7] show that China’s highway REC accidents accounted for about 40% of all traffic accidents. Generally speaking, three major elements of a transportation system, including vehicles, road infrastructure, and human factors, determine roadway crashes [
8,
9,
10]. However, human factors are the main impact factor for traffic flow stability and RECs. Therefore, it is necessary to carry out analysis and research on driver’s behavior characteristics (DBCs) of the car-following process, which is conducive to understanding the mechanism of shock wave evolution to avoid RECs.
DBCs, such as instantaneous acceleration/deceleration, driver’s reaction time, and risk perception level in particular, are especially vulnerable to psychological state. Ahmed et al. [
11] presented a thorough review of the literature on the car-following models, which mainly study the driving behavior of vehicles on a roadway system by micro-simulation. Tarko et al. [
12] presented an important finding that there is a strong correlation between the frequency of deceleration rates and the observed crash rates. Similarly, Kim et al. also obtained the relationship between micro scale driving behavior and REC propensity [
13], who also found a high crash rate when drivers exhibit a high deceleration rate. An extended REC risk model is proposed considering perception–response time of drivers by a modified negative binomial regression [
14]. Moreover, research also shows that driver risk perception of driving behaviors is very important for driving ability, which can enable drivers to avoid REC risks in complex traffic scenes [
15,
16,
17]. Feng et al. [
18] showed that aggressive driving behavior is the crucial factor for the personality of the drivers and violation of other vehicles. Tu et al. [
19] found that the heterogeneity among drivers has a significant effect on road safety. Chung et al. [
20] considered actual DBCs to develop the acceleration model and the sensitivity term for preventing RECs in the car-following process. This research shows that DBCs have important effects on the RECs. Moreover, micro-scale driver behaviors play important roles in the traffic flow pattern [
21,
22,
23]. The traffic flow consists of the different drivers existing in the real traffic. Therefore, different drivers mean different DBCs in the car-following process. Basically, the occurrence of RECs caused by traffic shock waves in the context of heterogeneous traffic flow. Hourdos [
24] pointed out that stopping shock waves causes RECs in the car-following process. Zheng et al. [
25] also pointed out that an important risk factor of traffic accident is the variability in speed when successive shock waves happened on the freeway. Chatterjee and Davis [
26] investigated a mechanism of REC on a crowded highway. Moreover, the stability theory of the car-following model shows that traffic shock waves spread backward, and leads to a higher REC risk for the vehicles behind the platoon [
27]. Therefore, how to get a clear understanding of the DBCs in car-following safety becomes a topic worthy of much discussion.
Recently, some scholars have paid a lot of attention to the heterogeneous traffic flow [
28,
29,
30,
31,
32,
33]. However, this research is mainly concerned with the traffic flow stability analysis frameworks. Few studies have been focused on car-following safety analysis caused by different DBCs in heterogeneous traffic flow. Therefore, our aims are to analyze the influence of different DBCs on the car-following safety by using a microscopic car-following model. As discussed in previous literature, driver’s risk perception levels largely affected DBCs in the actual traffic. These DBCs mainly include physiological and psychological characteristics of drivers. The parameters of desired safety margin (DSM) model by Lu et al. [
34] can characterize physiological and psychological characteristics of drivers, including driver’s reaction time, acceleration and deceleration preference coefficients, and upper and lower limits of the DSM. From this perspective, this study will employ the DSM model to investigate the influence of DBCs on the car-following safety.
To this end, other chapters of this paper are as follows. In
Section 2, objectives and contributions of this study are given. In
Section 3, the DSM model is introduced, and the corresponding DBCs parameters are calibrated.
Section 4 analyzes the mechanism of REC in the car-following process, and REC conditions are derived. In
Section 5, five DBCs parameters for REC risk are investigated according to the REC conditions. Numerical experiments and discussion are given in
Section 6. In
Section 7, our conclusions are given.
2. Objectives and Contributions
The objective of this study is to investigate the impact of DBC variables on the car-following safety. This study answers three questions regarding the car-following safety. (1) How do the response time, acceleration and deceleration preference coefficients, and the limits of the DSM affect the car-following safety? (2) How do different DBCs impact the REC risk? (3) How are the REC probability patterns related to the driver’s category in car-following process? The contributions of this study are two-fold. First, this study is a pioneering work exploring the quantitative relationship between the subjective risk perception levels, acceleration and deceleration sensitivity, reaction ability of the driver, and the car-following safety based on the Monte Carlo simulation method. Second, a reasonable value of DBCs can reduce traffic accidents and enhance traffic flow stability. Therefore, exploring the influence of some DBC variables on car-following safety is useful to rear-end risk.
3. DSM Model and Its Parameter Calibration
The DSM model by Lu et al. [
35] is described as:
and
where
an(
t) is the
nth vehicle’s acceleration;
SMnDH and
SMnDL are respectively the lower and upper limits of the DSM for the
nth driver;
α1 and
α2 denote the sensitivity coefficients of acceleration and deceleration, respectively;
τ is driver’s reaction time;
τ2 is the brake system’s reaction time, and its value sets 0.15 s for the car;
Vn(
t) is the
nth vehicle’s speed;
denotes spacing headway;
dn(
t) is the
nth vehicle’s deceleration;
Ln−1 is the length of the
n−1th vehicle.
DBCs parameters based on DSM model have been calibrated to use Genetic Algorithm using enhanced NGSIM dataset. We choose sixty car-following cases.
Table 1 shows that the statistic results of DBCs parameters. From
Table 1, we obtain that the mean of
α1 is about 8.51 m/s
2, the std. deviation of
α1 is about 5.301 m/s
2, and that the mean of
α2 is about 14.14 m/s
2 and the std. deviation of
α2 is about 8.276 m/s
2, and that the mean of
SMnDL is 0.76, and the std. deviation of
SMnDL is 0.125, and that the mean of
SMnDH is 0.95, and the std. deviation of
SMnDH is 0.045. The mean of driver’s reaction time
τ is 0.65 s, and the std. deviation of
τ is 0.297 s.
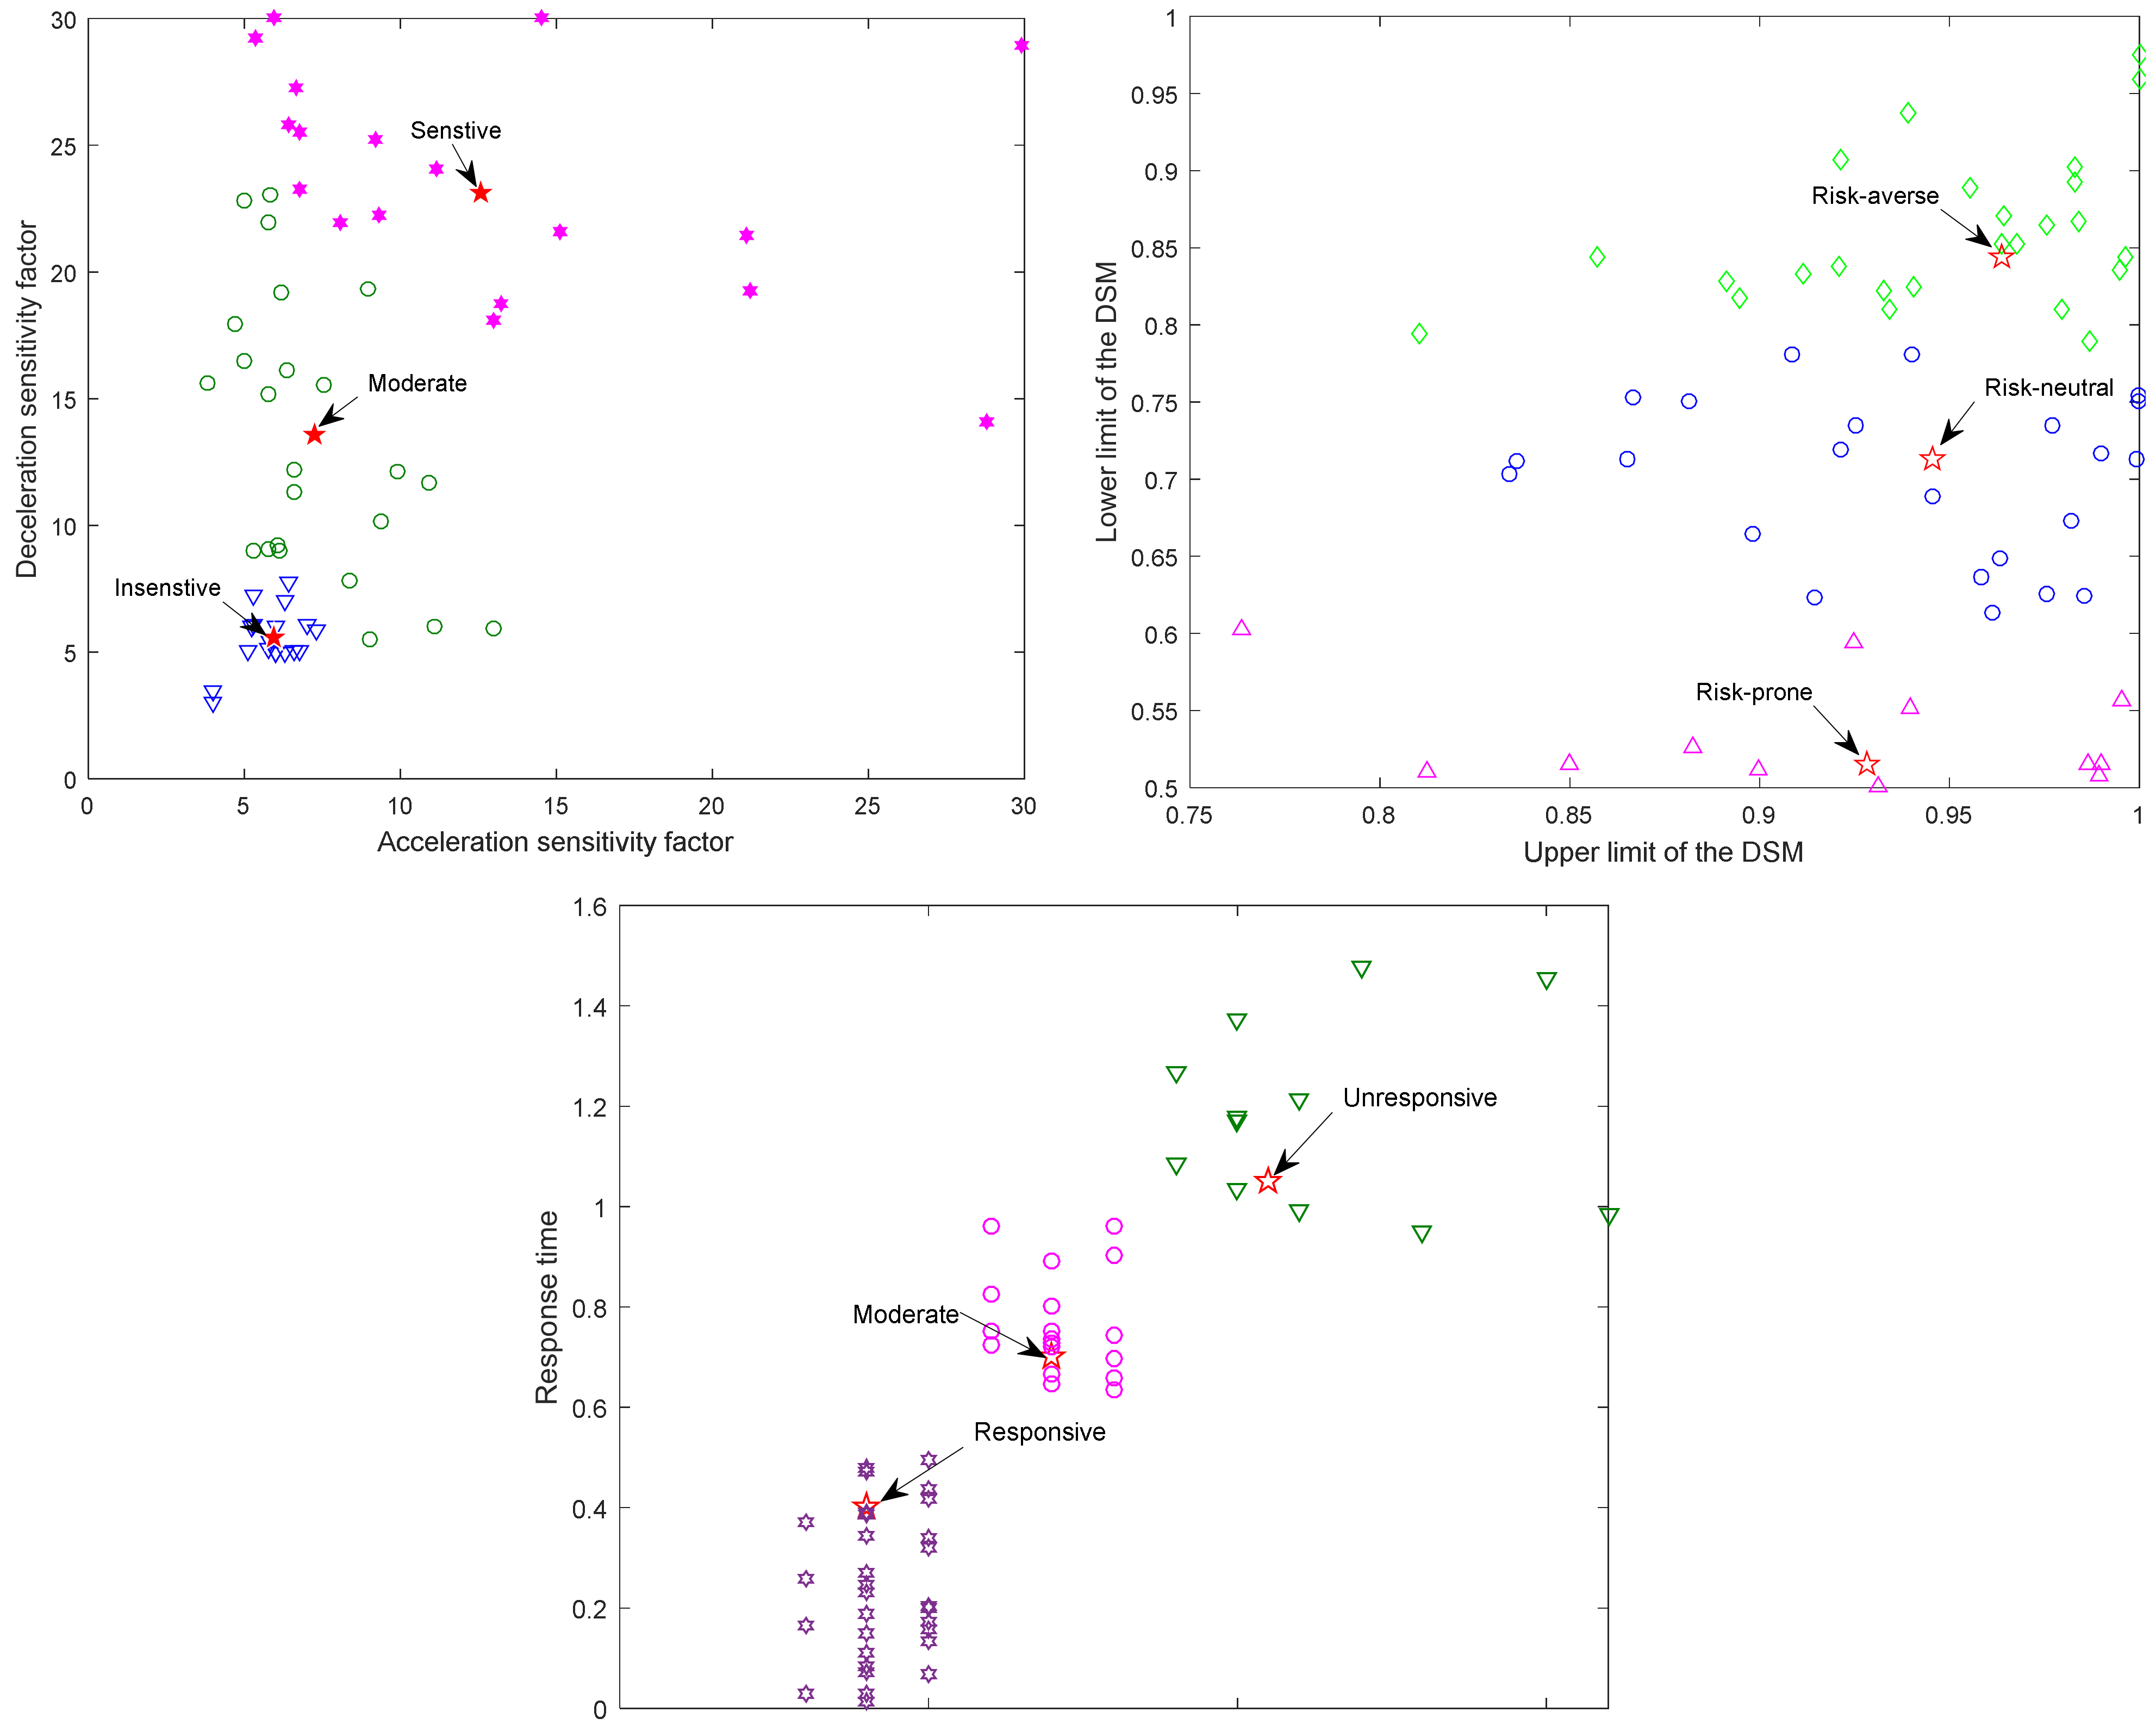
Figure 1 shows that different DBCs are obtained by using K-nearest neighbor clustering analysis of five parameters. Among them, acceleration and deceleration preference coefficients are divided into three kinds: sensitive, moderate sensitivity and insensitive; upper and lower limits of the DSM are divided into risk-averse, risk-neutral, and risk-prone. In addition, driver’s reaction time is divided into responsive, moderate response and unresponsive. Moreover, most DBCs are responsive, moderately sensitive, and risk-prone from
Table 2, which is in accordance with DBCs under actual car-following status.
Therefore, investigating the influence of DBCs on the RECs risk by using the DSM car-following model is a topic worthy of much discussion.
4. Results for the REC Mechanism Car-Following Process
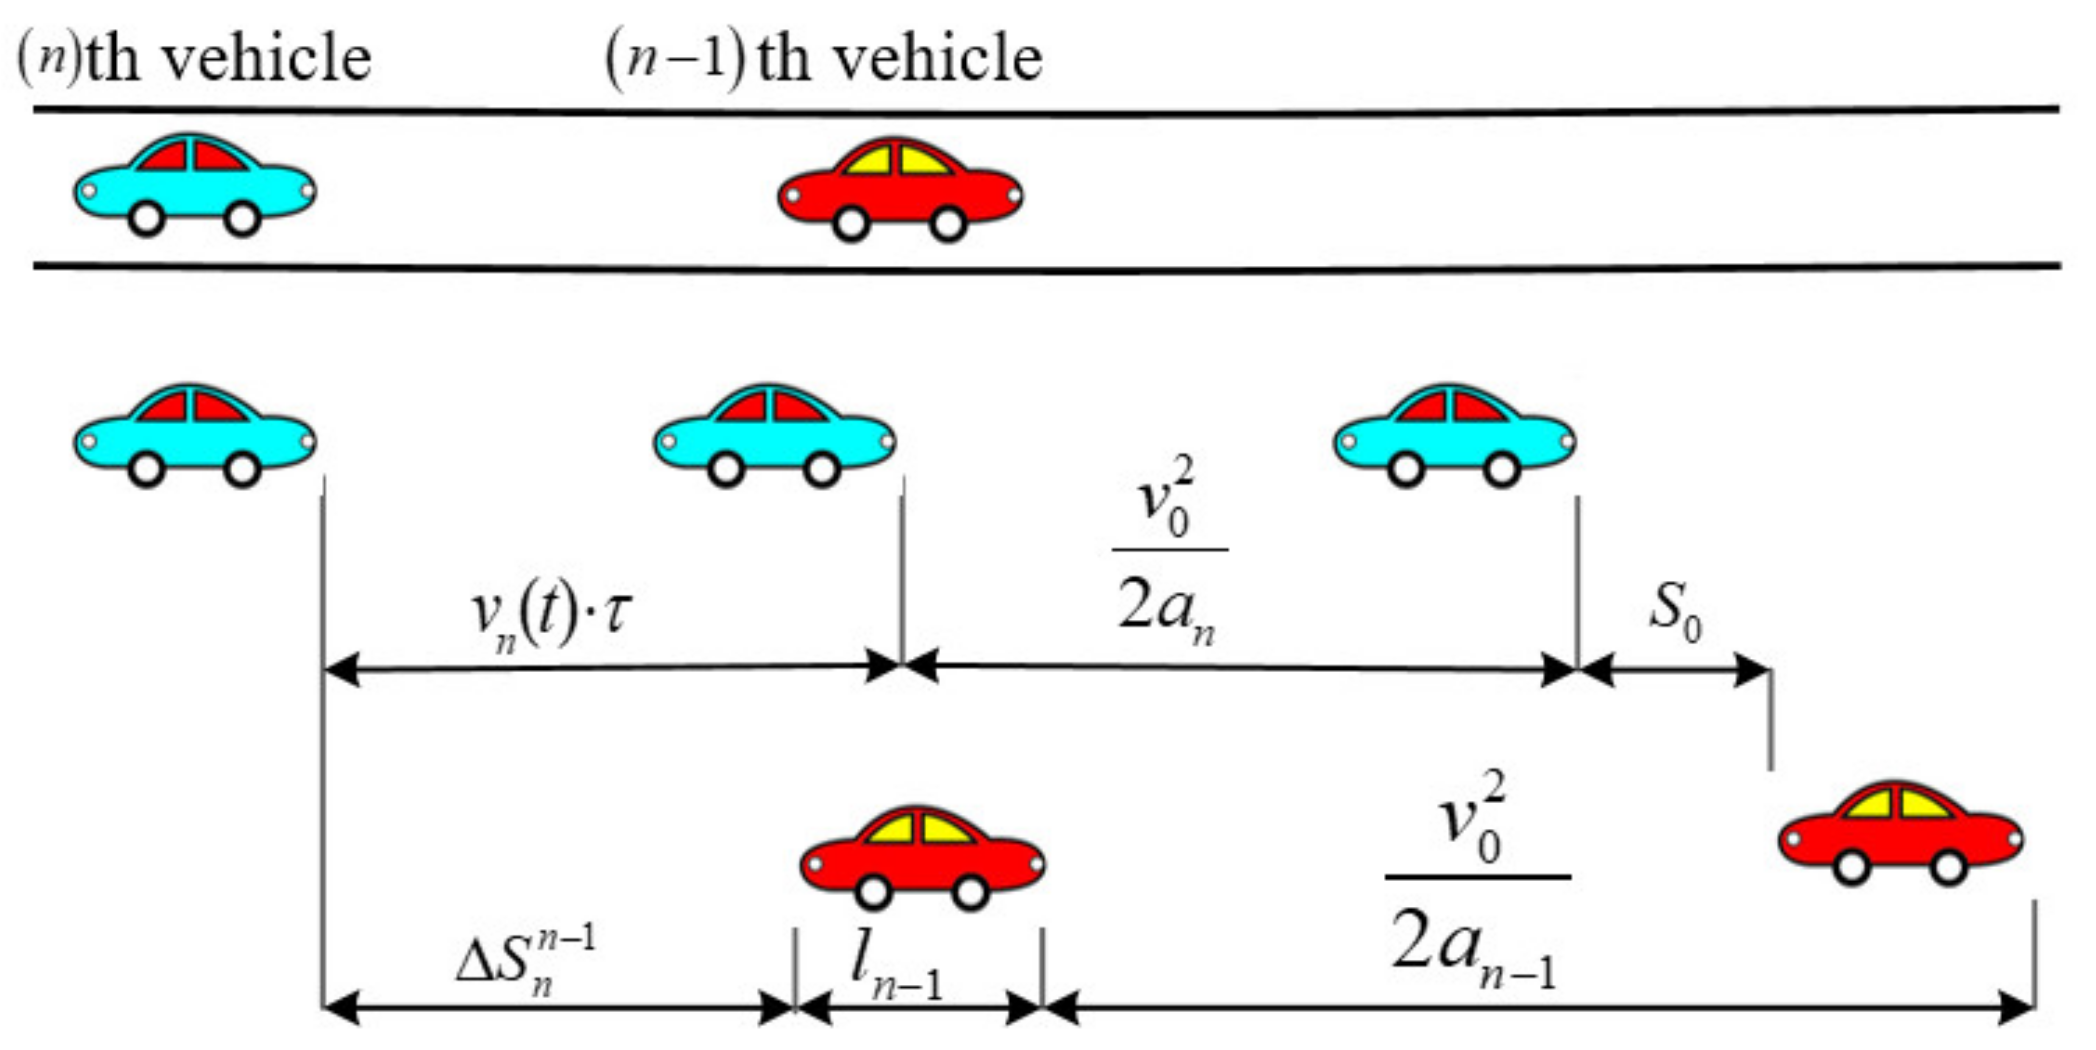
In the braking process, the
nth and
n−1th vehicles initially move at a
v0 and initiate braking at decelerations of
an−1 and
an, respectively, as shown in
Figure 2.
Then, a REC is avoided when the sum of car-following safety distance needed by the leading vehicle is more than the following vehicle’s stopping distance as follows:
where
is car-following safety distance;
τ is following the driver’s reaction time.
The deceleration of following vehicle should be satisfied to avoid rear-end collision as
Then, the stopping distance available to the following vehicle is given
We note that the driver adjusts acceleration/deceleration according to homeostatic risk perception during their actual driving. Therefore, time headway (TH) can be derived as follows:
Then, car-following safety distance
is derived based on Equation (6) as
where
,
denotes an accepted value to ensure car-following safety.
Equations (4) and (6) indicate that the following car needs a bigger deceleration to avoid collision when the driver’s reaction time τ is longer than his/her THt. It implies that driver’s sensitivity factor for acceleration/deceleration of the leading car affects deceleration of the following car. Furthermore, Equation (7) implies that SMnDL and SMnDH determine time headway in the car-following process. In the platoon, the deceleration of leading vehicle denotes a1 considering individual DBCs when a stopping wave is introduced.
Then, the available stopping distance of car 2 is obtained by
Similarly, the available stopping distance of the
Nth car in the platoon is obtained by:
where
S0 denotes the minimum safe stopping distance among two cars. The relative stopping distance between two cars varied from 1.07 m to 4.83 m, and its mean is 2.17 m [
31].
According to Equation (9), we obtain REC condition of the
Nth car as:
where
amin is a maximum deceleration. As suggested by the Highway Capacity Manual, the deceleration of a car varied from 2 and 8 m/s
2 [
36]. Thus,
amin is set to be −8 m/s
2 in this study.
5. Sensitivity Analysis of Five DBCs on REC Risk
According to the previous discussion, the REC condition is related to DBC parameters. Therefore, we conduct a vehicle platoon that 20 vehicles move on a straight road with initial space headway
SH = 40 to numerically illustrate the influence of five DBC parameters on REC risk, as shown in
Figure 3. In addition, the initial positions and speeds of 20 vehicles are showed as follows:
In the platoon, the leading car brakes at –1.5 m/s2 after 200 s until it is stopped. In addition, other following cars follow the leading car to decelerate until they are stopped. Other parameters of model are set as as τ2 = 0.15 s, dn(t) = dn−1(t) = 7.35 m/s2, Ln = 4.3 m, n = 1, 2, 3, …, N. Collision happening is to determine whether two successive vehicles collide or not at any moment in the car-following process according to REC conditions of Equation (10).
The numerical experiment is presented using the Monte Carlo simulation method to estimate the probability of REC in the traffic condition described above. Based on the statistical results of 10,000 samples, we investigate the probability of REC under DBC parameters effect.
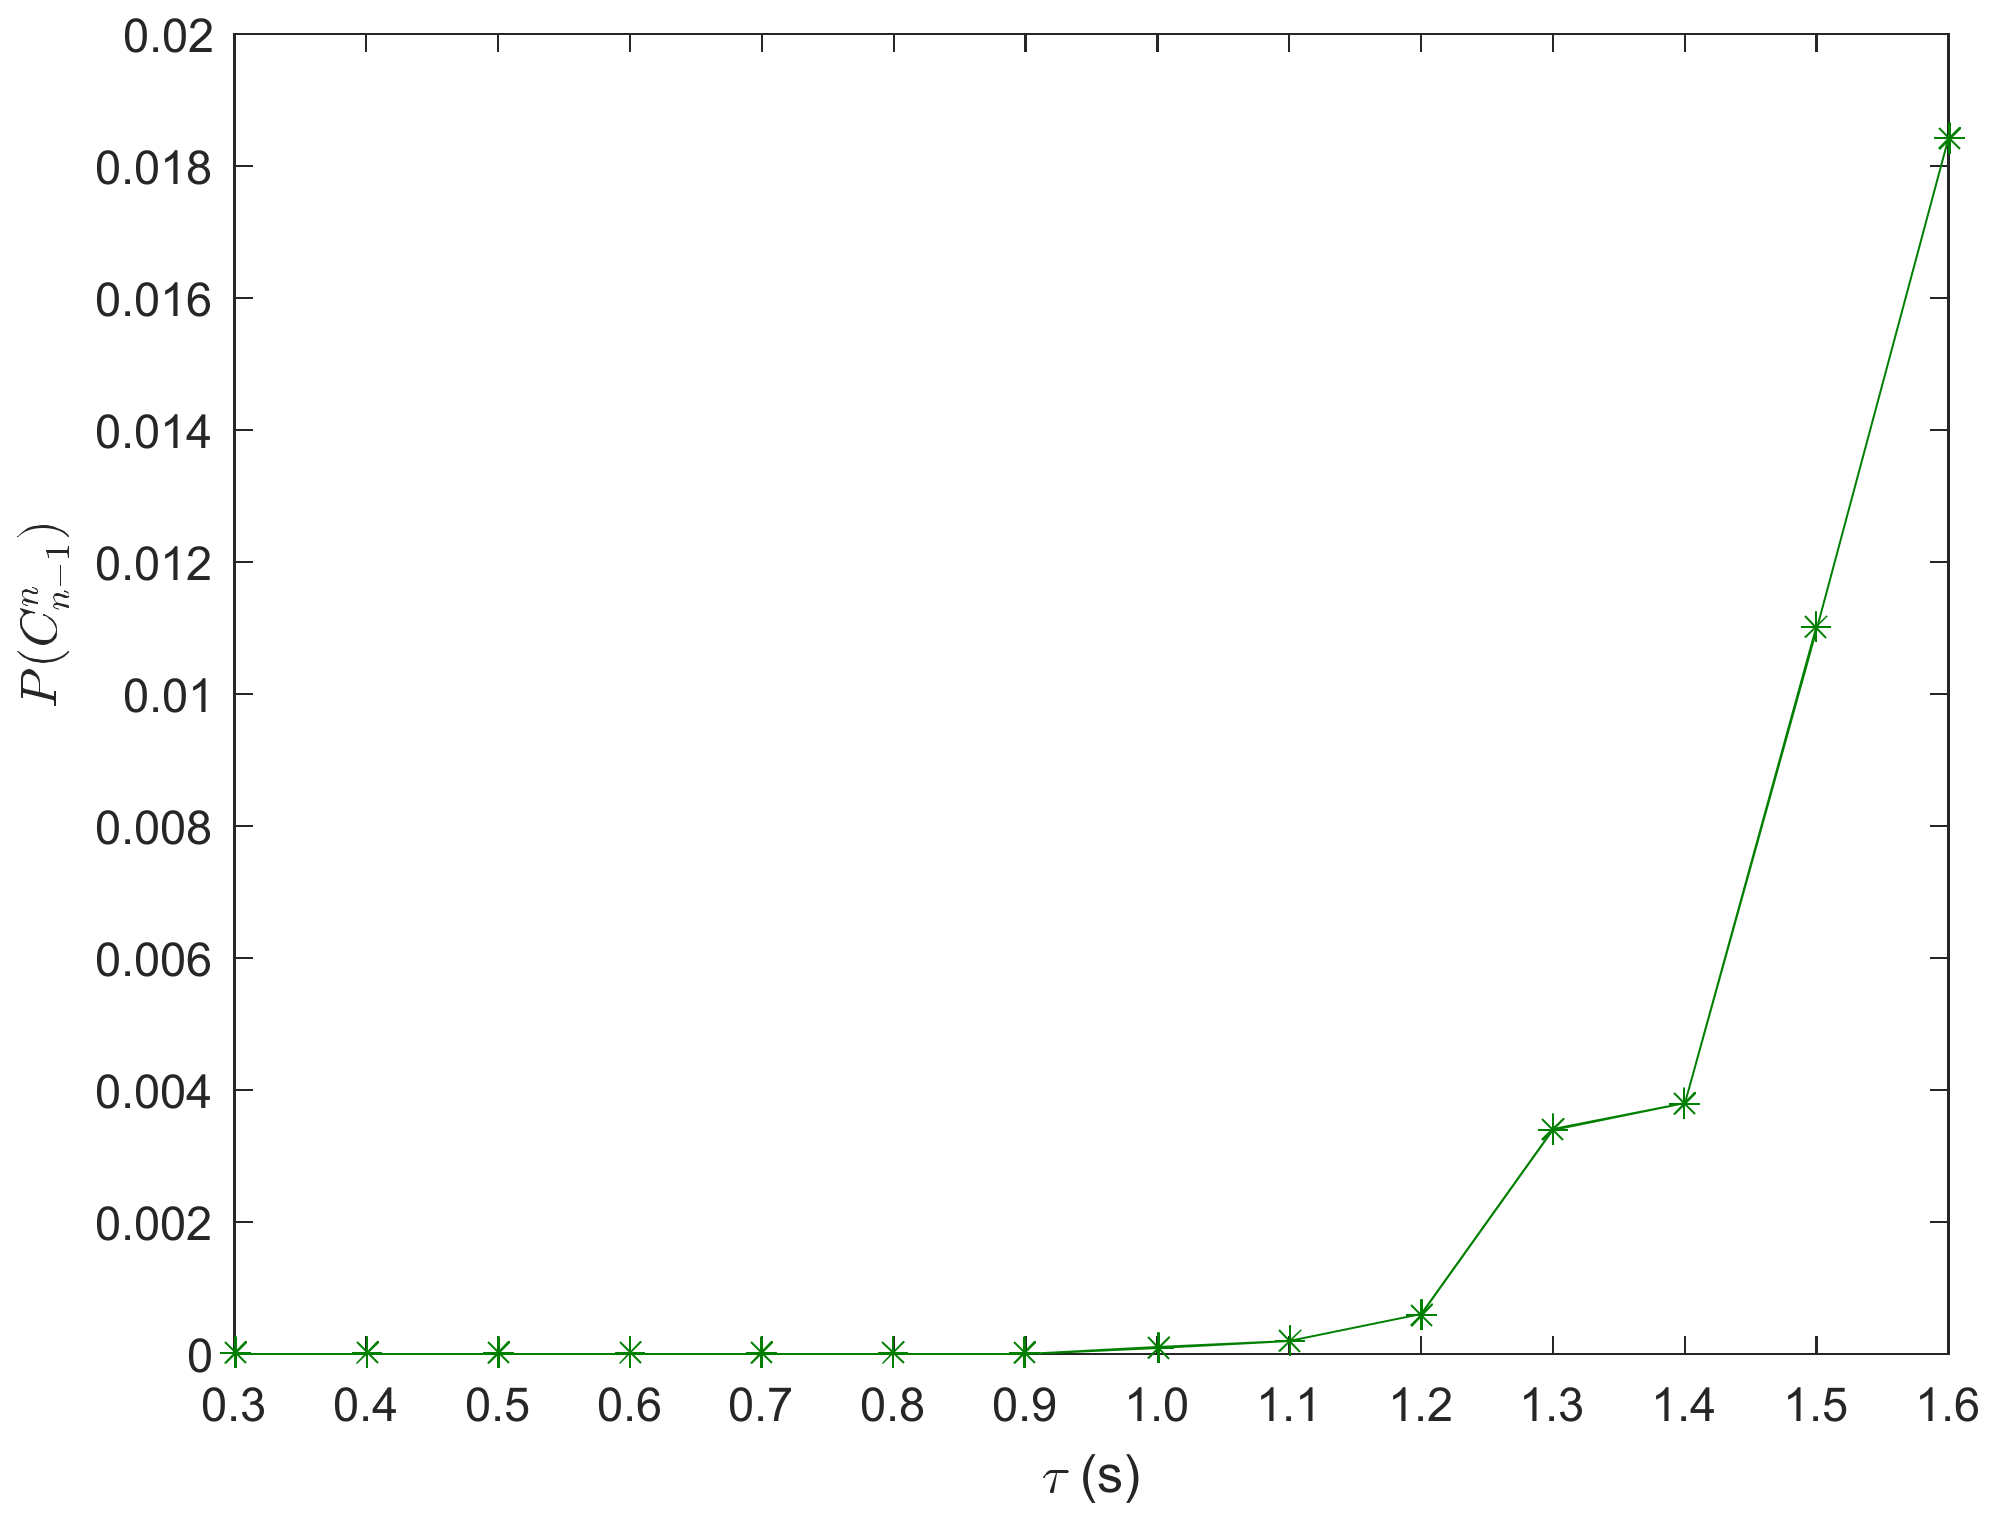
5.1. Impact of Response Time
According to the calibration results of
Table 1, the range of response time is set as
s. Other driving behavior parameters with mean and std. deviation are set as: the acceleration and deceleration preference coefficients
m/s
2 and
m/s
2, and the limits of the DSM
and
. Ten drivers of the platoon are randomly arranged on a single lane.
The varying of REC probability with response time is shown in
Figure 4. From
Figure 4, the REC risk is increasing with
τ. It implies that the stopping waves gradually increase as response time goes on to cause the increasing of the REC probability of vehicles. Car-following safety can improve with the decrease in the driver’s response time. Thus, drivers need to keep faster reaction ability to avoid the occurrence of REC.
5.2. Impact of the Limits of the DSM
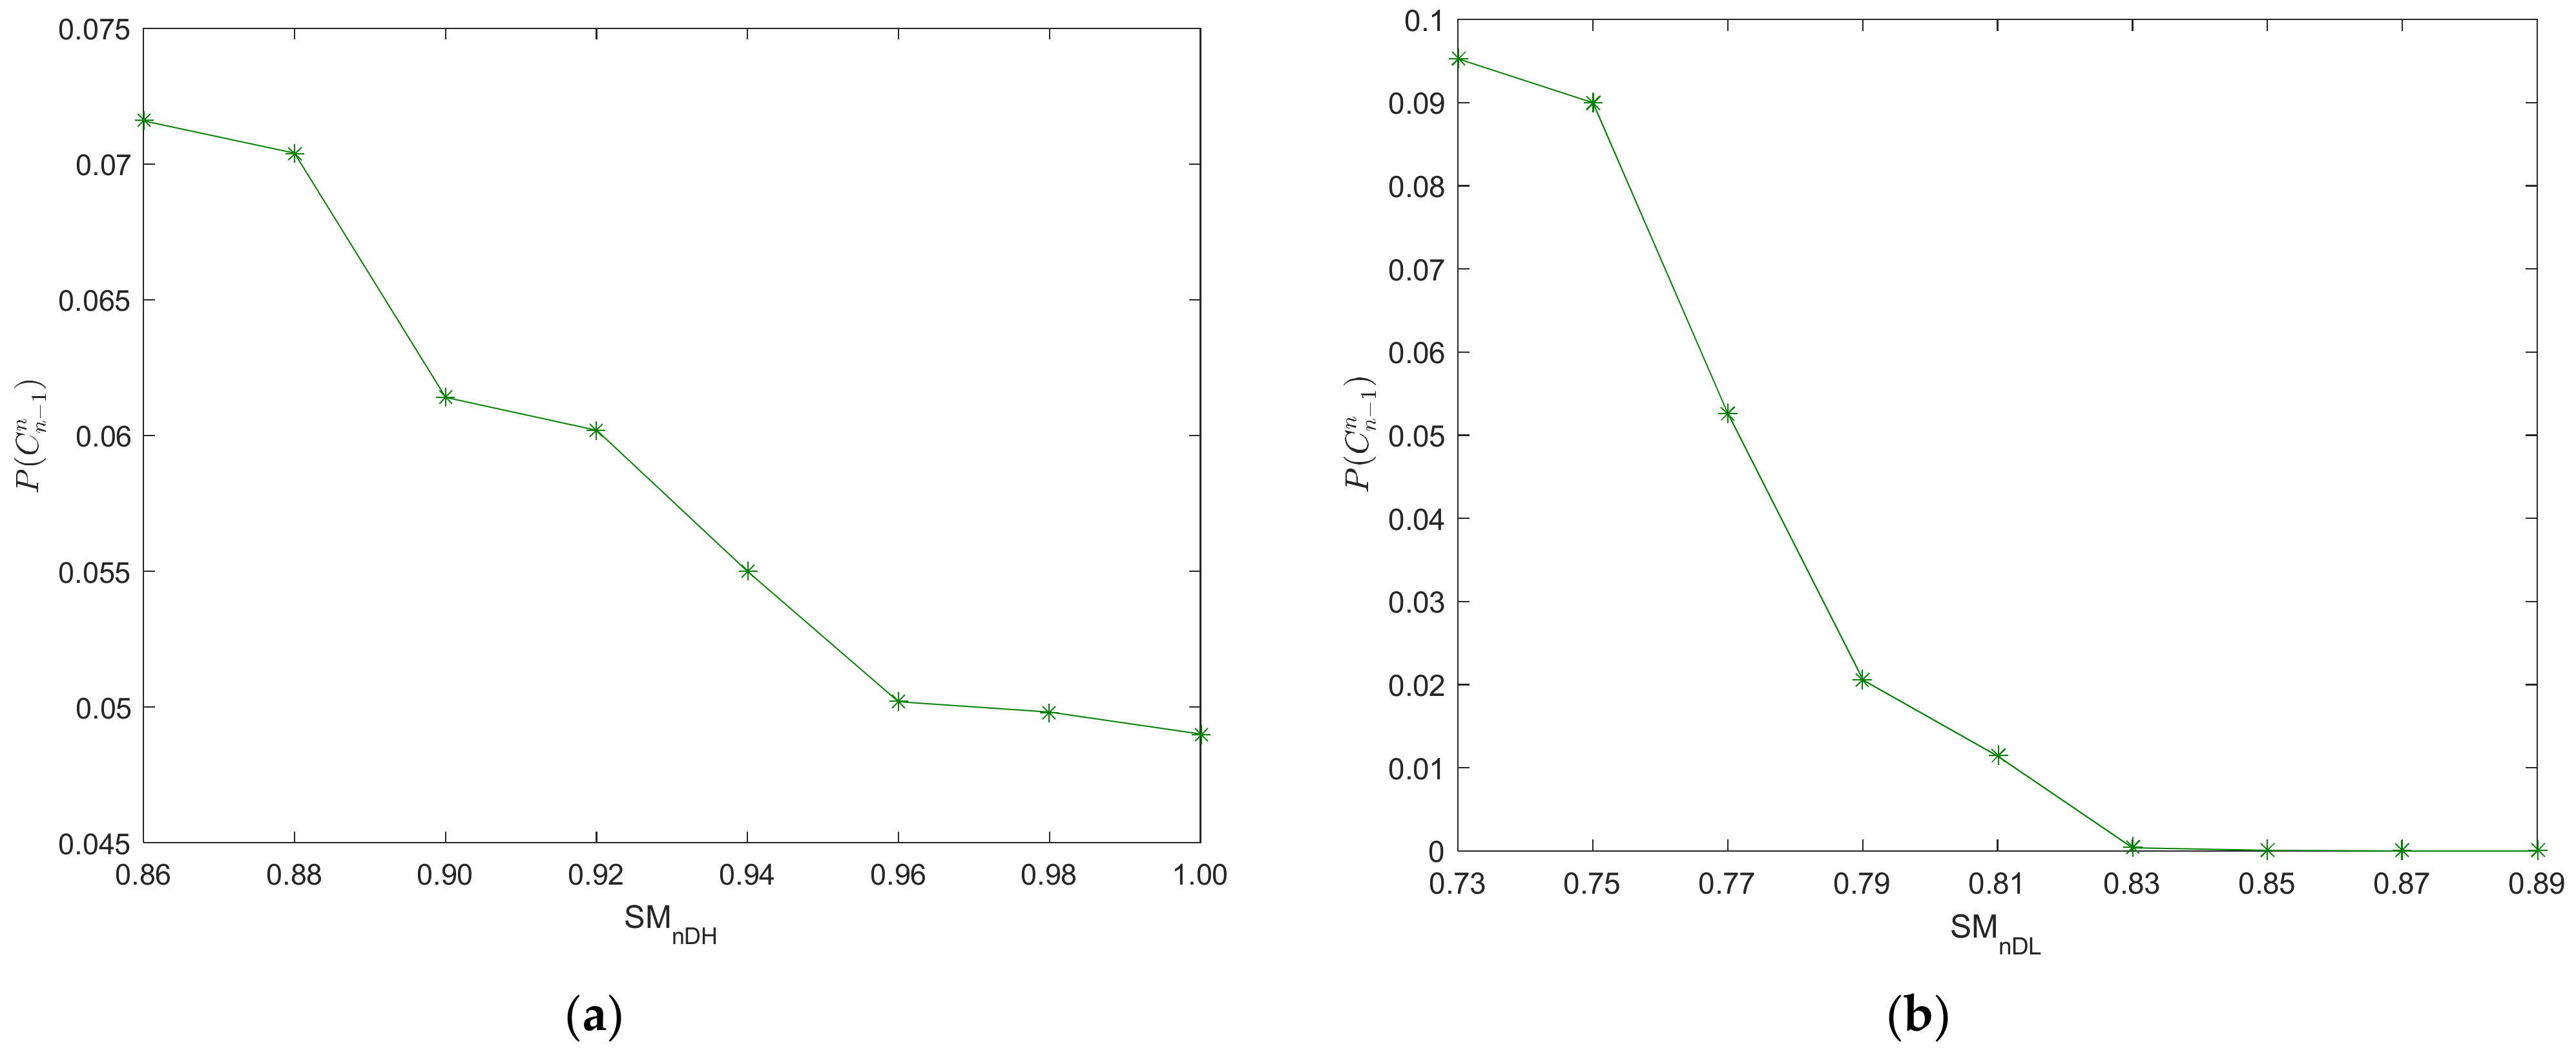
As shown in previous analysis, acceleration and deceleration preference coefficients are set as m/s2 and m/s2, respectively. Driver’s reaction time is set as s. In order to investigate the influence of SMnDH on the REC probability, the range of SMnDH is set as to ensure , in which . Moreover, the range of SMnDL is set as to ensure , in which .
The varying of REC probability with the limits of the DSM is shown in
Figure 5. From
Figure 5a, the REC probability of vehicles decreases with the increasing of
SMnDH. However, the REC probability of vehicles has no obvious reduction when
SMnDH is increased to a certain value (
SMnDH ≥ 0.96) in our case study. Likewise, the REC probability of vehicles decreases with the increasing of
SMnDL as shown in
Figure 5b. However, the REC risk has more sensitivity to
SMnDL. The REC accidents will not happen when
SMnDL ≥ 0.85 in our case study. Results imply that the stopping waves gradually weaken with the increasing of the
SMnDL or
SMnDH. Thus, a large upper (or lower) limit of the DSM can reduce the REC risk. Adjusting the limits of the DSM of the driver can improve traffic safety in the car-following process.
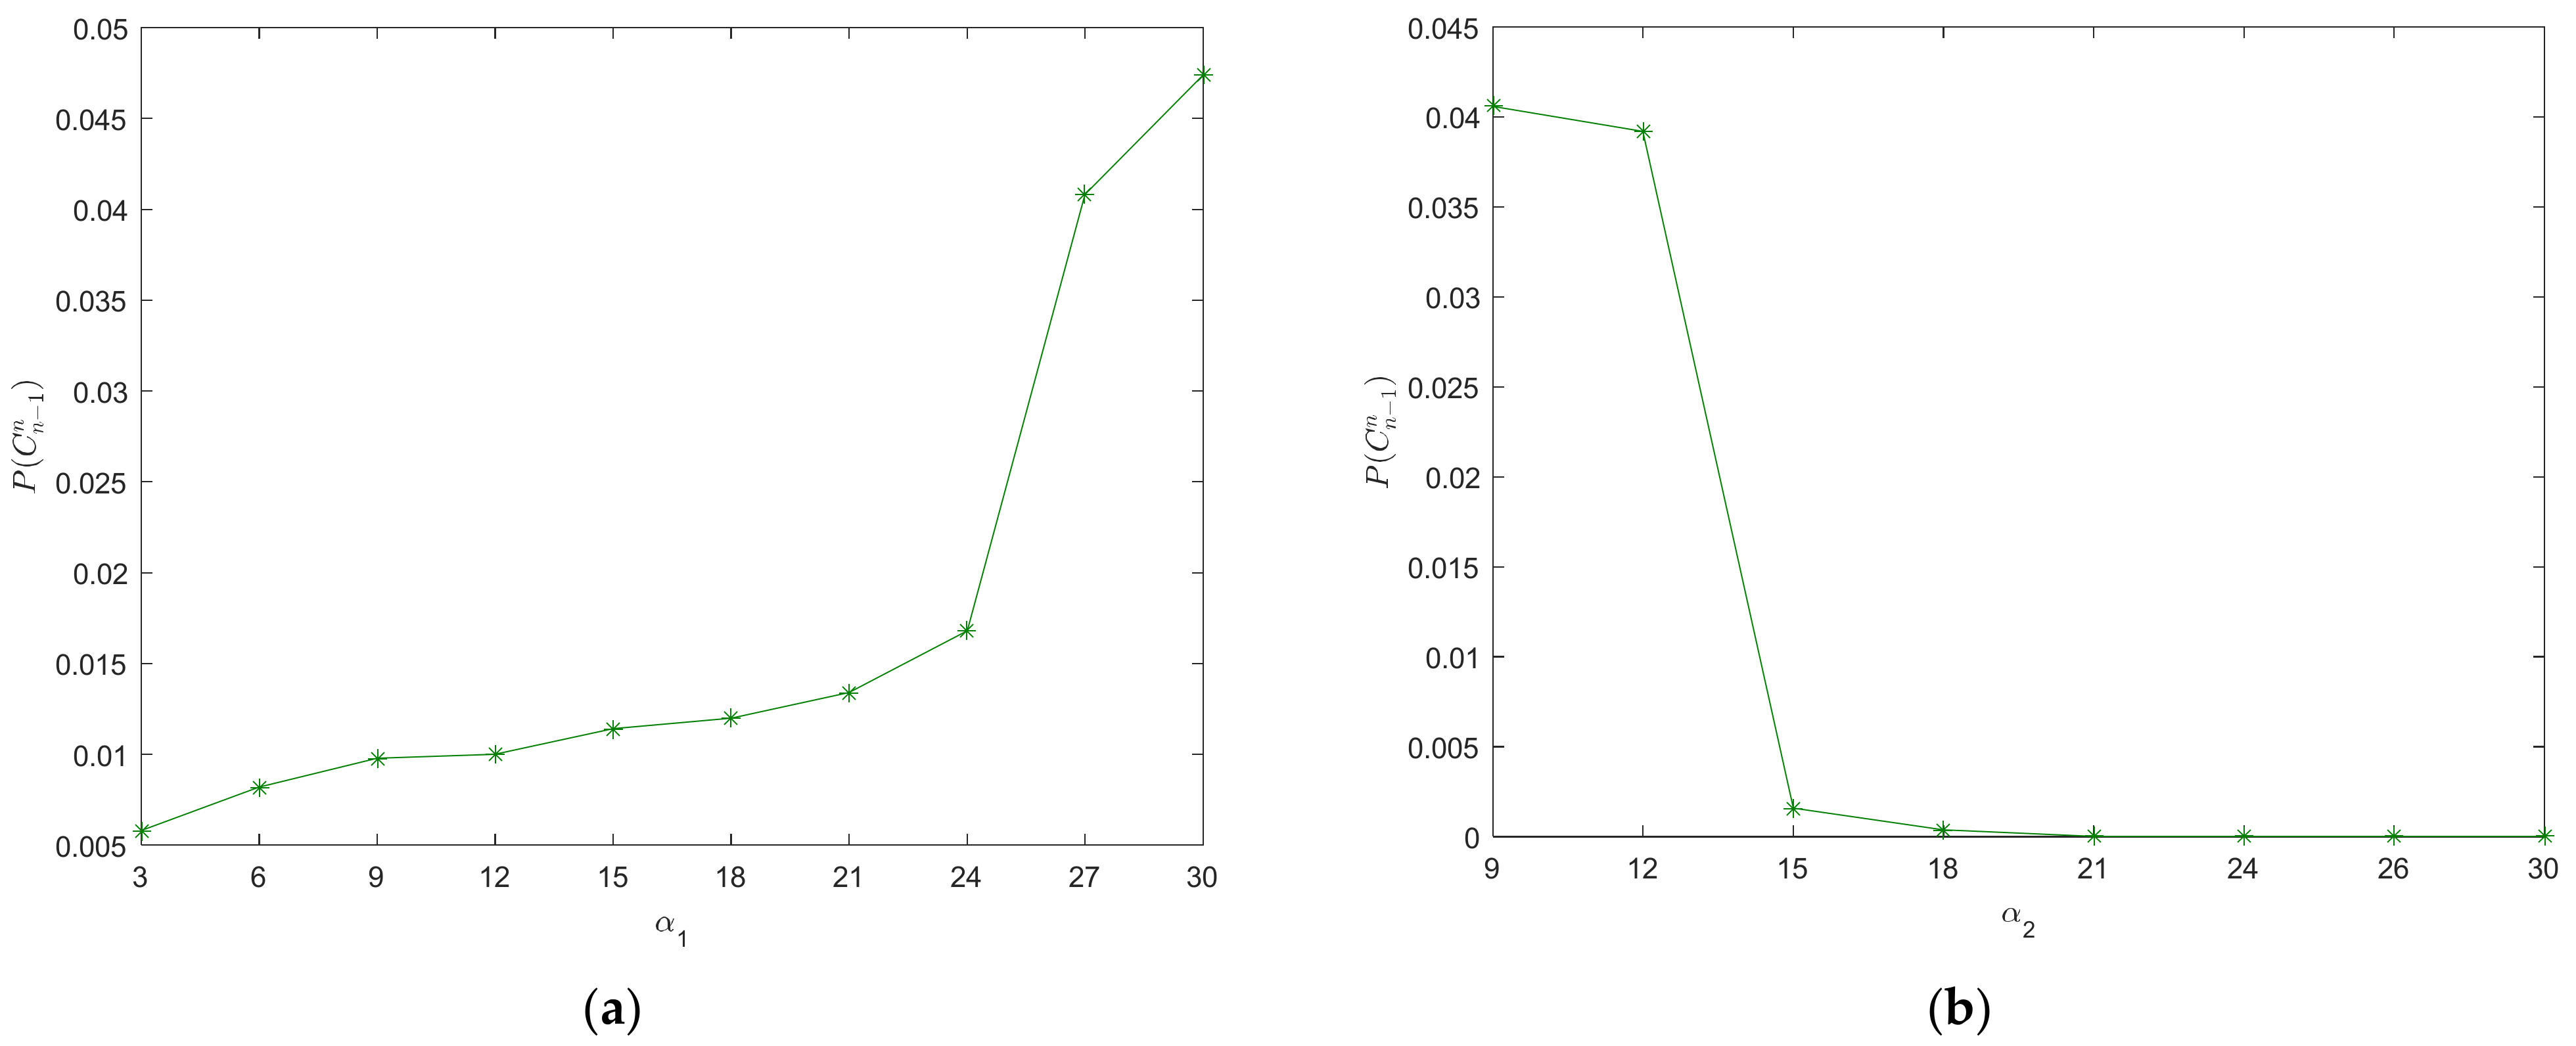
5.3. Impact of Acceleration and Deceleration Preference Coefficients
The limits of the DSM are set as and , respectively. In addition, the response time is s. To analyze the impact of the acceleration and deceleration preference coefficients on the REC probability, the range of acceleration preference coefficient is set as m/s2, in which the deceleration preference coefficient m/s2. However, the range of deceleration preference coefficient is set as m/s2, in which the acceleration preference coefficient m/s2.
The varying of REC probability with the acceleration and deceleration preference coefficients is shown in
Figure 6. The REC probability of vehicles increases with the increasing of the acceleration preference coefficient as shown in
Figure 6a. However, the REC probability of vehicles decreases with the increasing of the deceleration preference coefficient from
Figure 6b. In addition, the REC probability of vehicles has no obvious reduction when the deceleration preference coefficient is increased to a certain value (
α2 > 18 m/s
2) in our case study. Results show that a large deceleration preference (or a small acceleration preference) can reduce the REC risk, and that the stopping waves gradually weaken with increasing of the deceleration preference and decreasing of the acceleration preference. Therefore, the car-following safety can improve if the driver can maintain the smaller acceleration preference and the larger deceleration preference for drivers.
As described previously, findings further verify that five DBCs parameters play an important role in the traffic waves, thereby causing REC risk in the car-following process. The choice of interval DSMs, the acceleration and deceleration preference coefficients, and the driver’s response time influence the REC probability. It implies that a reasonable choice of fiver DBCs parameters can be provided to reduce the REC risk.
6. Numerical Experiment and Discussion
In our numerical simulation, the initial conditions of speeds and positions for all vehicles in the platoon are as follows:
where spacing headway
L is 35 m; the number of vehicles in the platoon
N is 50;
Xn(0) denotes the
nth vehicle’s initial position;
Vn(0) is the
nth vehicle’s initial speed;
is the
nth vehicle’s initial acceleration; and
denotes a small acceleration disturbances of the leading car after
, and its distribution function obeys
.
According to
Table 2, DBCs have 3
3 kinds of combinations based on driving behavior parameters. The vector
is used to represent DBCs. In this study, in order to analyze the impact of heterogeneity DBCs on REC risk, we choose four kinds of combinations of DBCs parameters without the loss of generality as follows:
We will exhibit four cases of the different combinations for four kinds of DBCs. Four kinds of DBCs in the platoon are arbitrary. Four cases are conducted as below:
Case 1: ℂ1 of 50% and ℂ2 of 50%;
Case 2: ℂ3 of 50% and ℂ4 of 50%;
Case 3: ℂ1 of 90%, ℂ2 of 4%, ℂ3 of 2% and ℂ4 of 4%;
Case 4: ℂ1 of 70%, ℂ2 of 26%, ℂ3 of 2% and ℂ4 of 2%;
Case 5: ℂ1 of 30%, ℂ2 of 50%, ℂ3 of 10% and ℂ4 of 10%;
Case 6: ℂ1 of 10%, ℂ2 of 20%, ℂ3 of 40% and ℂ4 of 30%;
Case 7: ℂ1 of 10%, ℂ2 of 10%, ℂ3 of 46% and ℂ4 of 34%;
Case 8: ℂ1 of 6%, ℂ2 of 6%, ℂ3 of 50% and ℂ4 of 38%;
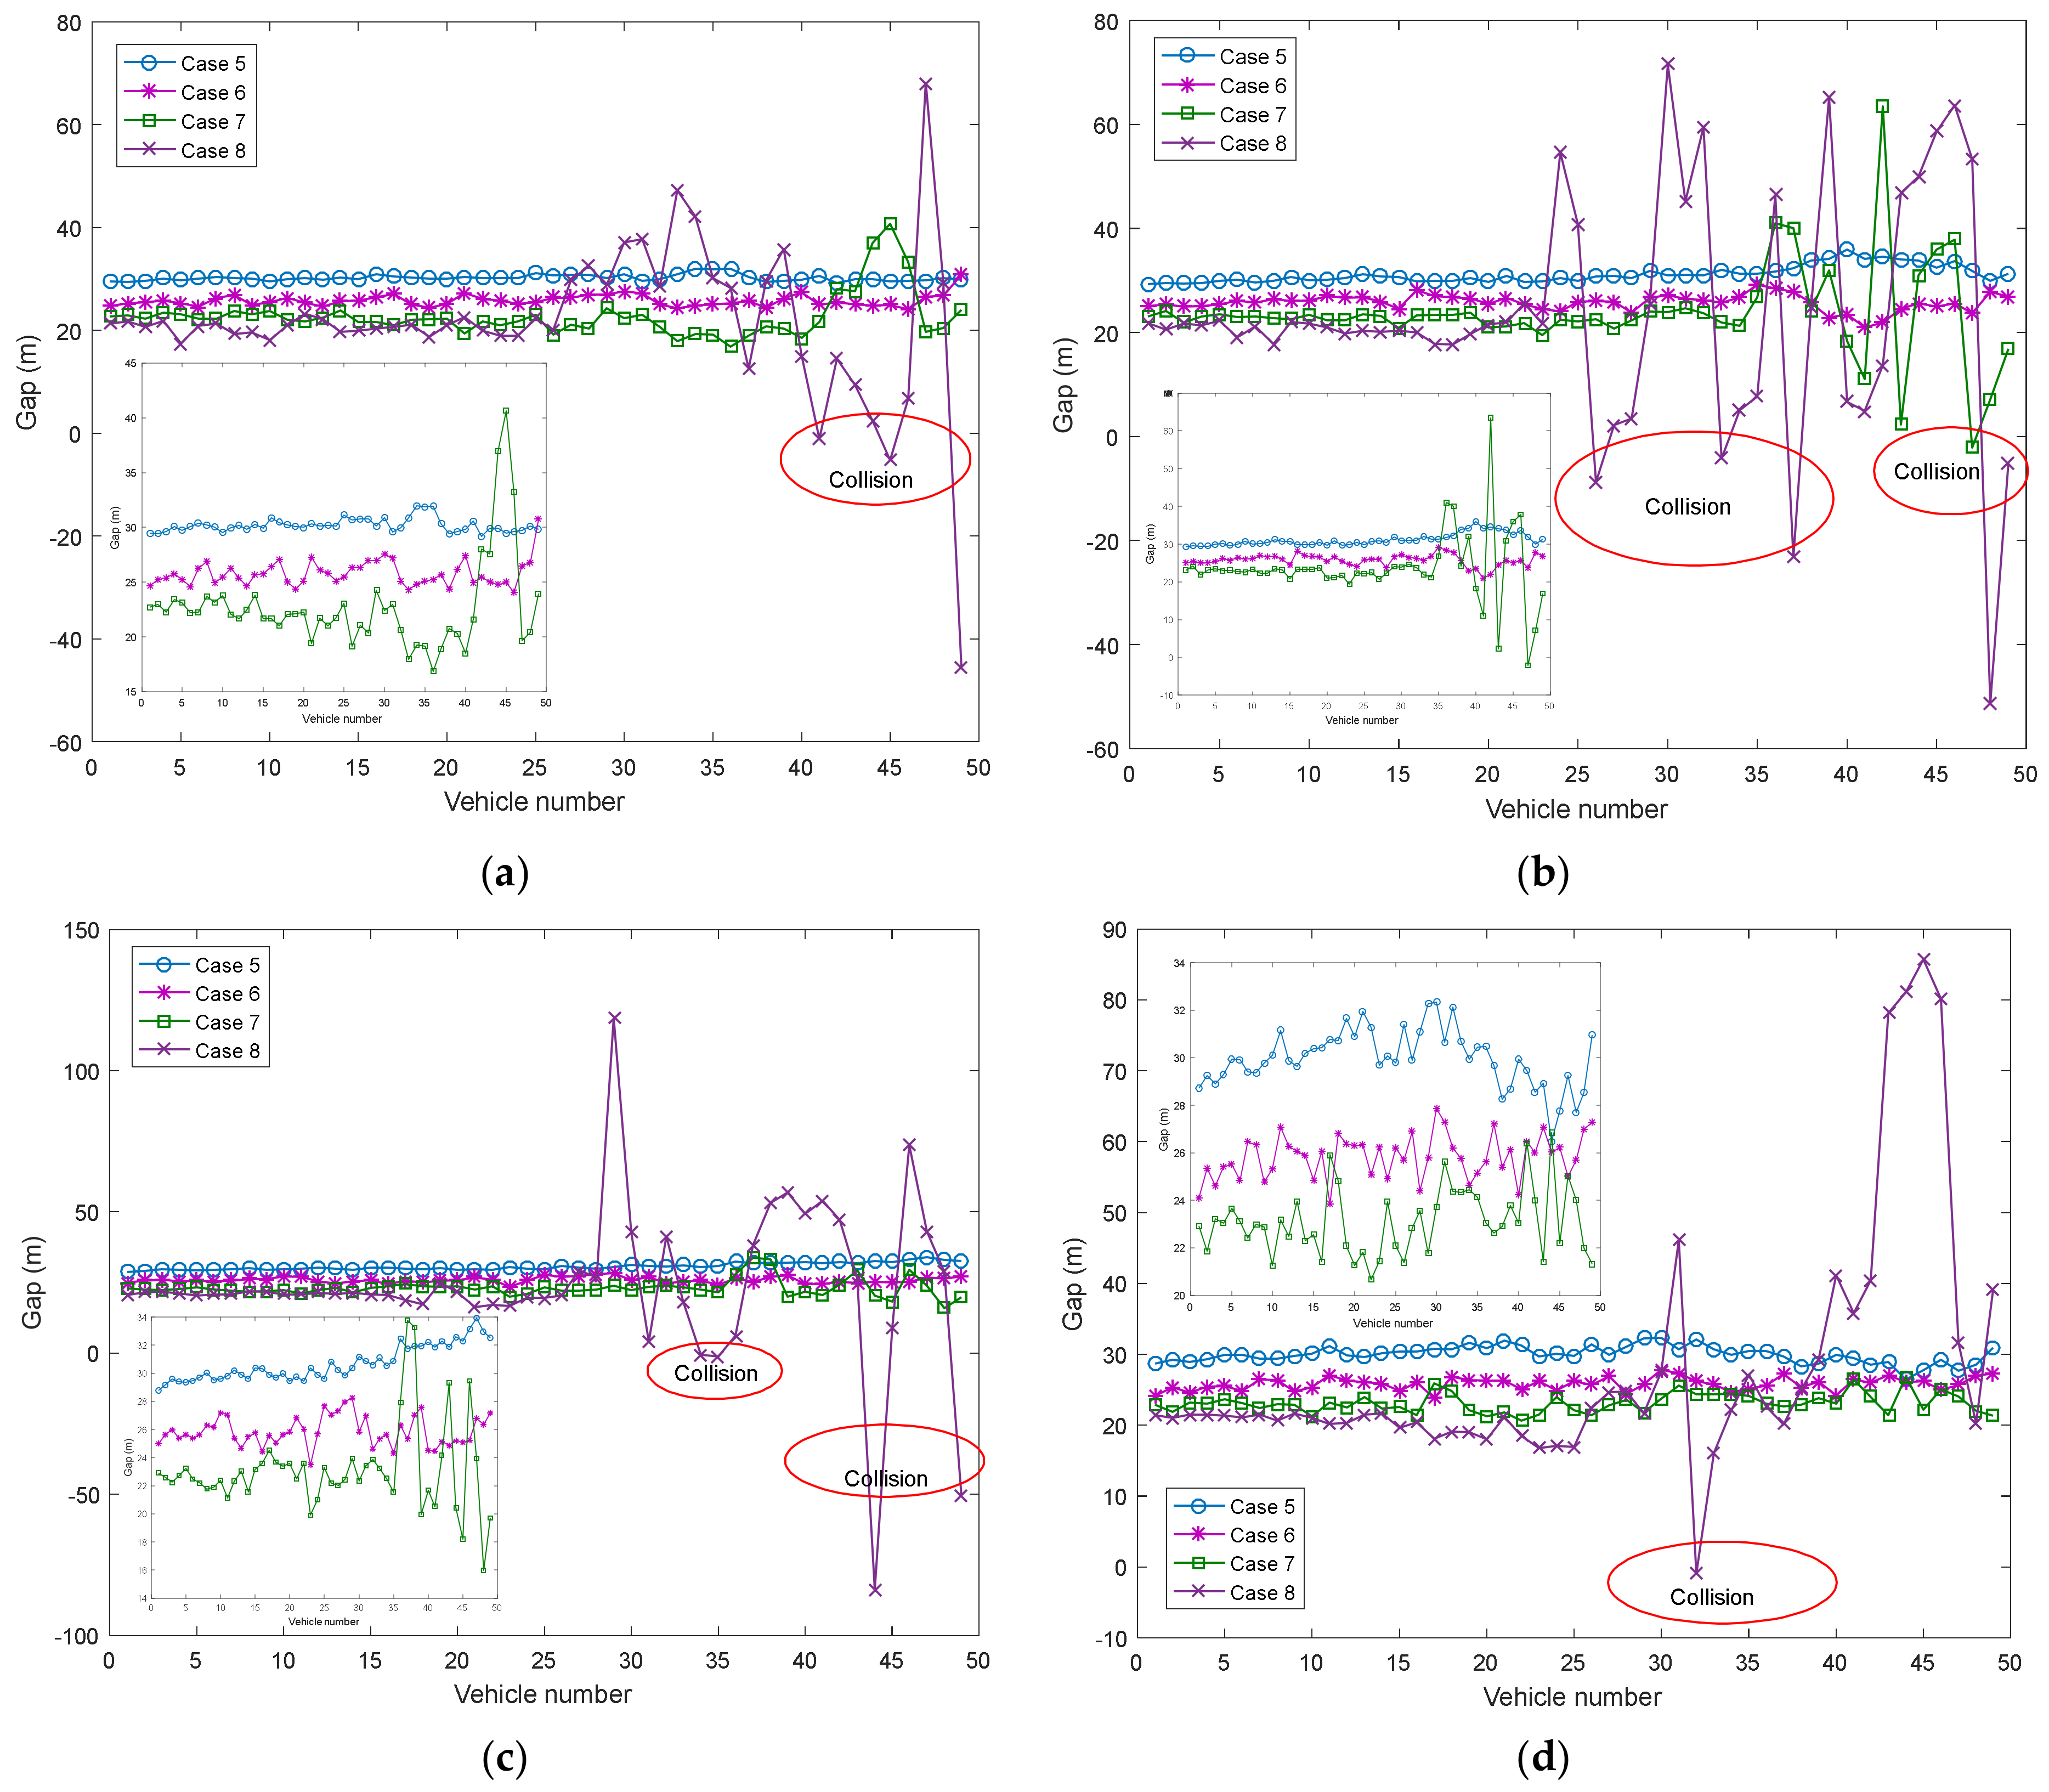
Figure 7 depicts gap distributions simulated by a DSM model with four cases of different DBCs obtained at
t = 300,
t = 500 s,
t = 800 s, and
t = 1000 s. The amplitude fluctuation of gap becomes large with the increase in Ω
3 and Ω
4. Here, Ω
3 and Ω
4 can be claimed as unstable drivers, and Ω
1 and Ω
2 can be claimed as stable drivers. Therefore, it implies that the shock wave occurs, and the RECs happen when Ω
3 and Ω
4 increase in the platoon as shown in the cases 3–4 of
Figure 7a–d. Otherwise, decreasing the proportions of Ω
3 and Ω
4, the shock waves gradually weakened, and REC will not occur as shown in cases 1–2 of
Figure 7a–d.
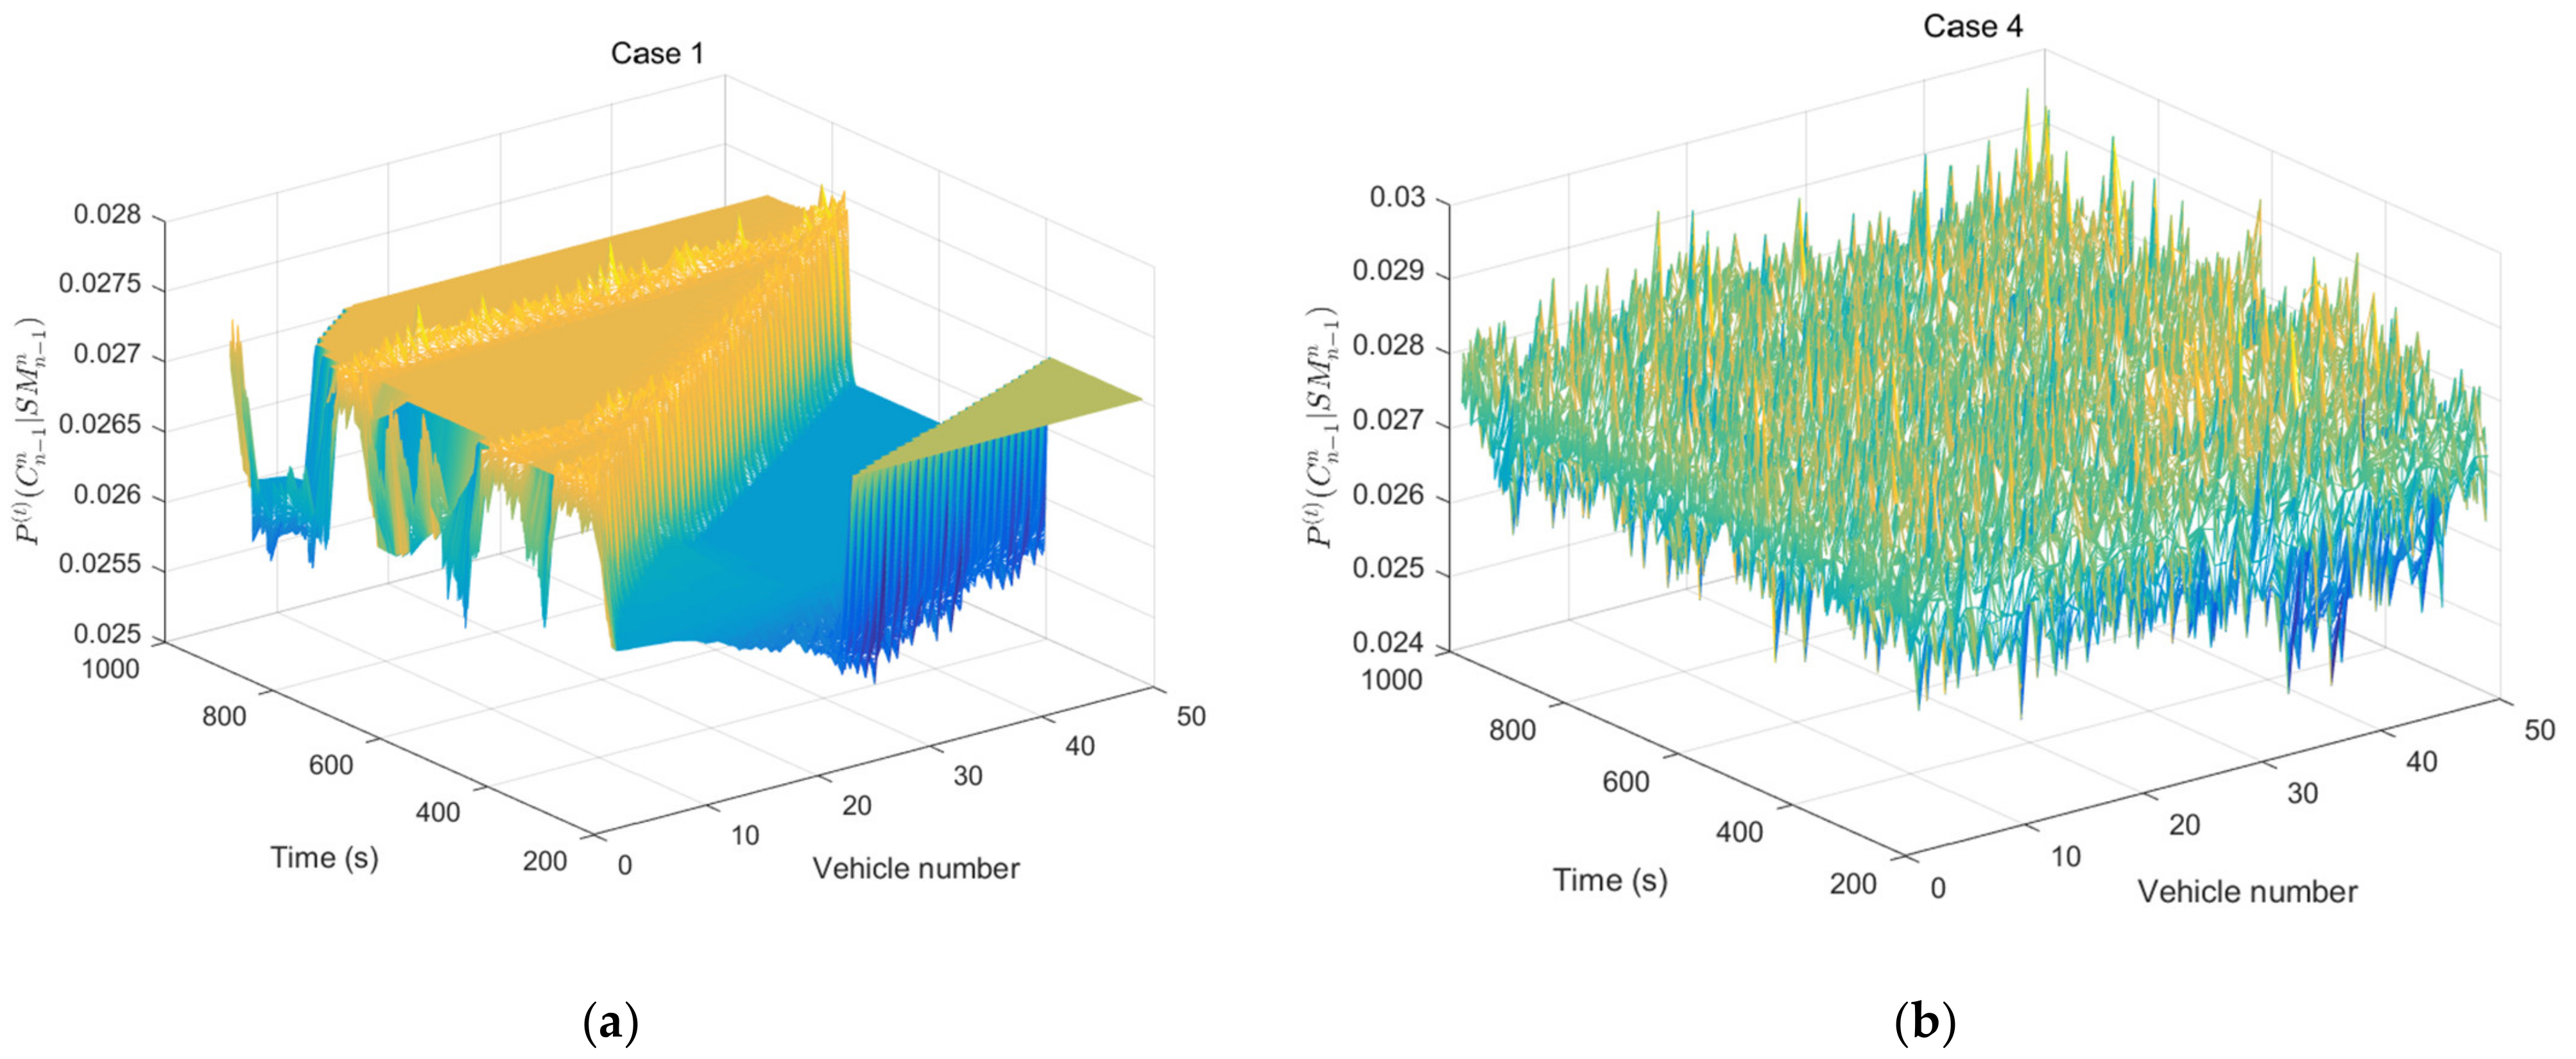
Furthermore, the safety margin (SM) is introduced as a risk indicator to analyze car-following safety, its mathematical expression is as follows:
Moreover, a probabilistic measure is introduced to estimate REC risk in the car-following process as:
where
is the probability that the
n vehicle collides with the
n−1 vehicle;
c denotes constant argument, and its value depends on road characteristics. Here,
c is set as 0.25 in our numerical simulation.
Figure 8 shows REC probability patterns of all other cars except for the leading car based on the SM under different DBCs. RECs are a small probability event as shown in
Figure 8a,b. However, rear-end collision probability of car-following will increase gradually compared with
Figure 8a,b and
Figure 8c,d. Moreover, unstable DBCs can enhance the traffic wave and increase REC risk as shown in
Figure 8e–h. Otherwise, stable DBCs can attenuate the shock wave and reduce REC risk. Results show that different DBCs would lead to shock waves, thereby increasing REC probability in the car-following process.
To summarize, results show that a potential strategy of the adjustment of the proportions of the DBCs can attenuate the shock wave and avoid RECs, and that the decreasing of the proportions of stable DBCs causes the RECs.
7. Conclusions
DBCs play an important role in car-following safety. Different DBCs may lead to unstable traffic flow, and forming a shock wave would cause RECs under certain traffic conditions. Therefore, exploring DBCs in car-following safety is a valuable research issue. The DBCs are portrayed by using microscopic car-following models. In our study, we used the DSM car-following model to analyze the influence of DBCs on the car-following safety. The DSM model uses SMnDL and SMnDH to describe driving risk preference; α1 and α2 to describe the acceleration and deceleration sensitivity; and τ to describe driver’s responsiveness. Therefore, the risk preference, sensitivity, and responsiveness affect car-following safety.
To quantify the DBCs, five parameters are calibrated by using sixty cases from NGSIM datasets. We obtain REC conditions by using the DSM model, and analyze the probability of REC under those parameters’ effect by using the Monte Carlo method. Findings show that the decreasing of response time can improve traffic safety, and that a large SMnDL or SMnDH can reduce the REC risk, and that the traffic safety can improve if the driver can maintain the smaller acceleration sensitivity and the larger deceleration sensitivity. Because these parameters can portray DBCs, each parameter divided into three types of DBCs to further discuss the impact of different DBCs on the REC risk. Through the numerical experiments, if the vehicle platoon has stable and unstable DBCs, then the proportion of drivers with different DBCs plays an important role in the car-following safety. Once the traffic flow is in an unstable state, the shock waves gradually enhanced, and REC will occur. Moreover, REC probability patterns also imply that different DBCs with an inappropriate proportion would lead to shock waves, thereby increasing REC risk. A potential strategy of the adjustment of the proportions of the unstable DBCs can improve car-following safety.
In summary, the DBCs affect the car-following safety. The findings are useful in setting a reasonable proportion of the unstable and stable DBCs to stabilize traffic flow, and developing traffic control strategy for REC prevention by using the adjustment of DBCs.
Author Contributions
Conceptualization, J.Z. (Junjie Zhang) and C.Y.; methodology, J.Z. (Junjie Zhang) and J.Z. (Jun Zhang); software, H.J.; validation, J.Z. (Junjie Zhang), C.Y. and J.Z. (Jun Zhang); formal analysis, J.Z. (Junjie Zhang); investigation, J.Z. (Jun Zhang) and H.J.; resources, J.Z. (Jun Zhang); data curation, J.Z. (Junjie Zhang); writing—original draft preparation, J.Z. (Junjie Zhang); writing—review and editing, J.Z. (Junjie Zhang), J.Z. (Jun Zhang) and H.J.; visualization, J.Z. (Junjie Zhang); supervision, H.J.; project administration, C.Y.; funding acquisition, J.Z. (Junjie Zhang) and C.Y. All authors have read and agreed to the published version of the manuscript.
Funding
This research was funded by the National Key R&D Program of China (2018YFB1601100 and 2018YFC0807500), the Program of Hefei Science City of Beihang (BHKX-21-06), and the China Postdoctoral Science Foundation (2019M660407), and the National Natural Science Foundation of China (52102447).
Institutional Review Board Statement
Not applicable.
Informed Consent Statement
Not applicable.
Data Availability Statement
Driving behavior data used to support the findings of this research are available from the first author upon request.
Conflicts of Interest
The authors declare no conflict of interest.
References
- Ghaffari, A.; Khodayari, A.; Hosseinkhani, N.; Salehinia, S. The effect of a lane change on a car-following manoeuvre: Anticipation and relaxation behaviour. Proc. Inst. Mech. Eng. Part D J. Automob. Eng. 2015, 229, 809–818. [Google Scholar] [CrossRef]
- Tanaka, M.; Ranjitkar, P.; Nakatsuji, T. Asymptotic stability and vehicle safety in dynamic car-following platoon. Transp. Res. Rec. 2008, 2088, 198–207. [Google Scholar] [CrossRef]
- Tampere, C.; Hoogendoorn, S.; Van Arem, B. A behavioural approach to instability, stop and go waves, wide jams and capacity drop. Transp. Traffic Theory 2005, 16, 205–228. [Google Scholar]
- Huang, D.; Yan, Y.; Su, C.; Xu, G. Prediction-based geographic routing over VANETs. Rev. Tec. Fac. Ing. Univ. Zulia 2016, 39, 157–164. [Google Scholar]
- Administration, N.H.T.S. National Automotive Sampling System–Crashworthiness Data System: 2012 Analytical User’s Manual; US Department of Transportation: Washington, DC, USA, 2014. [Google Scholar]
- Wu, K.F.; Thor, C.P. Method for the use of naturalistic driving study data to analyze rear-end crash sequences. Transp. Res. Rec. 2015, 2518, 27–36. [Google Scholar] [CrossRef]
- Xiao, H. Continuous kNN queries in dynamic road networks. Rev. Tec. Fac. Ing. Univ. Zulia 2016, 39, 354–361. [Google Scholar]
- Soehodho, S. Road accidents in Indonesia. IATSS Res. 2009, 33, 122–124. [Google Scholar] [CrossRef] [Green Version]
- Jomnonkwao, S.; Uttra, S.; Ratanavaraha, V. Analysis of a driving behavior measurement model using a modified driver behavior questionnaire encompassing texting, social media use, and drug and alcohol consumption. Transp. Res. Interdiscip. Perspect. 2021, 9, 100302. [Google Scholar] [CrossRef]
- Wang, L.; Wu, J.; Li, X.; Wu, Z.; Zhu, L. Longitudinal control for person-following robots. J. Intell. Connect. Veh. 2022, 5, 88–98. [Google Scholar] [CrossRef]
- Ahmed, H.U.; Huang, Y.; Lu, P. A review of car-following models and modeling tools for human and autonomous-ready driving behaviors in micro-simulation. Smart Cities 2021, 4, 314–335. [Google Scholar] [CrossRef]
- Tarko, A.; Davis, G.; Saunier, N.; Sayed, T.; Washington, S. White Paper Surrogate Measures of Safety ANB20 Subcommittee on Surrogate Measures of Safety ANB20 Committee on Safety Data Evaluation and Analysis Contributors. 2009. Available online: https://www.researchgate.net/publication/245584894 (accessed on 28 April 2009).
- Kim, S.; Song, T.J.; Rouphail, N.M.; Aghdashi, S.; Amaro, A.; Gonçalves, G. Exploring the association of rear-end crash propensity and micro-scale driver behavior. Saf. Sci. 2016, 89, 45–54. [Google Scholar] [CrossRef]
- Kim, J.K.; Wang, Y.; Ulfarsson, G.F. Modeling the probability of freeway rear-end crash occurrence. J. Transp. Eng. 2007, 133, 11–19. [Google Scholar] [CrossRef] [Green Version]
- Borowsky, A.; Oron-Gilad, T.; Meir, A.; Parmet, Y. Drivers’ perception of vulnerable road users: A hazard perception approach. Accid. Anal. Prev. 2012, 44, 160–166. [Google Scholar] [CrossRef] [PubMed]
- Meir, A.; Borowsky, A.; Oron-Gilad, T. Formation and evaluation of act and anticipate hazard perception training (AAHPT) intervention for young novice drivers. Traffic Inj. Prev. 2014, 15, 172–180. [Google Scholar] [CrossRef] [PubMed]
- Li, Y.; Zheng, Y.; Wang, J.; Kodaka, K.; Li, K. Crash probability estimation via quantifying driver hazard perception. Accid. Anal. Prev. 2018, 116, 116–125. [Google Scholar] [CrossRef]
- Feng, Z.X.; Liu, J.; Li, Y.Y.; Zhang, W.H. Selected model and sensitivity analysis of aggressive driving behavior. China J. Highw. Transp. 2012, 25, 106. [Google Scholar]
- Tu, H.; Tamminga, G.; Pel, A.J.; Drolenga, H. Sensitivity Analysis on Heterogeneity of Driving Behavior for Evacuation Studies and Its Impacts on Traffic Safety. In Proceedings of the 13th International IEEE Conference on Intelligent Transportation Systems, Madeira Island, Portugal, 19–22 September 2010; pp. 456–461. [Google Scholar]
- Chung, S.B.; Song, K.H.; Hong, S.Y.; Kho, S.Y. Development of sensitivity term in car-following model considering practical driving behavior of preventing rear end collision. J. East. Asia Soc. Transp. Stud. 2005, 6, 1354–1367. [Google Scholar]
- Ossen, S.; Hoogendoorn, S.P.; Gorte, B.G. Interdriver differences in car-following: A vehicle trajectory–based study. Transp. Res. Rec. 2006, 1965, 121–129. [Google Scholar] [CrossRef]
- Wang, L.; Zhang, H.; Meng, H.; Wang, X. The influence of individual driver characteristics on congestion formation. Int. J. Mod. Phys. C 2011, 22, 305–318. [Google Scholar] [CrossRef]
- Taylor, J.; Zhou, X.; Rouphail, N.M.; Porter, R.J. Method for investigating intradriver heterogeneity using vehicle trajectory data: A dynamic time warping approach. Transp. Res. Part B Methodol. 2015, 73, 59–80. [Google Scholar] [CrossRef]
- Hourdos, J.N. Crash Prone Traffic Flow Dynamics: Identification and Real-Time Detection; University of Minnesota: Minneapolis, MN, USA, 2005. [Google Scholar]
- Zheng, Z.; Ahn, S.; Monsere, C.M. Impact of traffic oscillations on freeway crash occurrences. Accid. Anal. Prev. 2010, 42, 626–636. [Google Scholar] [CrossRef] [Green Version]
- Chatterjee, I.; Davis, G.A. Analysis of rear-end events on congested freeways by using video-recorded shock waves. Transp. Res. Rec. 2016, 2583, 110–118. [Google Scholar] [CrossRef]
- Yagar, S. Introduction to the Theory of Traffic Flow. Transp. Res. Part A Gen. 1991, 25, 143–144. [Google Scholar]
- Ossen, S.; Hoogendoorn, S.P. Driver heterogeneity in car following and its impact on modeling traffic dynamics. Transp. Res. Rec. 2007, 1999, 95–103. [Google Scholar] [CrossRef]
- Yang, D.; Zhu, L.; Pu, Y. Model and stability of the traffic flow consisting of heterogeneous drivers. J. Comput. Nonlinear Dyn. 2015, 10, 031001. [Google Scholar] [CrossRef]
- Ngoduy, D. Analytical studies on the instabilities of heterogeneous intelligent traffic flow. Commun. Nonlinear Sci. Numer. Simul. 2013, 18, 2699–2706. [Google Scholar] [CrossRef]
- Monteil, J.; Bouroche, M.; Leith, D.J. L2 and L∞ Stability Analysis of Heterogeneous Traffic With Application to Parameter Optimization for the Control of Automated Vehicles. IEEE Trans. Control. Syst. Technol. 2018, 27, 934–949. [Google Scholar] [CrossRef] [Green Version]
- Montanino, M.; Monteil, J.; Punzo, V. From homogeneous to heterogeneous traffic flows: Lp String stability under uncertain model parameters. Transp. Res. Part B Methodol. 2021, 146, 136–154. [Google Scholar] [CrossRef]
- Ahmed, A.; Ngoduy, D.; Adnan, M.; Baig, M.A.U. On the fundamental diagram and driving behavior modeling of heterogeneous traffic flow using UAV-based data. Transp. Res. Part A Policy Pract. 2021, 148, 100–115. [Google Scholar] [CrossRef]
- Lu, G.; Cheng, B.; Lin, Q.; Wang, Y. Quantitative indicator of homeostatic risk perception in car following. Saf. Sci. 2012, 50, 1898–1905. [Google Scholar] [CrossRef]
- Lu, G.; Cheng, B.; Wang, Y.; Lin, Q. A car-following model based on quantified homeostatic risk perception. Math. Probl. Eng. 2013, 2013, 408756. [Google Scholar] [CrossRef]
- Washington, D. Highway capacity manual. Spec. Rep. 1985, 209, 5–7. [Google Scholar]
| Disclaimer/Publisher’s Note: The statements, opinions and data contained in all publications are solely those of the individual author(s) and contributor(s) and not of MDPI and/or the editor(s). MDPI and/or the editor(s) disclaim responsibility for any injury to people or property resulting from any ideas, methods, instructions or products referred to in the content. |
© 2022 by the authors. Licensee MDPI, Basel, Switzerland. This article is an open access article distributed under the terms and conditions of the Creative Commons Attribution (CC BY) license (https://creativecommons.org/licenses/by/4.0/).


