
Location Optimization of Urban Fire Stations Considering the Backup Coverage
 , ,
, ,
Abstract
:1. Introduction
2. Methods
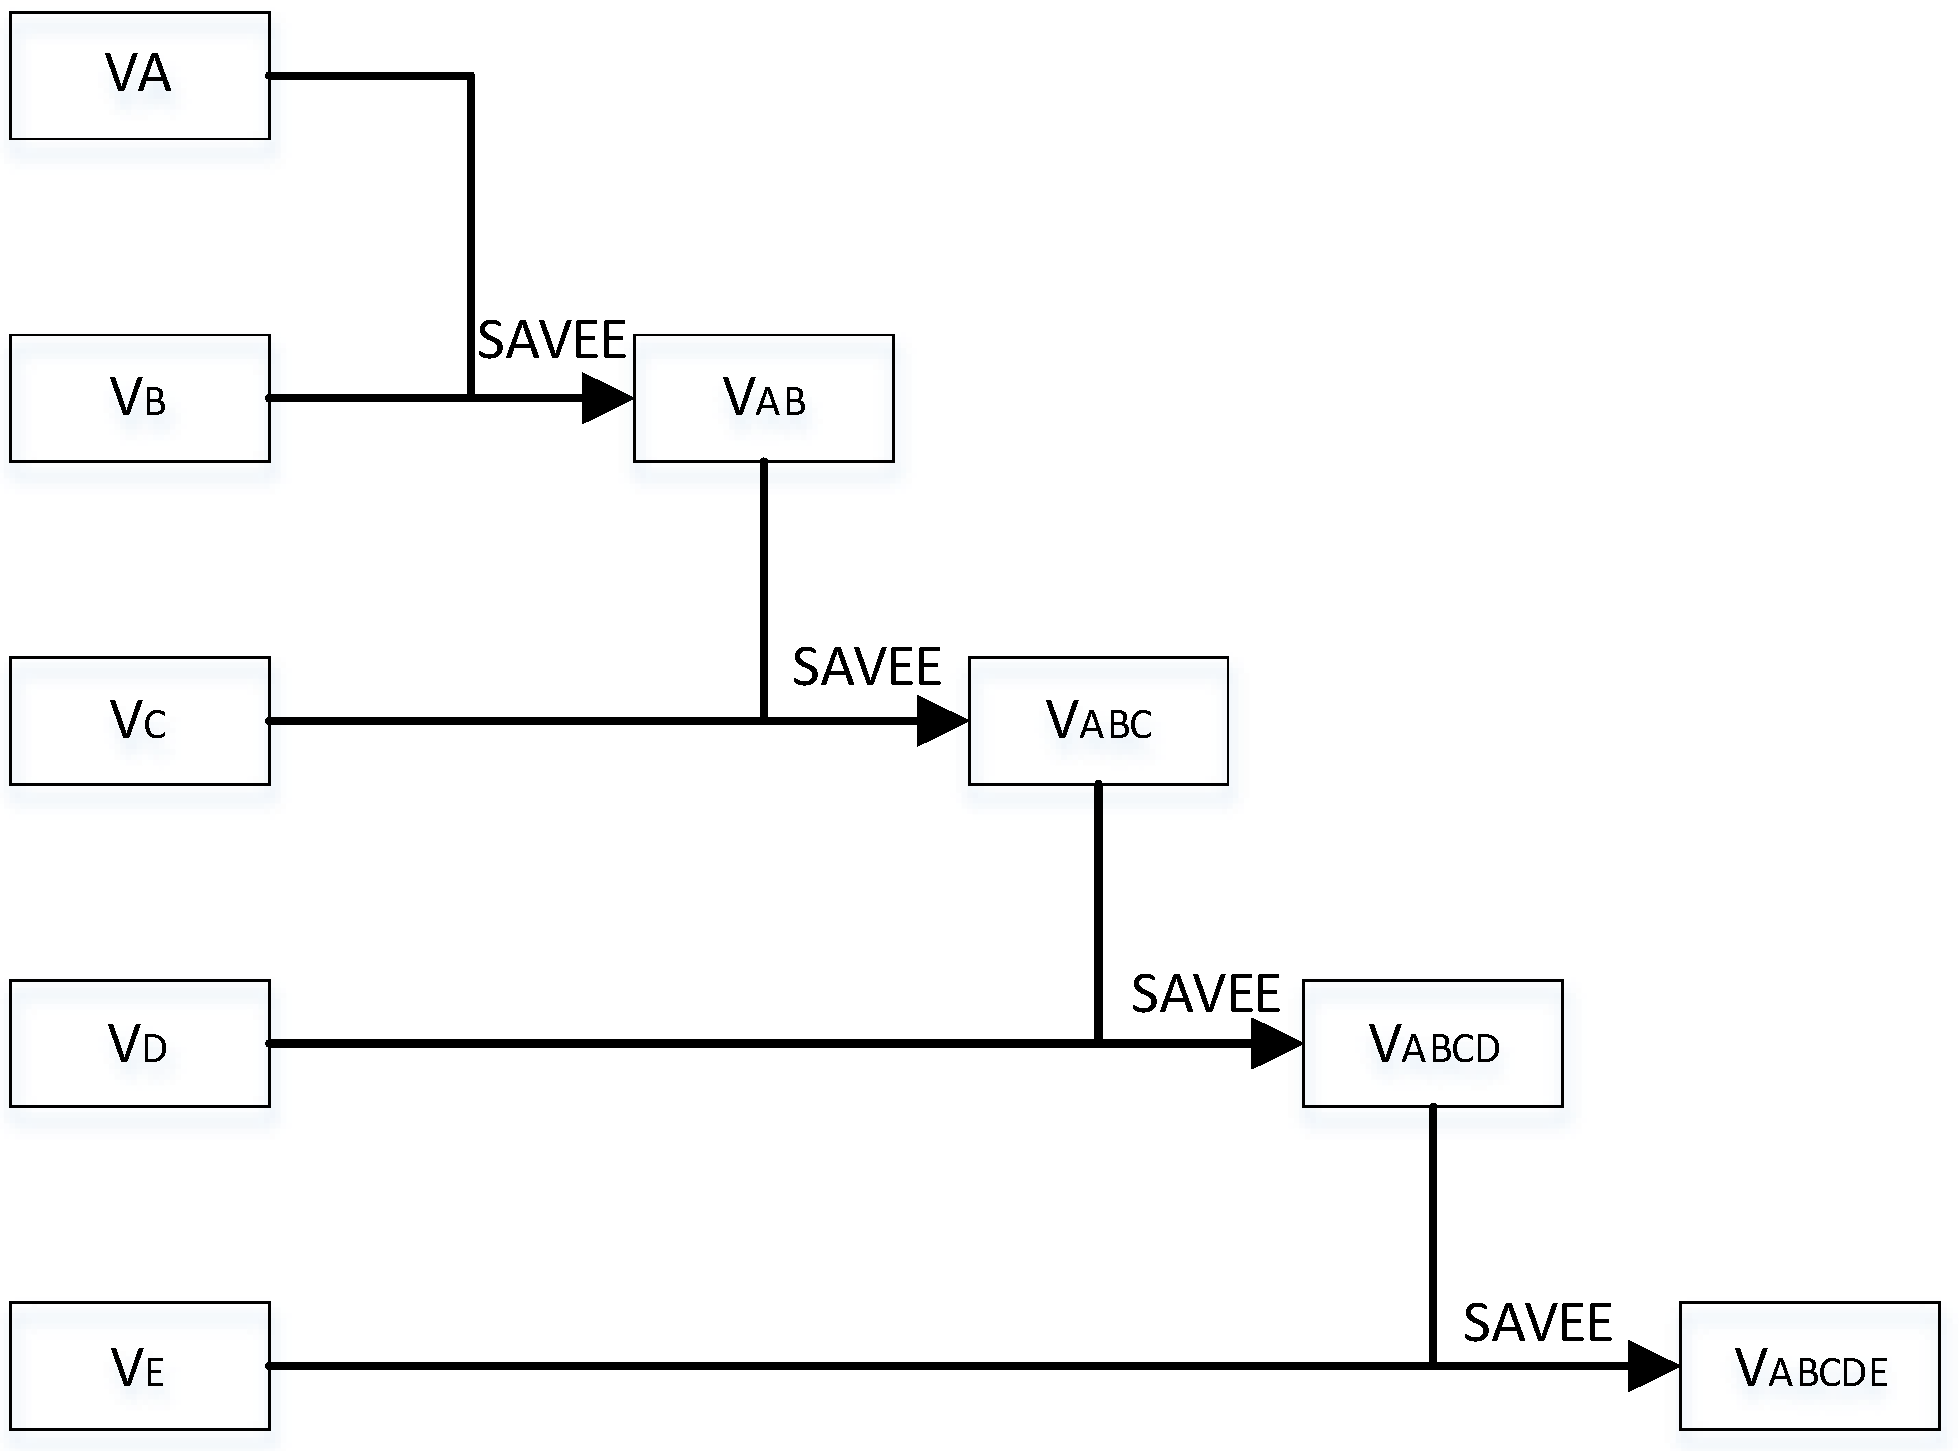
2.1. Calculation of Urban Fire Risk Based on SAVEE
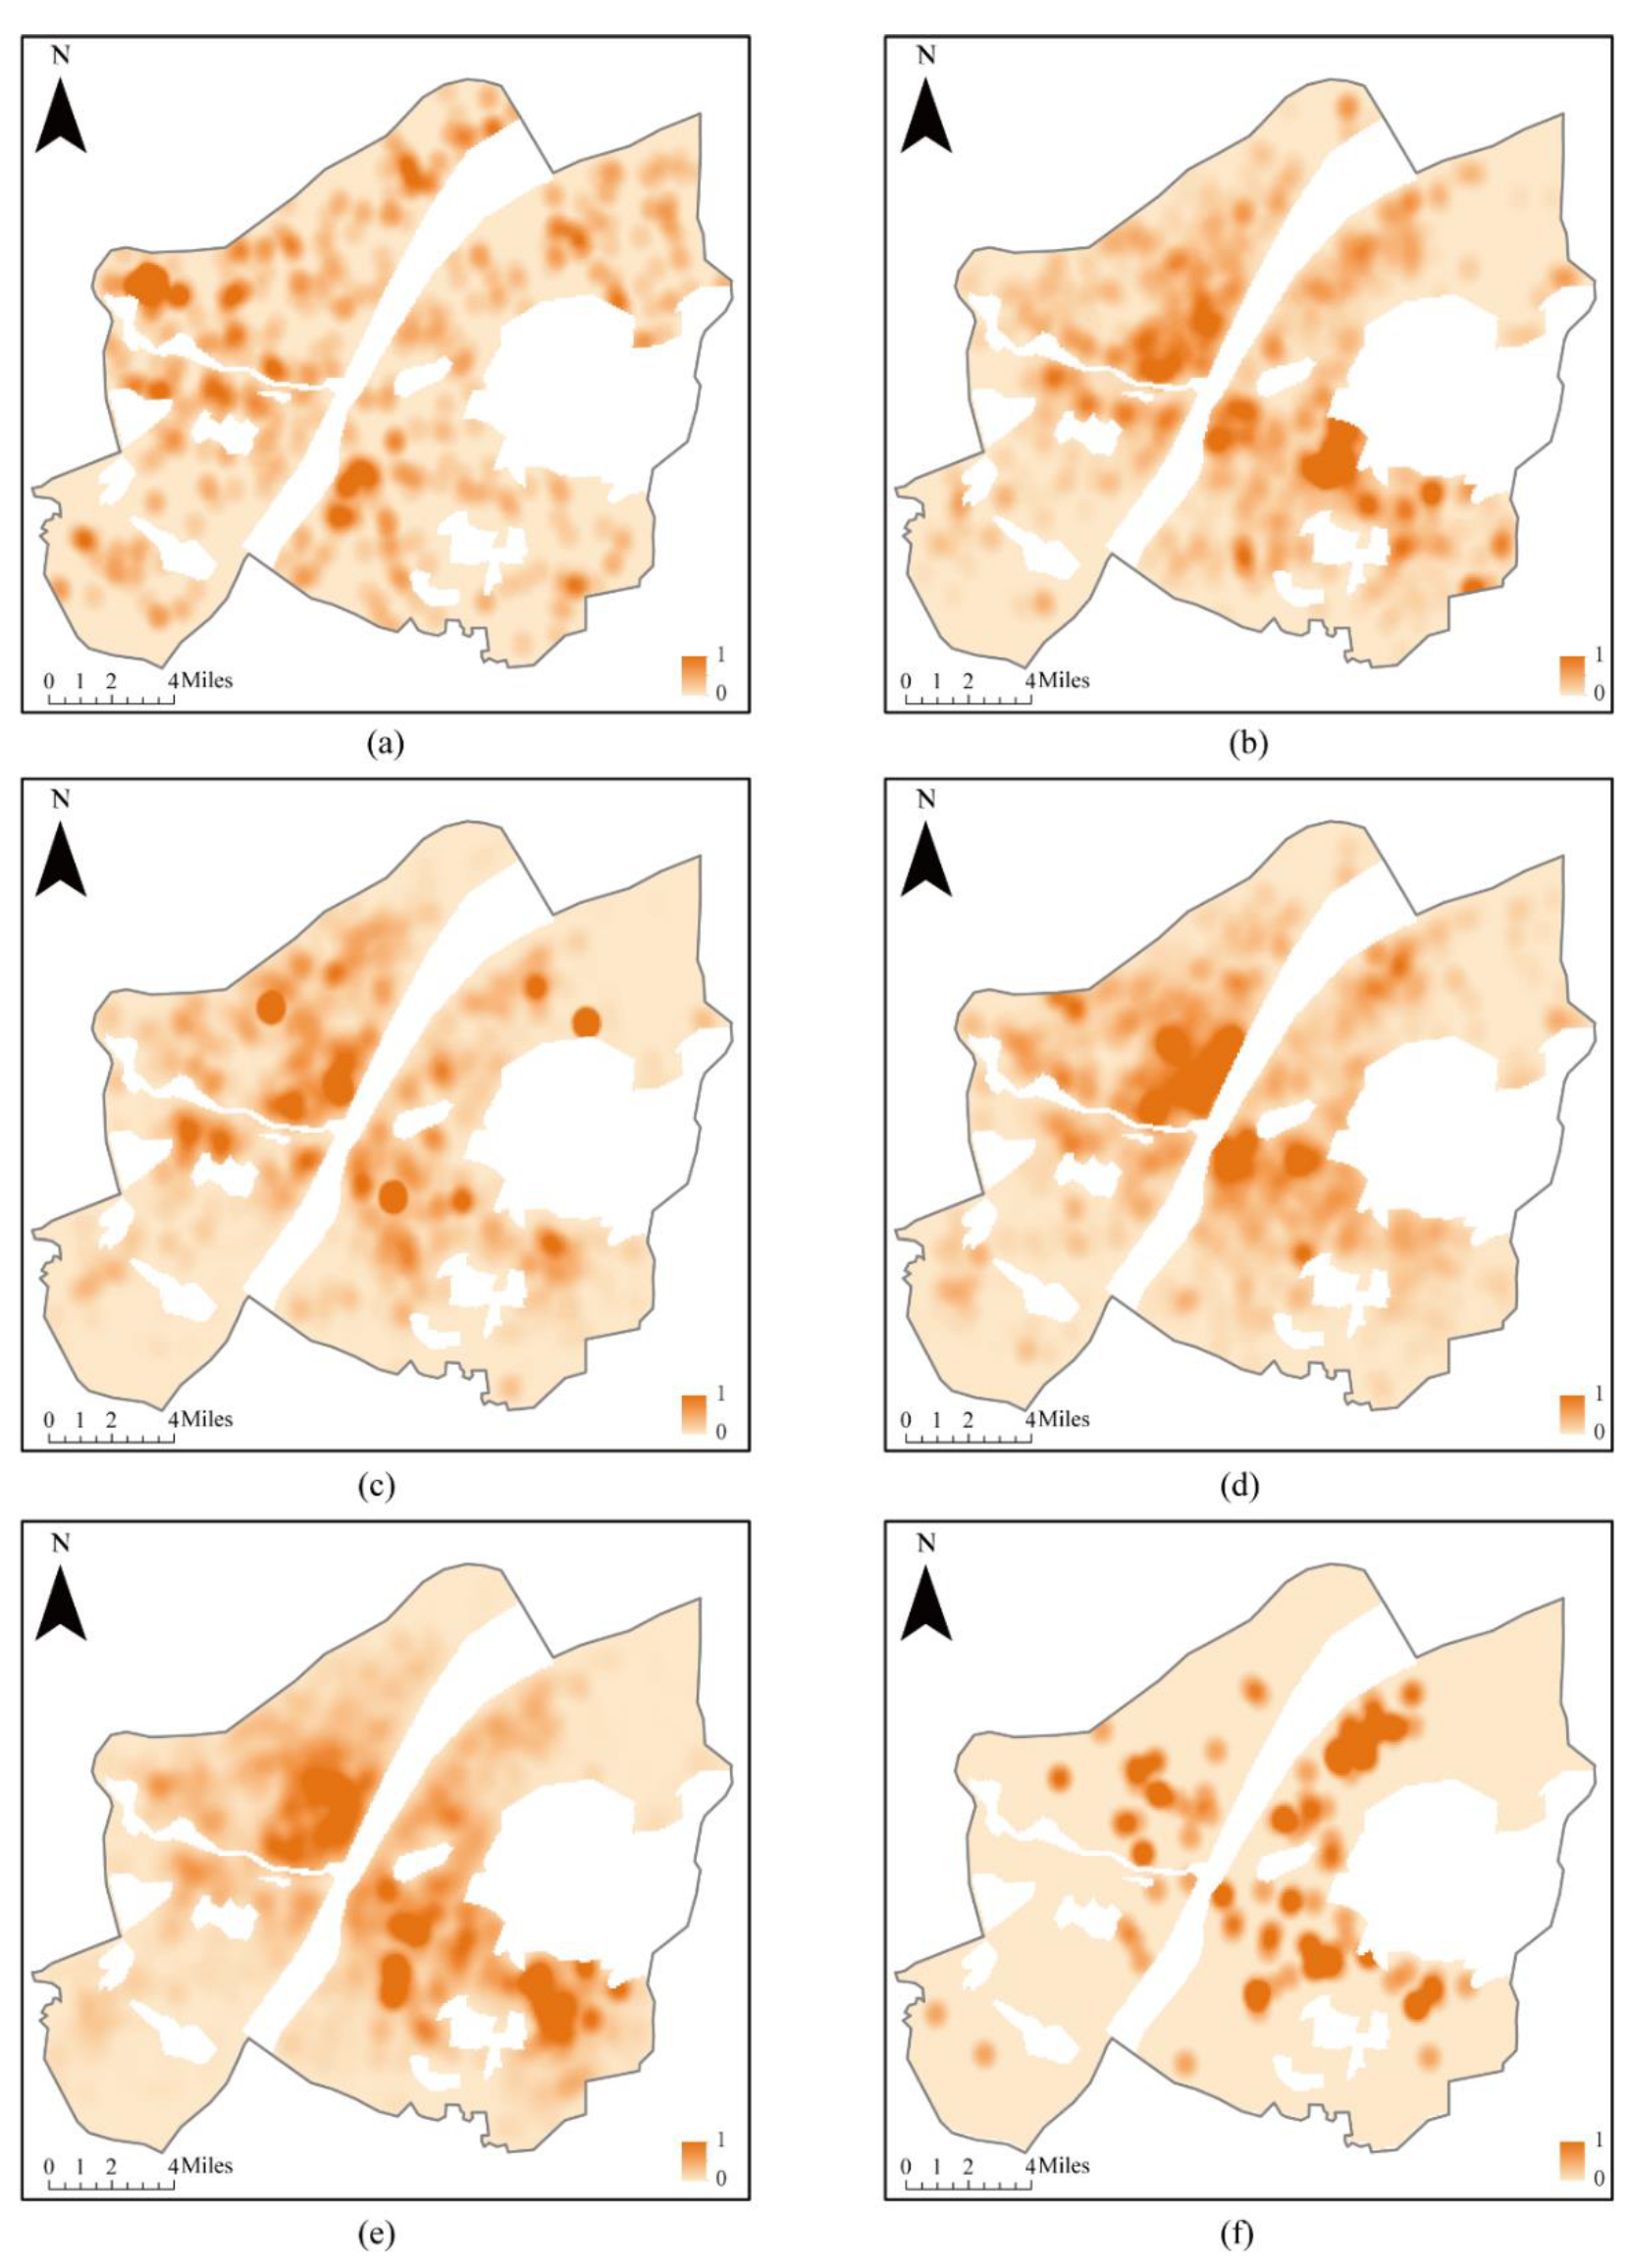
2.1.1. Fire Risk Assessment Based on POIs
2.1.2. Fire Risk Quantification
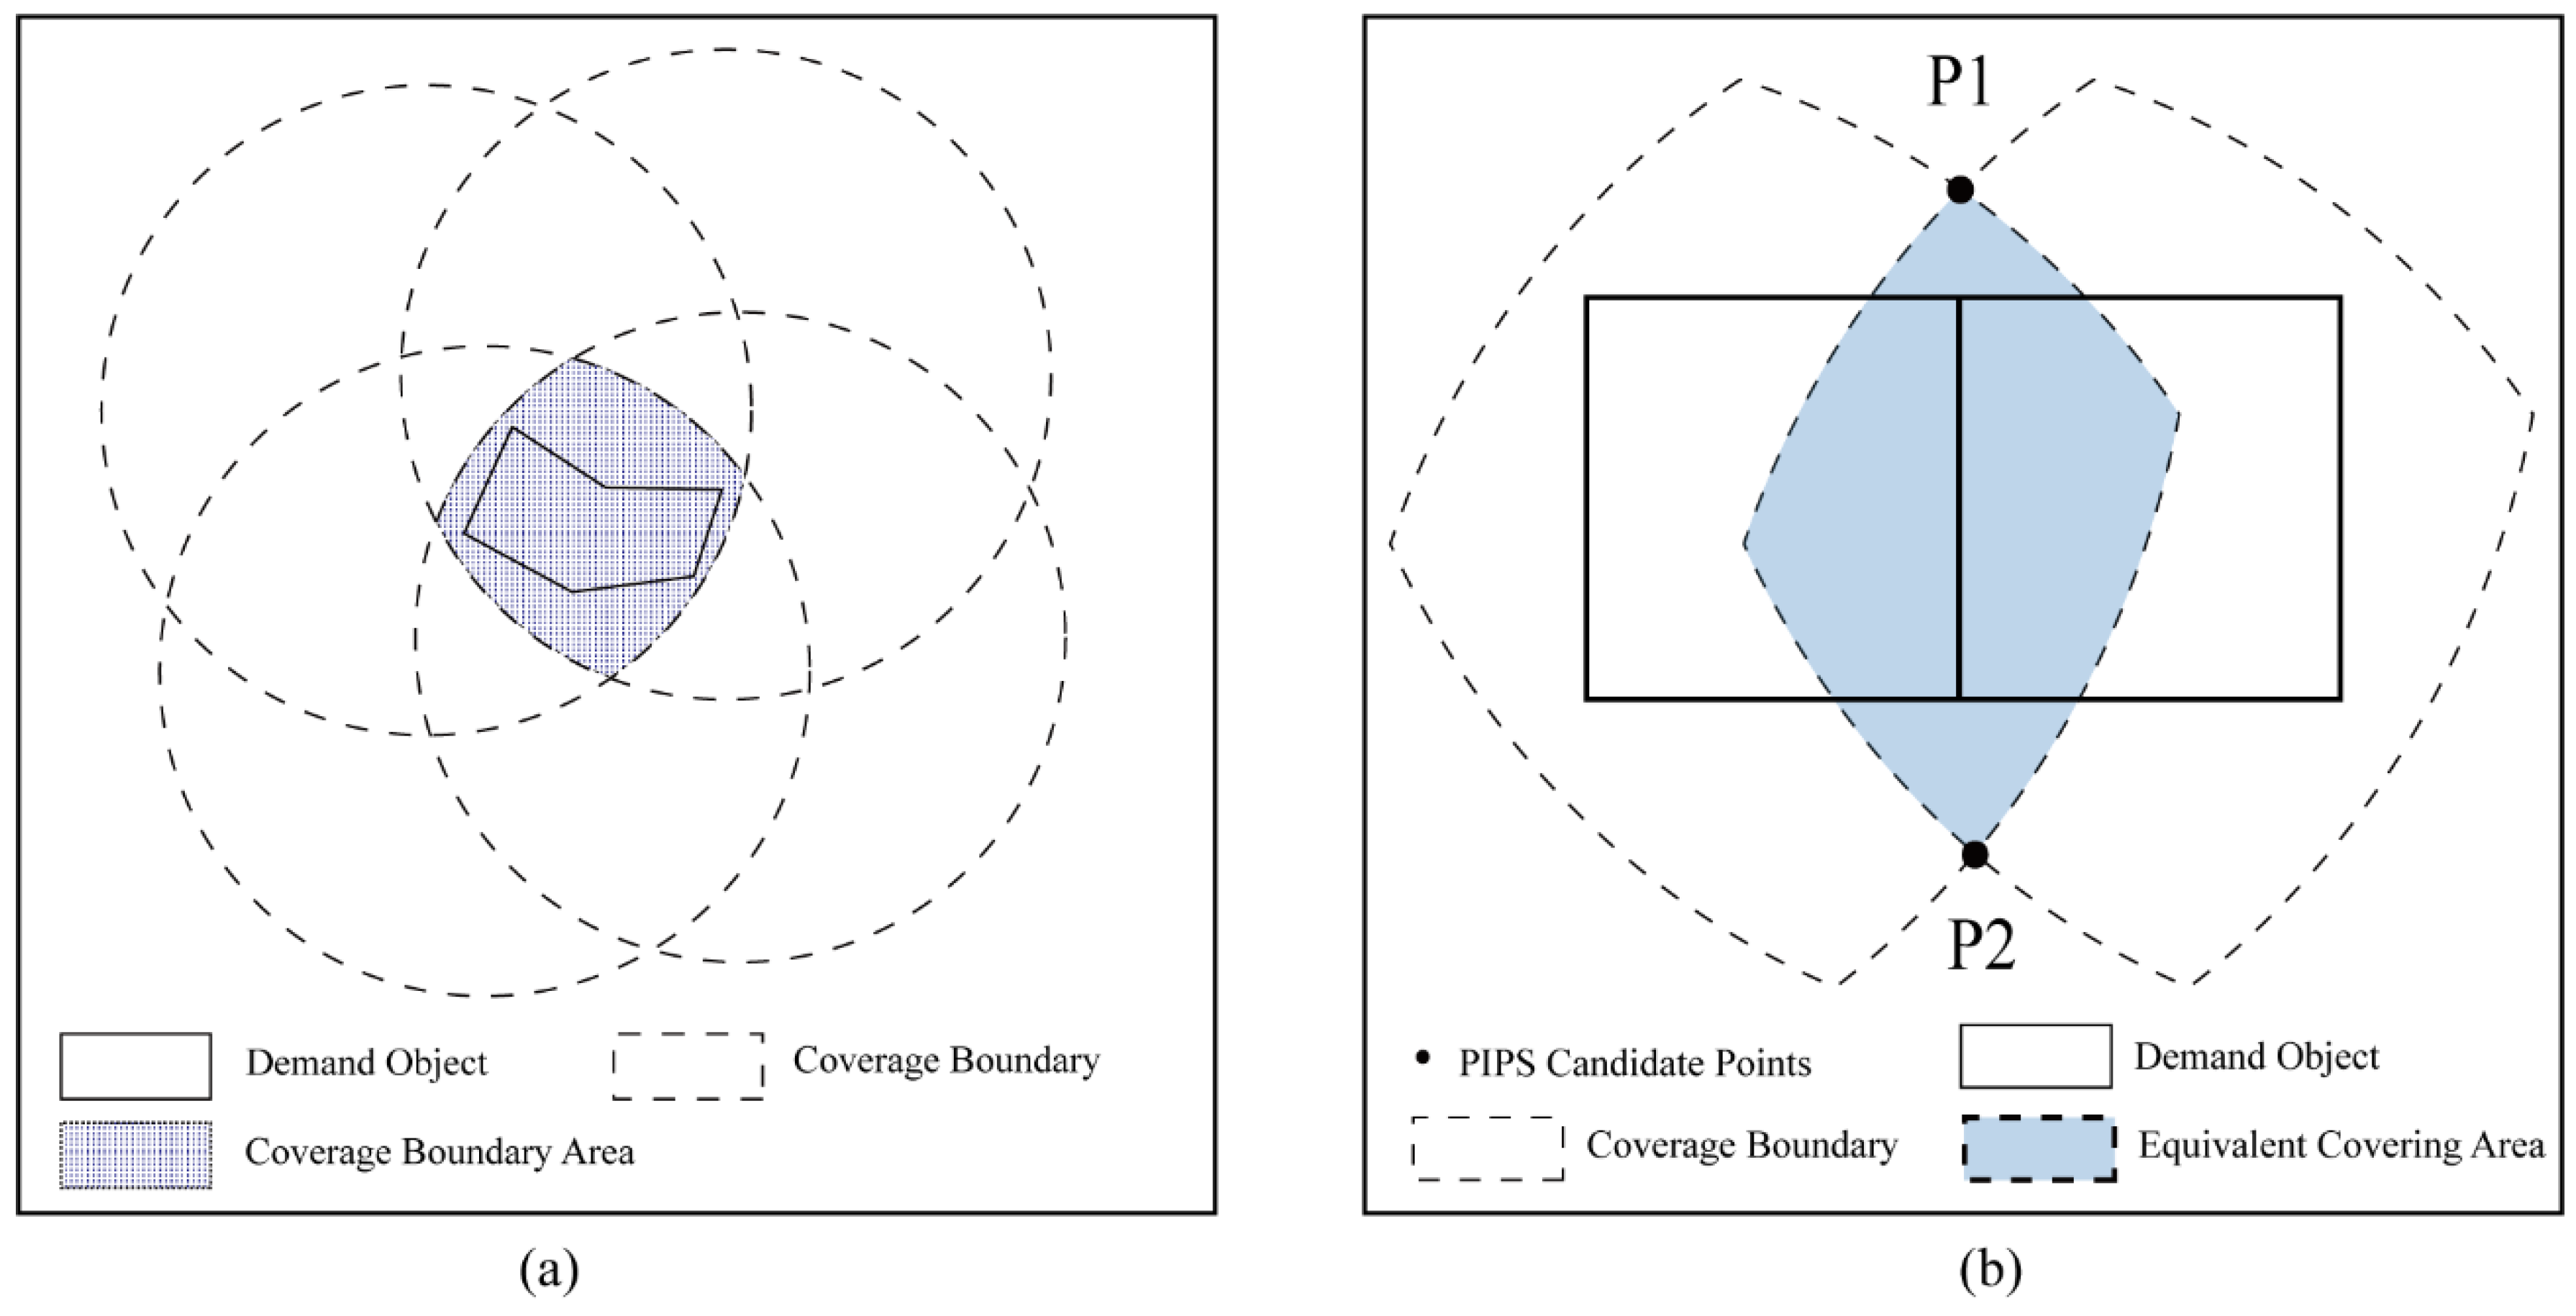
2.2. Candidate Points for Urban Fire Stations under Constraint Conditions
2.3. Multi-Objective Optimization Based on Backup Coverage
- I, J: the set of demand areas and potential fire stations, respectively;
- i, j: the index of demand areas and potential fire stations, respectively;
- ai: estimated fire risk in-demand area i;
- dij: the distance between i and j;
- S: service standard;
- Ni: the set of fire stations capable of suitably serving demand i, ;
- p: the number of fire stations points that qualify;
3. Results
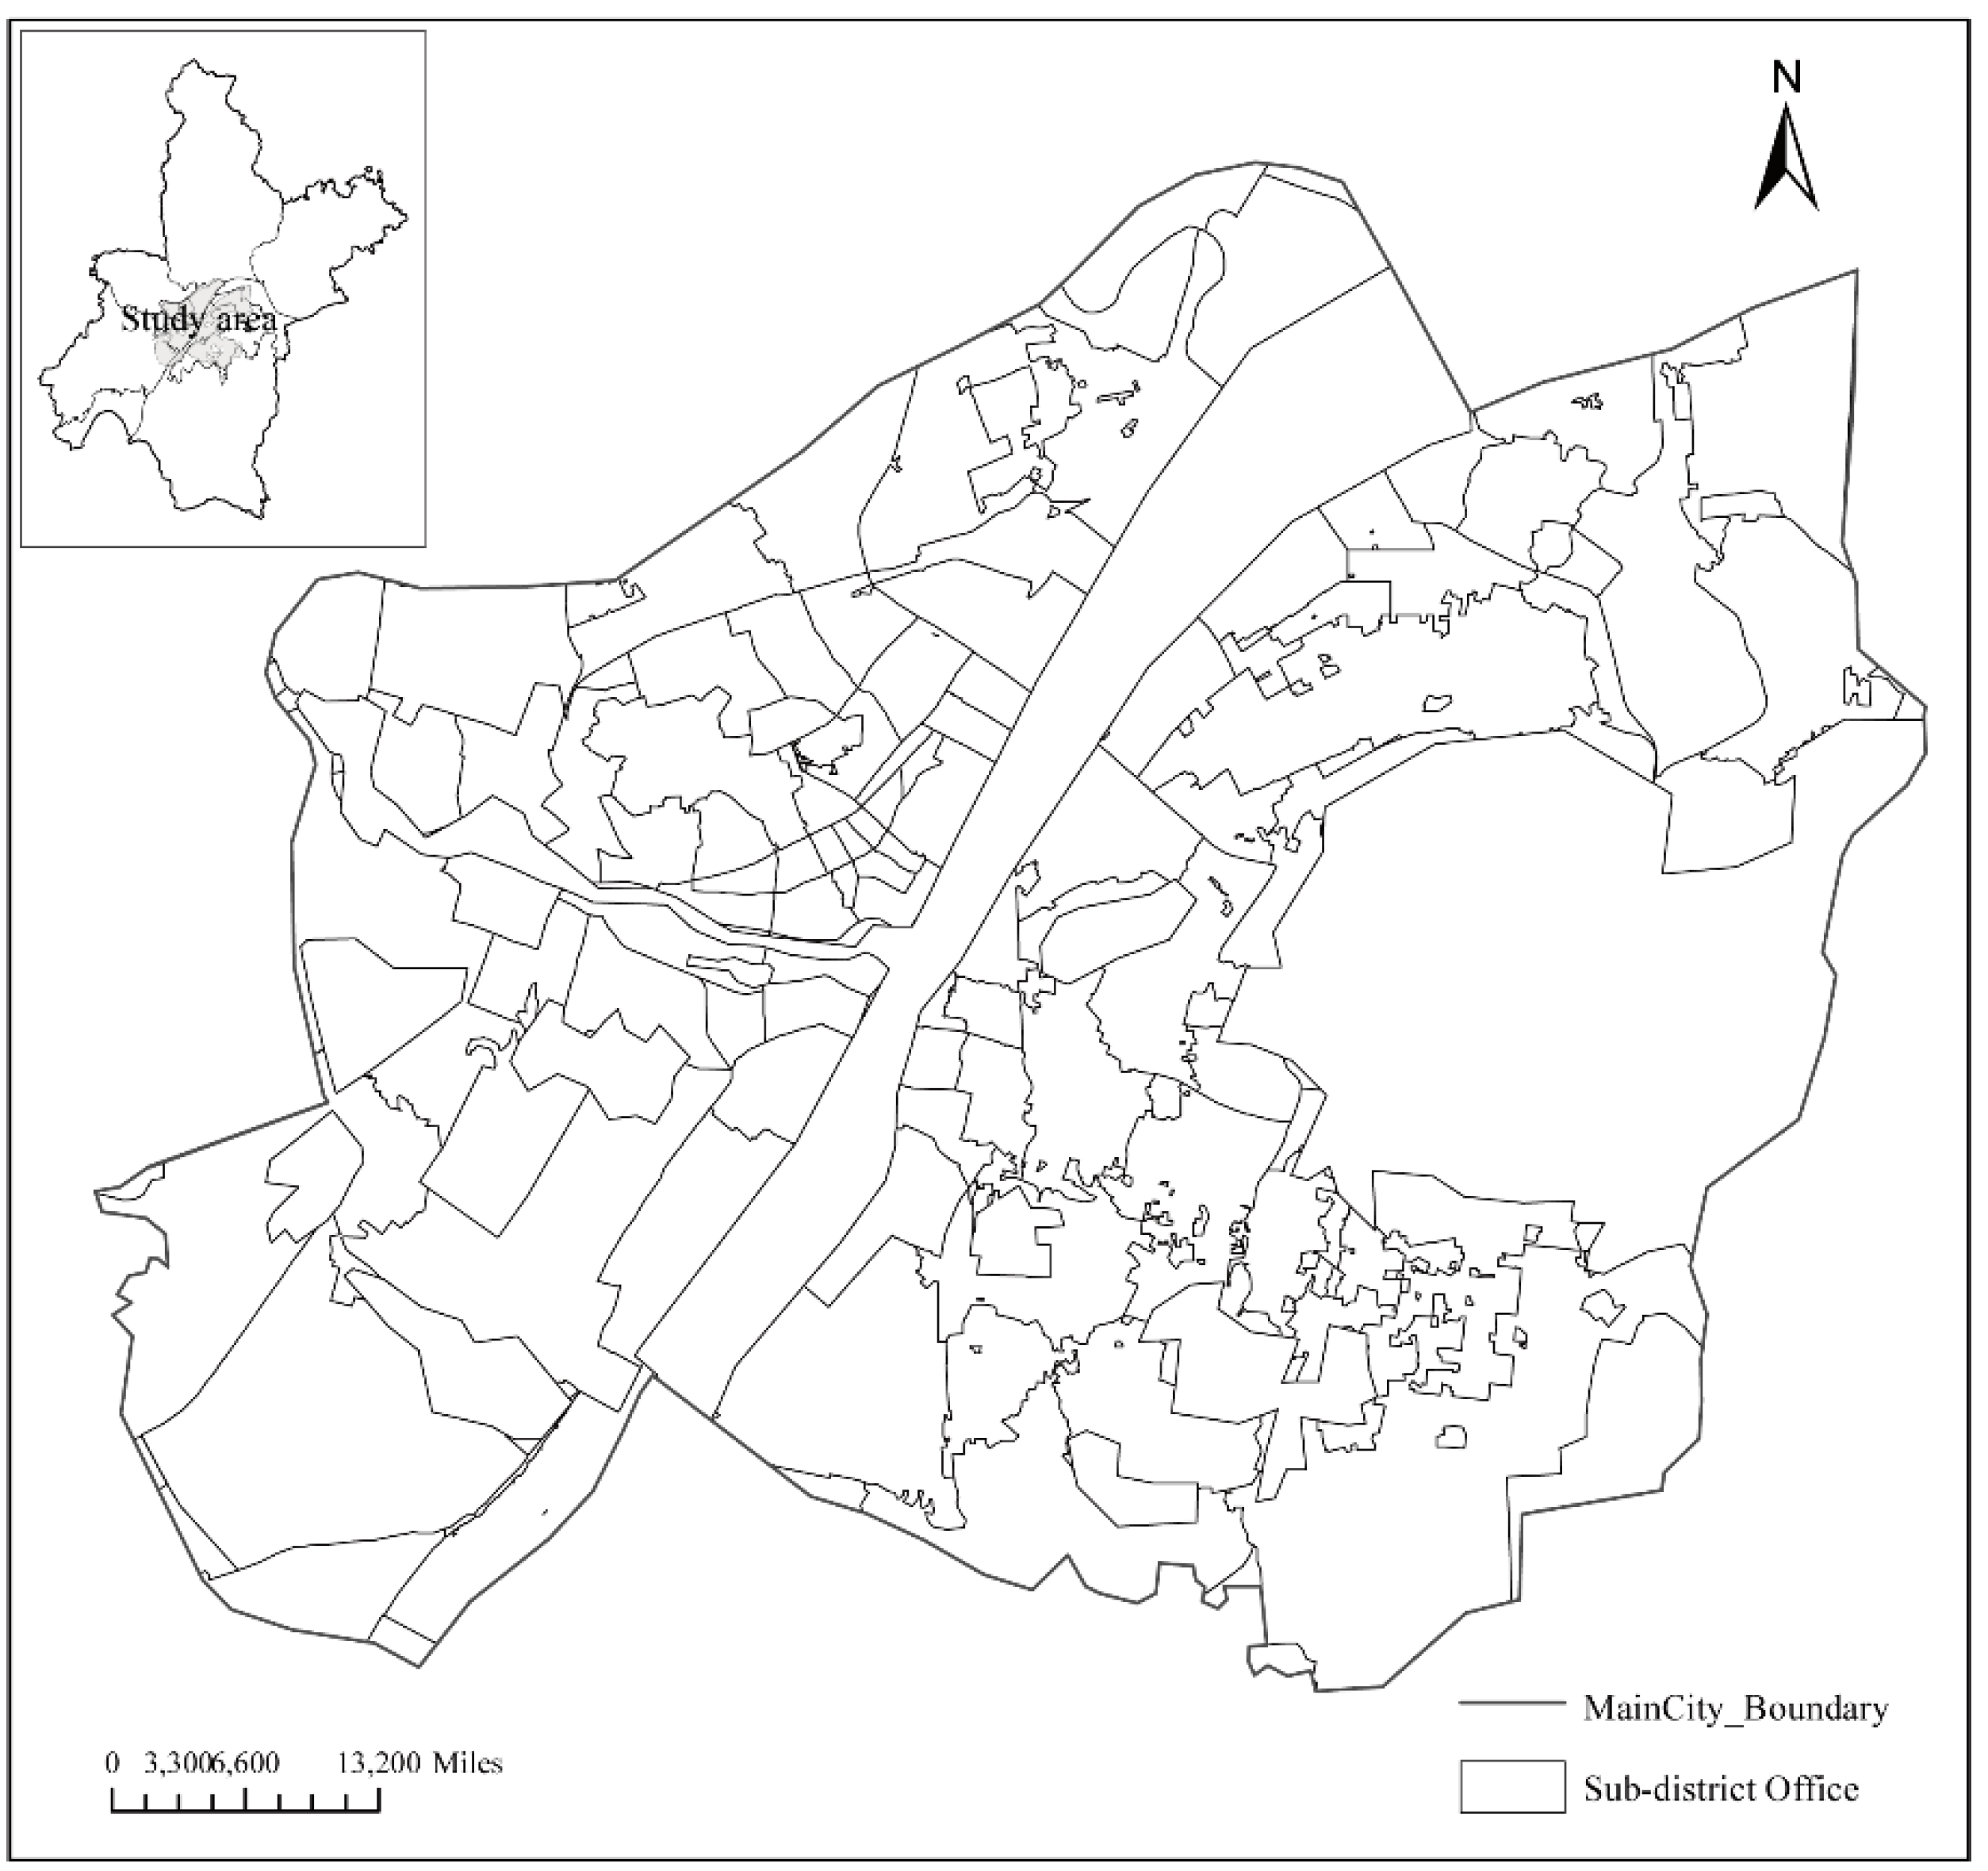
3.1. Study Area
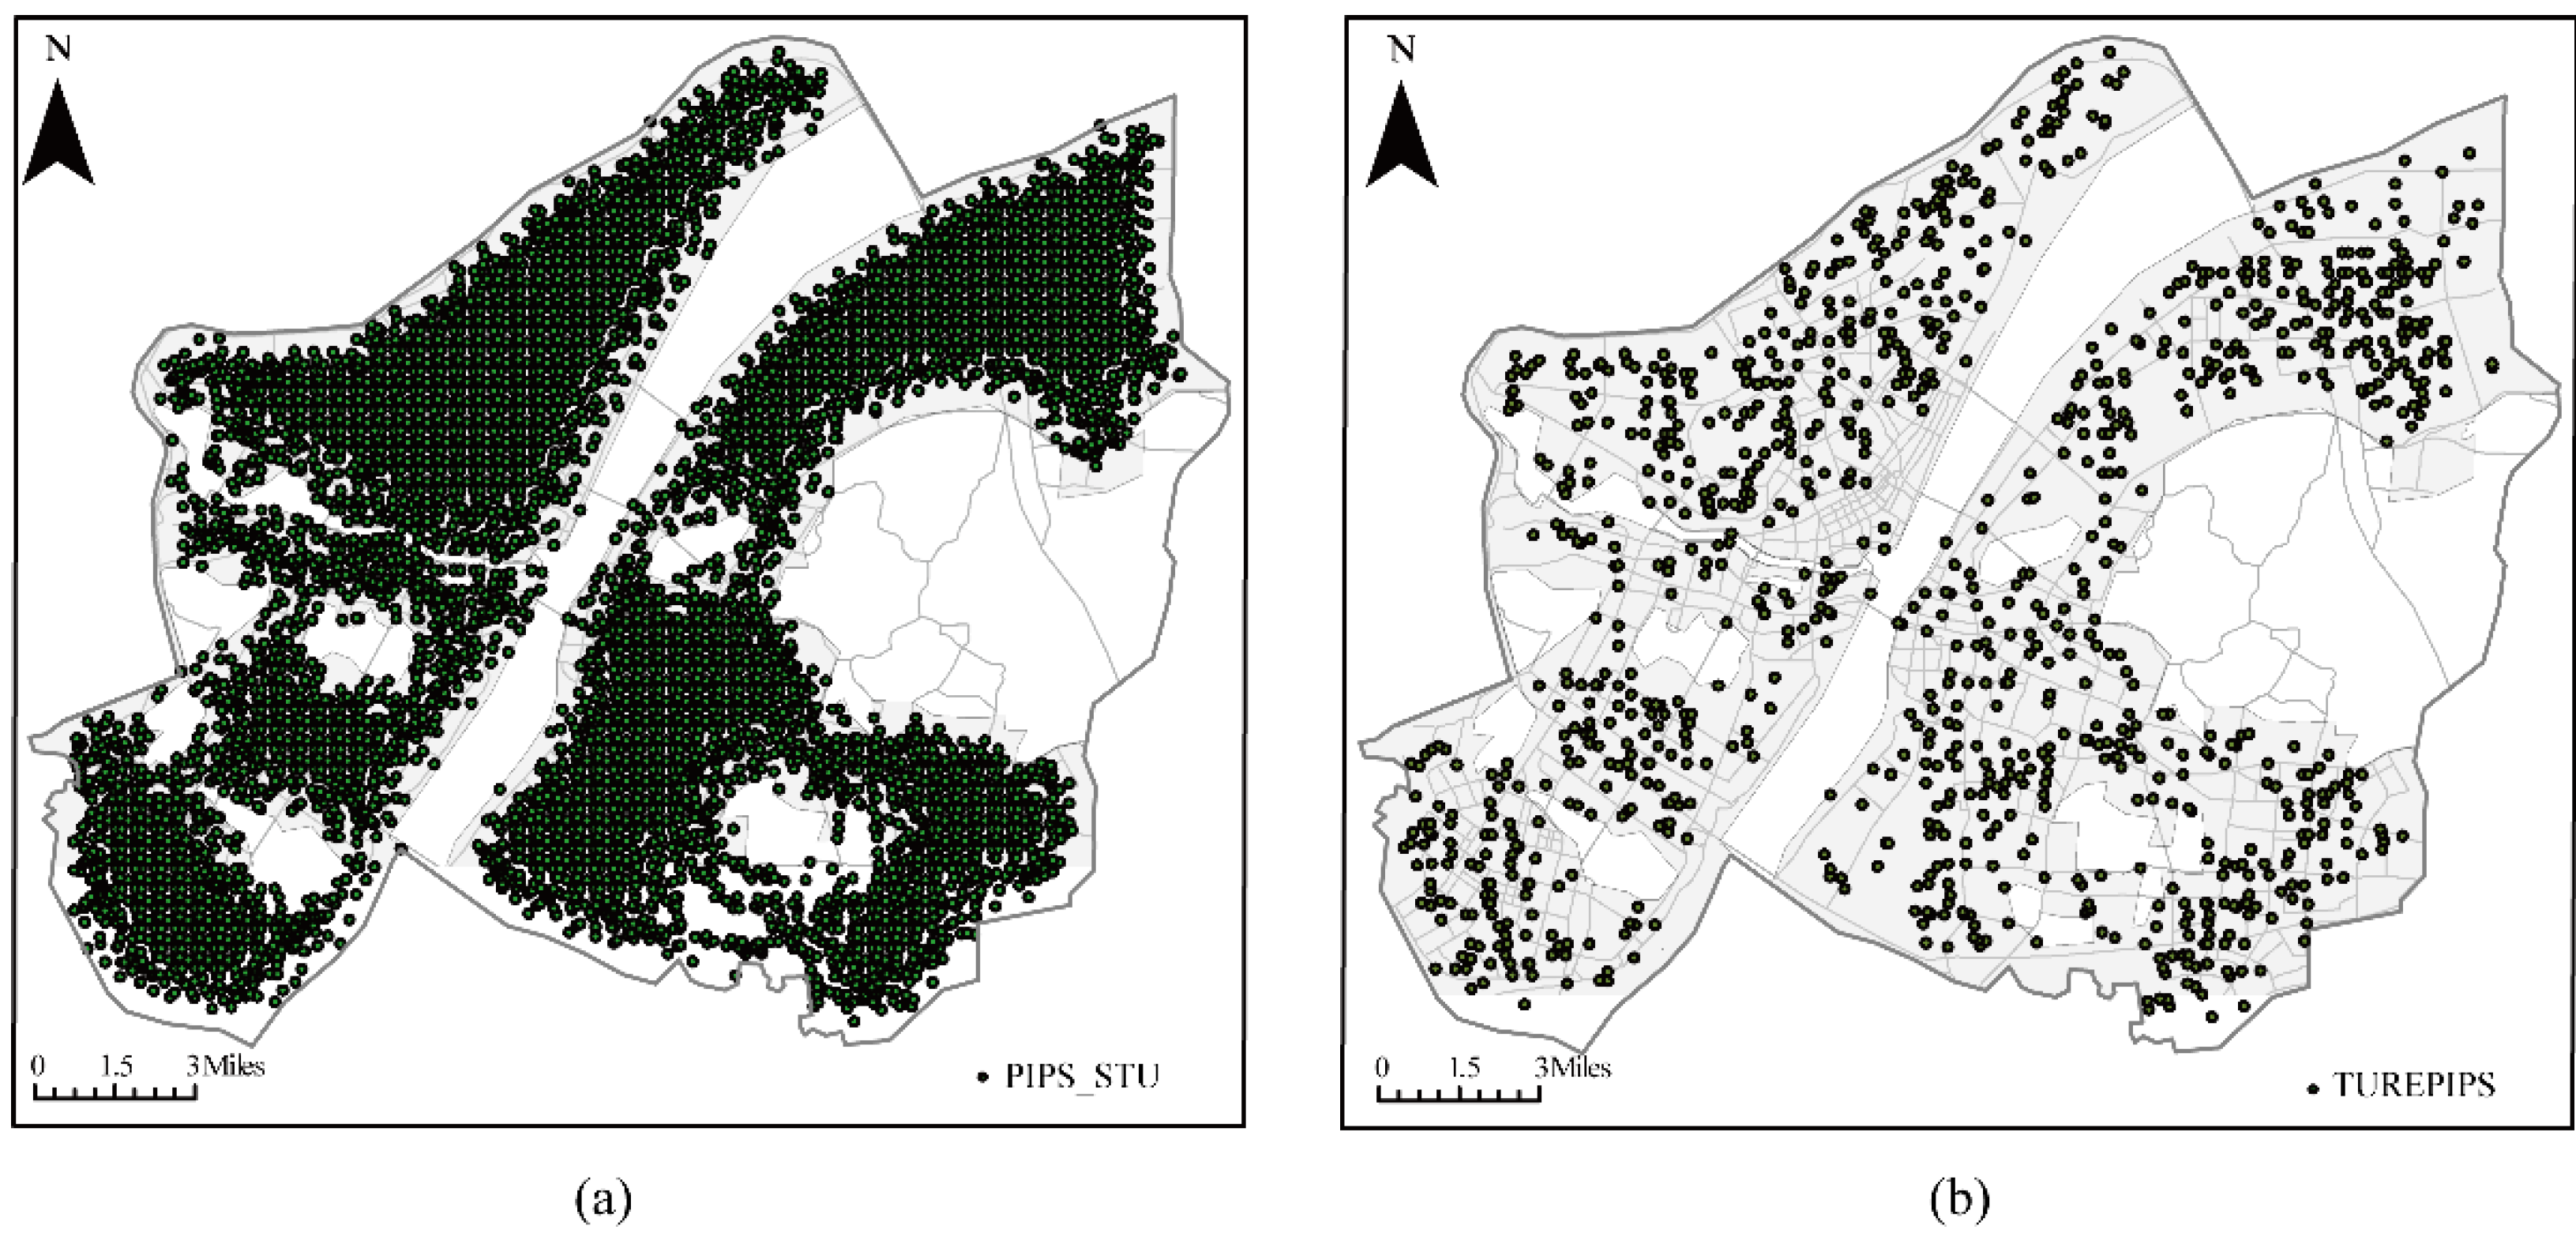
3.2. Calculating Candidate Locations for Fire Stations under Multiple Constraints
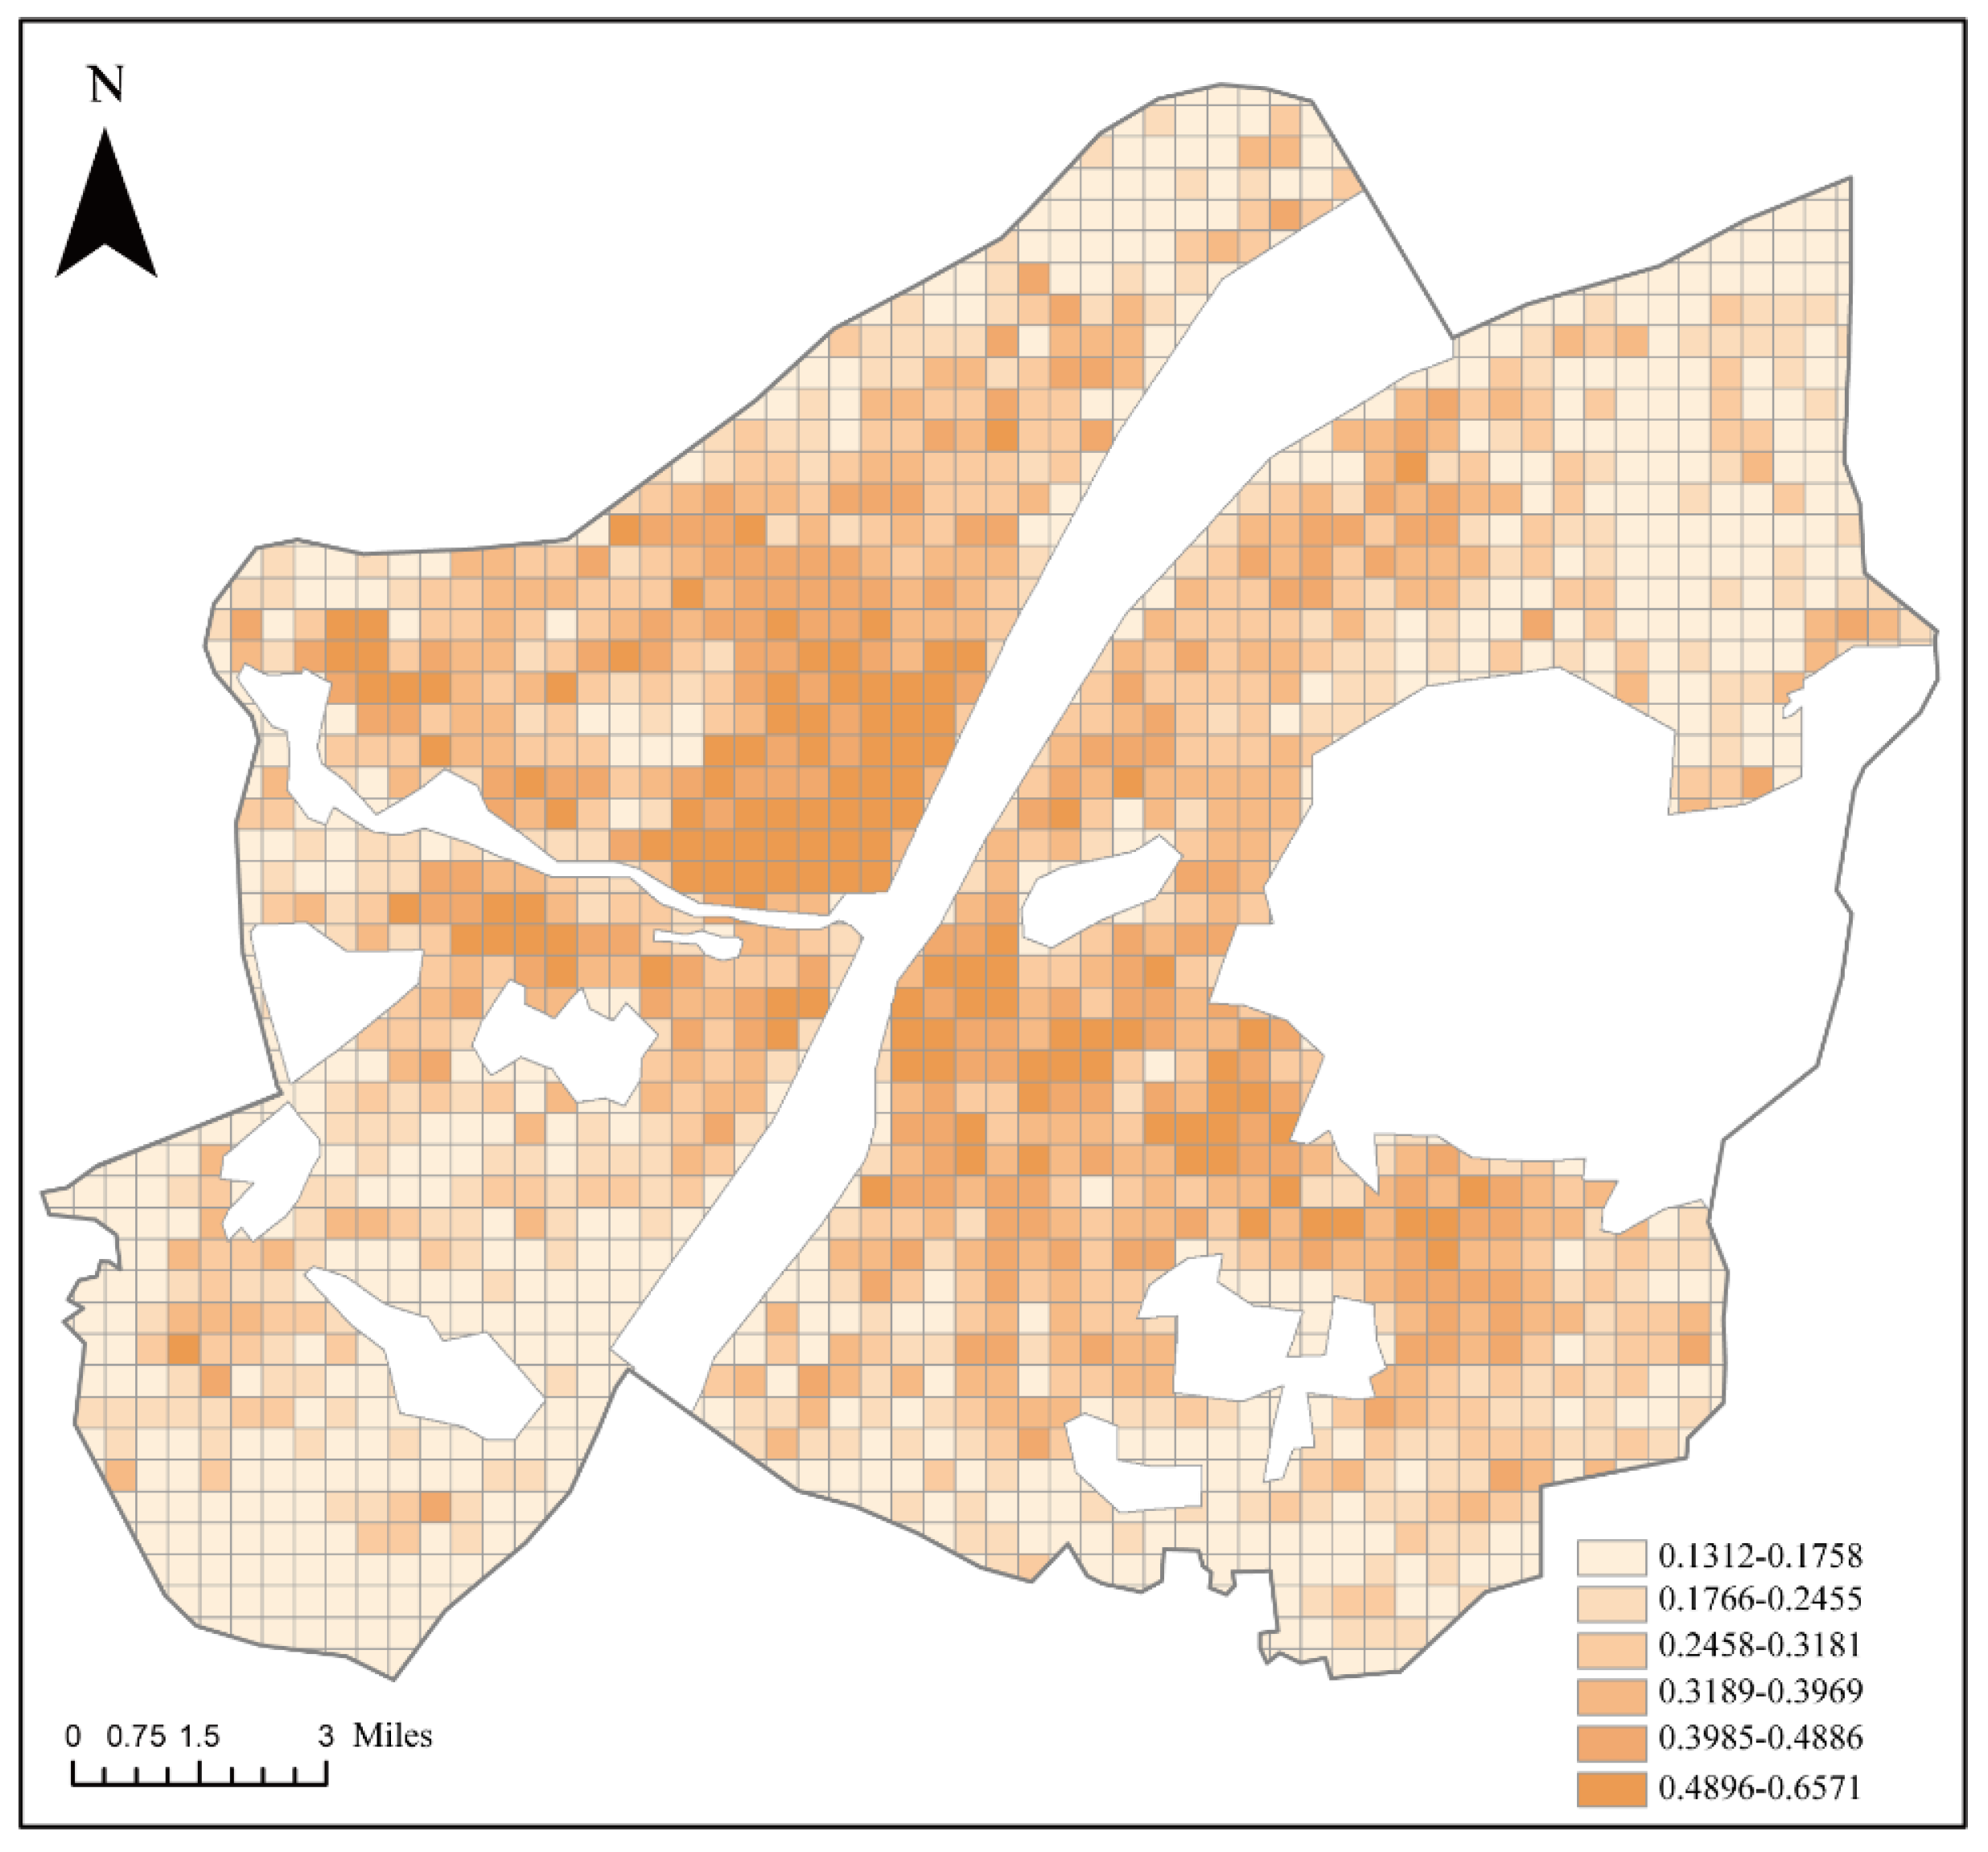
3.3. Regional Fire Risk Assessment
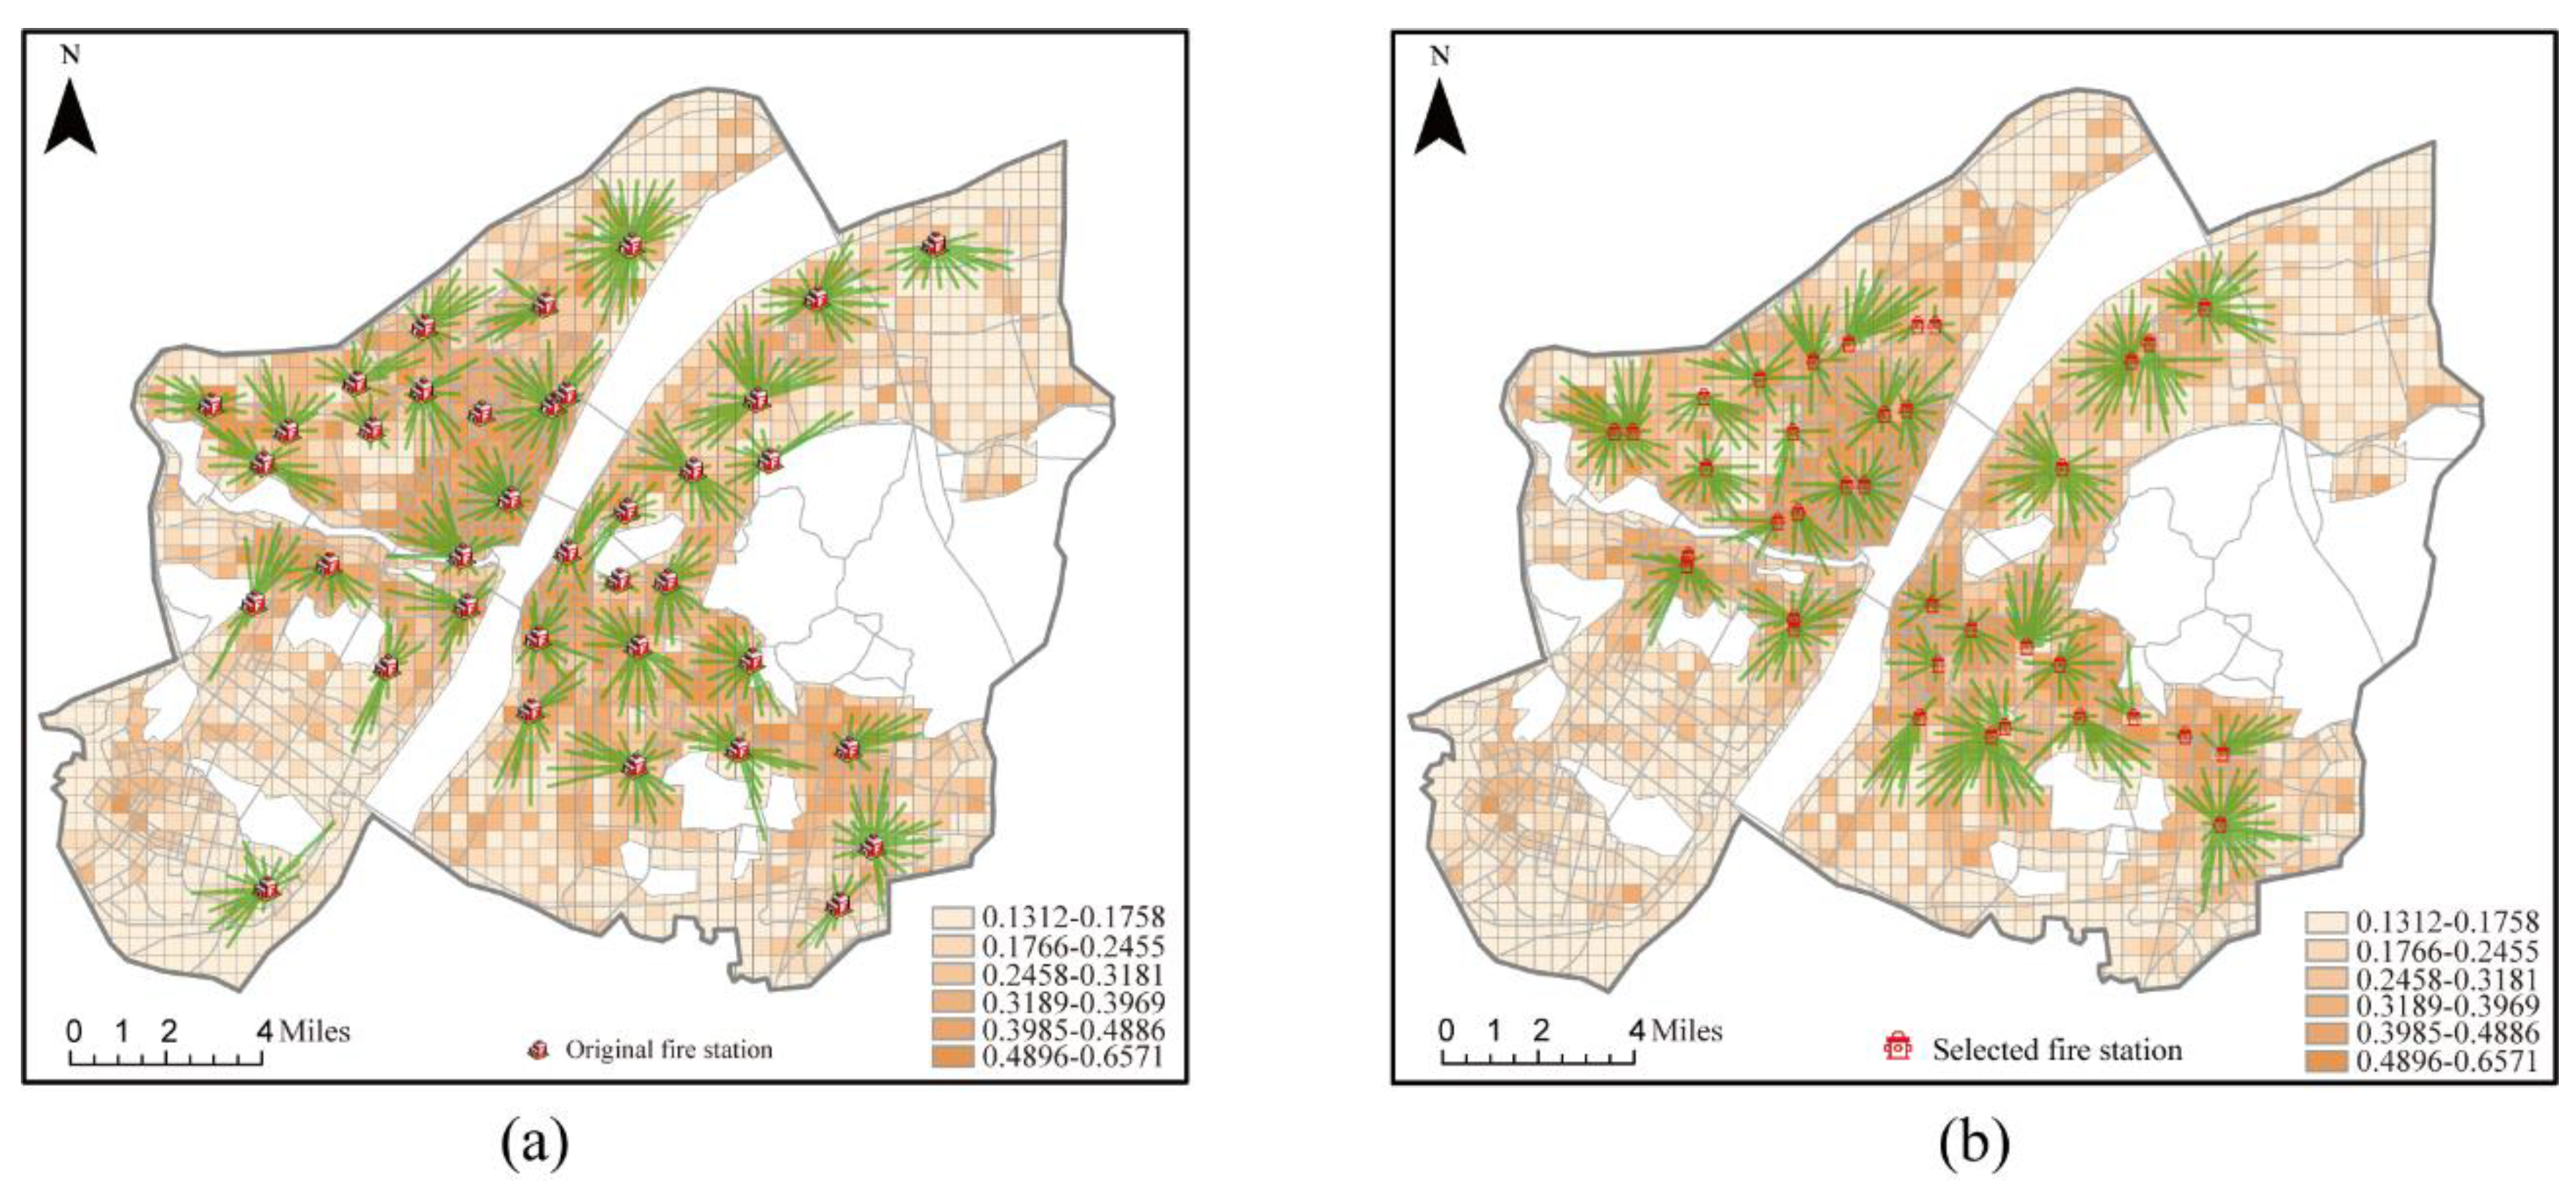
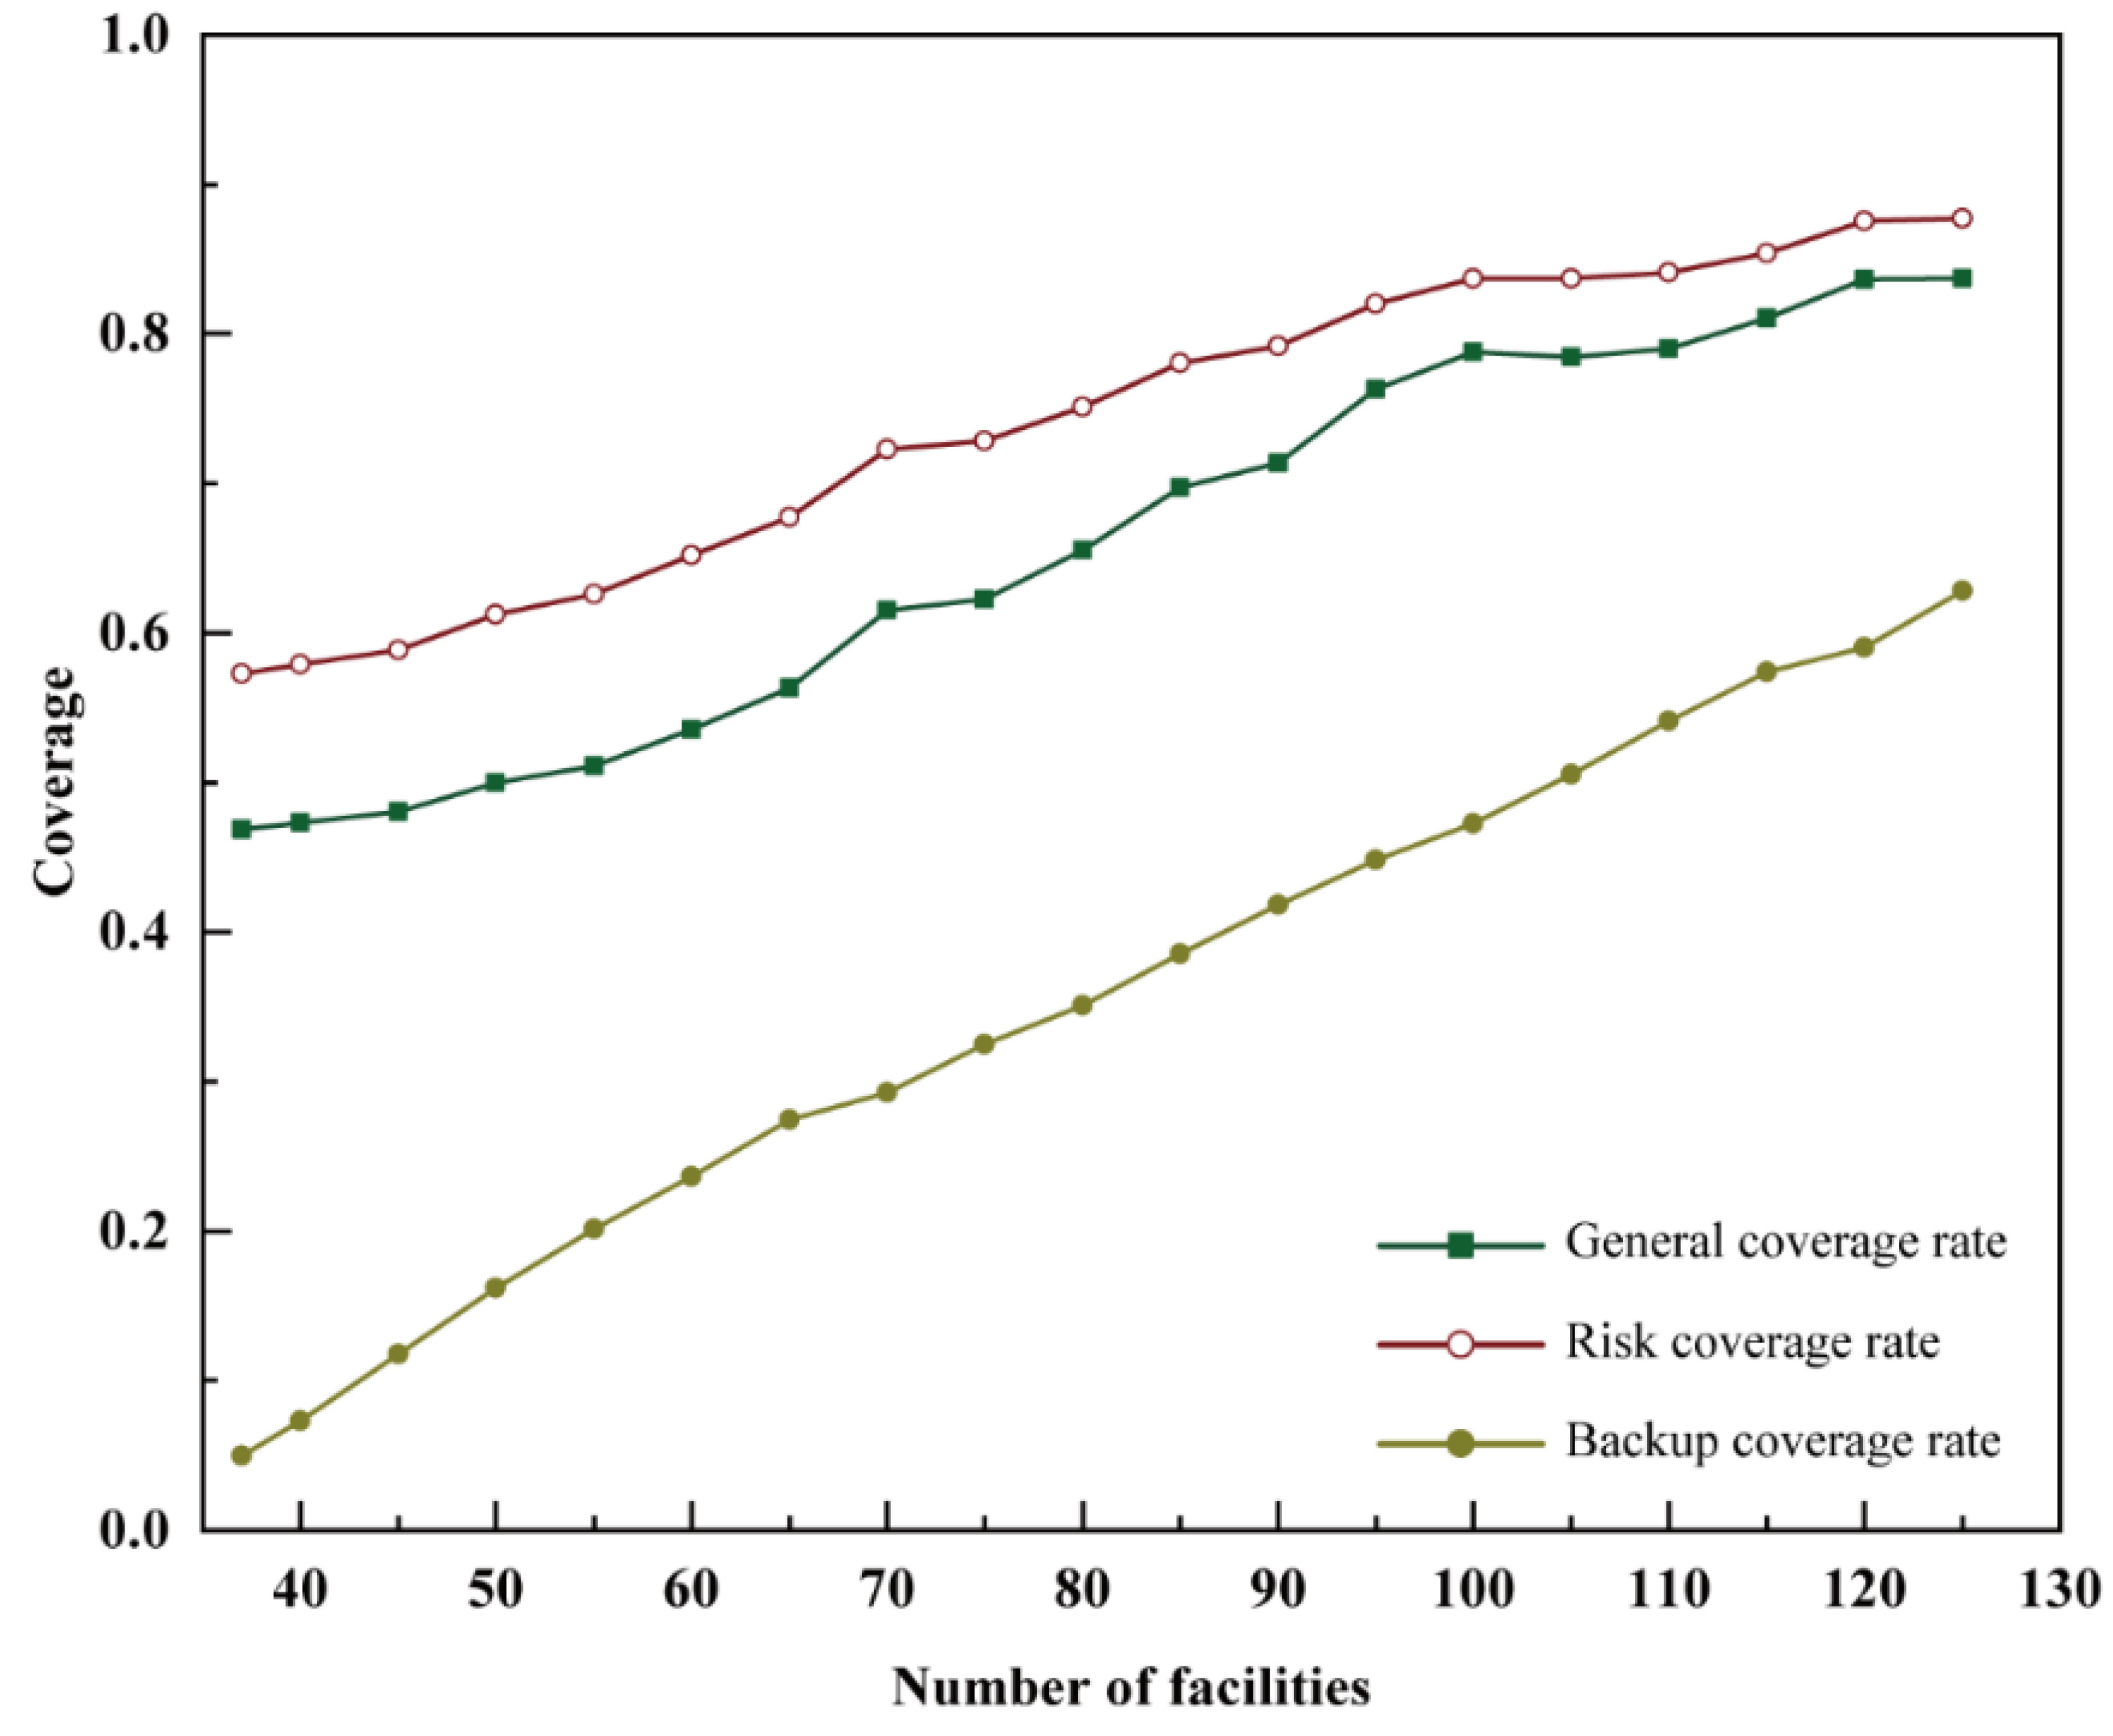
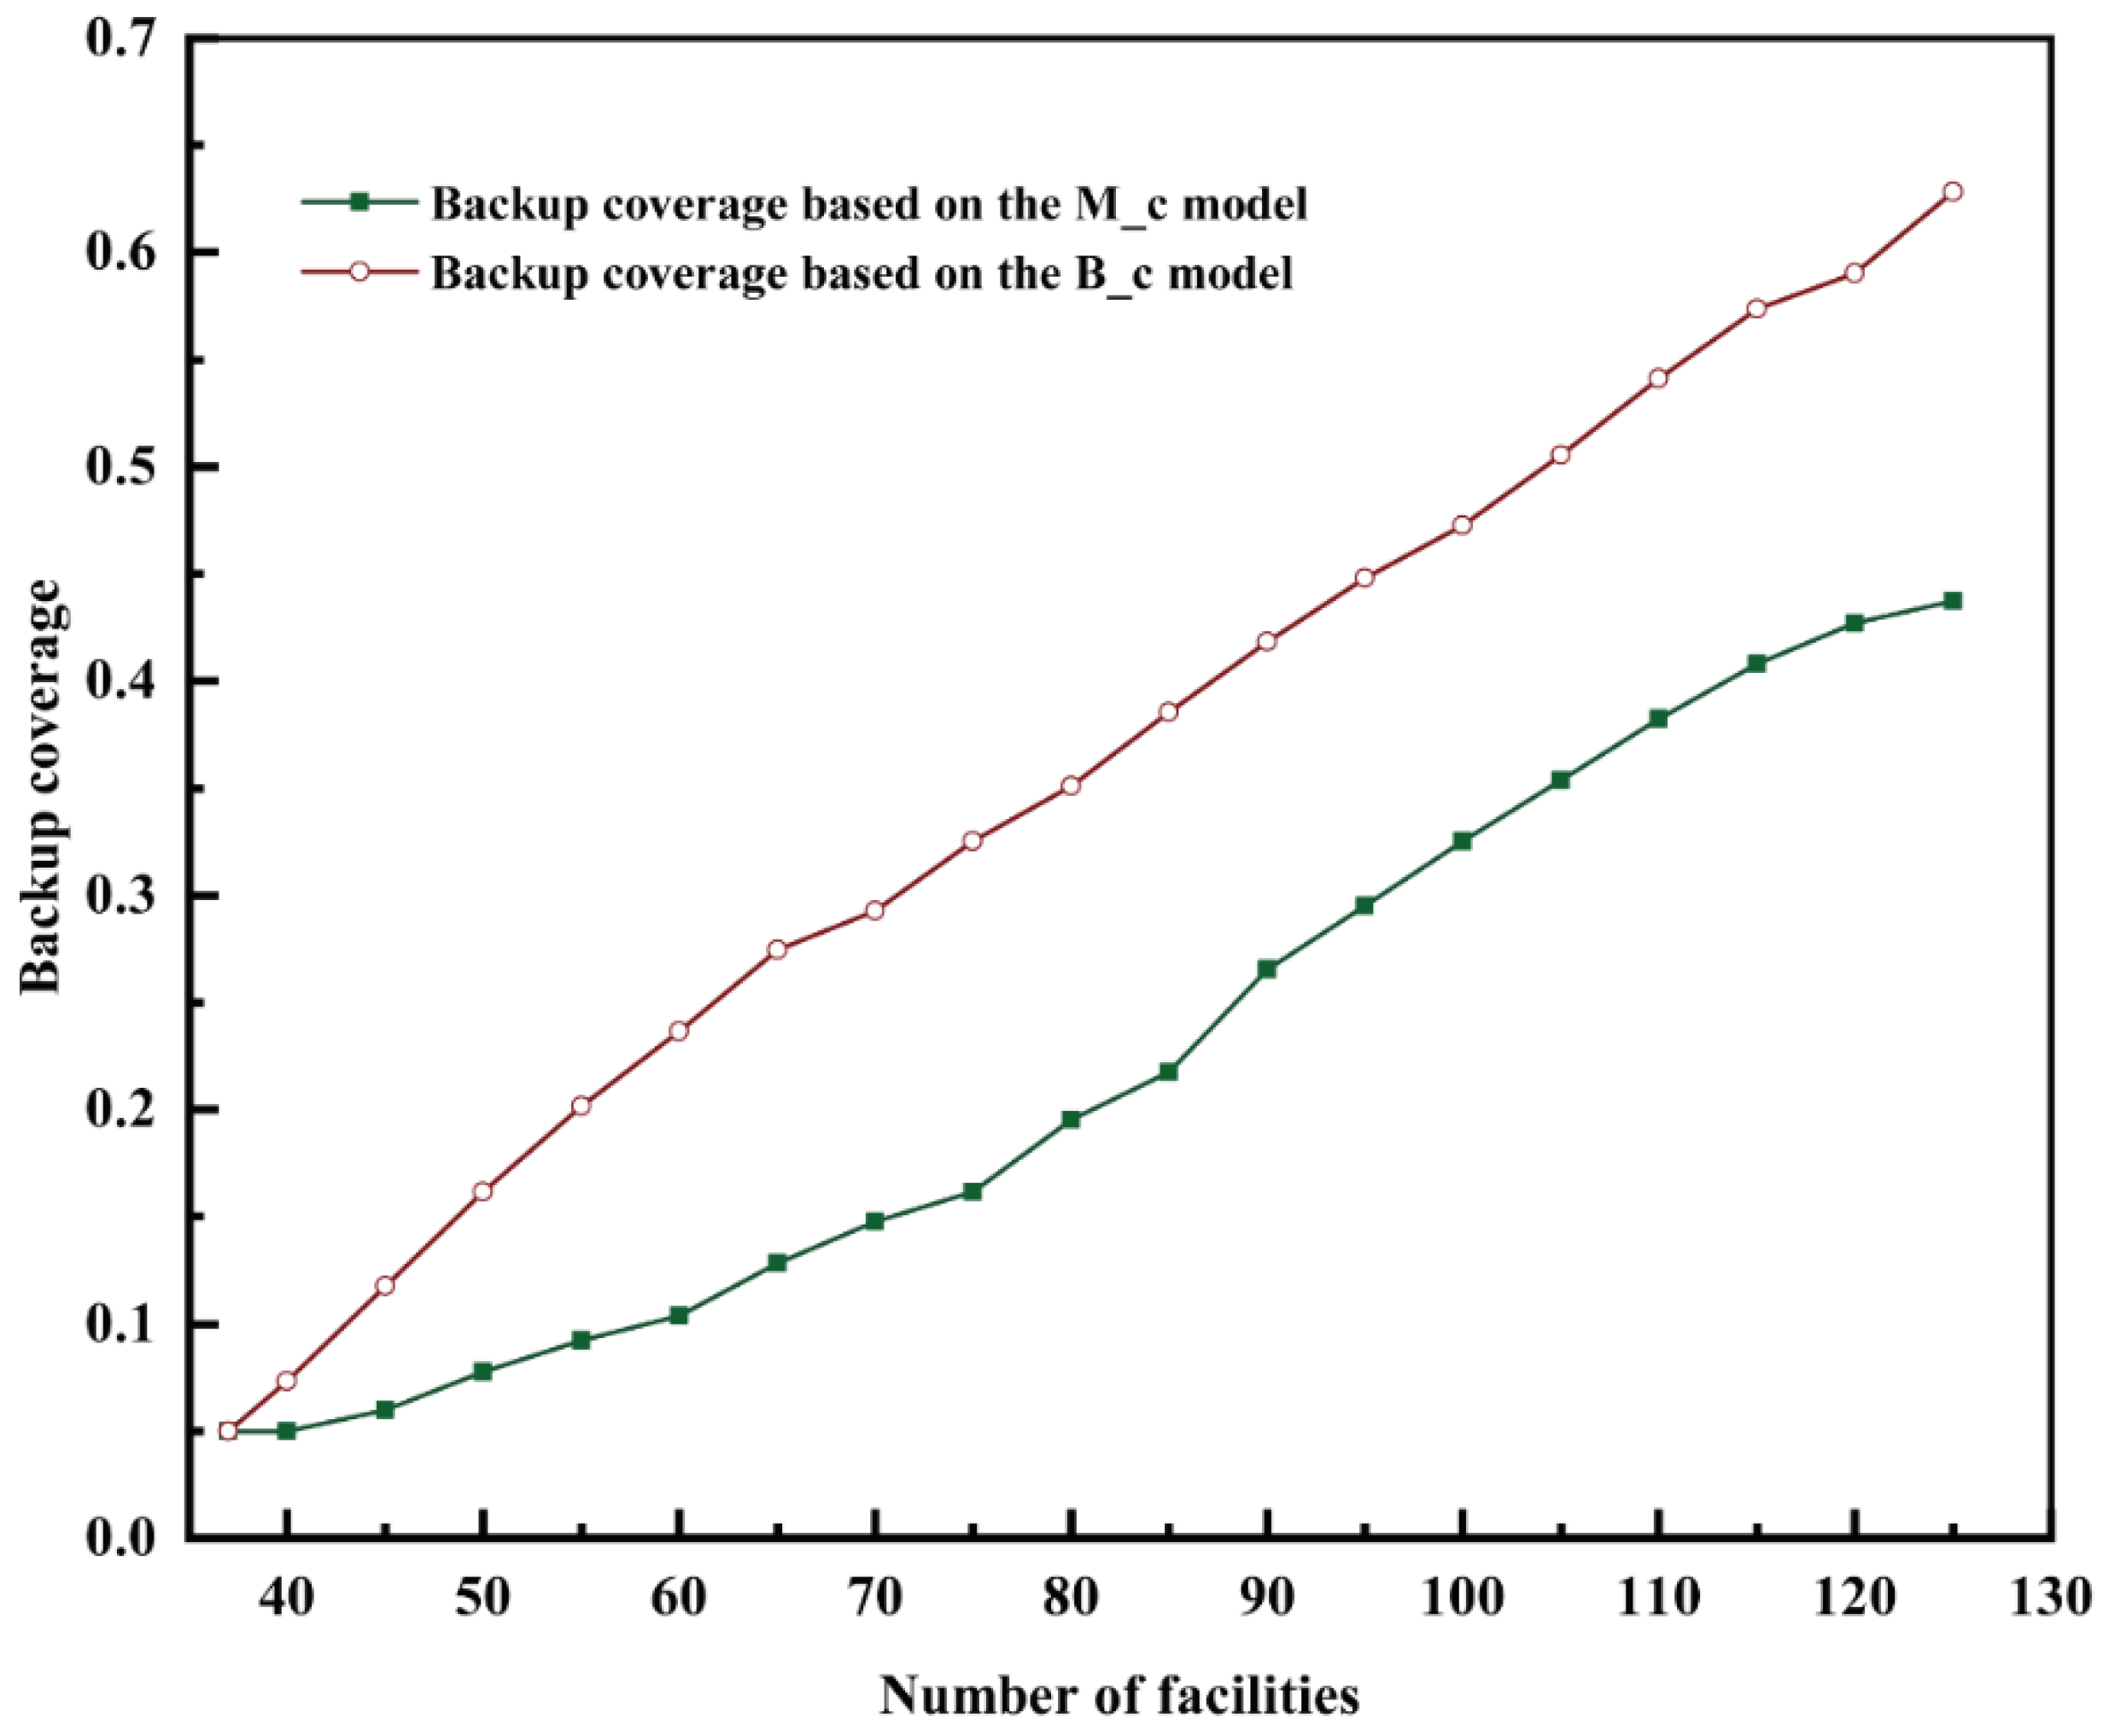
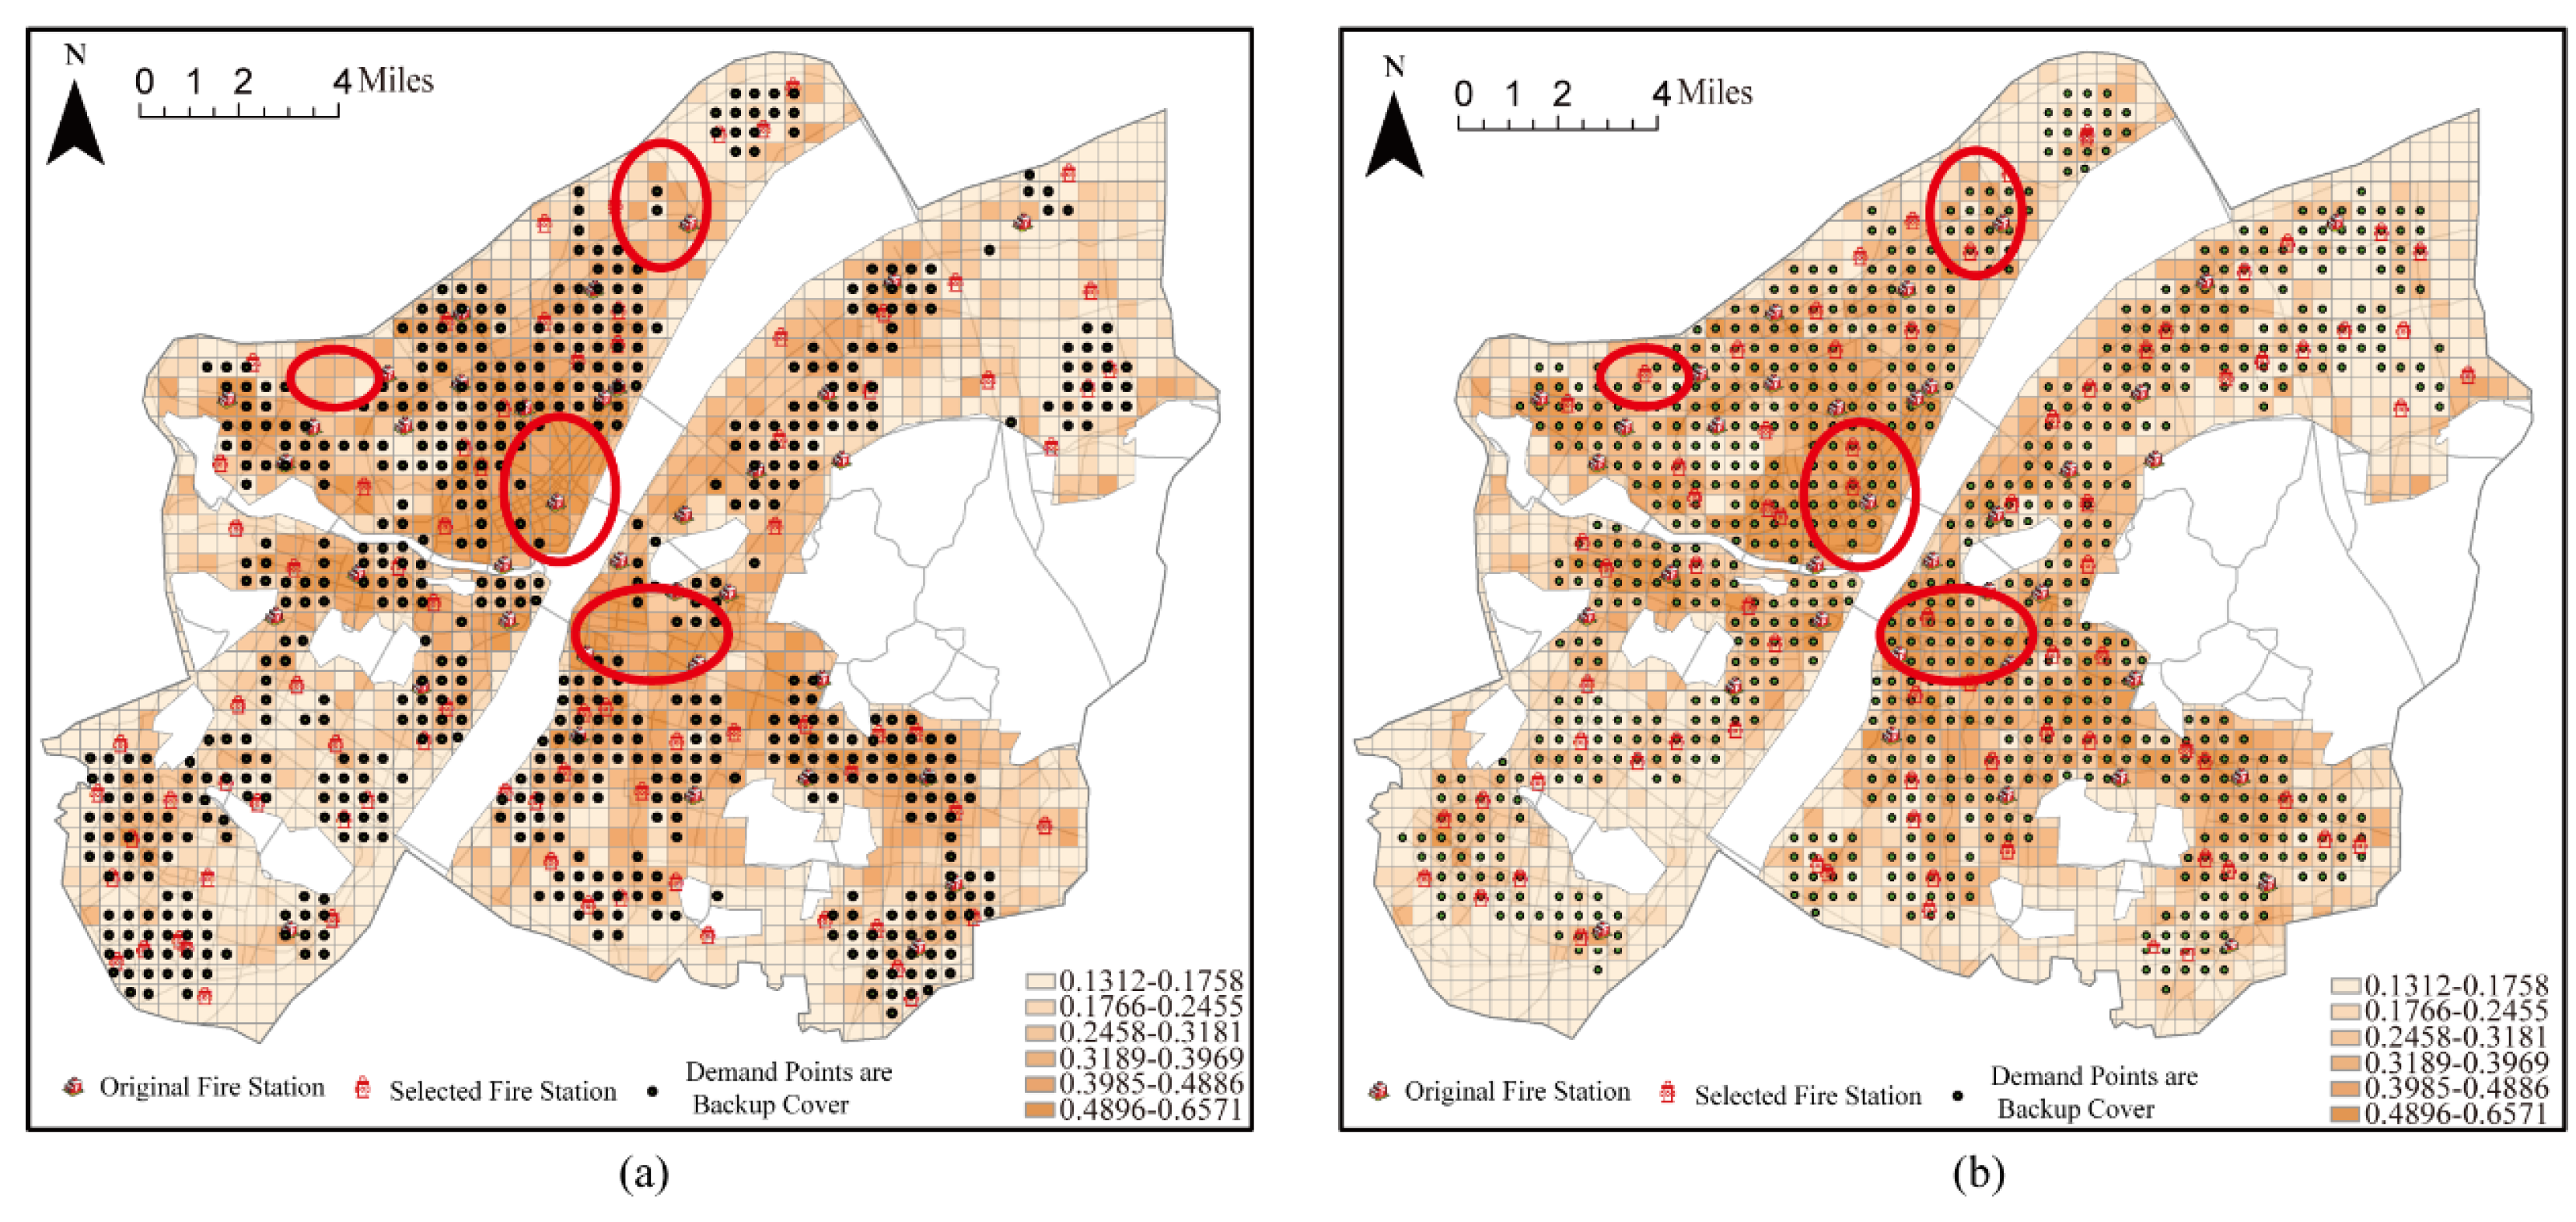
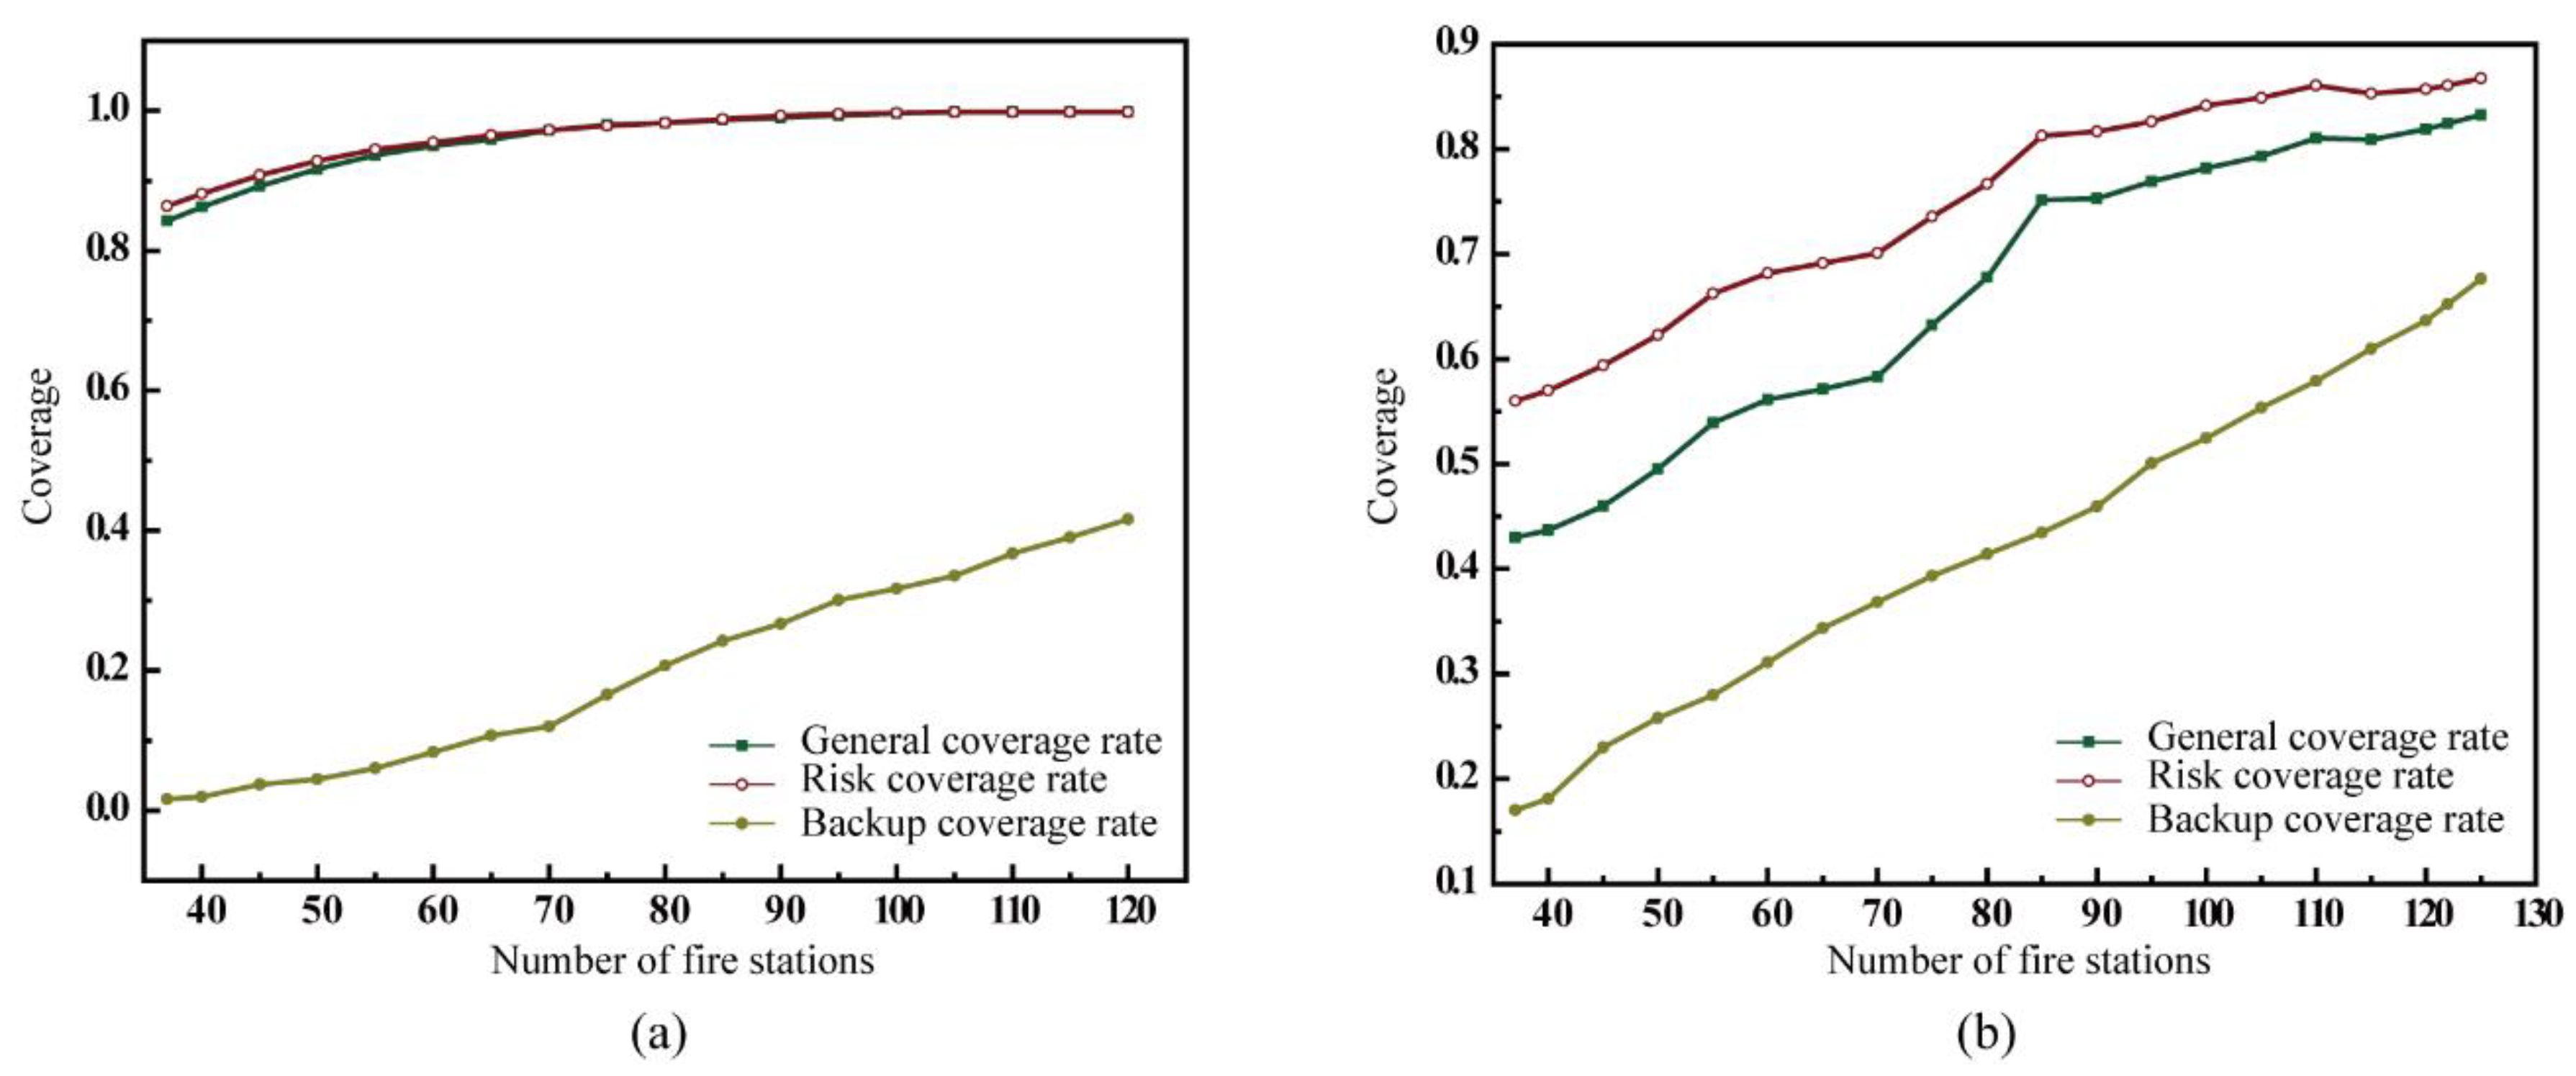
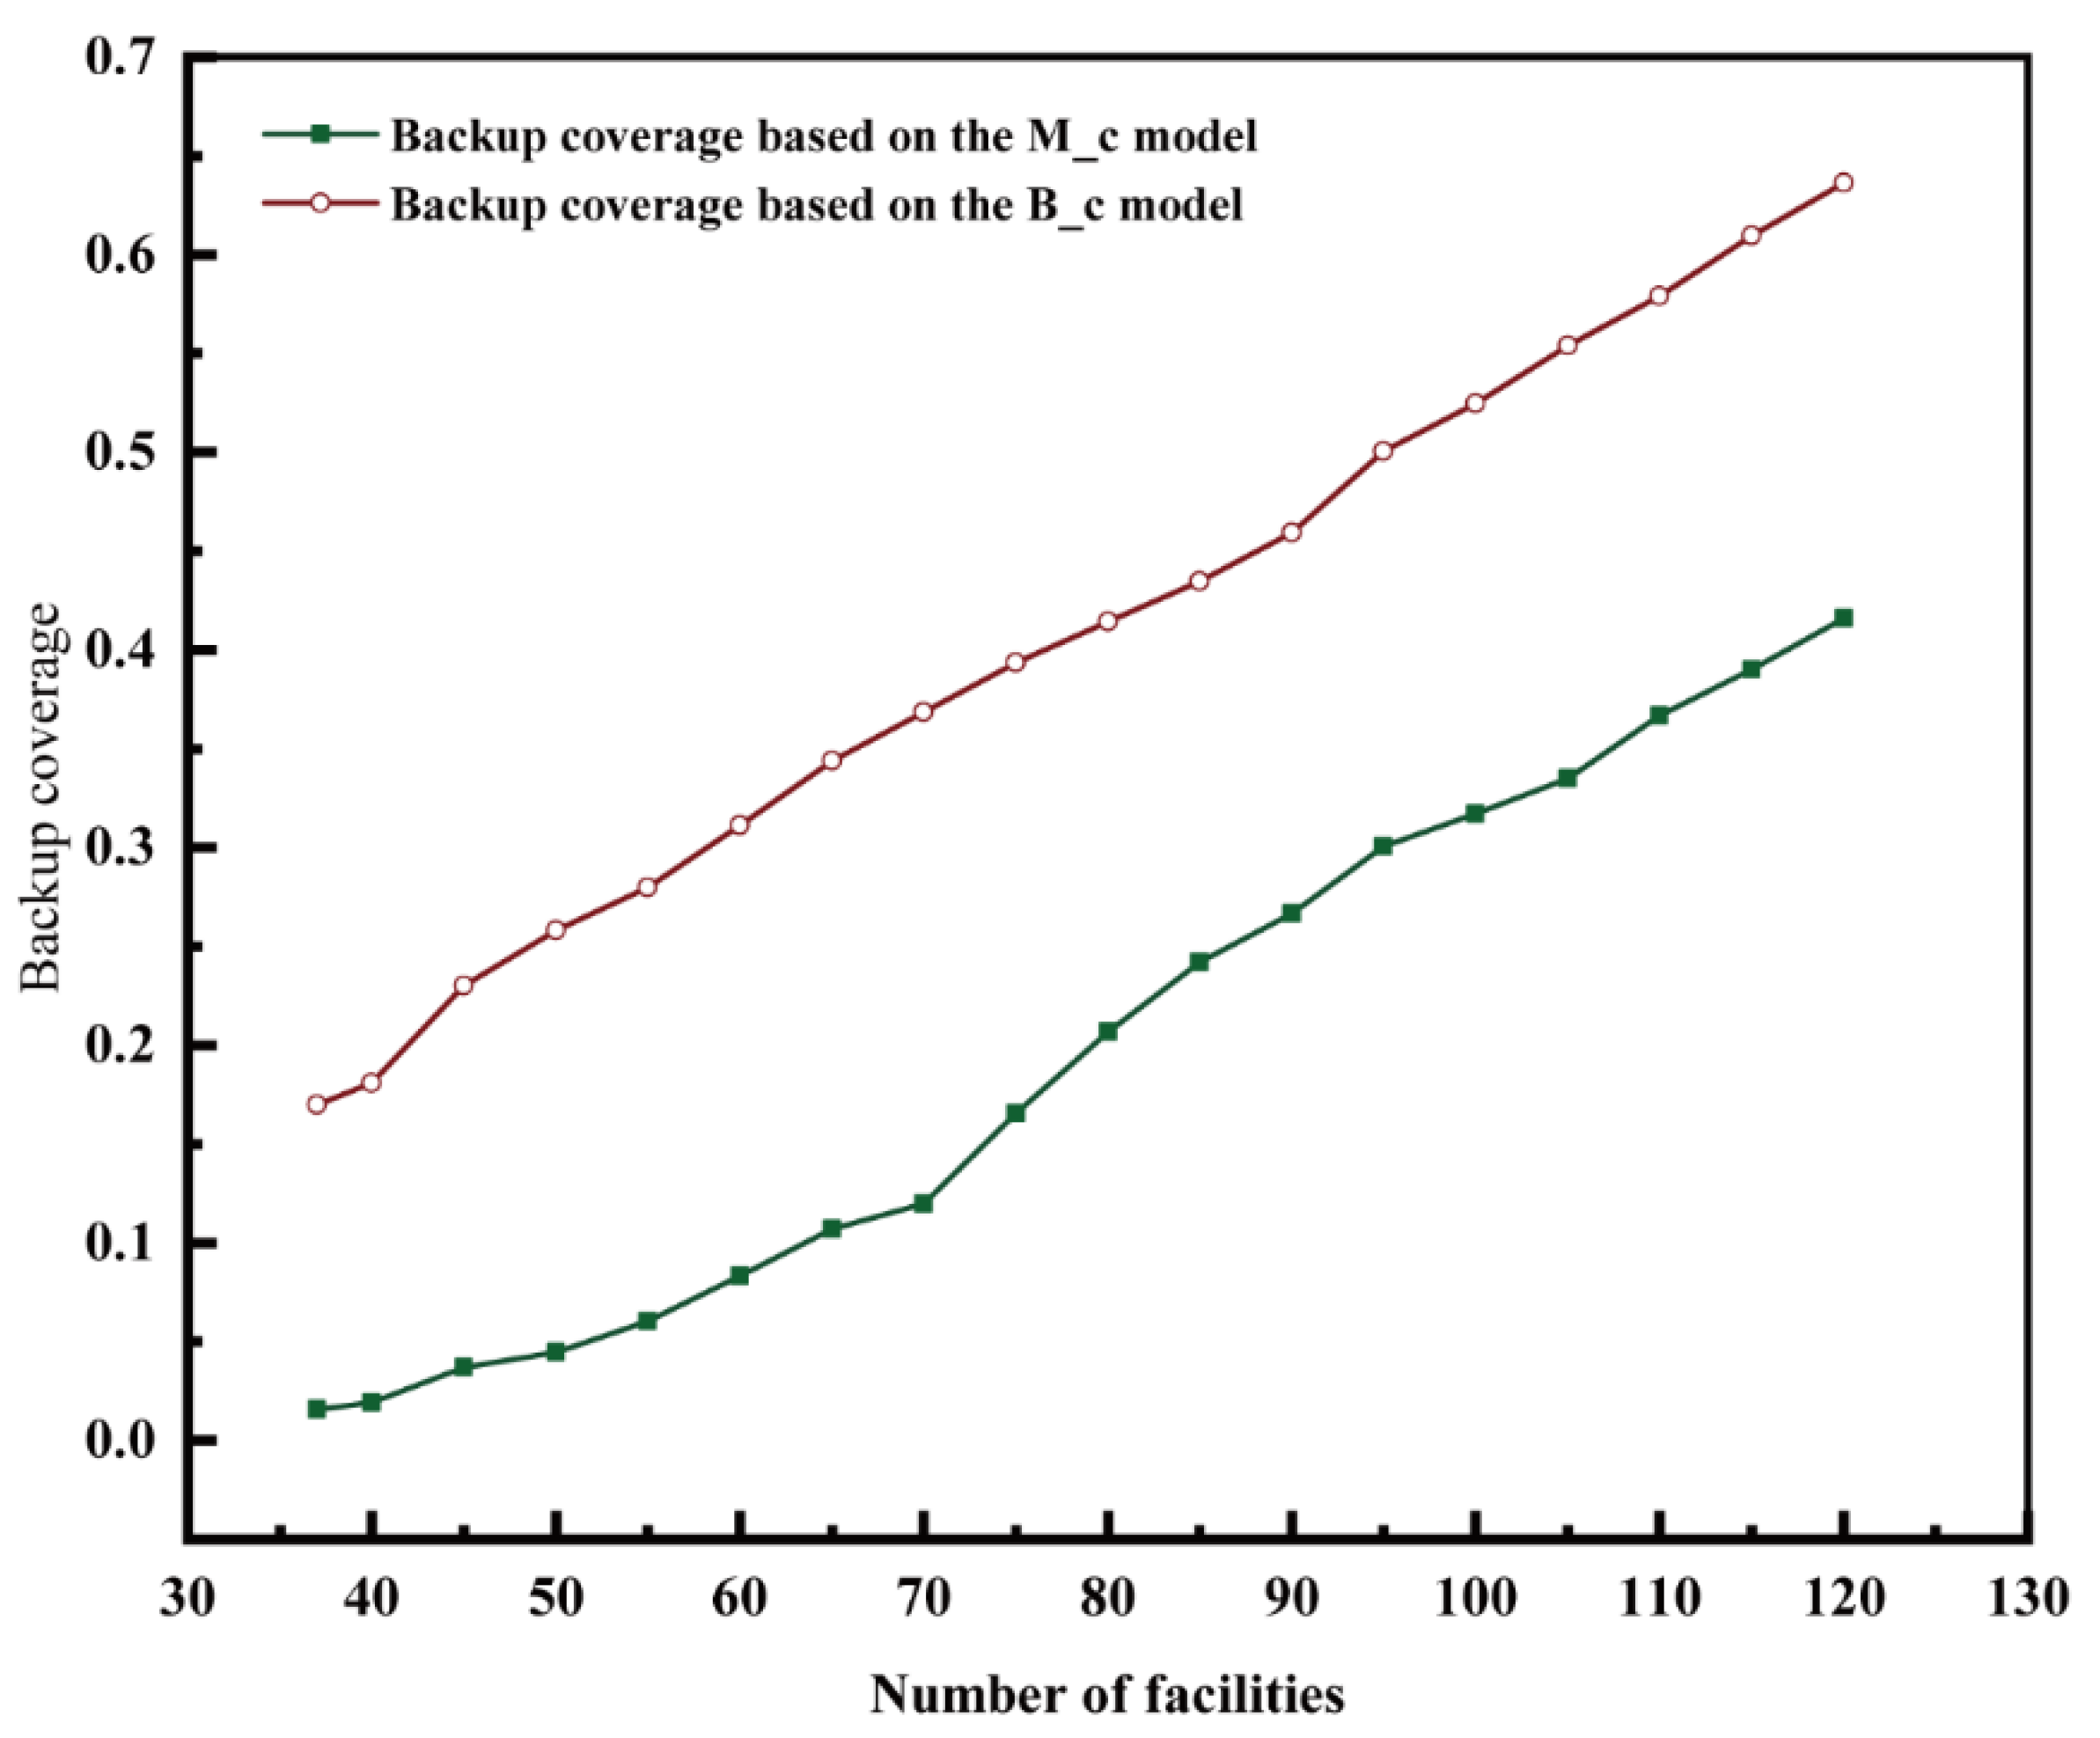
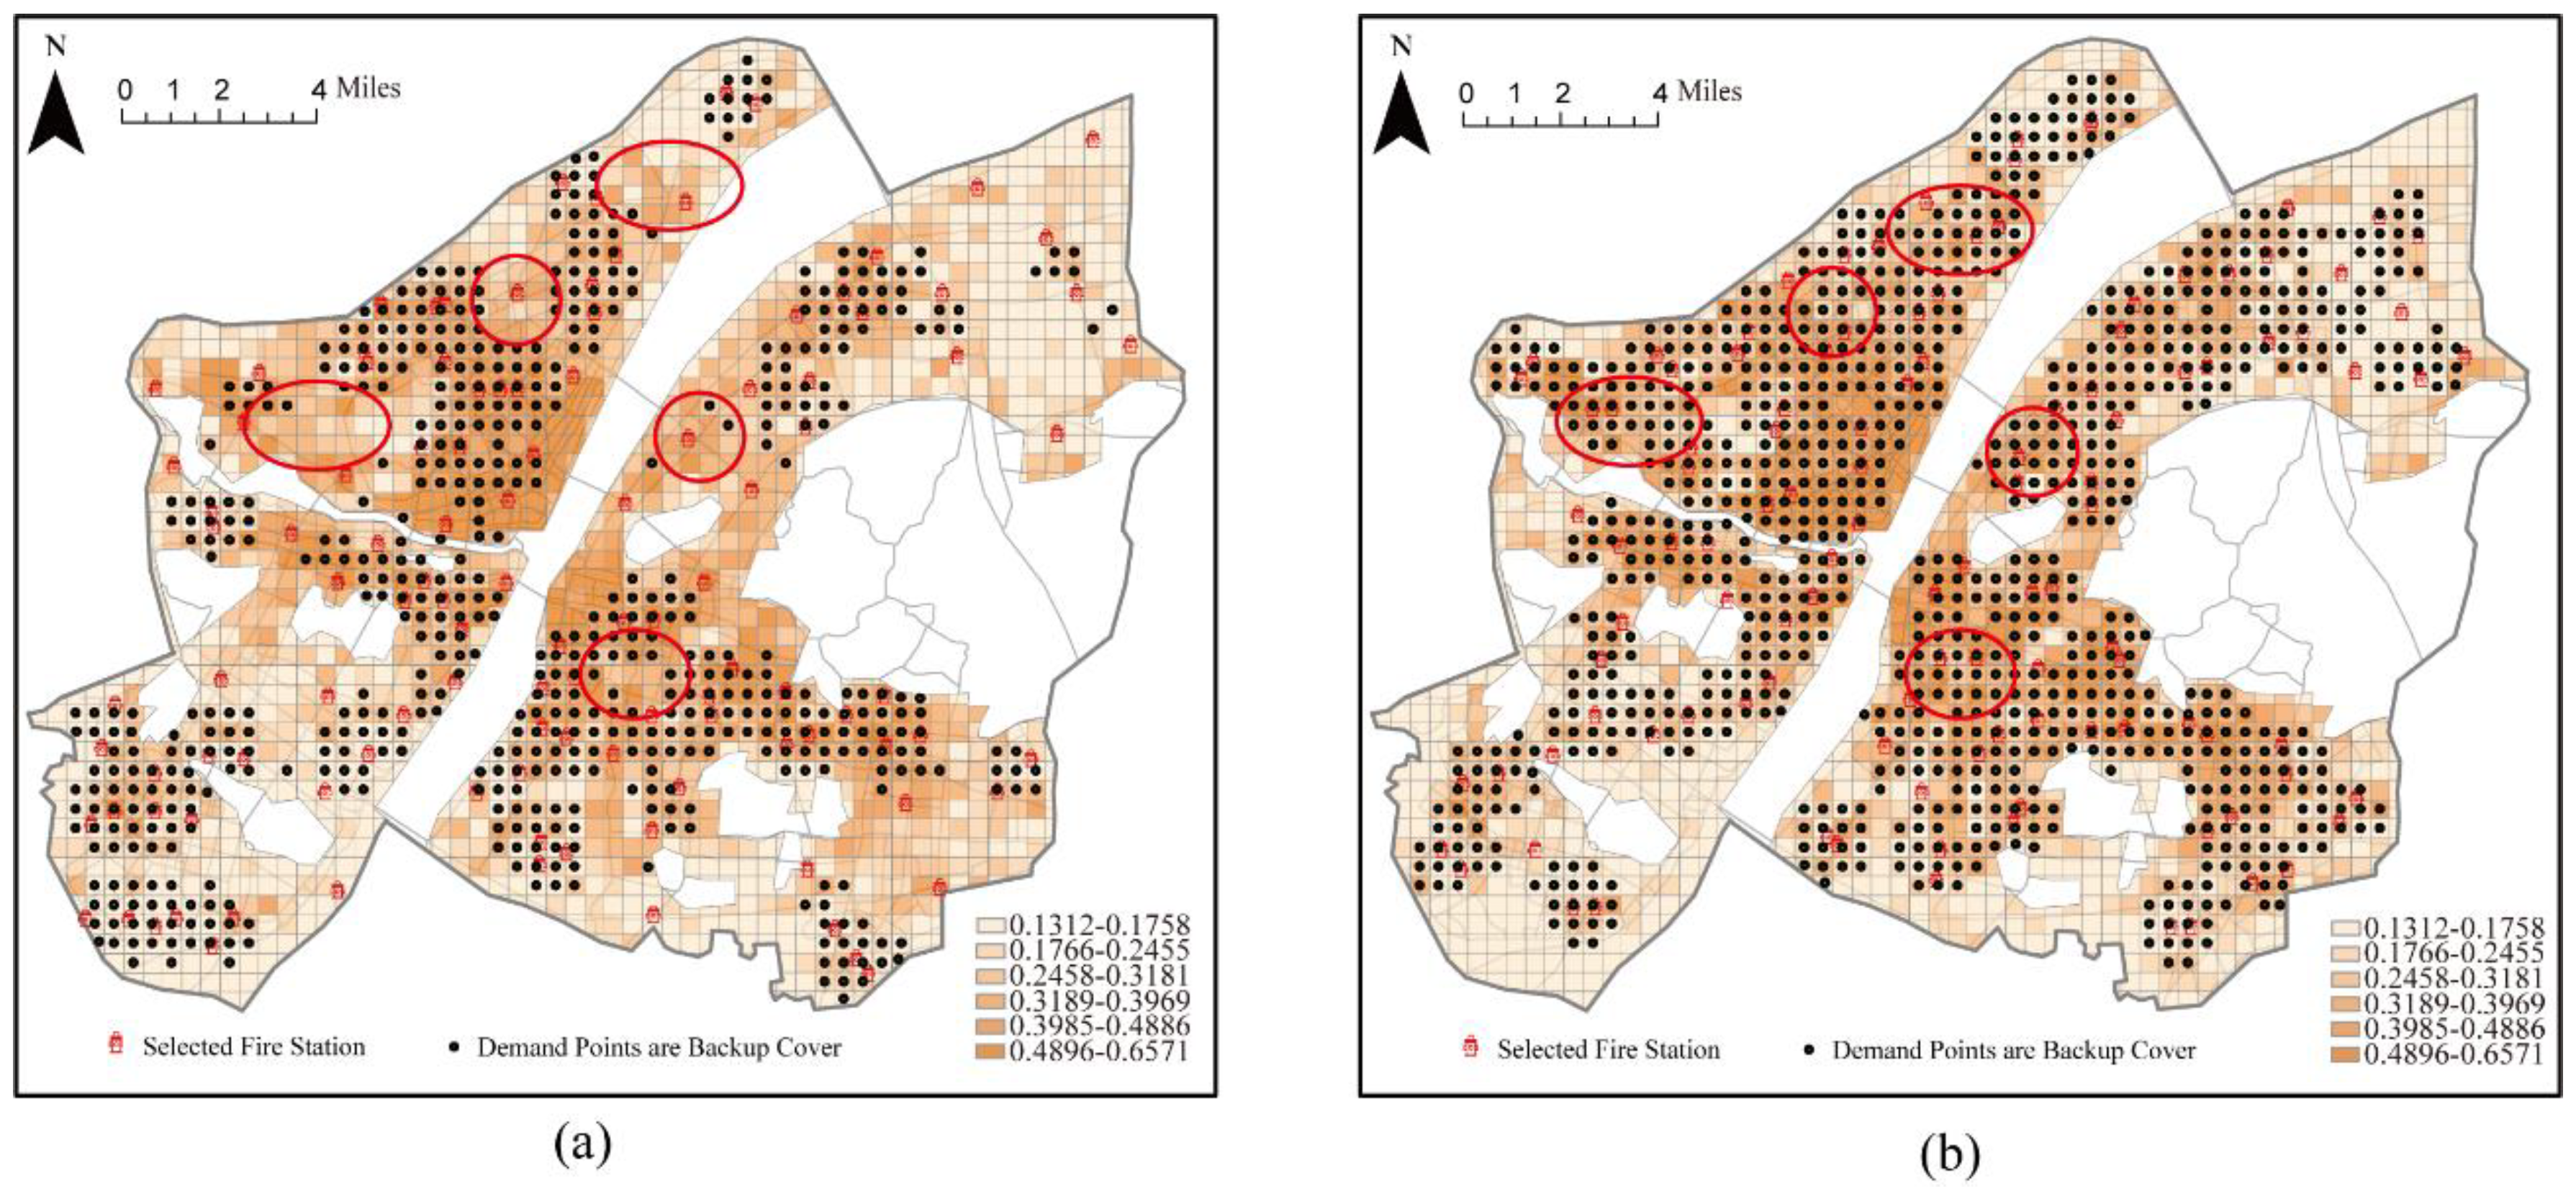
3.4. Selection and Coverage of Fire Stations Based on Backup Coverage
4. Discussion
4.1. Fire Station Optimization Considering Existing Stations
4.2. Fire Station Optimization without Considering Existing Stations
5. Conclusions
Author Contributions
Funding
Institutional Review Board Statement
Informed Consent Statement
Data Availability Statement
Conflicts of Interest
References
- Nyimbili, P.H.; Erden, T. GIS-based fuzzy multi-criteria approach for optimal site selection of fire stations in Istanbul, Turkey. Socio-Econ. Plan. Sci. 2020, 71, 100860. [Google Scholar] [CrossRef]
- Yu, W.; Guan, M.; Chen, Y. Fire stations siting with multiple objectives and geospatial big data. Earth Sci. Inform. 2021, 14, 141–160. [Google Scholar] [CrossRef]
- Toregas, C.; Swain, R.; ReVelle, C.; Bergman, L. The location of emergency service facilities. Oper. Res. 1971, 19, 1363–1373. [Google Scholar] [CrossRef]
- Church, R.; ReVelle, C. The maximal covering location problem. In Papers of the Regional Science Association; Springer: Berlin/Heidelberg, Germany, 1974. [Google Scholar]
- Zhang, J.; Liu, M. Application of the general maximum covering model to the locality choice of fire stations. J. Saf. Environ. 2009, 9, 169–172. [Google Scholar]
- Lu, H.; Yuan, H.; Cheng, L. Continuous layout optimization of urban fire station. J. Comput. Appl. 2012, 32, 852–854+860. [Google Scholar] [CrossRef]
- Murray, A.T. Optimising the spatial location of urban fire stations. Fire Saf. J. 2013, 62, 64–71. [Google Scholar] [CrossRef]
- Tzeng, G.; Lin, J. Using backup coverage and TOPSIS fuzzy approach to emergency facilities layout in new development planning area. In Proceedings of the 1996 Asian Fuzzy Systems Symposium, Kenting, Taiwan, 1–14 December 1996. [Google Scholar]
- Liu, L.; Chen, C. A GIS and set covering method for division of responsibility area of fireststions and layout optimization. Sci. Surv. Mapp. 2018, 43, 46–51. [Google Scholar] [CrossRef]
- Pirkul, H.S.D. The capacitated maximal covering location problem with backup service. Ann. Oper. Res. 1989, 18, 141–154. [Google Scholar] [CrossRef]
- Li, X.; Xu, G.; Chen, E.; Zong, Y. Learning recency based comparative choice towards point-of-interest recommendation. Expert Syst. Appl. 2015, 42, 4274–4283. [Google Scholar] [CrossRef]
- Martí, P.; Serrano-Estrada, L.; Nolasco-Cirugeda, A. Social media data: Challenges, opportunities and limitations in urban studies. Comput. Environ. Urban Syst. 2019, 74, 161–174. [Google Scholar] [CrossRef]
- Milias, V.; Psyllidis, A. Assessing the influence of point-of-interest features on the classification of place categories. Comput. Environ. Urban Syst. 2021, 86, 101597. [Google Scholar] [CrossRef]
- Xiong, X.; Qiao, S.; Li, Y.; Han, N.; Yuan, G.; Zhang, Y. A point-of-interest suggestion algorithm in Multi-source geo-social networks. Eng. Appl. Artif. Intell. 2020, 88, 103374. [Google Scholar] [CrossRef]
- Yao, Y.; Li, X.; Liu, X.; Liu, P.; Liang, Z.; Zhang, J.; Mai, K. Sensing spatial distribution of urban land use by integrating points-of-interest and Google Word2Vec model. Int. J. Geogr. Inf. Sci. 2017, 31, 825–848. [Google Scholar] [CrossRef]
- Zhu, D.; Wang, N.; Wu, L.; Liu, Y. Street as a big geo-data assembly and analysis unit in urban studies: A case study using Beijing taxi data. Appl. Geogr. 2017, 86, 152–164. [Google Scholar] [CrossRef]
- Malcolm, S.A.; ReVelle, C. Models for preserving species diversity with backup coverage. Environ. Model. Assess. 2005, 10, 99–105. [Google Scholar] [CrossRef]
- McKenzie, G.; Janowicz, K. Where is also about time: A location-distortion model to improve reverse geocoding using behavior-driven temporal semantic signatures. Comput. Environ. Urban Syst. 2015, 54, 1–13. [Google Scholar] [CrossRef]
- Qi, W.H.; Yang, H.; Wang, S.L. Study on Evaluation and Planning of Urban Parks Based on Baidu POI Data. Chin. Landsc. Archit. 2018, 34, 32–37. [Google Scholar]
- Li, W.; Zhang, M.; Duan, J. The research of Nanjing urban spatial pattern based on POI data. World Reg. Stud. 2020, 29, 317–326. [Google Scholar]
- Wang, W.; Xu, Z.; Sun, D.; Lan, T. Spatial Optimization of Mega-City Fire Stations Based on Multi-Source Geospatial Data: A Case Study in Beijing. ISPRS Int. J. Geo-Inf. 2021, 10, 282. [Google Scholar] [CrossRef]
- Li, D.; Liu, K. Urban fire Risk Assessment based on AHP and GIS: A case study of Karamay City. China Saf. Sci. J. 2013, 23, 68–73. [Google Scholar]
- Zhu, J.; Sun, Y.; Chen, L.; Zhou, W.; Meng, Y. A Spatial Clustering Method Based on Uneven Distribution of Non-spatial Attributes Identifying City Commercial Center. Geomat. Inf. Sci. Wuhan Univ. 2017, 42, 1696–1702. [Google Scholar]
- Xu, Z.; Zhou, L.; Lan, T.; Wang, Z.H.; Sun, L.; Wu, R.W. Spatial optimization of mega-city fire station distribution based on Point of Interest data: A case study within the 5th Ring Road in Beijing. Prog. Geogr. 2018, 37, 535–546. [Google Scholar]
- Zhu, M.; Luo, J.; Yu, W.; Zhou, Y.; Zhou, L. Urban Fire Risk Evaluation and Location Optimization of Fire Station Based on the POI: A Case Study of Main Urban Region in Wuhan. Areal Res. Dev. 2018, 37, 86–91. [Google Scholar]
- Wu, Q.; Zhang, J.; Tong, Z.; Liu, X. Integrating Multi-Criteria Decision Analysis for a GIS-based Urban Firehouse. In Proceedings of the 4th Annual Meeting of Risk Analysis Council of China Association for Disaster Prevention, Changchun, China, 16–17 August 2010. [Google Scholar]
- Jing, X. Optimization model of city fire station sites based on entropy weight TOPSIS. Fire Sci. Technol. 2010, 29, 443–447. [Google Scholar]
- Li, Q. Oil and Gas Platforms Detection and Oil and Gas Resources Security Situation Evaluation Based on Multi-Source Data in the South China Sea. Master’s Thesis, Lanzhou Jiaotong University, Lanzhou, China, 2016. [Google Scholar]
- Chen, S.; Cheng, Z.; Loh, D.K. Islands valuation of spatial appraisal based on SAVEE method With the Nansha Islands as an examole. Mar. Environ. Sci. 2012, 31, 107–110. [Google Scholar]
- Murray, A.T.; Tong, D. Coverage optimization in continuous space facility siting. Int. J. Geogr. Inf. Sci. 2007, 21, 757–776. [Google Scholar] [CrossRef]


| Fire Risk Factor | The POI Types |
|---|---|
| flammable and explosive | gas stations, LPG stations, and factories |
| vulnerable population | general hospitals and school |
| crowded | shopping malls, supermarkets, entertainment venues, subways, and train stations |
| key protection | government offices, scenic spots, scientific premises, libraries, science and technology museums, archives, art galleries, and museums |
| general fire protection | residential areas |
| emergency shelter | emergency shelters |
| Serial | Evaluation Factor | Positive Factor | Negative Factor | Weight |
|---|---|---|---|---|
| 1 | flammable and explosive | √ | 0.6 | |
| 2 | population vulnerable | √ | 0.4 | |
| 3 | crowded population | √ | 0.4 | |
| 4 | key protection | √ | 0.3 | |
| 5 | general fire | √ | 0.2 | |
| 6 | emergency risk aversion | √ | 0.1 |
Disclaimer/Publisher’s Note: The statements, opinions and data contained in all publications are solely those of the individual author(s) and contributor(s) and not of MDPI and/or the editor(s). MDPI and/or the editor(s) disclaim responsibility for any injury to people or property resulting from any ideas, methods, instructions or products referred to in the content. |
© 2022 by the authors. Licensee MDPI, Basel, Switzerland. This article is an open access article distributed under the terms and conditions of the Creative Commons Attribution (CC BY) license (https://creativecommons.org/licenses/by/4.0/).
Share and Cite
Tao, L.; Cui, Y.; Xu, Y.; Chen, Z.; Guo, H.; Huang, B.; Xie, Z. Location Optimization of Urban Fire Stations Considering the Backup Coverage. Int. J. Environ. Res. Public Health 2023, 20, 627. https://doi.org/10.3390/ijerph20010627
Tao L, Cui Y, Xu Y, Chen Z, Guo H, Huang B, Xie Z. Location Optimization of Urban Fire Stations Considering the Backup Coverage. International Journal of Environmental Research and Public Health. 2023; 20(1):627. https://doi.org/10.3390/ijerph20010627
Chicago/Turabian StyleTao, Liufeng, Yuqiong Cui, Yongyang Xu, Zhanlong Chen, Han Guo, Bo Huang, and Zhong Xie. 2023. "Location Optimization of Urban Fire Stations Considering the Backup Coverage" International Journal of Environmental Research and Public Health 20, no. 1: 627. https://doi.org/10.3390/ijerph20010627