
Differences in Physical Characteristics of the Lower Extremity and Running Biomechanics Between Different Age Groups

Abstract
:1. Introduction
2. Materials and Methods
2.1. Participants
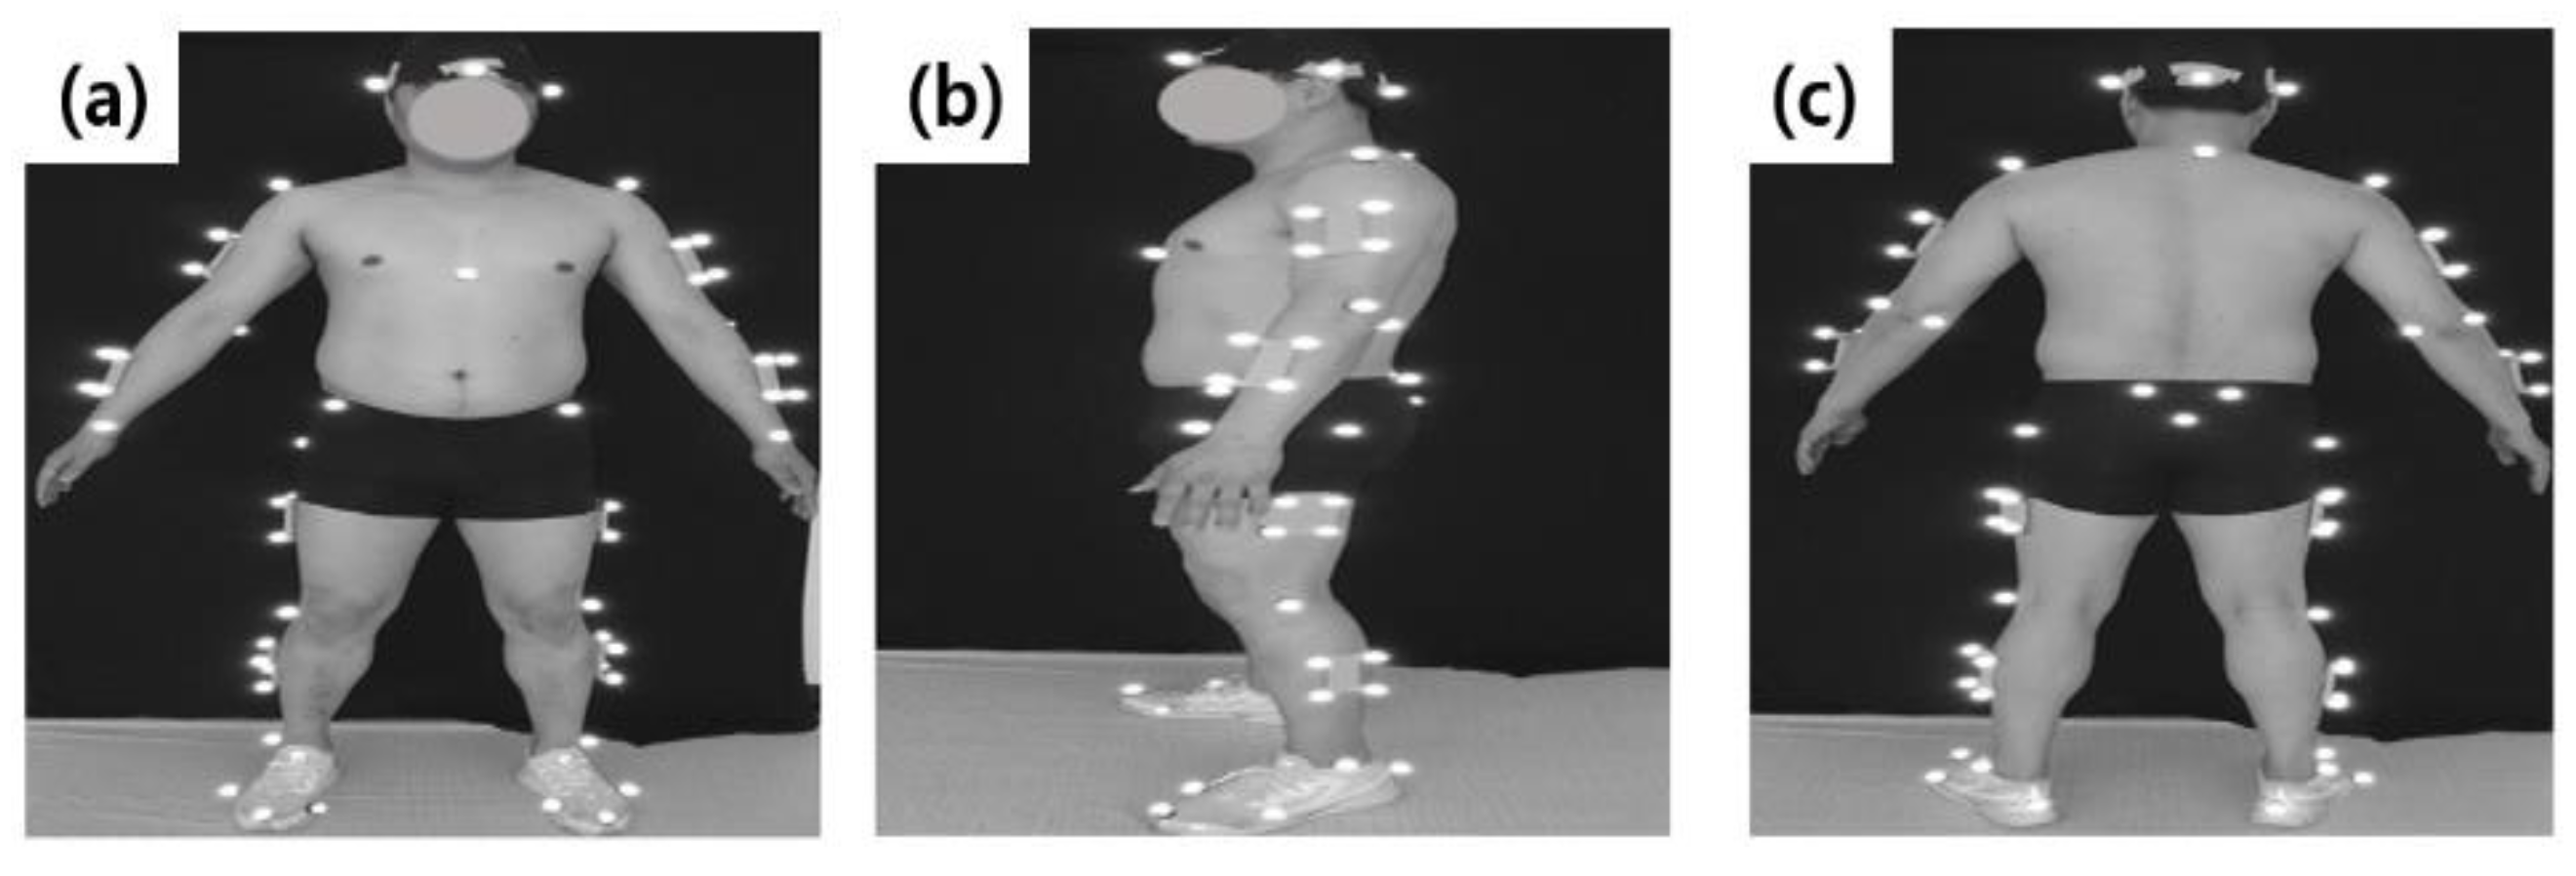
2.2. Procedure
2.3. Data Processing
2.4. Statistical Processing
3. Results
3.1. Correlations between Age and Physical Characteristics (BMD) and Peak Torque
3.2. Correlations between Age and Running Characteristics and Impact
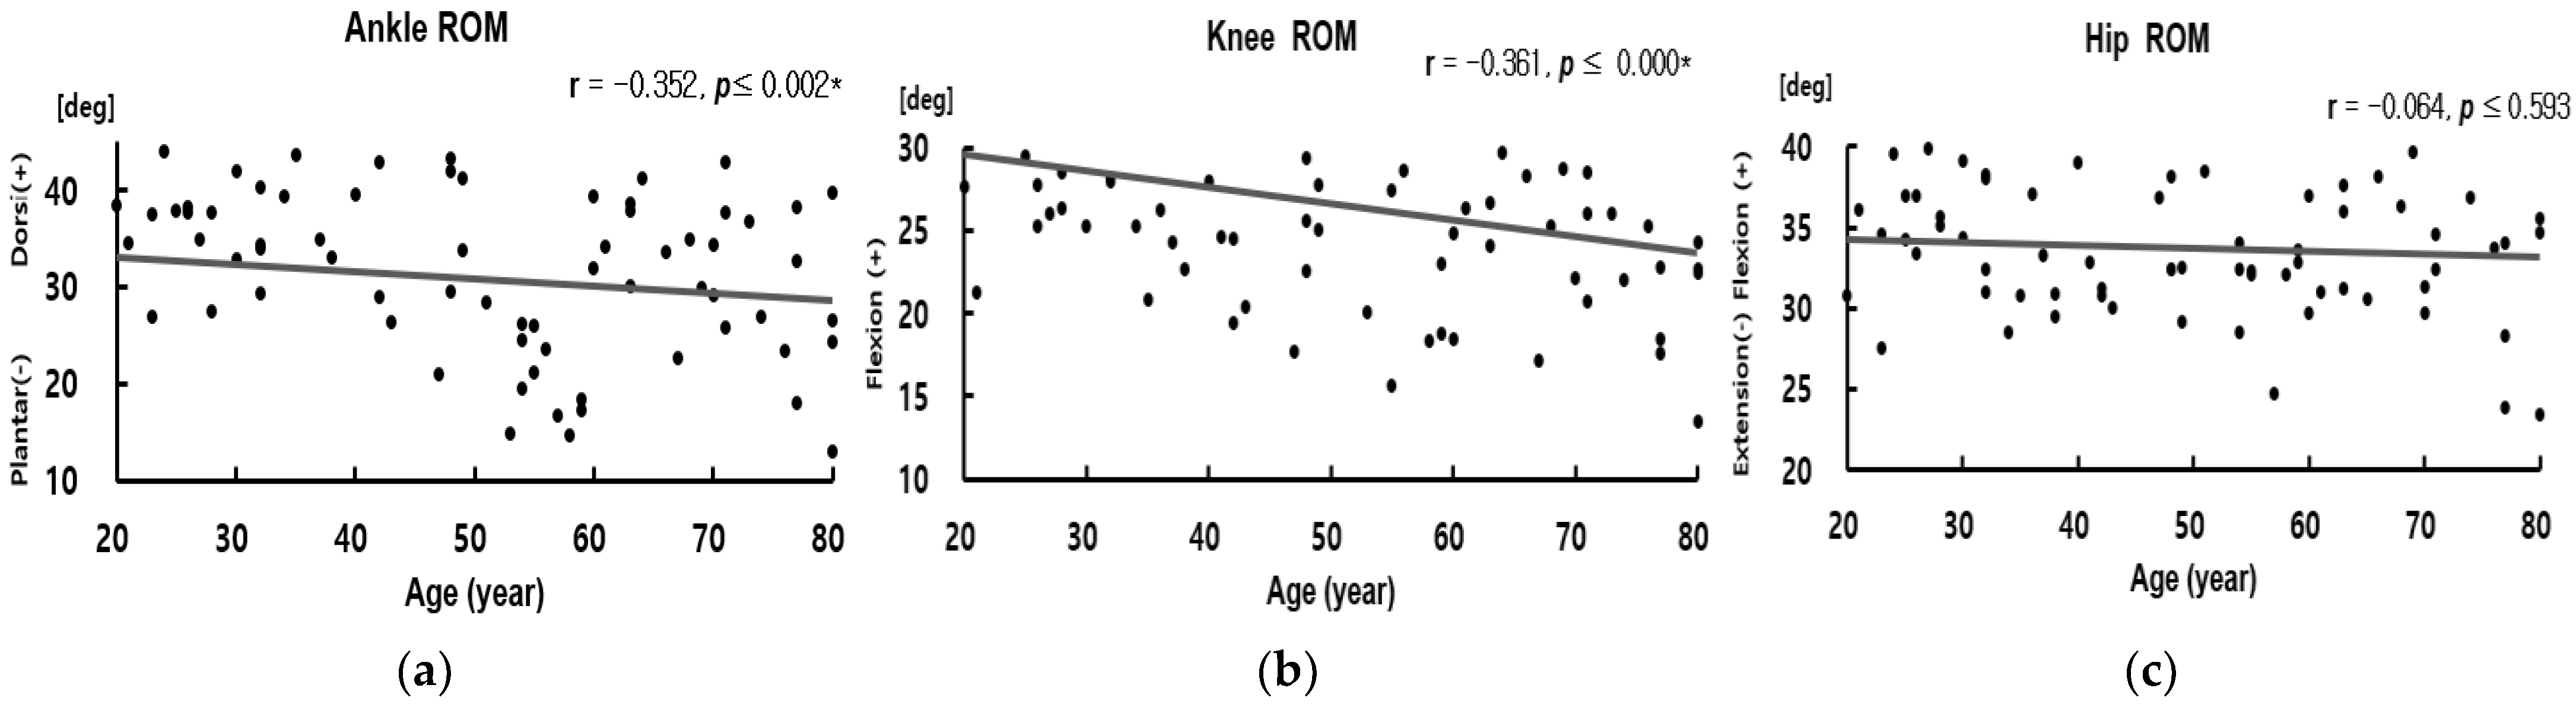
3.3. Correlations between Age and Joint Kinetics of the Lower Extremity Joint
4. Discussion
5. Conclusions
Author Contributions
Funding
Institutional Review Board Statement
Informed Consent Statement
Data Availability Statement
Conflicts of Interest
Appendix A


References
- Waneen, W.S.; Karen, L.F.; Priscilla, G.M. Physical Dimensions of Aging; Human Kinetics: New York, NY, USA, 2005. [Google Scholar]
- Stathokostas, L.; Jacob-Johnson, S.; Petrella, R.J.; Paterson, D.H. Longitudinal changes in aerobic power in older men and women. J. Appl. Physiol. 2004, 97, 781–789. [Google Scholar] [CrossRef] [PubMed]
- Sui, X.; LaMonte, M.J.; Laditka, J.N.; Hardin, J.W.; Chase, N.; Hooker, S.P.; Blair, S.N. Cardiorespiratory fitness and adiposity as mortality predictors in older adults. JAMA 2007, 298, 2507–2516. [Google Scholar] [CrossRef] [Green Version]
- Kim, Y.R.; Lee, T.Y.; Lee, J.H. Bone density change and bone loss rate by region according to age in Korean men. J. Korean Soc. Ind.-Acad. Technol. 2014, 15, 3781–3788. [Google Scholar] [CrossRef]
- Scott, D.; Jones, G. Impact of nutrition on muscle mass, strength, and performance in older adults. Osteoporos. Int. 2014, 25, 791–792. [Google Scholar] [CrossRef] [PubMed]
- Tinetti, M.E.; Speechley, M.; Ginter, S.F. Risk factors for falls among elderly persons living in the community. NE J. Med. 1988, 319, 1701–1707. [Google Scholar] [CrossRef] [PubMed]
- Camicioli, R.; Panzer, V.P.; Kaye, J. Balance in the healthy elderly: Posturography and clinical assessment. Arch. Neurol. 1997, 54, 976–981. [Google Scholar] [CrossRef] [PubMed]
- Prohaska, T.R.; Leventhal, E.A.; Leventhal, H.; Keller, M.L. Health practices and illness cognition in young, middle aged, and elderly adults. J. Gerontol. 1985, 40, 569–578. [Google Scholar] [CrossRef] [PubMed]
- Spirduso, W.W.; Clifford, P. Replication of age and physical activity effects on reaction and movement time. J. Gerontol. 1978, 33, 26–30. [Google Scholar] [CrossRef] [PubMed]
- Bassey, E.J. Longitudinal changes in selected physical capabilities muscle strength, flexibility and body size. Age Aging 1998, 27, 12–16. [Google Scholar] [CrossRef] [PubMed] [Green Version]
- Voorrips, L.E.; Lemmink, K.A.; Bult, P. The physical condition of elderly women differing in habitual physical activity. Med. Sci. Sports Exerc. 1993, 25, 1152–1157. [Google Scholar] [CrossRef] [PubMed]
- Stamatakis, E.; Chaudhury, M. Temporal trends in adults’ sports participation patterns in England between 1997 and 2006: The Health Survey for England. Br. J. Sports Med. 2008, 42, 901–908. [Google Scholar] [CrossRef] [PubMed] [Green Version]
- Shams, A.; Nobari, H.; Afonso, J.; Abbasi, H.; Mainer Pardos, E.; Pérez-Gómez, J.; Bayati, M.; Bahrami, A.; Carneiro, L. Effect of aerobic-based exercise on psychological well-being and quality of life among older people: A Middle East study. Front. Public Health 2021, 9, 764004. Available online: https://pubmed.ncbi.nlm.nih.gov/34938705 (accessed on 12 November 2021). [CrossRef]
- Anbarian, M.; Esmaeili, H. Effects of running-induced fatigue on plantar pressure distribution in novice runners with different foot types. Gait Posture 2016, 48, 52–56. [Google Scholar] [CrossRef] [PubMed]
- Overgaard, K.; Riis, B.J.; Christiansen, C.; Hansen, M.A. Effect of salcatonin given intranasally on early postmenopausal bone loss. BMJ 1989, 299, 477–479. [Google Scholar] [CrossRef] [PubMed] [Green Version]
- Hetland, M.L.; Haarbo, J.; Christiansen, C. Low bone mass and high bone turnover in male long distance runners. J. Clin. Endocrinol. Metab. 1993, 77, 770–775. [Google Scholar] [CrossRef]
- Nevill, A.M.; Burrows, M.; Holder, R.L.; Bird, S.; Simpson, D. Does lower-body BMD develop at the expense of upper-body BMD in female runners? Med. Sci. Sports Exerc. 2003, 10, 1733–1739. [Google Scholar] [CrossRef] [PubMed] [Green Version]
- Azuma, K.; Katsukawa, F.; Oguchi, S.; Murata, M.; Yamazaki, H.; Shimada, A.; Saruta, T. Correlation between serum resistin level and adiposity in obese individuals. Obes. Res. 2003, 11, 997–1001. [Google Scholar] [CrossRef] [PubMed] [Green Version]
- Larsen, R.G.; Callahan, D.M.; Foulis, S.A.; Kent-Braun, J.A. Age-related changes in oxidative capacity differ between locomotory muscles and are associated with physical activity behavior. Appl. Physiol. Nutr. Metab. 2012, 37, 88–99. [Google Scholar] [CrossRef] [Green Version]
- Ikezoe, T.; Mori, N.; Nakamura, M.; Ichihashi, N. Atrophy of the lower limbs in elderly women: Is it related to walking ability? Eur. J. Appl. Physiol. 2011, 111, 989–995. [Google Scholar] [CrossRef] [PubMed]
- Figueroa, J.D.; Cordero, K.; Serrano-Illan, M.; Almeyda, A.; Baldeosingh, K.; Almaguel, F.G.; De Leon, M. Metabolomics uncovers dietary omega-3 fatty acid-derived metabolites implicated in anti-nociceptive responses after experimental spinal cord injury. Neuroscience 2013, 255, 1–18. [Google Scholar] [CrossRef] [PubMed] [Green Version]
- Lui, P.P.Y.; Qin, L.; Chan, K.M. Tai Chi Chuan exercises in enhancing bone mineral density in active seniors. Clin. Sports Med. 2008, 27, 75–86. [Google Scholar] [CrossRef] [PubMed]
- Frontera, W.R.; Meredith, C.N.; O'Reilly, K.P.; Knuttgen, H.G.; Evans, W.J. Strength conditioning in older men: Skeletal muscle hypertrophy and improved function. J. Appl. Physiol. 1998, 64, 1038–1044. [Google Scholar] [CrossRef] [PubMed]
- Abe, T.; DeHoyos, D.V.; Pollock, M.L.; Garzarella, L. Time course for strength and muscle thickness changes following upper and lower body resistance training in men and women. Eur. J. Appl. Physiol. 2000, 81, 174–180. [Google Scholar] [CrossRef]
- Kim, H. The Effect of Lower Extremity Anatomical Injury Factors on Hindfoot Pronation, Tibia Medial Rotation, and Vertical Impact during Running. Master’s Thesis, Yonsei University, Seoul, Korea, 2001. [Google Scholar]
- Fukuchi, R.K.; Duarte, M. Comparison of three-dimensional lower extremity running kinematics of young adult and elderly runners. J. Sports Sci. 2008, 26, 1447–1454. [Google Scholar] [CrossRef] [PubMed]
- Fukuchi, R.K.; Stefanyshyn, D.J.; Stirling, L.; Duarte, M.; Ferber, R. Flexibility, muscle strength and running biomechanical adaptations in older runners. Clin. Biomech. 2014, 29, 304–310. [Google Scholar] [CrossRef] [PubMed]
- Kline, P.W.; Williams, D.S. Effects of normal aging on lower extremity loading and coordination during running in males and females. International J. Sports Phys. Ther. 2015, 10, 901–909. [Google Scholar] [PubMed]
- Nigg, B.M.; Baltich, J.; Maurer, C.; Federolf, P. Shoe midsole hardness, sex and age effects on lower extremity kinematics during running. J. Biomech. 2012, 45, 1692–1697. [Google Scholar] [CrossRef] [PubMed] [Green Version]
- Silvernail, J.F.; Boyer, K.; Rohr, E.; Brüggemann, G.P.; Hamill, J. Running mechanics and variability with aging. Med. Sci. Sports Exerc. 2015, 47, 2175–2180. [Google Scholar] [CrossRef]
- Devita, P.; Fellin, R.E.; Seay, J.F.; Ip, E.; Stavro, N.; Messier, S.P. The relationships between age and running biomechanics. Med. Sci. Sports Exerc. 2016, 48, 98–106. [Google Scholar] [CrossRef] [PubMed]
- Pohl, M.B.; Hamill, J.; Davis, I.S. Biomechanical and anatomic factors associated with a history of plantar fasciitis in female runners. Clin. J. Sport Med. 2009, 19, 372–376. [Google Scholar] [CrossRef] [PubMed]
- Bohannon, R.W. Sit-to-stand test for measuring performance of lower extremity muscles. Percept. Mot. Ski. 1995, 80, 163–166. [Google Scholar] [CrossRef]
- Hoseini, A.; Zarei, M.; Nobari, H.; Hovanloo, F.; Abbasi, H.; Pérez-Gómez, J. Isokinetic muscle strength cannot be related to the odds ratio of musculoskeletal injuries in young elite wrestlers. BMC Sports Sci. Med. Rehabil. 2022, 14, 1–7. Available online: https://pubmed.ncbi.nlm.nih.gov/35193657 (accessed on 22 February 2022). [CrossRef]
- Heiderscheit, B.C.; Chumanov, E.S.; Michalski, M.P.; Wille, C.M.; Ryan, M.B. Effects of step rate manipulation on joint mechanics during running. Med. Sci. Sports Exerc. 2011, 43, 296, PMCID: PMC3022995. [Google Scholar] [CrossRef] [PubMed] [Green Version]
- Gruber, A.H.; Boyer, K.A.; Derrick, T.R.; Hamill, J. Impact shock frequency components and attenuation in rearfoot and forefoot running. J. Sport Health Sci. 2014, 3, 113–121. [Google Scholar] [CrossRef]
- Hulley, S.B.; Cummings, S.R.; Browner, W.S.; Grady, D.G.; Newman, T.B. Designing Clinical Research: An Epidemiologic Approach, 4th ed.; Appendix 6C; Lippincott Williams & Wilkins: Philadelphia, PA, USA, 2013; p. 79. [Google Scholar]
- Choi, S.Y.; Lee, Y.J.; Kim, J.M.; Kang, H.J.; Cho, S.H.; Chang, S.E. Epidermal Growth Factor Relieves Inflammatory Signals in Staphylococcus aureus-Treated Human Epidermal Keratinocytes and Atopic Dermatitis-Like Skin Lesions in Nc/Nga Mice. BioMed Res. Int. 2018, 2018, 9439182. [Google Scholar] [CrossRef] [PubMed] [Green Version]
- Einhorn, T.A.; Azria, M.; Goldstein, S.A.; Steven, A. Bone Fragility: The Biomechanics of Normal and Pathologic Bone; Sandoz Pharma, Ltd.: West Princeton, NJ, USA, 1992; pp. 1–43. [Google Scholar]
- Lindle, R.S.; Metter, E.J.; Lynch, N.A.; Fleg, J.L.; Fozard, J.L.; Tobin, J.; Hurley, B.F. Age and gender comparisons of muscle strength in 654 women and men aged 20–93 yr. J. Appl. Physiol. 1997, 83, 1581–1587. [Google Scholar] [CrossRef] [Green Version]
- Kim, J.B.; Ha, S.H.; Park, S.H.; Yoon, S.H.; Ryu, J.S.; Park, S.K. Comparison of Physical Characteristics and Lower Extremity Biomechanics of Elderly and Young Adult Runners. Korean J. Sport Biomech. 2019, 29, 145–155. [Google Scholar] [CrossRef]
- Bolam, K.A.; Van Uffelen, J.G.; Taaffe, D.R. The effect of physical exercise on bone density in middle-aged and older men: A systematic review. Osteoporos. Int. 2013, 24, 2749–2762. [Google Scholar] [CrossRef] [PubMed] [Green Version]
- Seo, S.S.; Kim, J.H. Prevention and rehabilitation of knee injuries in running people. Korean J. Orthop. Sports Med. 2010, 9, 22–27. [Google Scholar]
- Hamill, J.; Bates, B.T.; Knutzen, K.M.; Sawhill, J.A. Variations in ground reaction force parameters at different running speeds. Hum. Mov. Sci. 1983, 2, 47–56. [Google Scholar] [CrossRef]
- Hintermann, B.; Nigg, B.M. Pronation in runners. Sports Med. 1998, 26, 169–176. [Google Scholar] [CrossRef]
- Bus, S.A. Ground reaction forces and kinematics in distance running in older-aged men. Med. Sci. Sports Exerc. 2003, 35, 1167–1175. [Google Scholar] [CrossRef] [Green Version]
- Conoboy, P.; Dyson, R. Effect of aging on the stride pattern of veteran marathon runners. Br. J. Sports Med. 2006, 40, 601–604. [Google Scholar] [CrossRef] [PubMed] [Green Version]
- Noehren, B.; Schmitz, A.; Hempel, R.; Westlake, C.; Black, W. Assessment of strength, flexibility, and running mechanics in men with iliotibial band syndrome. J. Orthop. Sports Phys. Ther. 2014, 44, 217–222. Available online: https://www.jospt.or (accessed on 29 March 2022). [CrossRef] [PubMed] [Green Version]
- Kulmala, J.P.; Korhonen, M.T.; Kuitunen, S.; Suominen, H.; Heinonen, A.; Mikkola, A.; Avela, J. Which musclescompromise human locomotor performance with age? J. R. Soc. Interface 2014, 11, 1–10. [Google Scholar] [CrossRef] [PubMed]
- Liew, B.; Morris, S.; Netto, K. The effect of backpack carriage on the biomechanics of walking: A systematic review and preliminary meta-analysis. J. Appl. Biomech. 2016, 32, 614–629. [Google Scholar] [CrossRef] [PubMed]
- Lee, S.Y.; Lee, S.M.; Choi, J.Y. Effect of landing method on shock absorption mechanism of lower extremity joints. J. Korean Soc. Kinesiol. 2001, 10, 77–97. [Google Scholar]
- Williams III, D.B.; Green, D.H.; Wurzinger, B. Changes in lower extremity movement and power absorption during forefoot striking and barefoot running. Int. J. Sports Phys. Ther. 2012, 7, 525, PMCID: PMC3474309. [Google Scholar]


| Group | 20s | 30s | 40s | 50s | 60s | 70s~80s | Total |
|---|---|---|---|---|---|---|---|
| Number of participants | 12 | 12 | 11 | 12 | 12 | 16 | 75 |
| Age (year) | 24.67 ±2.46 | 33.83 ±2.79 | 45.18 ±3.38 | 55.42 ±2.36 | 64.33 ±2.99 | 75.13 ±3.93 | 51.12 ±18.04 |
| Height (m) | 1.75 ±0.05 | 1.76 ±0.04 | 1.72 ±0.05 | 1.71 ±0.04 | 1.67 ±0.05 | 1.67 ±0.06 | 1.71 ±0.06 |
| Weight (kg) | 73.58 ±5.92 | 74.58 ±6.11 | 67.64 ±6.95 | 66.83 ±4.02 | 63.42 ±7.37 | 62.67 ±6.09 | 68.07 ±7.46 |
| Age | BMD | Total | Legs | T score | |||
| −0.380 * | −0.506 ** | −0.422 * | |||||
| 0.001 | 0.000 | 0.000 | |||||
| Strength | Gluteus Maximus | Iliopsoas | Quadriceps | Hamstrings | Tibialis Anterior | Gastrocnemius | |
| −0.399 * | −0.612 * | −0.535 * | −0.525 * | −0.407 * | −0.494 * | ||
| 0.000 | 0.000 | 0.000 | 0.000 | 0.000 | 0.000 | ||
| Running Parameter | Stride Time | StrideDistance | |||||
| −0.336 * | −0.536 * | ||||||
| 0.003 | 0.000 | ||||||
| Impact | Impulse | Impact Force | GRF Peak | Loading Rate | |||
| −0.021 | 0.100 | 0.018 | 0.033 | ||||
| 0.864 | 0.417 | 0.881 | 0.784 | ||||
| Joint Angle | Ankle Dorsi Flexion | Ankle Plantar Flexion | Ankle RoM | Knee Flexion | Knee Extension | Knee RoM | |
| 0.001 | 0.321 * | −0.352 * | −0.115 | 0.181 | −0.361 * | ||
| 0.991 | 0.006 | 0.002 | 0.335 | 0.129 | 0.000 | ||
| Hip Flexion | Hip Extension | Hip RoM | |||||
| 0.164 | 0.289 * | −0.064 | |||||
| 0.166 | 0.013 | 0.593 | |||||
| Joint Moments | Ankle Dorsi Flexion | Ankle Plantar Flexion | Knee Flexion | Knee Extension | Hip Flexion | Hip Extension | |
| 0.328 * | −0.177 | 0.253 * | −0.166 | 0.212 | 0.225 | ||
| 0.004 | 0.140 | 0.030 | 0.167 | 0.072 | 0.060 | ||
| Joint Power | Ankle Absorption | Ankle Generation | Knee Absorption | Knee Generation | Hip Absorption | Hip Generation | |
| −0.334 * | 0.326 * | −0.185 | 0.357 * | −0.044 | 0.082 | ||
| 0.004 | 0.006 | 0.115 | 0.002 | 0.711 | 0.494 |
Publisher’s Note: MDPI stays neutral with regard to jurisdictional claims in published maps and institutional affiliations. |
© 2022 by the authors. Licensee MDPI, Basel, Switzerland. This article is an open access article distributed under the terms and conditions of the Creative Commons Attribution (CC BY) license (https://creativecommons.org/licenses/by/4.0/).
Share and Cite
Kim, J.; Park, S.-K. Differences in Physical Characteristics of the Lower Extremity and Running Biomechanics Between Different Age Groups. Int. J. Environ. Res. Public Health 2022, 19, 4320. https://doi.org/10.3390/ijerph19074320
Kim J, Park S-K. Differences in Physical Characteristics of the Lower Extremity and Running Biomechanics Between Different Age Groups. International Journal of Environmental Research and Public Health. 2022; 19(7):4320. https://doi.org/10.3390/ijerph19074320
Chicago/Turabian StyleKim, Jongbin, and Sang-Kyoon Park. 2022. "Differences in Physical Characteristics of the Lower Extremity and Running Biomechanics Between Different Age Groups" International Journal of Environmental Research and Public Health 19, no. 7: 4320. https://doi.org/10.3390/ijerph19074320