1. Introduction
Natural underground cavities are a recurrent subject of study for a variety of reasons. Their formation and morphology are both related to a wide range of geophysical and geochemical processes, the study of which provides valuable scientific information that allows us to understand, manage and effectively preserve the rock art contained in the caves. In the case of tourist caves, a management system based on observation and continuous analysis of environmental parameters is essential for their proper use and especially to correctly preserve the heritage contained within [
1,
2,
3,
4]
One of the key aspects in the environmental monitoring of caves is the study of atmospheric dynamics, particularly focused on characterising the degree of gas exchanged between the cavity and the external atmosphere. Cave ventilation influences both the internal air quality and the transport of physical, chemical and biological agents that can alter the preservation conditions of artistic manifestations and formations such as speleothems [
5,
6,
7,
8,
9,
10,
11].
For this type of analysis, CO
2 and radon (
222Rn) gases, which are always present in higher concentrations in the underground environment than in the outside air, are fundamental as tracers. In spite of radon and CO
2 sources and sinks being quite different, their temporal variations run almost in parallel. Even if the production rate is not quantified, continuously monitoring the concentrations of both gases serves a dual purpose. Firstly, these gases can pose a risk to human health depending on their concentration. In the case of carbon dioxide, its concentration in internal air also has a significant influence on the state of preservation of cave paintings and speleothems [
12,
13,
14]. The second major area of interest in the study of these gases in caves is their utility as tracers of the air renovation of enclosures [
15,
16]. Time variations in the concentrations of these gases are used to construct models that describe and quantify the degree of connection between internal and external air. Generally, these models result in the identification of seasonal air exchange cycles associated with external thermal variations, whose intensity can vary significantly from cave to cave [
17]. It is common to find in literature, cycles of indoor gas accumulation associated with a higher degree of insulation from the external atmosphere during the spring-summer period, followed by cycles of degassing during the autumn-winter period. However, this is not a standard rule, as the distribution of such cycles may vary depending on the morphology of the cave [
18,
19,
20,
21,
22,
23].
The Altamira cave is one of the most extensively studied cases in the world; time series of the main environmental parameters over a period of more than thirty years are currently available. The air exchanges of the cave and particularly of the Polychrome Room, where most of the rock art is located, has been described in detail since the 1980s. Consequently, annual cycles of degassing and gaseous recharging, which occur between spring-summer and autumn-winter, respectively, have been clearly identified. The relationship between these dynamics and the thermal gradients between the inside and outside of the cave has also been clearly established. The seasonal relationship between the concentration of gases inside the Polychrome room and the air temperature gradient described in this study confirms the trend observed in the Altamira cave since the first systematic studies started in the 1980s. It is remarkable that this relationship is opposite that usually described in the literature on other caves, and that the cause of such differences may be related to the morphology of each cave. Altamira is a shallow karstic cave and the analysis of the differences that this fact supposes on the gas dynamics with respect to other morphologically different caves will be the object of the continuation of this study [
13,
17,
24].
Nonetheless, in addition to the aforementioned gas dynamics, there may exist degassing/recharging episodes of a much shorter period, of the order of hours/days, which until now have only been described on an ad hoc basis [
16,
25]. This is a relatively frequent phenomenon at certain period of the year and its relevance should be considered for the preservation of the rock art. This study furthermore presents an examination of correlations between Rn, CO
2 concentrations and internal/external thermal gradients and preliminarily addresses the existence of time lags between the variables involved, which will be the subject of more detailed studies in future.
The aim of this paper is to study the factors that cause air exchanges in the Polychrome Room during short periods of time as it may have an impact on the transport of materials from outside, which may influence the preservation conditions of the rock art contained in this room. For this purpose, an inventory was made of events where large degassing events occur during several days in the 2015–2020 period. Most of these short degassing and recharging processes, where the cave undergoes strong air exchanges, take place during spring and autumn.
2. Materials and Methods
2.1. Instrumentation
In this study, the database containing the measurement of environmental parameters monitored continuously in the cave was used. There are monitoring stations located at different points in the cave that measure the temperature at different heights, the atmospheric pressure, the CO
2 concentration and the relative humidity. The variables are measured every minute in the Polychrome Room and every 15 min in the other locations. The picture of each sampling station, its location and additional information can be found in [
16].
The radon concentration is recorded continuously every hour using Radon Scout (Sarad GmbH, Dresden, Germany) monitors in the Hall, the Polychrome and the Well Room. Due to possible drifts in the operation of this equipment caused by the influence of high humidity in the cave, the monitors are replaced every 14 days and are placed in waterproof plastic bags with a high permeability to radon. As an additional quality control measure, the time-integrated radon concentration is measured over the same exposure period with passive CR-39 detectors (Radosys, Budapest, Hungary). These devices and the quality control of the measurements have been previously described in [
24]. The two radon measurement devices used in this study can be seen in
Figure 1.
2.2. Time Series of Environmental Parameters Used
The provided database contains a range of experimental measurements of environmental parameters of the Polychrome Room and the exterior of the cave taken from 1 January 2015 to 31 December 2020. The parameters used are as follows:
Radon concentration of the Polychrome Room CRn (Bq/m3).
CO2 concentration of the Polychrome Room CCO2 (ppm).
Mid-height temperature of the Polychrome Room at 80 cm Tpoly (°C).
Mid-height temperature of the exterior of the cave at 80 cm Text (°C).
The time frequency of each of the parameters used is given every 15 min except for radon concentration which is given hourly.
Figure 2 shows the time series of temperatures for the Polychrome Room and the exterior zone of the cave from 2015 to 2020 where the different amplitudes and the time series lag can be seen.
The CO
2 and radon concentration time series show well-defined seasonal oscillations. The highest concentrations of both gases occur between November and April and the lowest concentrations between June and October.
Figure 3 shows the time series of the Rn and CO
2 concentration for the Polychrome Room. By studying this behaviour, it can be seen how the evolution of both gases occurs in parallel.
Although the annual variation of the temperature gradient between the external and internal atmosphere shows well defined periodic oscillations, a short period of degassing and recharging episodes was detected. These events consist of a large mass of moving air released from the cave for a few hours or days.
2.3. Degassing and Recharging Identification Criteria
The identification of degassing and recharging is obtained from the sudden decrease and increase in radon and CO2 concentrations. For this purpose, two criteria have been adopted: the first is temporal, meaning a short-term event was defined as one that occurs within a maximum of twelve days; the second is that of relative variation, which determines that the percentage decrease or increase of gases should be over 40% in the established period of time.
2.4. Correlations
Once the degassing and recharging events were selected, an analysis of correlations between the gas concentration and the temperature gradient between the outside of the cave and the Polychrome Room was carried out: ∆
T =
Text −
Tpoly. The temperature gradient has been selected instead of the density gradient because the temperature is the variable directly measured in the experiment. In the research of [
16], it was shown that the correlation between temperature gradient and gases is sufficiently high and significant to consider this gradient as an indicator and cause of air movements. This makes it easier to identify and predict these events depending on the internal and external temperature variations. In addition, the correlation between gas concentrations has been analysed in order to compare their behaviour and try to identify if there is a time lag between them.
The method implemented to determine the lag between two time series is based on the cross-correlation technique [
26]. It involves performing a known time shift
h of a series
xt with respect to another series
yt and calculating the Pearson correlation coefficient
rxy. Performed repeatedly, this procedure yields a set of correlation coefficients with their corresponding significance for each of the shifts. The shift with the highest correlation coefficient determines the lag.
The study of correlations between the temperature gradient and gas concentrations has been carried out individually both for degassing and recharging events, as well as for the whole period comprising both processes. For the correlations between CRn and ∆T, and between CRn and CCO2, hourly measured values have been used because the radon concentration has been measured hourly. In contrast, for the correlations between CCO2 and ∆T, all corresponding values have been selected, as 15-min values were available.
3. Results
3.1. Event Inventory
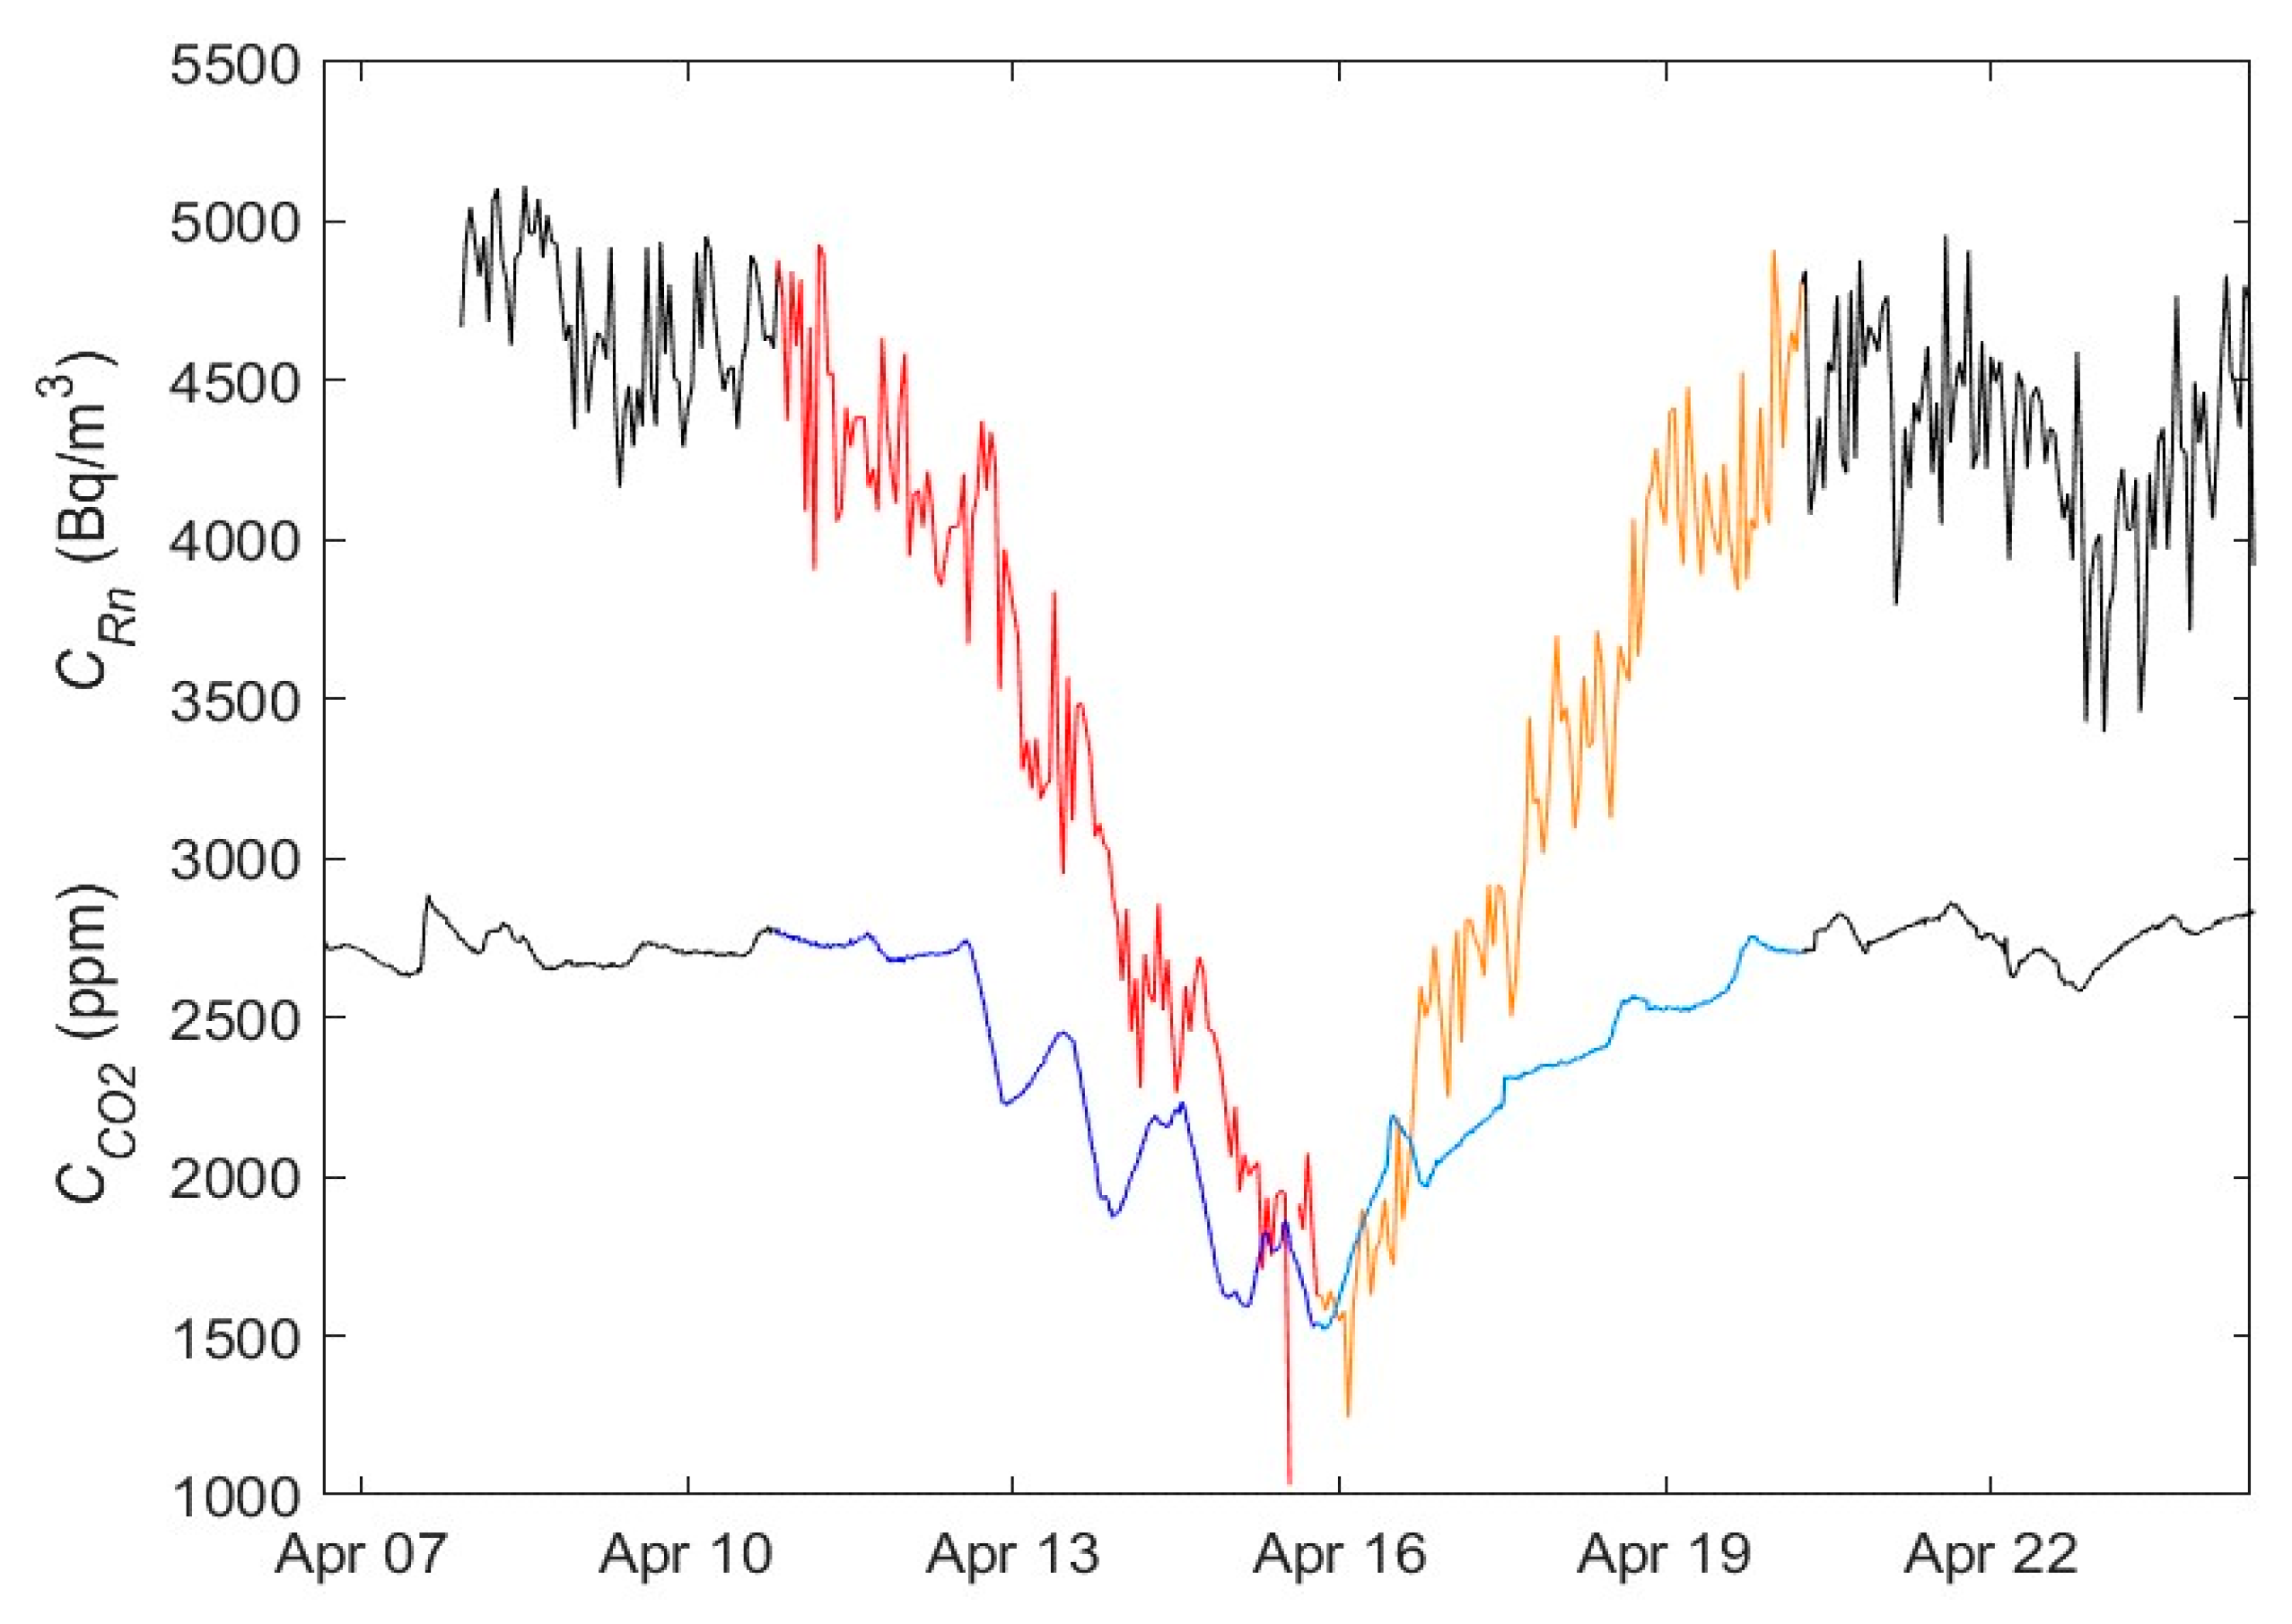
Based on the established criteria, degassing and recharging events have been identified and compiled for the 2015–2020 period. As an example,
Figure 4 shows the evolution of the radon and CO
2 concentrations. In the first half of 2015, four first events were identified and labeled with the numbers 1, 2, 3 and 4. The graphical representation of each of the events can be found in the
Supplementary Materials. A detailed graph of event number one is shown in
Figure 5.
Figure 6 shows the distribution of duration of degassing and recharge events measured from the variations of the concentration of both gases, CO
2 and radon.
3.2. CO2 and Rn Correlations
The events studied show that the degassing and recharging processes of the studied gases have an earlier temporary effect in the case of CO
2. It can be seen that the decrease in CO
2 concentration starts earlier than the decrease of radon. The same applies for the minimum value as the transition point between degassing and recharging occurs earlier (see
Figure 4). This happens systematically to a greater or lesser extent.
From the application of the maximum cross-correlation method, the time lag between Rn and CO2 has been obtained for each of the events. An average result of 5.3 ± 2.7 h was obtained.
The lag between the behaviour of Rn and CO
2 does not make physical sense as it represents the main driven force for the convective transport of air masses containing CO
2 and radon. Therefore, the concentration of both gases should increase and decrease at the same time. This means that air masses move due to temperature and pressure variations, although diffusion also occurs simultaneously to a much lesser extent. It can therefore be hypothesized that the obtained lag is due to the measuring conditions of the Radon Scout devices, which are placed in plastic bags in order to protect their electronic parts from the humidity. Consequently, the bag acts as an Rn retarder interphase, meaning that it takes radon a few hours to reach the actual concentration of the cave when it diffuses through the bag. In this case, the movement of the Rn is not caused by the pressure and temperature gradients between the bag and the cave, but the difference between concentrations. This fact has been confirmed by the radon chamber of LaRUC [
27], which allows to simulate variations similar to those produced in the cave and quantify the lags between the actual radon concentration and the one obtained from the device contained in the plastic bag.
3.3. Correlations between Gases and Temperature Gradients
The temperature gradient, CO
2, and radon concentrations have been represented in individual graphs for each event analysed. In this case, a lag is also observed in the concentration of the gases and the temperature gradient.
Figure 7 shows how the increase in the gradient and, more specifically, when it becomes positive, does not instantly start the process of CO
2 degassing. This is to be expected because the gradient change cannot cause an instantaneous movement of the air masses and, consequently, an instantaneous change of the concentration of gases. Therefore, the study of correlations between the concentration of gases and the temperature gradient has been made by looking for the maximal correlation, i.e., moving the time series of each of the gases with respect to the gradient. A high variability is observed in the lags of the analysed events to obtain a maximal correlation. This may be due to the high variability in the conditions of the karst system, the different periods analysed, the permeability of the terrain, etc., which will be the subject of future research. It should be noted that the time lag considered in all cases is in the same order of magnitude of event duration (hours).
Figure 8 shows the distribution of the maximum correlation coefficient between the temperature gradient and the concentration of gases in degassing, recharging events or in complete periods. They are divided into the periods of degassing, recharging and complete event. In all cases, the correlation between the temperature gradient and the gases concentration is negative, i.e., when the outside temperature is higher than the one corresponding to the cave, the system gets degassed. Likewise, when the outside temperature is lower than the one inside the cave, the system gets insulated, and the gases accumulate. For events 7 (recharging), 8 and 9, correlations were not performed because of the lack of temperature data in this period due to technical issue with datalogger.
The average and the standard deviation were obtained for the total set of events for each of the stages. In the case of degassing, an average correlation coefficient of −0.53 between the temperature gradient and radon is obtained and −0.55 for the corresponding CO2 case. The standard deviations show that 68% of coefficients are between −0.68 and 0.38 for radon and between −0.73 and −0.37 for CO2. This shows that the dispersion of the correlations is relatively small.
In the recharging event, the same is obtained for the correlation between the temperature gradient and radon. As for the correlation between the gradient and CO2, the coefficient is −0.56 and the standard deviation is 0.19, i.e., 68% of the values are between −0.75 and −0.37.
For the complete events, the average correlation coefficients for both gases are −0.49. 68% of the coefficients are between−0.63 and 0.35 for radon and between −0.66 and −0.32 for CO2.
4. Conclusions
We have confirmed, as showed in previous studies, that air temperature/density gradients between the inner and outer atmosphere are the driving forces which explain temporal variations in the indoor concentrations of gases in Altamira cave. The accumulation period happens during wintertime in this cave. On the other hand, we found that the trace gas concentrations reach their minimum annual values during summertime. This is a fact observed systematically during the last 30 years of continuous observations carried out by different research groups. The explanation for this behaviour can be related to the cave´s morphology by taking into account that Altamira is a shallow and karstic formation. The movement of air masses with different temperature is caused by gravitational forces, which are responsible for different seasonal trends depending on the depth of the cave room studied, and also on the degree of connection of the rocks with the outdoor atmosphere. Comparison of seasonal gas concentration trends between caves with different depth, degree of isolation and morphology will be showed further studies.
An inventory of short-period degassing events was made from 2015 and 2020, 37 of which were found for the established criteria. More events than the ones analysed occurred and there were more than expected considering the general dynamics of the time series over the six years. These events have been studied to determine if the temperature gradient between the exterior and the interior of the cave is a determining factor which causes these events. Thus, the concentrations of tracer gases such as CO2 and radon, are used to indicate if the cave is insulated or, on the contrary, ventilated.
The Polychrome Room presents short period gaseous exchanges more frequently in seasons when the greatest thermal contrasts between day and night occur. One of these seasons is spring, when the temperature gradient increases. This causes water evaporation in the soil/rock layer, which blocks the cracks that surround the cave, allowing the exchange of air masses between the cave and the exterior. The other season is autumn, when the temperature gradient starts decreasing and rainwater starts to accumulate in the cracks of the karstic system.
The correlation coefficients found between the concentration of gases and the exterior-interior temperature gradient are significant and indicate frequent values in the study of complex processes such as this one. The observed correlations confirm that the temperature gradient between the exterior and the interior of the cave is a key factor for the large degassing events through karstified rocks. Similarly, and because the temperature in the Polychrome Room remains approximately constant during each of these events, the exterior temperature variation could be a good indicator and predictor of the above-mentioned events.
A time lag between the temperature gradient and the concentration of gases in the cave has been observed, showing that the temperature gradient change produces a degassing/recharge event in a progressive manner. A better knowledge of the latter will allow the refinement of the estimation of the correlation coefficients showed in this study.
The detailed knowledge of the intensity and frequency of the degassing recharge episodes studied in this research has, from our point of view, relevance regarding the preservation of rock art from two different perspectives. On the one hand, the entrance of outdoor air could bring biological related contamination, which have been one of the most important hazards detected in caves containing rock art. On the other hand, the preventive conservation of rock art contained in Altamira cave includes a complex system involving protocols for controlling different types of risks. One of these protocols is related to the control of indoor air CO2 concentration and the anthropic influence on that variable. The identification and understanding of the analyzed degassing/recharge episodes, which occurs naturally with independence of human presence inside the cave, allows us to discriminate more clearly the real anthropic influence, avoiding false alarms due to a wrong attribution of sudden CO2 concentration changes.
Supplementary Materials
The following supporting information can be downloaded at:
https://www.mdpi.com/article/10.3390/ijerph19063662/s1, Figure S1: Graphs of every degasification and recharge events. Table S1. Time record, start and end of the n selected degassing-recharging events considering CO
2 as a reference. Table S2. Maximum correlation coefficient between the temperature gradient and the concentration of gases in degassing, recharging events or in complete periods. The average value and the standard deviation (SD) are reported.
Author Contributions
Conceptualization, C.S. and L.Q.; methodology, D.R.; software, E.F.; validation, I.F., S.C. and A.F.; formal analysis, L.Q.; investigation, C.S. and J.F.; resources, D.R. and J.L.A.; data curation, J.Q.; writing—original draft preparation, C.S. and J.F.; writing—review and editing, D.R.; visualization, S.C.; supervision, I.F.; project administration, C.S.; funding acquisition, C.S. and L.Q. All authors have read and agreed to the published version of the manuscript.
Funding
This research was funded by the Spanish Ministry of Culture and Sport, grant number J200028.
Institutional Review Board Statement
Not applicable.
Informed Consent Statement
Not applicable.
Data Availability Statement
Not applicable.
Acknowledgments
The authors are grateful to the Altamira Cave Research Centre and Museum staff for their helpful support during the sampling surveys in the cave. We also acknowledge the essential collaboration of the Spanish Meteorological Agency (AEMET).
Conflicts of Interest
The authors declare no conflict of interest.
References
- Frisia, S.; Fairchild, I.J.; Fohlmeister, J.; Miorandi, R.; Spötl, C.; Borsato, A. Carbon mass-balance modelling and carbon isotope exchange processes in dynamic caves. Geochim. Cosmochim. Acta 2011, 75, 380–400. [Google Scholar] [CrossRef]
- Lasheras, J.A.; De Las Heras, C.; Prada, A. Altamira and its future. In The Conservation of Subterranean Cultural Heritage, 1st ed.; Saiz-Jiménez, C., Ed.; CRC Press: London, UK, 2014; pp. 145–164. [Google Scholar]
- Sánchez-Moral, S.; Cuezva, S.; Fernández-Cortés, A.; Janices, I.; Benavente, D.; Cañaveras, J.C.; González, J.M.; Jurado, V.; Laiz, L.; Portillo, M.C.; et al. Estudio Integral del Estado de Conservación de la Cueva de Altamira y sus Representaciones Artísticas Paleolíticas. Perspectivas Futuras de Conservación. Report for the Dirección General de Bellas Artes y Bienes Culturales, Ministerio de Educación, Cultura y Deporte 2009. Available online: https://digital.csic.es/handle/10261/116391 (accessed on 15 February 2022).
- Bourges, F.; Genthon, P.; Genty, D.; Lorblanchet, M.; Mauduit, E.; d’Hulst, D. Conservation of prehistoric caves and stability of their inner climate: Lessons from Chauvet and other French caves. Sci. Total Environ. 2014, 493, 79–91. [Google Scholar] [CrossRef] [PubMed]
- Fernández, P.L.; Gutierrez, I.; Quindós, L.S.; Soto, J.; Villar, E. Natural ventilation of the paintings room in the Altamira cave. Nature 1986, 321, 586–588. [Google Scholar] [CrossRef]
- Quindos, L.S.; Bonet, A.; Diaz-Caneja, N.; Fernandez, P.L.; Gutierrez, I.; Solana, J.R.; Villar, E. Study of the environmental variables affecting the natural preservation of the Altamira Cave paintings located at Santillana del Mar, Spain. Atmos. Environ. 1987, 21, 551–560. [Google Scholar] [CrossRef]
- Gázquez, F.; Quindós-Poncela, L.; Sainz-Fernández, C.; Fernández-Villar, A.; Fuente-Merino, I.; y Celaya-Gonzalez, S. Spatiotemporal distribution of δ13CO2 in a shallow cave and its potential use as indicator of anthropic pressure. J. Environ. Manag. 2016, 180, 421–432. [Google Scholar] [CrossRef] [PubMed]
- Sánchez-Moral, S.; Soler, V.; Cañaveras, J.C.; Sanz-Rubio, E.; Van Grieken, R.; Gysels, K. Inorganic deterioration affecting the Altamira Cave, N Spain: Quantitative approach to wall-corrosion (solutional etching) processes induced by visitors. Sci. Total Environ. 1999, 243, 67–84. [Google Scholar] [CrossRef]
- Sánchez-Moral, S.; Cuezva, S.; Fernández-Cortés, A.; Benavente, D.; Cañaveras, J.C. Effect of ventilation on karst system equilibrium (Altamira Cave, N Spain): An appraisal of karst contribution to the global carbon cycle balance. In Advances in Research in Karst Media; Springer: Berlin/Heidelberg, Germany, 2010; pp. 469–474. [Google Scholar] [CrossRef]
- Soler, V.; Sánchez, S.; Cañaveras, J.C.; Sanz, E.; Lasheras, J.A.; Lario, J. Microenvironmental monitoring system at Altamira cave (northern Spain). In International Congress on Science and Technology for the Safeguard of Cultural Heritage in the Mediterranean Basin, 2nd ed.; Guarino, A., Ferrari, A., Eds.; Scientifiques et Médicales Elsevier: Paris, France, 1999; p. 304. [Google Scholar]
- Gázquez, F.; Quindós, L.; Rábago, D.; Fuente, I.; Celaya, S.; Sainz, C. The role of cave ventilation in the triple oxygen and hydrogen isotope composition of condensation waters in Altamira Cave, northern Spain. J. Hydrol. 2022, 606, 127416. [Google Scholar] [CrossRef]
- Kowalczk, A.J.; Froelich, P.N. Cave air ventilation and CO2 outgassing by radon-222 modeling: How fast do caves breathe? Earth Planet Sci. Lett. 2010, 289, 209–219. [Google Scholar] [CrossRef]
- Garcia-Anton, E.; Cuezva, S.; Fernández-Cortes, A.; Benavente, D.; Sánchez-Moral, S. Main drivers of diffusive and advective processes of CO2-gas exchange between a shallow vadose zone and the atmosphere. Int. J. Greenhouse Gas Control 2014, 21, 113–129. [Google Scholar] [CrossRef]
- Bourges, F.; Genty, D.; Perrier, F.; Lartiges, B.; Régnier, É.; François, A.; Rodrigues, P. Hydrogeological control on carbon dioxide input into the atmosphere of the Chauvet-Pont d’Arc cave. Sci. Total Environ. 2020, 716, 136844. [Google Scholar] [CrossRef]
- Rowberry, M.D.; Martí, X.; Frontera, C.; Van De Wiel, M.J.; Briestenský, M. Calculating flux to predict future cave radon concentrations. J. Environ. Radioact. 2016, 157, 16–26. [Google Scholar] [CrossRef] [PubMed] [Green Version]
- Sainz, C.; Rábago, D.; Celaya, S.; Fernández, E.; Quindós, J.; Quindós, L.; Quindós, L.S. Continuous monitoring of radon gas as a tool to understand air dynamics in the cave of Altamira (Cantabria, Spain). Sci. Total Environ. 2018, 624, 416–423. [Google Scholar] [CrossRef] [PubMed]
- Sáez, M.; Mangiarotti, S.; Cuezva, S.; Fernández-Cortés, A.; Molero, B.; Sánchez-Moral, S.; Benavente, D. Global models for 222Rn and CO2 concentrations in the Cave of Altamira. Theor. Appl. Climatol. 2021, 143, 603–626. [Google Scholar] [CrossRef]
- Cigna, A.A. The distribution of radon concentration in caves. Int. J. Speleol. 2004, 32, 8. [Google Scholar] [CrossRef]
- Baskaran, M. Radon: A Tracer for Geological, Geophysical and Geochemical Studies; Springer: Basel, Switzerland, 2016; Volume 367. [Google Scholar]
- Wang, Y.; Luo, W.; Zeng, G.; Wang, Y.; Yang, H.; Wang, M.; Wang, S. High 222Rn concentrations and dynamics in Shawan Cave, southwest China. J. Environ. Radioact. 2019, 199, 16–24. [Google Scholar] [CrossRef] [PubMed]
- Gregorič, A.; Zidanšek, A.; Vaupotič, J. Dependence of radon levels in Postojna Cave on outside air temperature. Nat. Hazards Earth Syst. Sci. 2011, 11, 1523–1528. [Google Scholar] [CrossRef] [Green Version]
- Przylibski, T.A. Radon concentration changes in the air of two caves in Poland. J. Environ. Radioact. 1999, 45, 81–94. [Google Scholar] [CrossRef]
- Smetanová, I.; Holý, K.; Luhová, Ľ.; Csicsay, K.; Haviarová, D.; Kunáková, L. Seasonal variation of radon and CO2 in the Važecká Cave, Slovakia. Nukleonika 2020, 65, 153–157. [Google Scholar] [CrossRef]
- Sainz, C.; Rábago, D.; Fernández, E.; Quindós, J.; Quindós, L.; Fernández, A.; Fuente, I.; Arteche, J.L.; Quindos, L.S.; Celaya, S. Variations in radon dosimetry under different assessment approaches in the Altamira Cave. J. Radiol. Prot. 2020, 40, 367. [Google Scholar] [CrossRef] [PubMed]
- Cuezva, S.; Fernández-Cortes, A.; Benavente, D.; Serrano-Ortiz, P.; Kowalski, A.S.; Sánchez-Moral, S. Short-term CO2 (g) exchange between a shallow karstic cavity and the external atmosphere during summer: Role of the surface soil layer. Atmos. Environ. 2011, 45, 1418–1427. [Google Scholar] [CrossRef]
- Derrick, T.R.; Thomas, J.M. Chapter 7. Time-Series Analysis: The cross-correlation function. In Innovative Analyses of Human Movement; Stergiou, N., Ed.; Human Kinetics Publishers: Champaign, IL, USA, 2004; pp. 189–205. [Google Scholar]
- Fuente, M.; Rabago, D.; Herrera, S.; Quindos, L.; Fuente, I.; Foley, M.; Sainz, C. Performance of radon monitors in a purpose-built radon chamber. J. Radiol. Prot. 2018, 38, 1111. [Google Scholar] [CrossRef] [PubMed]
| Publisher’s Note: MDPI stays neutral with regard to jurisdictional claims in published maps and institutional affiliations. |
© 2022 by the authors. Licensee MDPI, Basel, Switzerland. This article is an open access article distributed under the terms and conditions of the Creative Commons Attribution (CC BY) license (https://creativecommons.org/licenses/by/4.0/).


 ,
, 


