
Understanding Relationships between Cultivated Land Pressure and Economic Development Level across Spatiotemporal Characteristics: Implications for Supporting Land-Use Management Decisions
Abstract
:1. Introduction
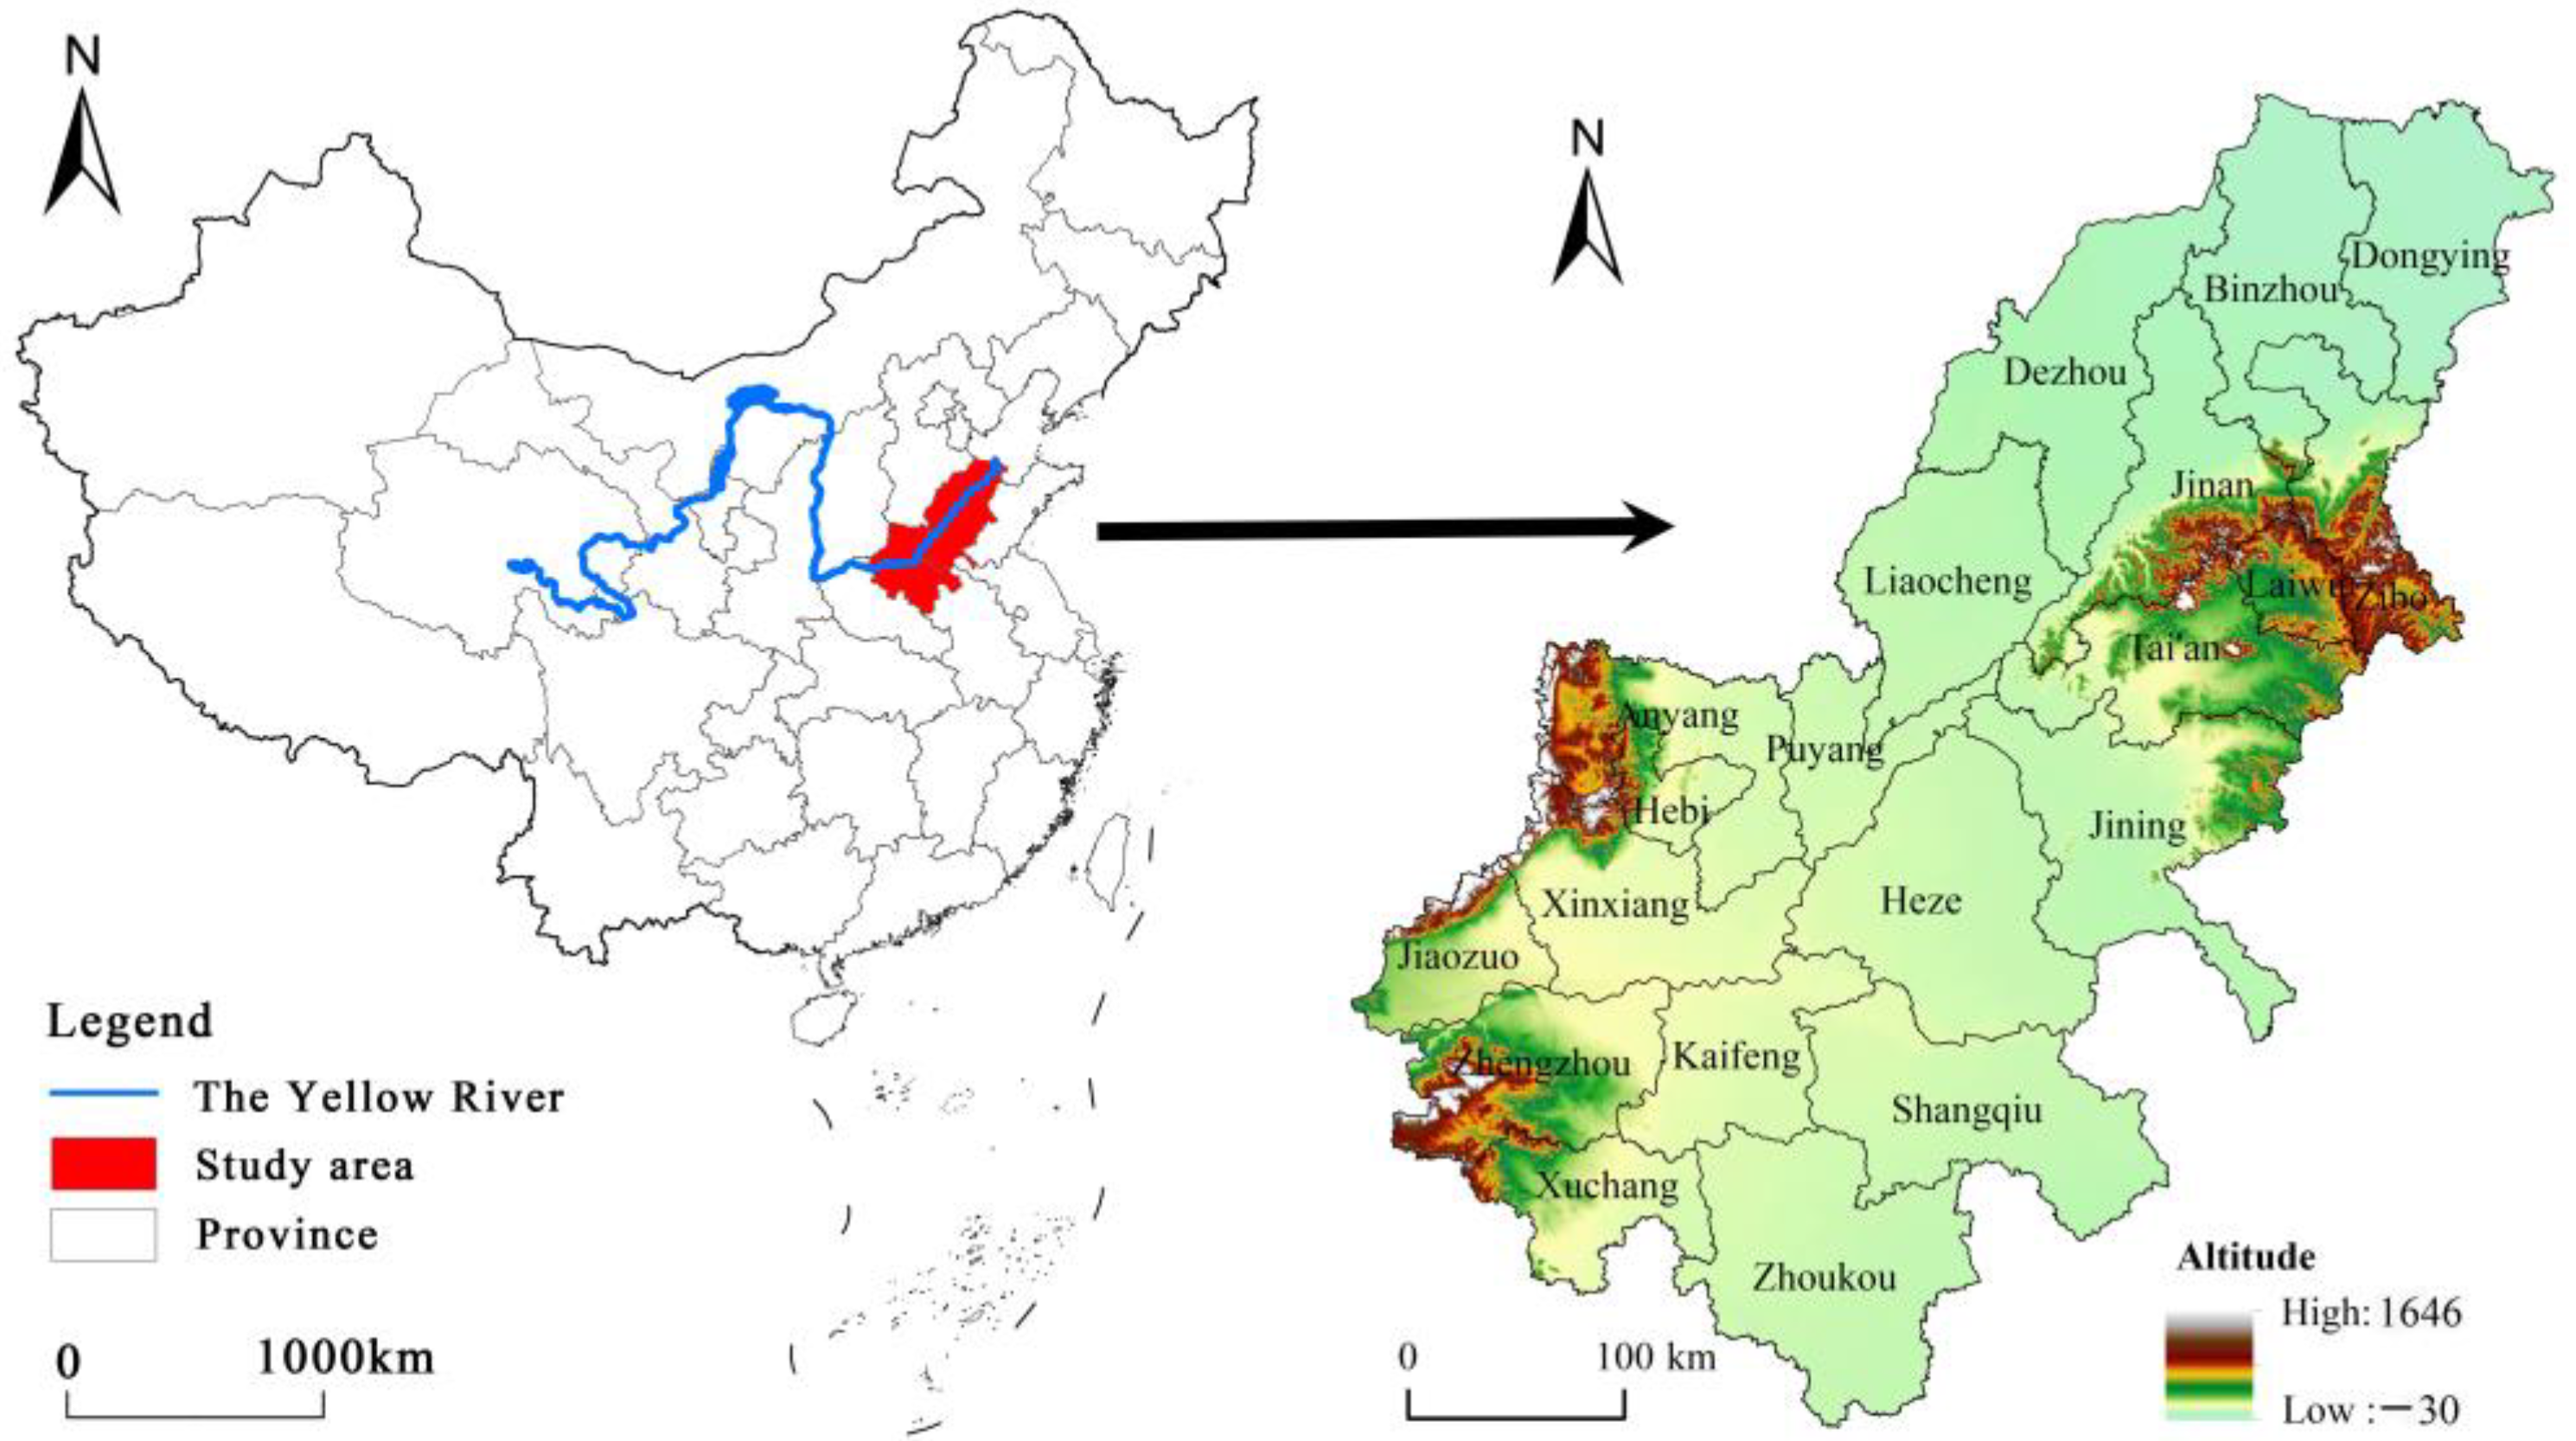
2. Study Area
3. Methods and Data Sources
3.1. Methods
3.1.1. Evaluation of CLP Index
- (1)
- The minimum per capita cultivated land area (MPCA) refers to the cultivated land area that can meet people’s normal food needs under the regional food productivity level and supply capacity, which takes into account the linkage between cultivated land and other factors [45]. In any country, changes in cultivated land are inevitable with industrialization and urbanization. When the actual per capita cultivated land area (ACPA) in a region is lower than the MPCA, it will endanger basic food security. The formula is:
- (2)
- CLP index is a variable that varies according to time and space. It is usually used to measure the tension between regional cultivated land resources. The CLP index can provide a benchmark for scientific regulation of regional cultivated land resources [33]. The formula is:
3.1.2. Geographic Correlation Rate and the Center of Gravity Model
3.1.3. Geographical Concentration and Coupling Index
3.1.4. Geographical Detector Model
3.2. Data Sources
4. Results
4.1. Changes in CLP Index in the AALYR
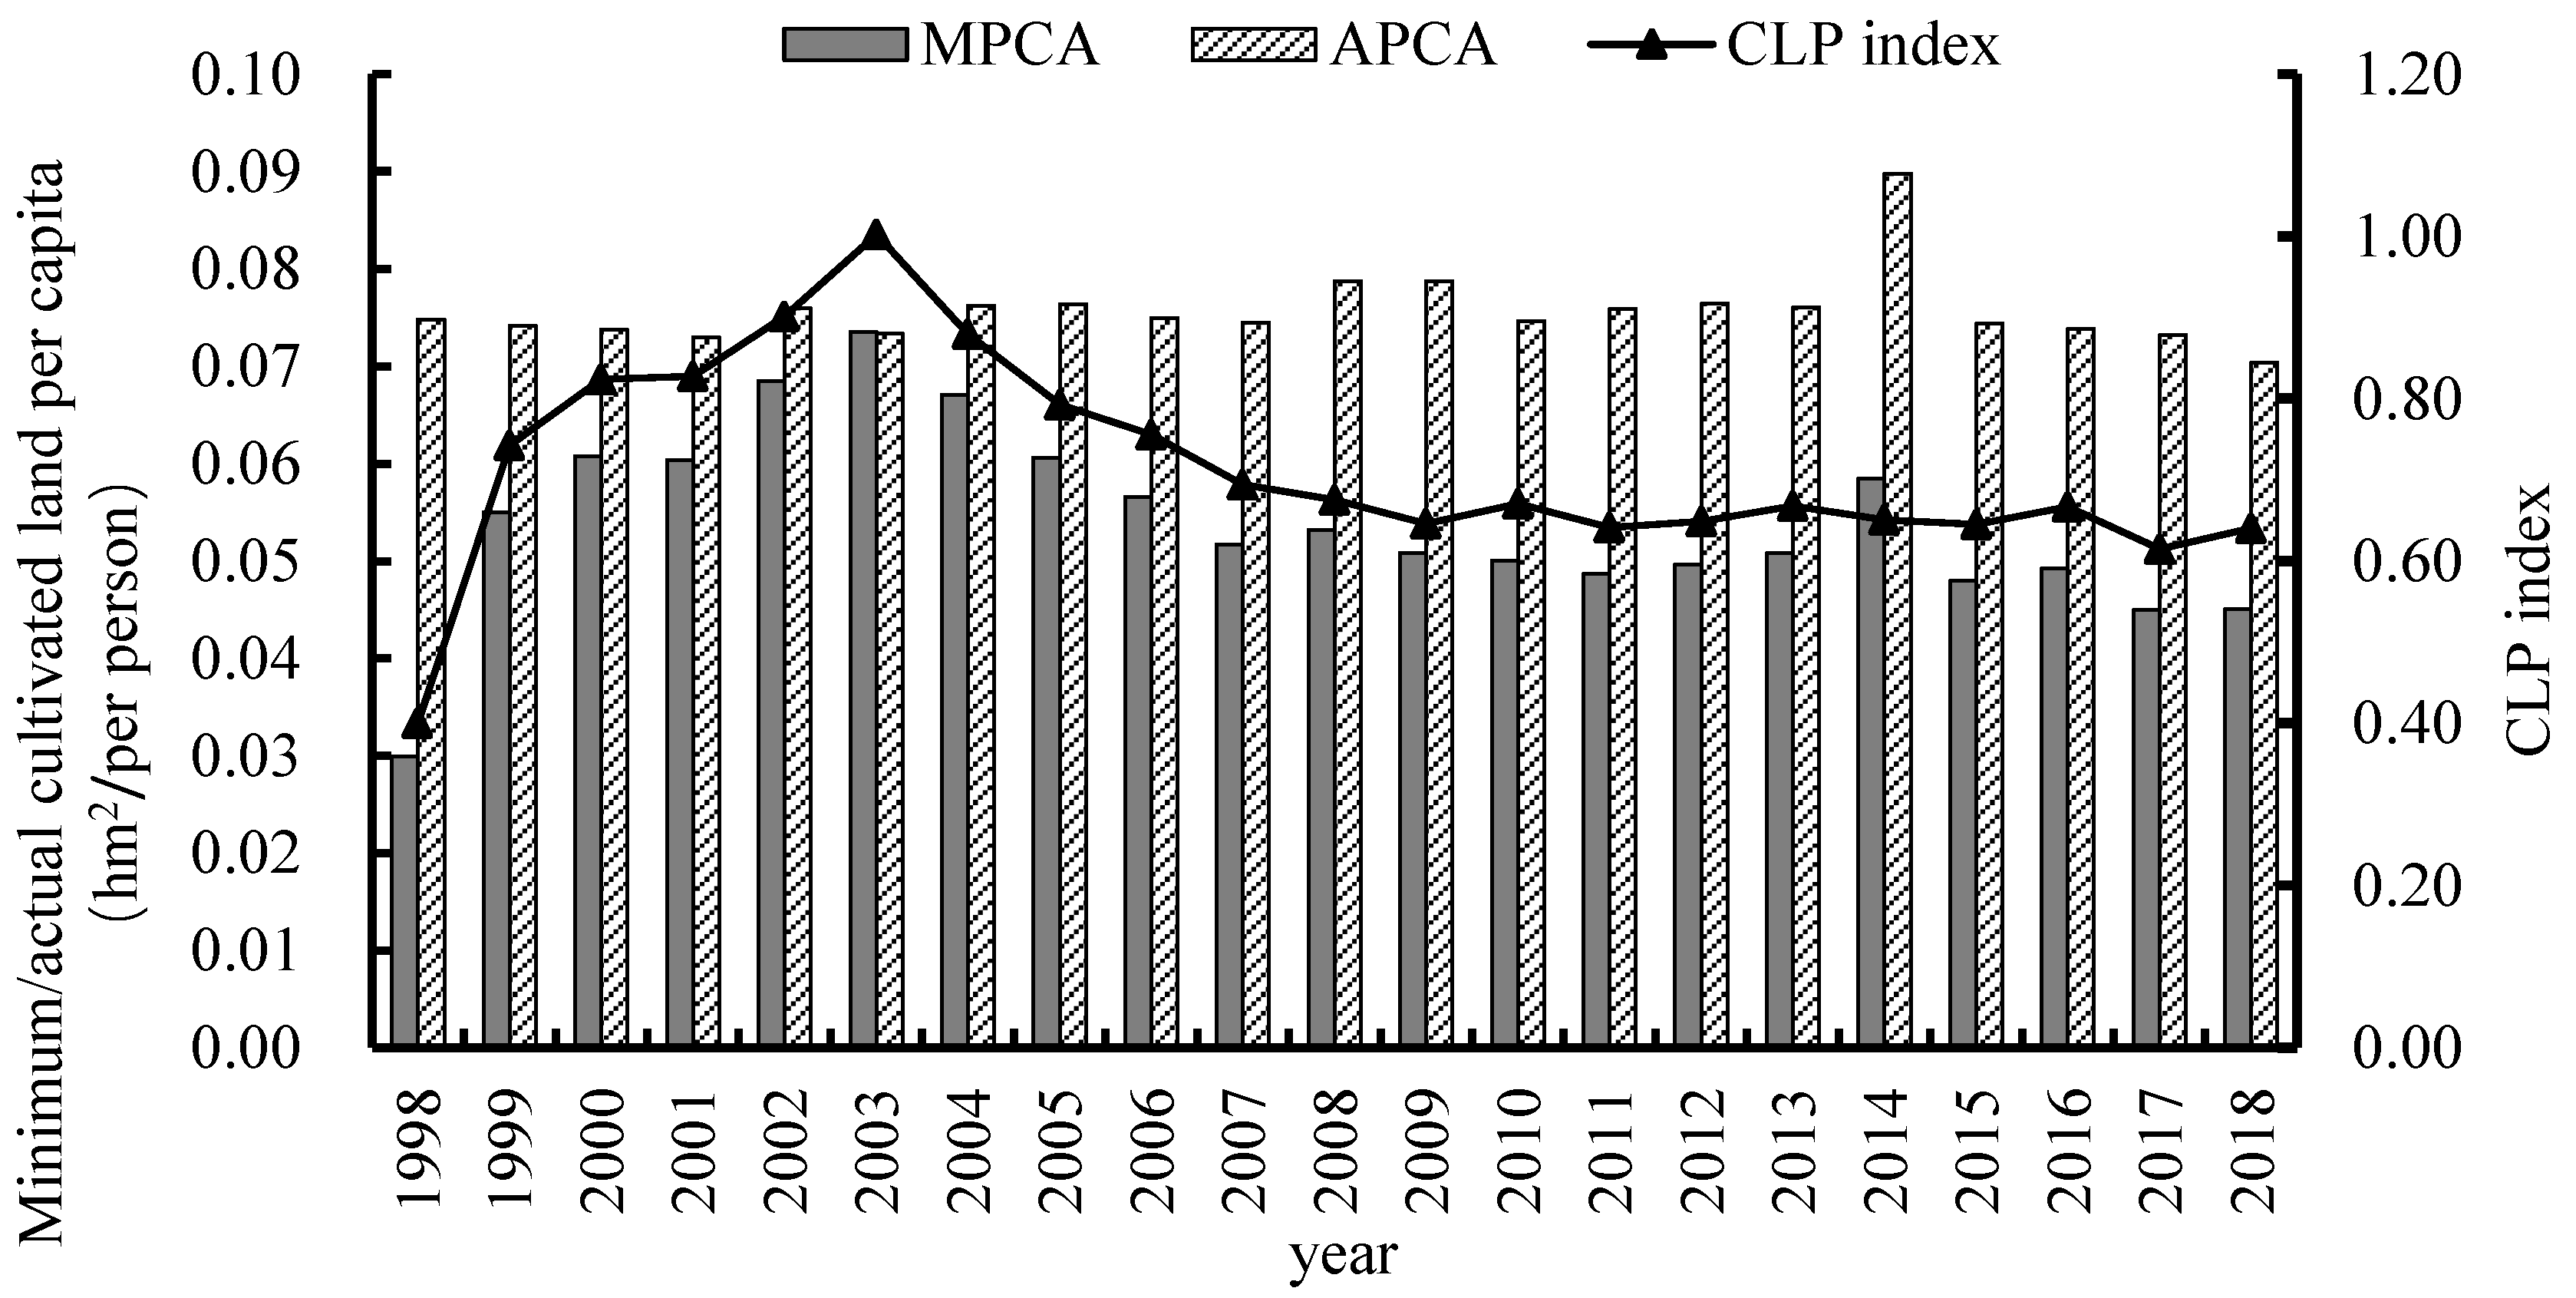
4.1.1. Temporal Variation Characteristics of CLP
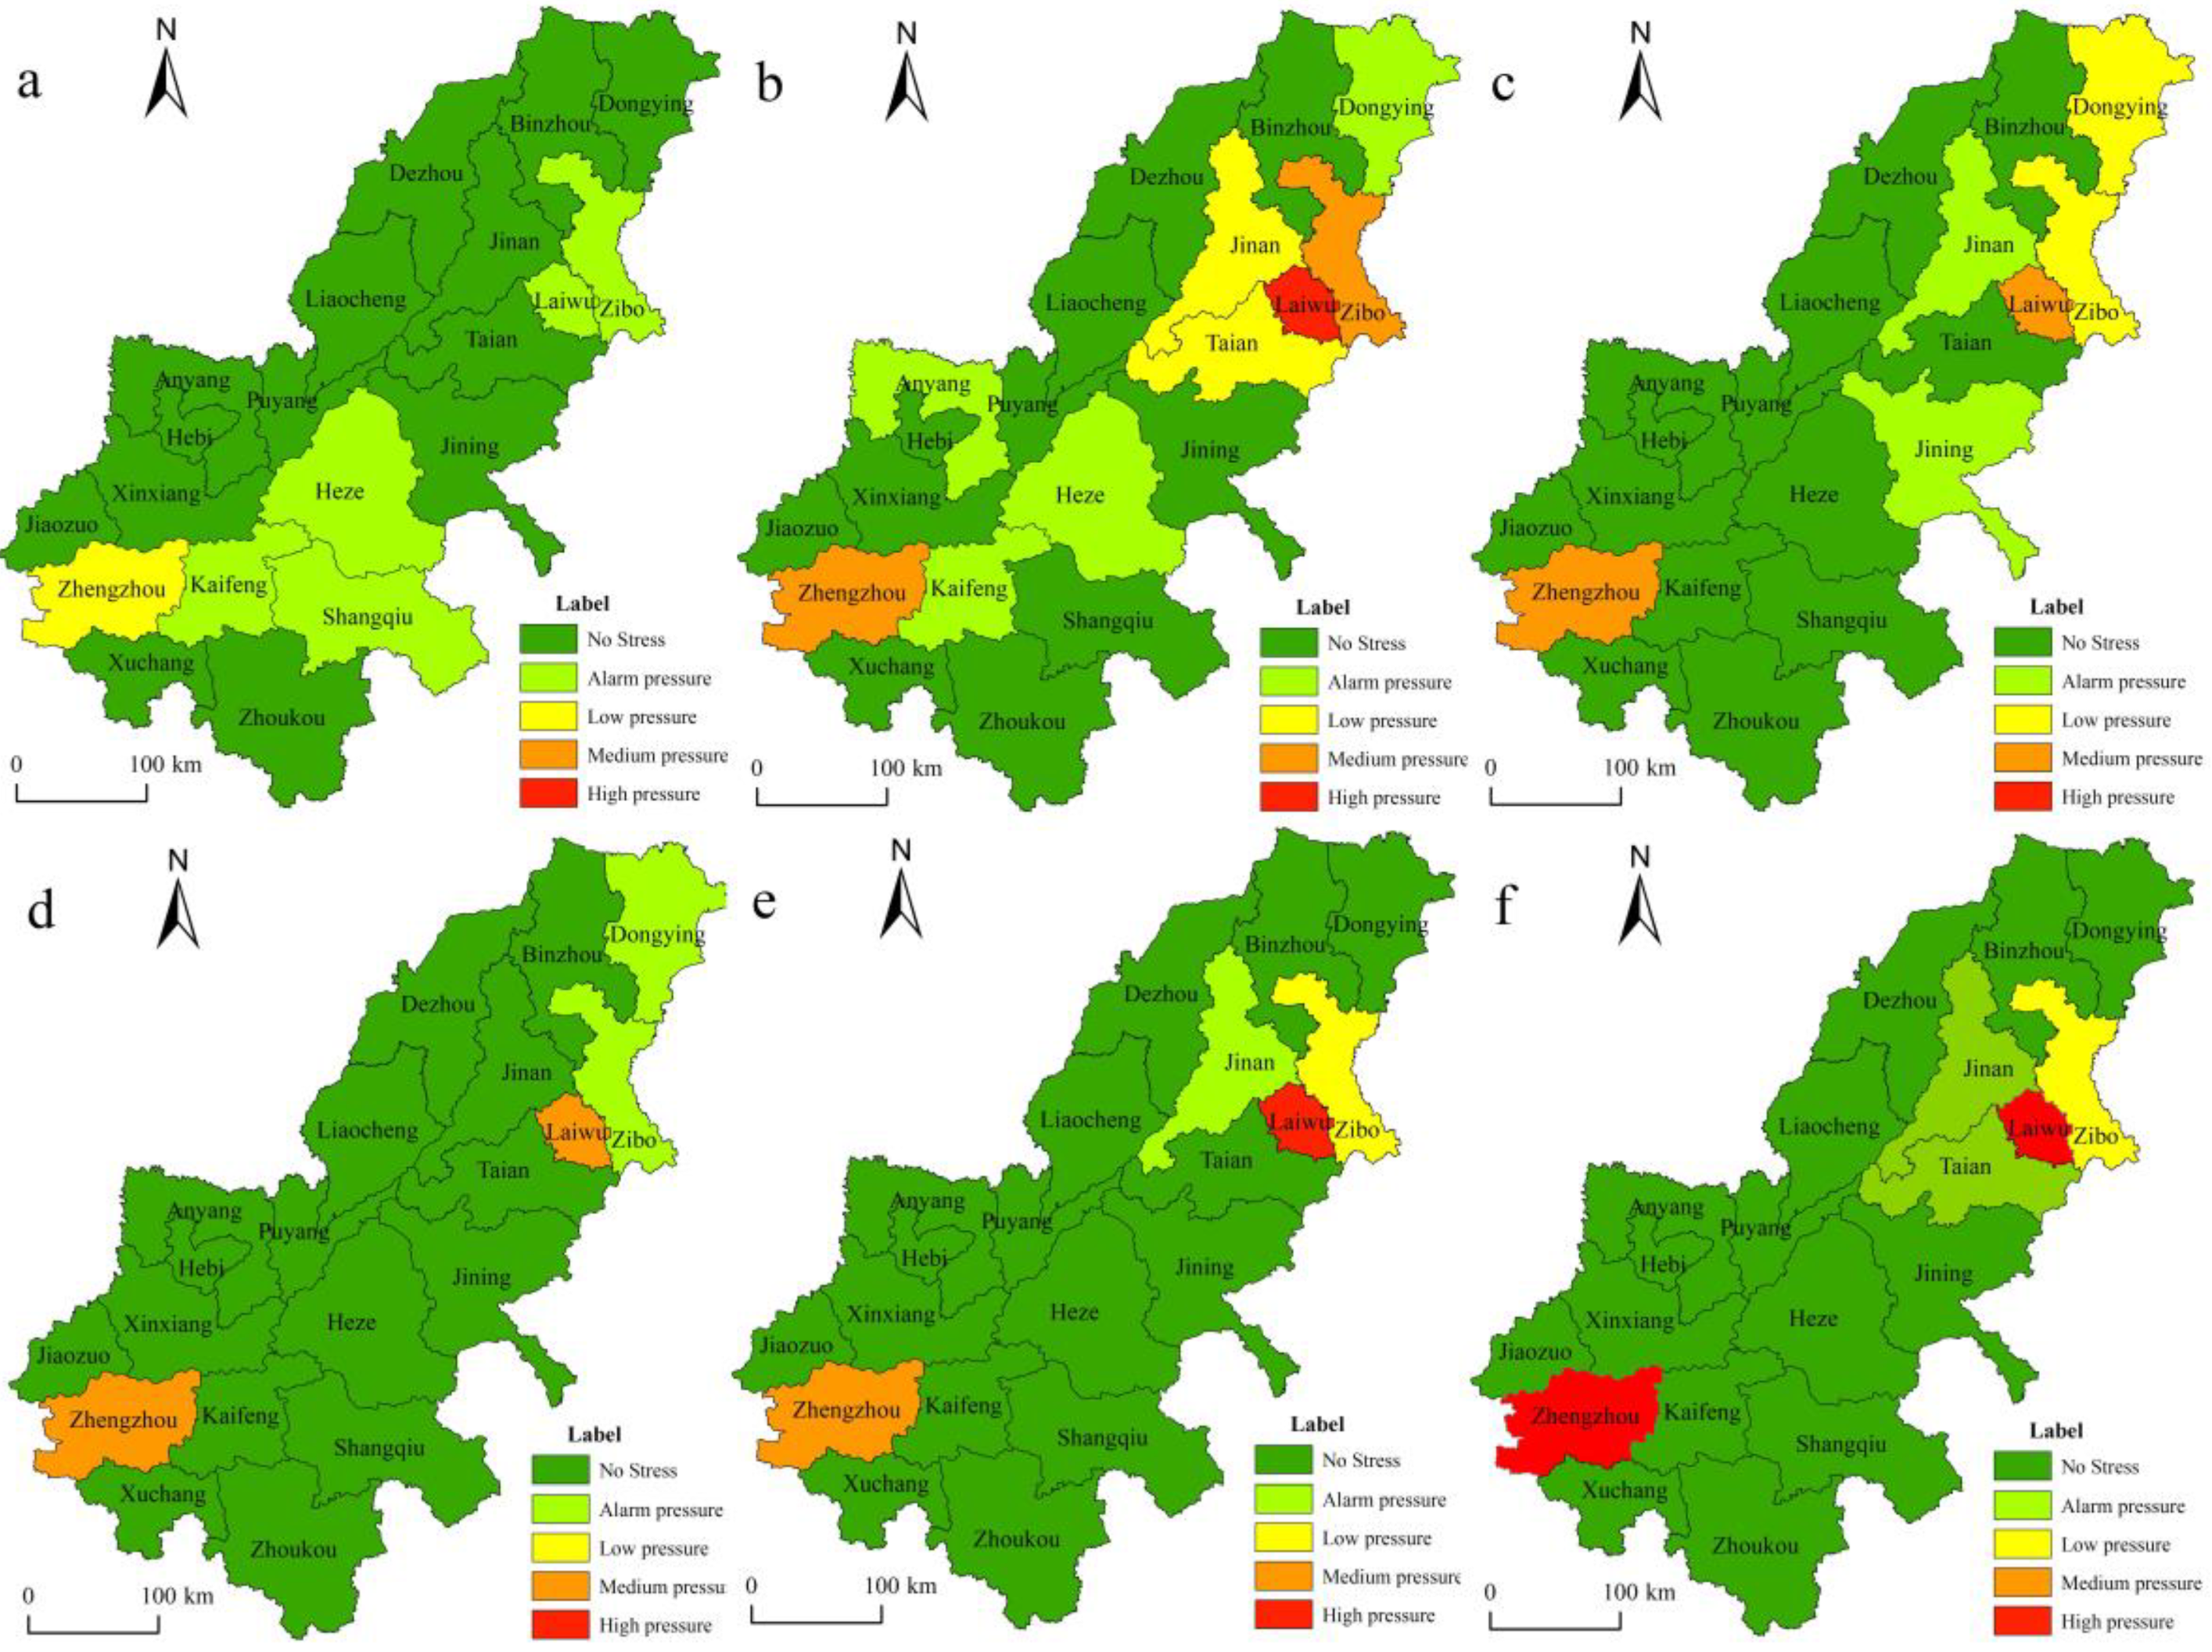
4.1.2. Spatial Variation Characteristics of CLP
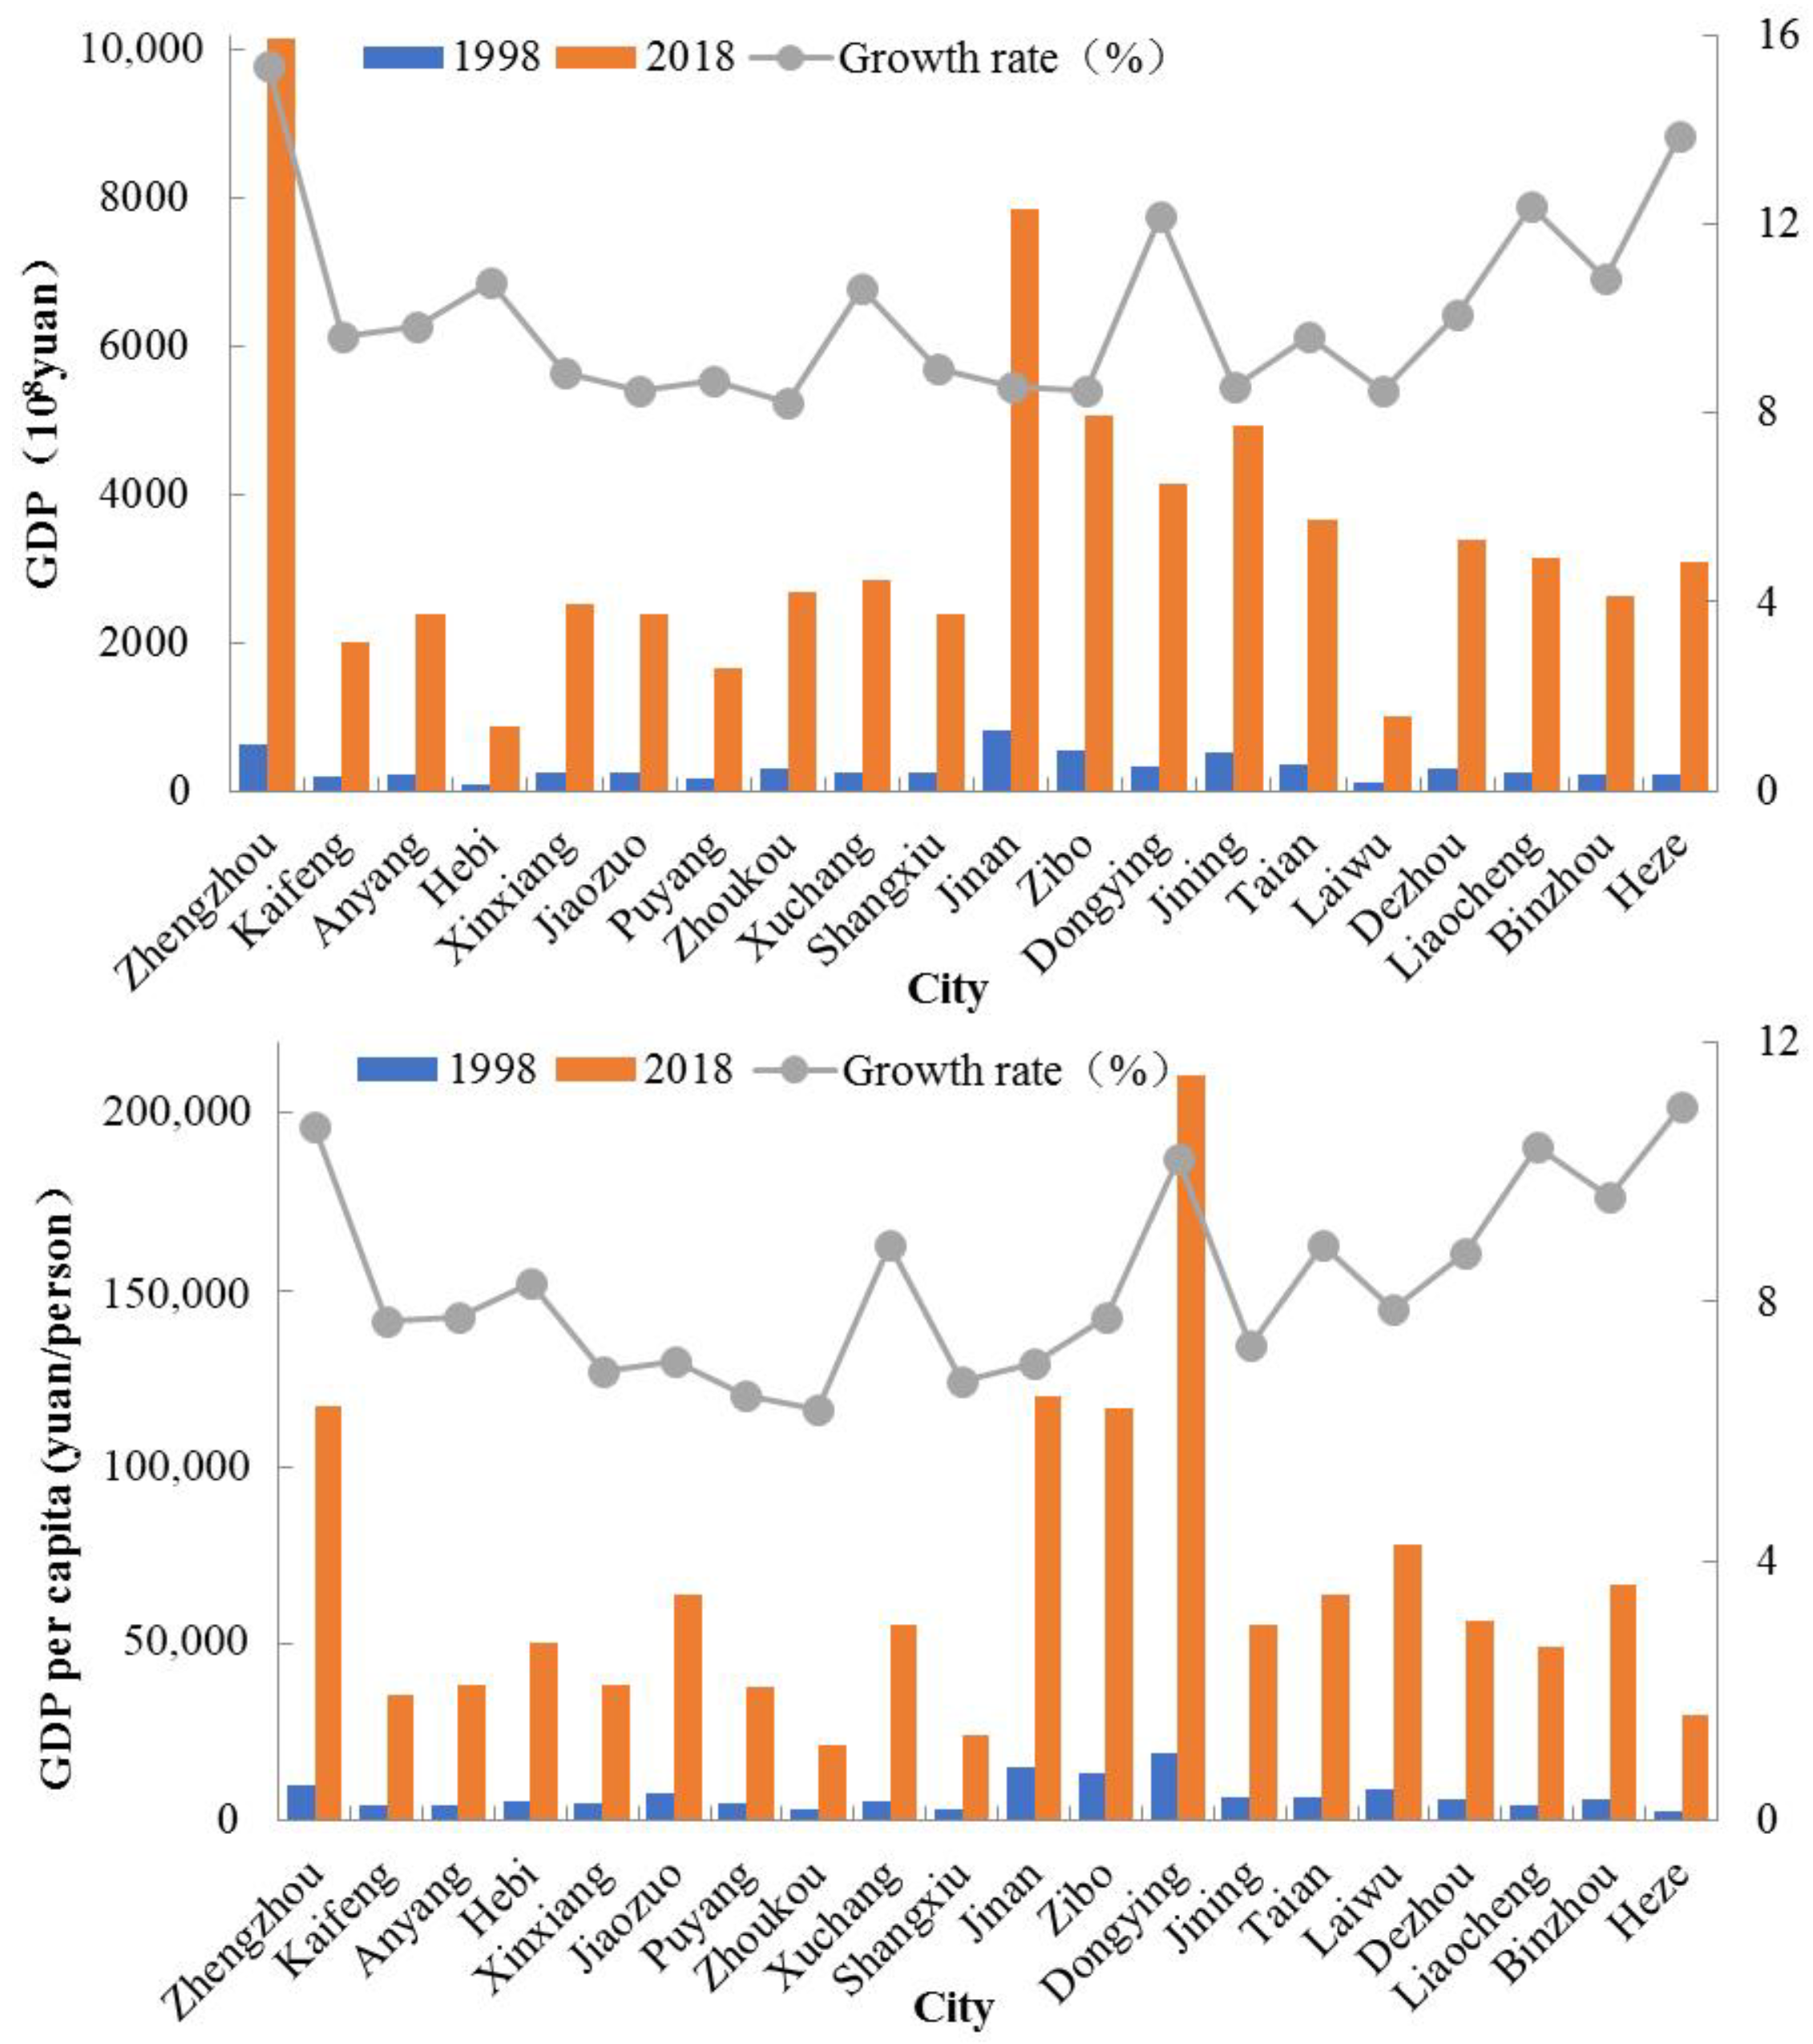
4.2. Characteristics of Economic Development Changes
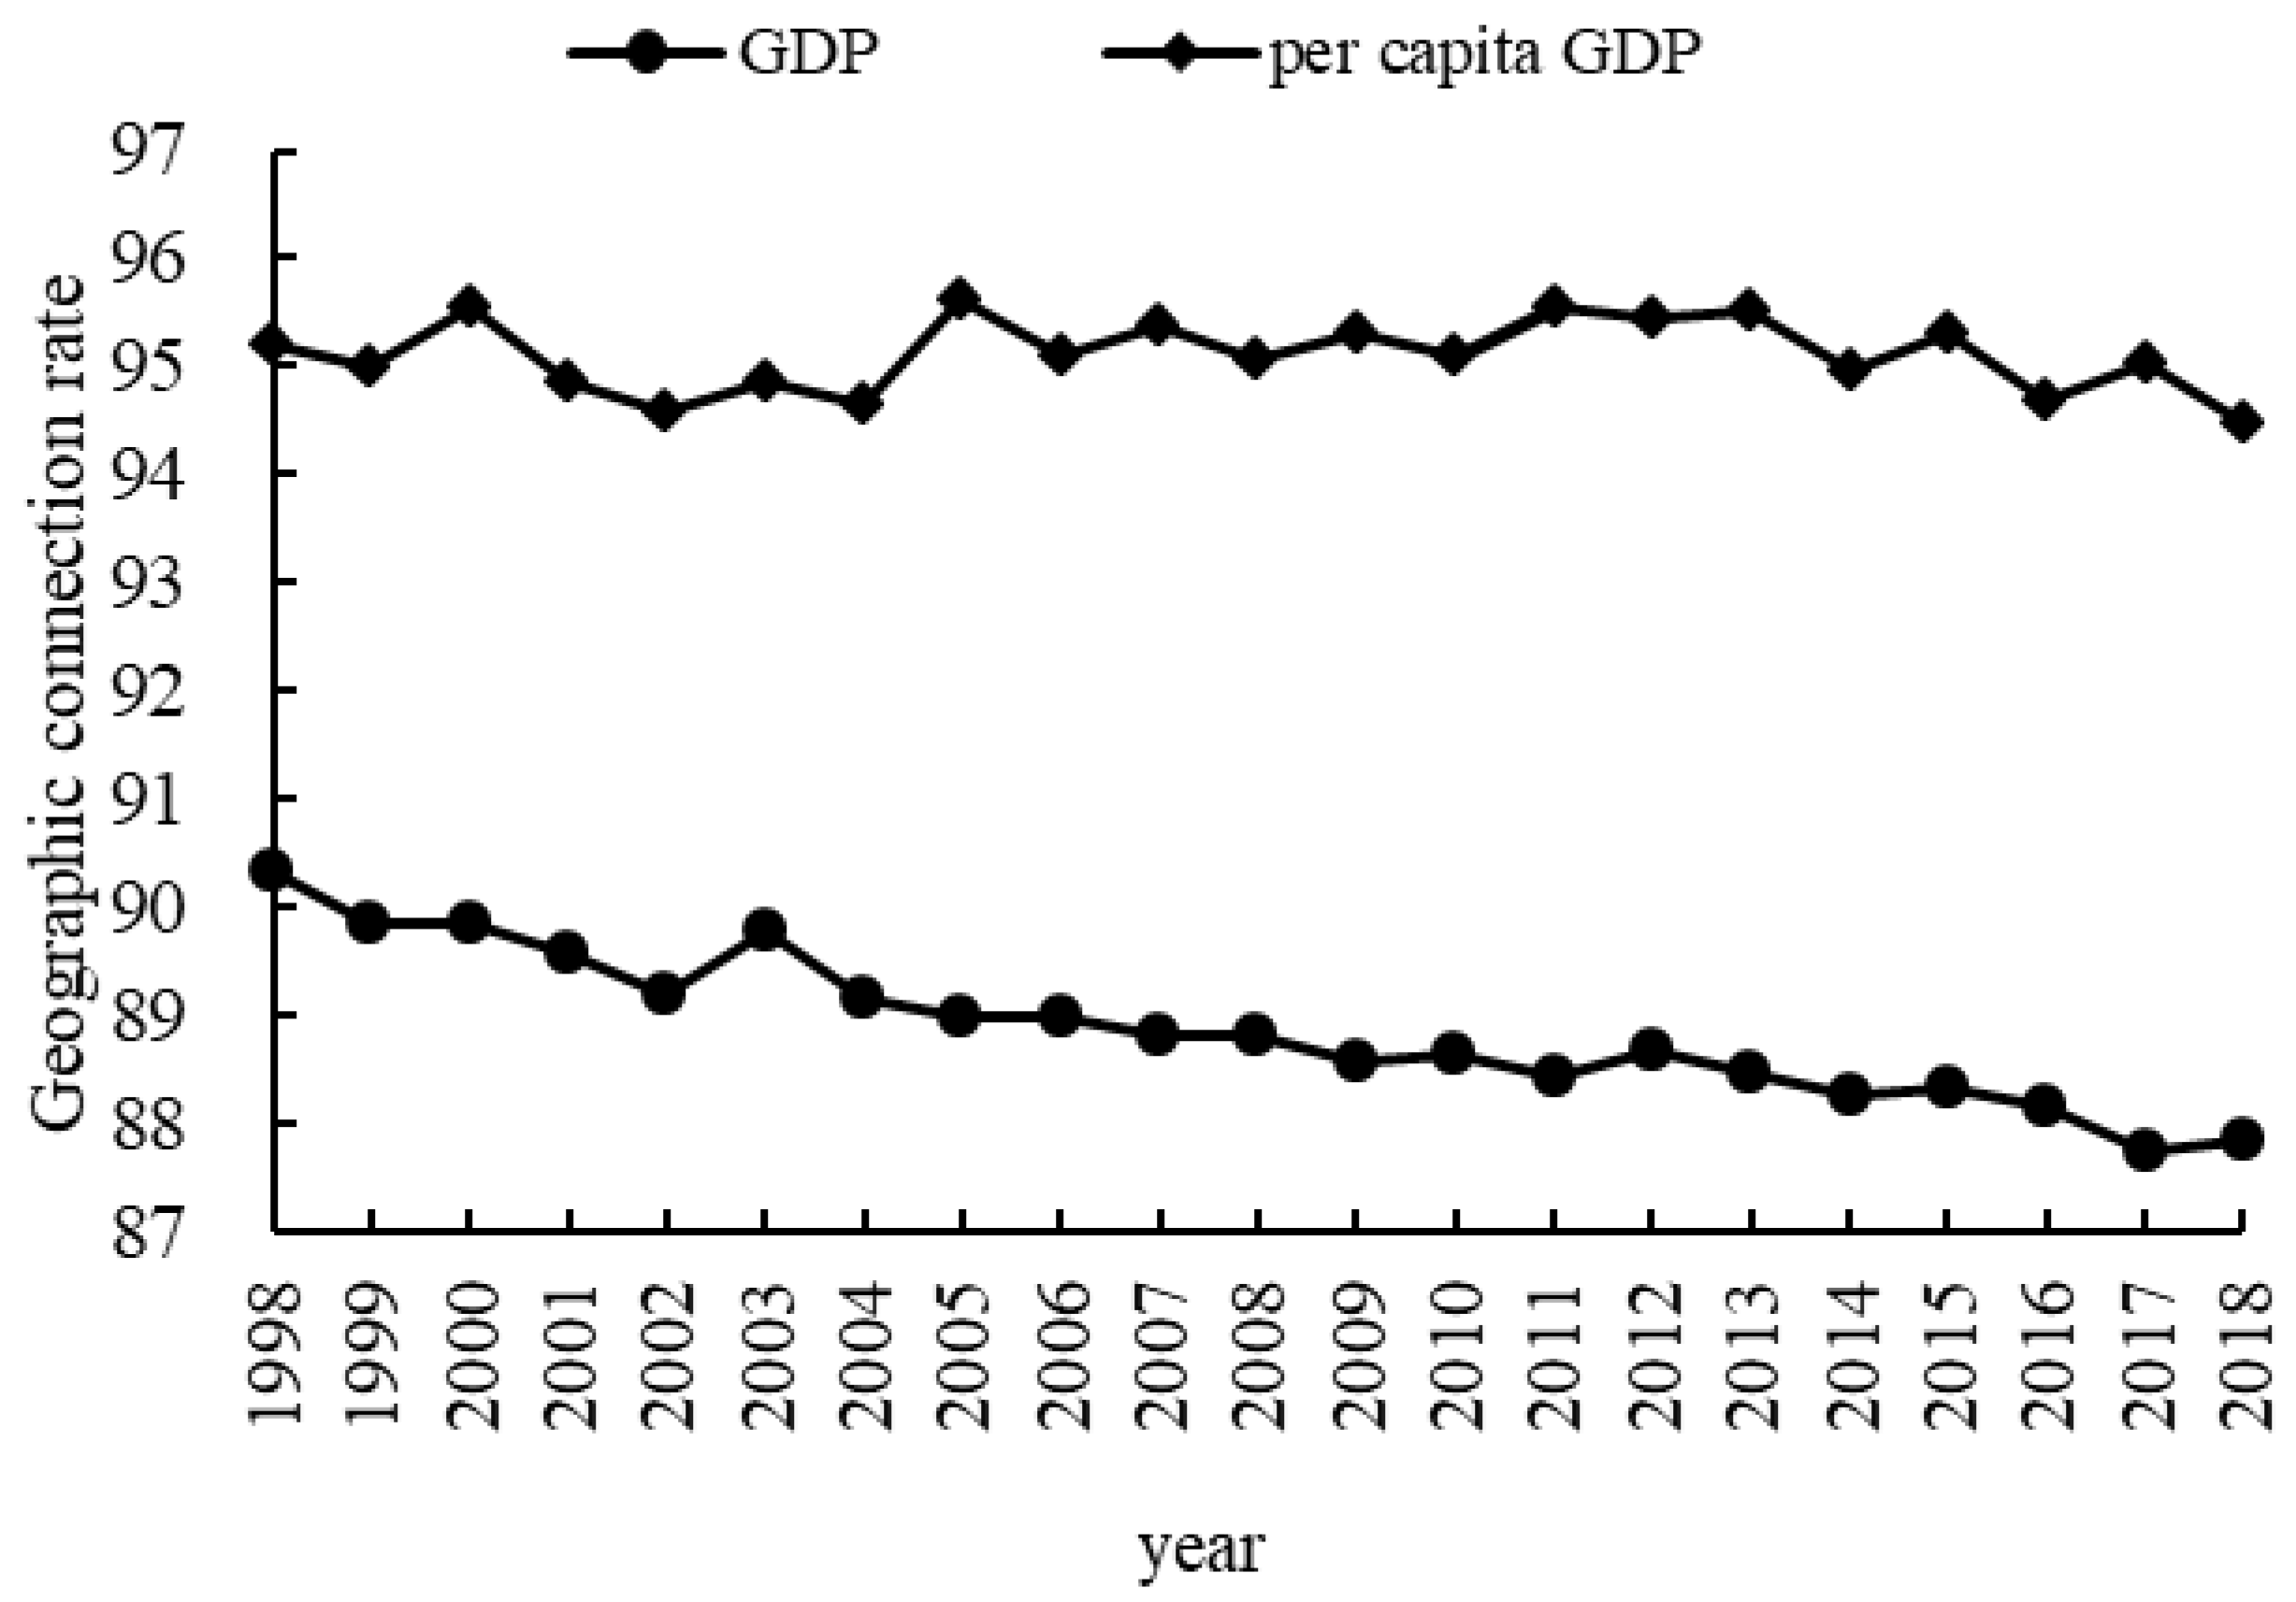
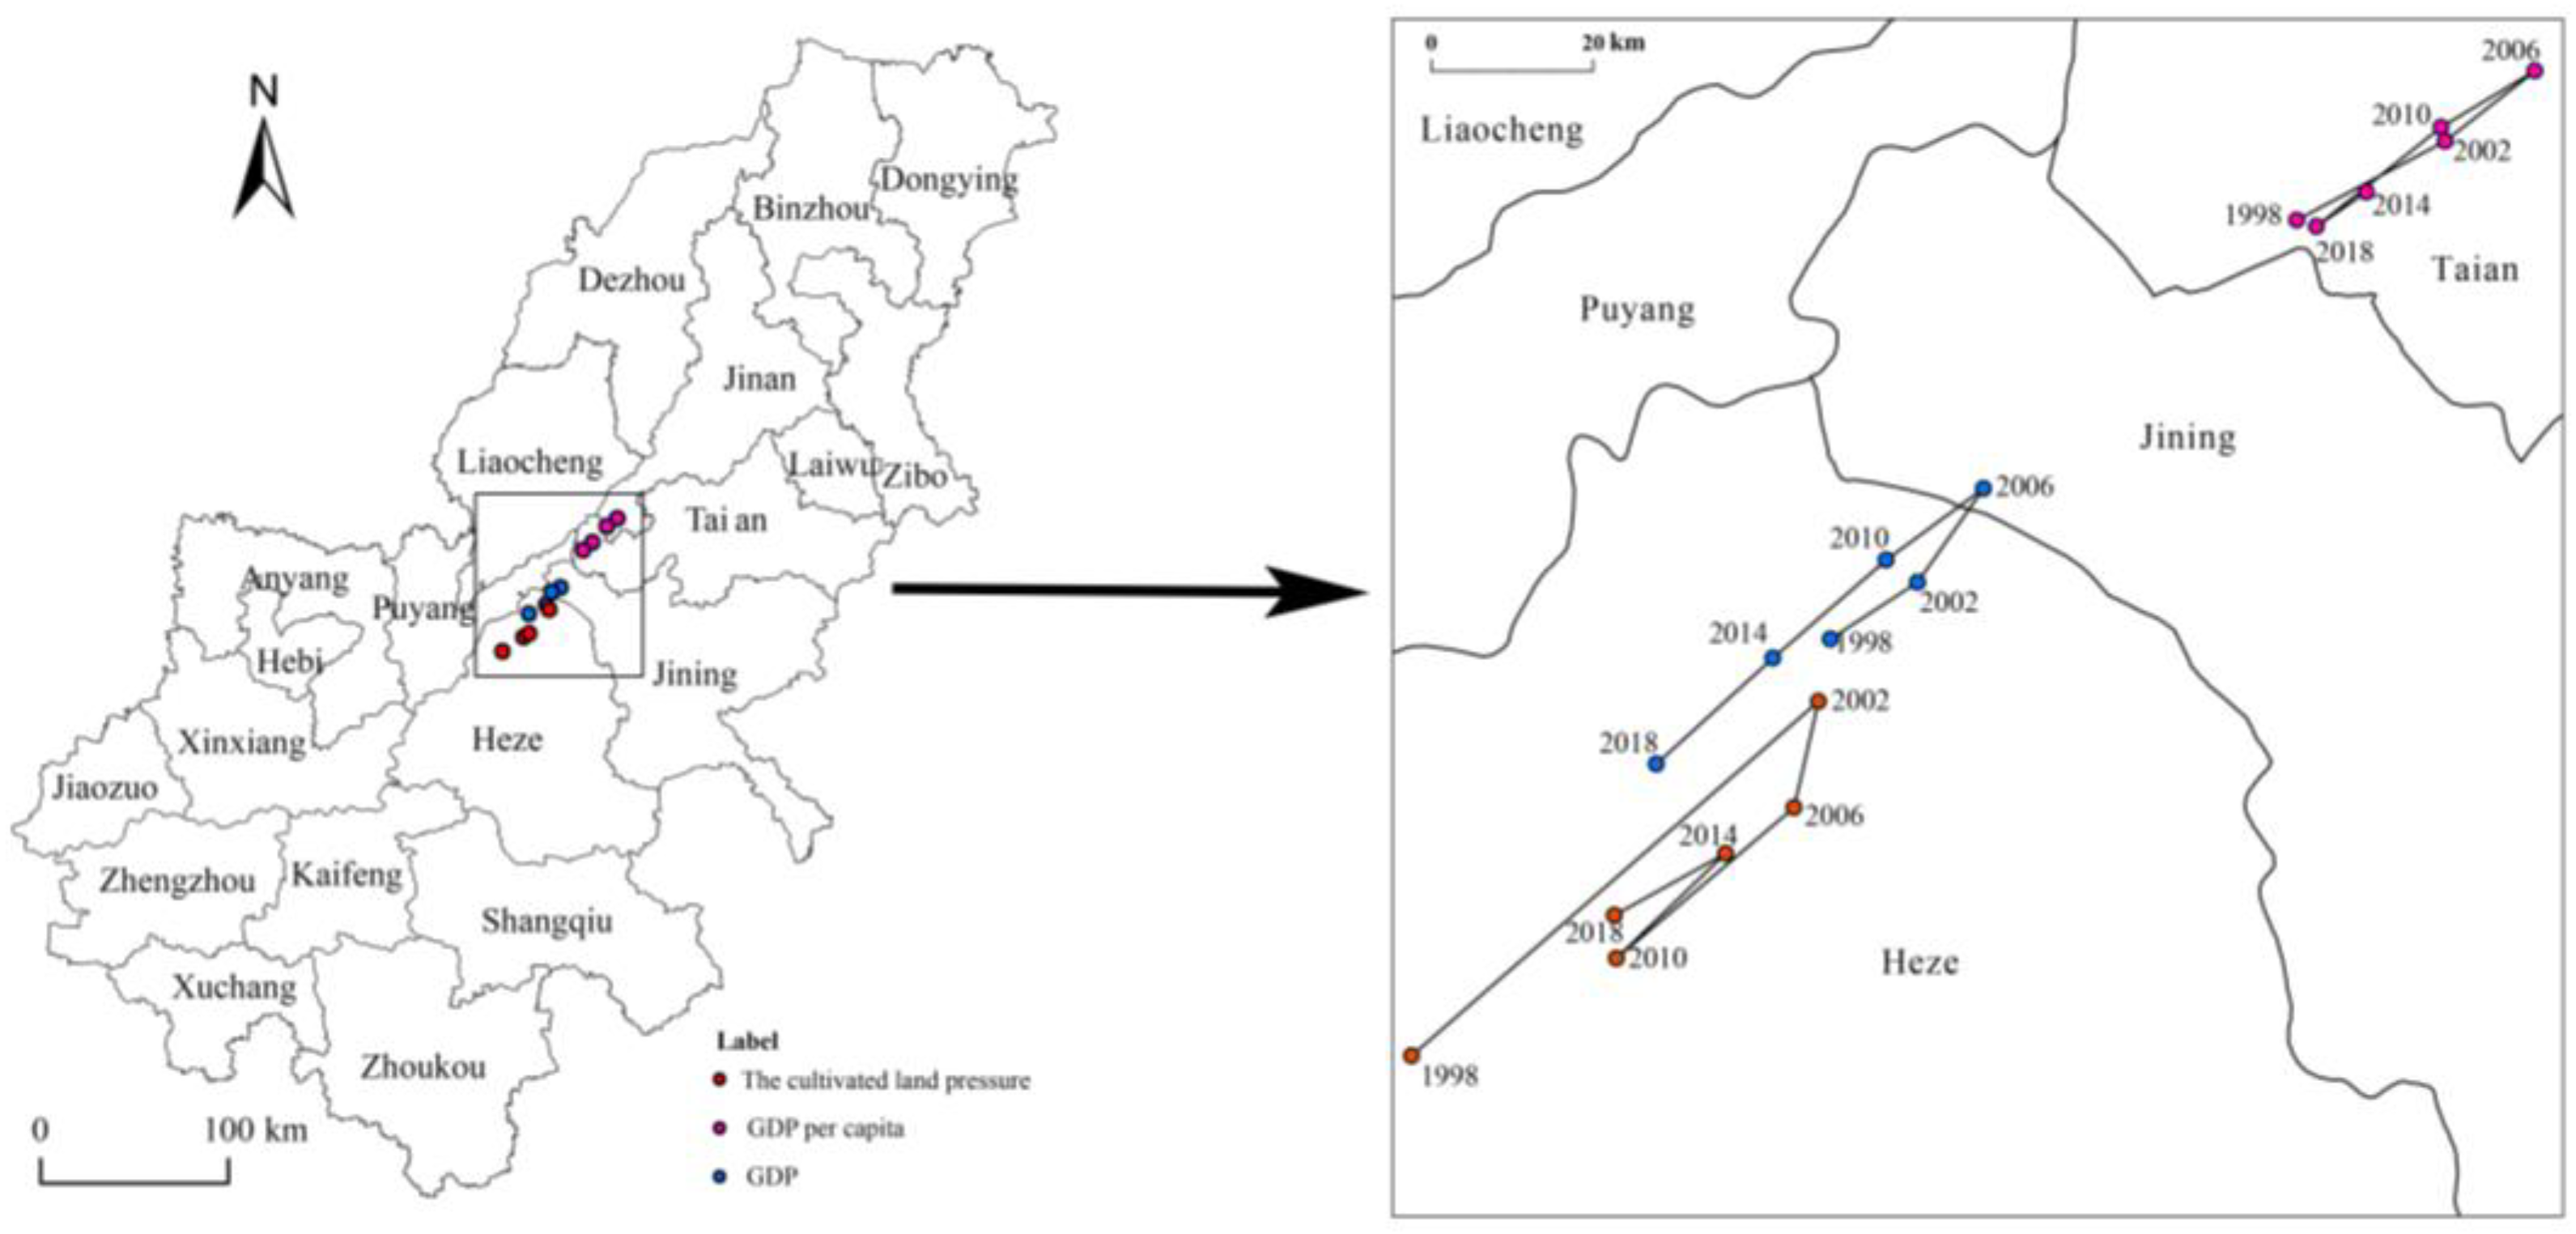
4.3. Geographical Relationship and the Evolution of the Center of Gravity for CLP and Economic Development
4.4. Spatial Differentiation of the Coupling between CLP and Economic Development
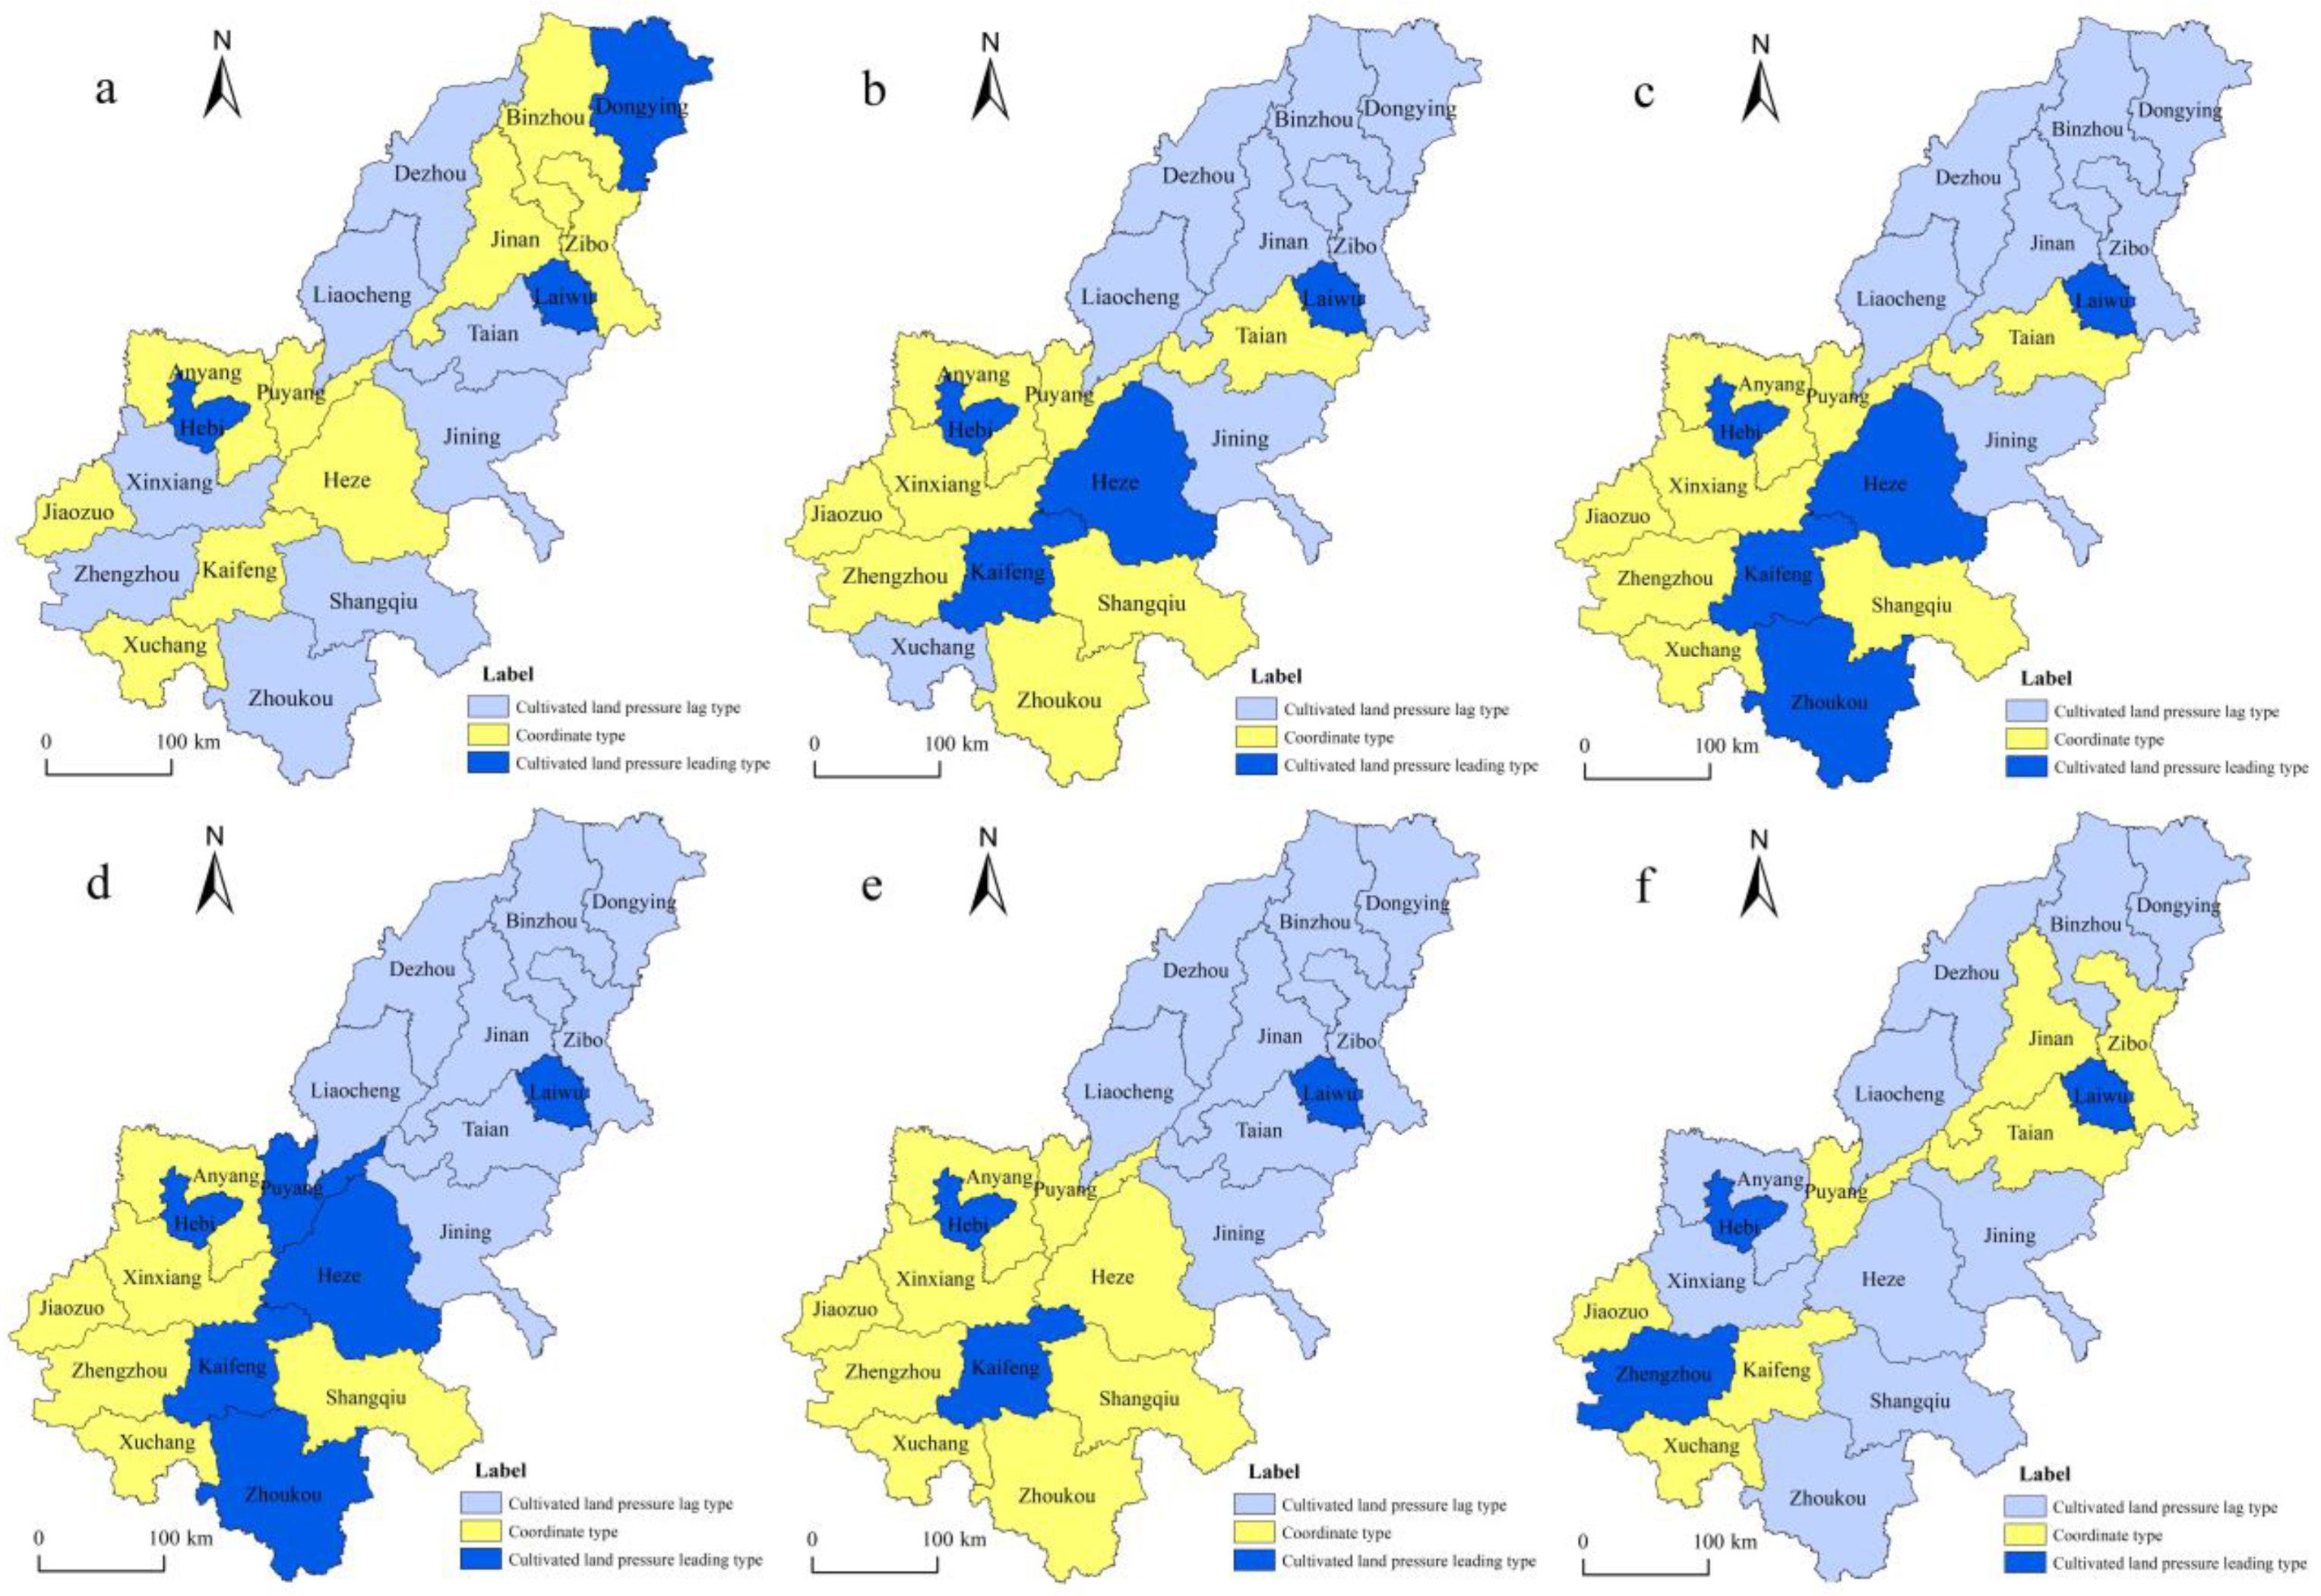
4.4.1. Spatial Coupling Pattern of CLP and Economy
4.4.2. Spatial Coupling Types of CLP and Economy
4.5. Driving Factors of the Coupling Degree between CLP and Economic Development
5. Discussion
6. Conclusions
Author Contributions
Funding
Institutional Review Board Statement
Informed Consent Statement
Data Availability Statement
Acknowledgments
Conflicts of Interest
References
- Li, X.B.; Wang, X.H. Changes in agricultural land use in China: 1981–2000. Asian Geogr. 2003, 22, 27–42. [Google Scholar] [CrossRef]
- Lichtenberg, E.; Ding, C.G. Assessing farmland protection policy in China. Land Use Policy 2008, 25, 59–68. [Google Scholar] [CrossRef]
- Gale, H.F.; Hu, D.H. Food Safety Pressures Push Integration in China’s Agricultural Sector. Am. J. Agr. Econ. 2012, 94, 483–488. [Google Scholar] [CrossRef]
- Zuo, L.J.; Zhang, Z.X.; Carlson, K.M.; Macdonald, G.K.; Brauman, K.A.; Liu, Y.C.; Zhang, W.; Zhang, H.Y.; Wu, W.B.; Zhao, X.L.; et al. Progress towards sustainable intensification in China challenged by land-use change. Nat. Sustain. 2018, 1, 304–313. [Google Scholar] [CrossRef]
- Deng, X.Z.; Huang, J.K.; Rozelle, S.; Zhang, J.P.; Li, Z.H. Impact of urbanization on cultivated land changes in China. Land Use Policy 2015, 45, 1–7. [Google Scholar] [CrossRef]
- Zhang, P.Y.; Yang, D.; Qin, M.Z.; Jing, W.L. Spatial heterogeneity analysis and driving forces exploring of built-up land development intensity in Chinese prefecture-level cities and implications for future Urban Land intensive use. Land Use Policy 2020, 99, 104958. [Google Scholar] [CrossRef]
- Kabila, A.; Selase, K.A.; Seth, A. Peri-urbanisation and loss of arable land in Kumasi Metropolis in three decades: Evidence from remote sensing image analysis. Land Use Policy 2018, 72, 470–479. [Google Scholar]
- Baumann, M.; Radeloff, V.C.; Avedian, V.; Kuemmerle, T. Land-use change in the Caucasus during and after the Nagorno-Karabakh conflict. Reg. Environ. Chang. 2015, 15, 1703–1716. [Google Scholar] [CrossRef]
- Gasparri, N.I.; Grau, H.R.; Sacchi, L.V. Determinants of the spatial distribution of cultivated land in the north argentine dry chaco in a multi-decadal study. J. Arid. Environ. 2015, 123, 31–39. [Google Scholar] [CrossRef]
- Wesström, I.; Joel, A.; Messing, I. Controlled drainage and subirrigation—A water management option to reduce non-point source pollution from agricultural land. Agric. Ecosyst. Environ. 2014, 198, 74–82. [Google Scholar] [CrossRef]
- Ramankutty, N.; Evan, A.T.; Monfreda, C.; Foley, J.A. Farming the planet: 1. Geographic distribution of global agricultural lands in the year 2000. Glob. Biogeochem. Cycles 2008, 22, 1–19. [Google Scholar] [CrossRef]
- Baessler, C.; Klotz, S. Effects of changes in agricultural land-use on landscape structure and arable weed vegetation over the last 50 years. Agric. Ecosyst. Environ. 2006, 115, 43–50. [Google Scholar] [CrossRef]
- Jaiyeoba, I.A. Changes in soil properties due to continuous cultivation in Nigerian semiarid Savannah. Soil Tillage Res. 2003, 70, 91–98. [Google Scholar] [CrossRef]
- Warr, P. Food insecurity and its determinants. Aust. J. Agric. Resour. Econ. 2014, 58, 519–537. [Google Scholar] [CrossRef] [Green Version]
- Park, J.H.; Han, M.H. Modern state formation and land management in South Korea: 1945–1960. Land Use Policy 2018, 78, 662–671. [Google Scholar] [CrossRef]
- McDonald, M.G. Agricultural landholding in Japan: Fifty years after land reform. Geoforum 1997, 28, 55–78. [Google Scholar] [CrossRef]
- Brown, L.R. Who Will Feed China? Wake-Up Call for a Small Planet; WW Norton and Company: New York, NY, USA, 1995. [Google Scholar]
- Godfray, H.C.J.; Beddington, J.R.; Crute, I.R.; Haddad, L.; Lawrence, D.; Muir, J.F.; Pretty, J.; Robinson, S.; Thomas, S.M.; Toulmin, C. Food security: The challenge of feeding 9 billion people. Science 2010, 327, 812–818. [Google Scholar] [CrossRef] [Green Version]
- Sun, X.Q.; Yao, J.; Han, H.; Yang, C.G.; Dong, W.F.; Cao, J.J. Present situation, causes and countermeasures for food security in China. J. Food Saf. Qual. 2015, 6, 10–16. [Google Scholar]
- Carles, C.; Bouvier, G.; Esquirol, Y.; Piel, C.; Migault, L.; Pouchieu, C.; Fabbro-Peray, P.; Lebailly, P.; Baldi, I. Residential proximity to agricultural land and risk of braintumor in the general population. Environ. Res. 2017, 159, 321–330. [Google Scholar] [CrossRef]
- Li, H.; Wu, Y.Z.; Huang, X.J.; Sloan, M.; Skitmore, M. Spatial-temporal evolution and classification of marginalization of cultivated land in the process of urbanization. Habitat Int. 2017, 61, 1–8. [Google Scholar] [CrossRef] [Green Version]
- Li, T.T.; Long, H.L.; Zhang, Y.N.; Tu, S.S.; Ge, D.Z.; Li, Y.R.; Hu, B.Q. Analysis of the spatial mismatch of grain production and farmland resources in China based on the potential crop rotation system. Land Use Policy 2017, 60, 26–36. [Google Scholar] [CrossRef]
- Zhang, P.Y.; Pang, B.; He, J.J.; Guo, Y.; Zhu, L.Q. Coupling relationship and trend of cultivated land productivity and food security: A case study of Henan Province. Sci. Geogr. Sin. 2017, 37, 1392–1402. (In Chinese) [Google Scholar]
- Foley, J.A.; DeFries, R.; Asner, G.P.; Barford, C.; Bonan, G.; Carpenter, S.R.; Chapin, F.S.; Coe, M.T.; Daily, G.C.; Gibbs, H.K.; et al. Global consequences of land use. Science 2005, 309, 570–574. [Google Scholar] [CrossRef] [PubMed]
- Ye, L.M.; Xiong, W.; Li, Z.G.; Yang, P.; Wu, W.B.; Yang, G.X.; Fu, Y.J.; Zou, J.Q.; Chen, Z.X.; Van Ranst, E.; et al. Climate change impact on China food security in 2050. Agron. Sustain. Dev. 2013, 33, 363–374. [Google Scholar] [CrossRef] [Green Version]
- Lai, Z.H.; Chen, M.Q.; Liu, T.J. Changes in and prospects for cultivated land use since the reform and opening up in China. Land Use Policy 2020, 97, 104781. [Google Scholar] [CrossRef]
- Qi, X.X.; Liu, L.M.; Liu, Y.B.; Yao, L. Risk assessment for sustainable food security in China according to integrated food security: Taking Dongting Lake area for example. Environ. Monit. Assess. 2013, 185, 4855–4867. [Google Scholar] [CrossRef] [Green Version]
- Meng, X.J.; Jia, S.F. Current situation and trend of arable land change in China. J. Chin. Geogr. 2000, 10, 220–226. [Google Scholar]
- Liang, X.Y.; Li, Y.B. Identification of spatial coupling between cultivated land functional transformation and settlements in Three Gorges Reservoir Area, China. Habitat Int. 2020, 104, 102236. [Google Scholar] [CrossRef]
- Chai, J.; Wang, Z.Q.; Yang, J.; Zhang, L.G. Analysis for spatial-temporal changes of grain production and farmland resource: Evidence from Hubei Province, central China. J. Clean. Prod. 2019, 207, 474–482. [Google Scholar] [CrossRef]
- Lu, X.; Shi, Y.Y.; Chen, C.L.; Yu, M. Monitoring cropland transition and its impact on ecosystem services value in developed regions of China. Land Use Policy 2017, 69, 25–40. [Google Scholar] [CrossRef]
- Chang, K.T. Introduction to Geographic Information Systems; McGraw-Hill Higher Education: New York, NY, USA, 2015. [Google Scholar]
- Tao, J.; Fu, M.C.; Zhang, D.X.; Zhang, J.J.; Zheng, X.Q. System dynamics modeling for the pressure index of cultivated land in China. J. Food Agric. Environ. 2013, 11, 1045–1049. [Google Scholar]
- Cheng, C.; Liu, Y.L.; Chen, Y.Y.; Liu, Y.F.; Zhang, Y.; Shen, S.S.; Yang, R.F.; Xu, Z.B.; Hong, Y.S. Diagnosing cropland’s allowable range and spatial allocation in China’s typical mountainous plateau area: An evaluation framework based on ecological carrying capacity. Sci. Total Environ. 2019, 685, 1255–1268. [Google Scholar] [CrossRef]
- Liu, J.P.; Guo, Q.B. A spatial panel statistical analysis on cultivated land conversion and Chinese economic growth. Ecol. Indic. 2015, 51, 20–24. [Google Scholar] [CrossRef]
- Xie, H.L.; Chen, Q.R.; Wang, W.; He, Y.F. Analyzing the green efficiency of arable land use in China. Technol. Forecast. Soc. Chang. 2018, 133, 15–28. [Google Scholar] [CrossRef]
- Kuang, B.; Lu, X.; Zhou, M.; Chen, D. Provincial cultivated land use efficiency in China: Empirical analysis based on the SBM-DEA model with carbon emissions considered. Technol. Forecast. Soc. Chang. 2020, 151, 119874. [Google Scholar] [CrossRef]
- Ting, Y.; Xiang, P.A. Emergy analysis of paddy farming in Hunan Province, China: A new perspective on sustainable development of agriculture. J. Integr. Agric. 2016, 15, 2426–2436. [Google Scholar]
- Long, H.L. Land use policy in China: Introduction. Land Use Policy 2014, 40, 1–5. [Google Scholar] [CrossRef]
- Li, J.S.; Sun, W.; Li, M.Y.; Meng, L.L. Coupling coordination degree of production, living and ecological spaces and its influencing factors in the Yellow River Basin. J. Clean. Prod. 2021, 298, 126803. [Google Scholar] [CrossRef]
- Geng, W.L.; Li, Y.Y.; Zhang, P.Y.; Yang, D.; Jing, W.L.; Rong, T.Q. Analyzing spatio-temporal changes and trade-offs/synergies among ecosystem services in the Yellow River Basin, China. Ecol. Indic. 2022, 138, 108825. [Google Scholar] [CrossRef]
- Rees, W.E. Ecological Footprints and Appropriated Carrying Capacity: What Urban Economics Leaves Out. Urbanisation 2017, 2, 66–77. [Google Scholar] [CrossRef]
- Lu, C.P.; Hou, M.C.; Liu, Z.L.; Li, H.J.; Lu, C.Y. Variation Characteristic of NDVI and its Response to Climate Change in the Middle and Upper Reaches of Yellow River Basin, China. IEEE J. Sel. Top. Appl. Earth Obs. Remote Sens. 2021, 14, 8484–8496. [Google Scholar] [CrossRef]
- Yang, D.; Zhang, P.Y.; Jiang, L.; Zhang, Y.; Liu, Z.Y.; Rong, T.Q. Spatial change and scale dependence of built-up land expansion and landscape pattern evolution—Case study of affected area of the lower Yellow River. Ecol. Indic. 2022, 141, 109123. [Google Scholar] [CrossRef]
- Su, H.M.; He, A.X. Analysis and Forecast of the Arable Land Resource and Food Production Safety in Anhui Province. Appl. Mech. Mater. 2013, 253–255, 229–232. [Google Scholar] [CrossRef]
- Krackhardt, D. Graph theoretical dimensions of informal organizations. In Computational Organization Theory; Psychology Press: London, UK, 2014; pp. 107–130. [Google Scholar]
- Zhou, L.; Hu, F.N.; Wang, B.; Wei, C.Z.; Sun, D.Q.; Wang, S.H. Relationship between urban landscape structure and land surface temperature: Spatial hierarchy and interaction effects. Sustain. Cities Soc. 2022, 80, 103795. [Google Scholar] [CrossRef]
- Ellision, G.; Glaeser, E.L. Geographic concentration in U.S. Manufacturing industries: A dartboard approach. J. Urban Econ. 1997, 105, 889–927. [Google Scholar] [CrossRef] [Green Version]
- Zhu, H.B.; Zhang, A.L. Analyzing temporal and spatial distribution characteristic of pressure index of cultivated land in China. Resour. Sci. 2007, 29, 104–108. [Google Scholar]
- Wang, J.F.; Zhang, T.L.; Fu, B.J. A measure of spatial stratified heterogeneity. Ecol. Indic. 2016, 67, 250–256. [Google Scholar] [CrossRef]
- Li, Z.F.; Liu, H.Y. Analysis of relationships between cultivated land occupation and economic growth in Jiangsu province based on decoupling theory. Editor. Off. Trans. Chin. Soc. Agric. Eng. 2013, 29, 237–243. [Google Scholar]
- Xin, L.J.; Wang, J.Y.; Wang, L.X. Prospect of per capita grain demand driven by dietary structure change in China. Resour. Sci. 2015, 37, 1347–1356. [Google Scholar]
- Yang, Q.; Yang, Z.S. The measurement and grading of pressure on cultivated land in city-level in Yunnan province. Agric. Sci. Technol. 2015, 16, 1562–1564. [Google Scholar]
- Yang, R.H.; Yang, Q.Y.; Chen, Y.D.; Zeng, L. Spatial-temporal characteristics of coupling of cultivated land pressure with economic development in Hebei Province. China Agric. Resour. Reg. Plan. 2018, 39, 18–27. [Google Scholar]
- Song, X.Q.; Huang, Y.; Wu, Z.F.; Zhu, O.Y. Does cultivated land function transition occur in China? J. Geogr. Sci. 2015, 25, 817–835. [Google Scholar] [CrossRef]
- Cheng, L.; Jiang, P.H.; Chen, W.; Li, M.C.; Wang, L.Y.; Gong, Y.; Pian, Y.Z.; Xia, N.; Duan, Y.W.; Huang, Q.H. Farmland Protection Policies and Rapid Urbanization in China: A Case Study for Changzhou City. Land Use Policy 2015, 48, 552–566. [Google Scholar]
- Zhang, Y.; Li, X.B.; Song, W.; Zhai, L. Land abandonment under rural restructuring in China explained from a cost-benefit perspective. J. Rural Stud. 2016, 47, 524–532. [Google Scholar] [CrossRef]
- Li, W.B.; Wang, D.Y.; Liu, S.H.; Zhu, Y.L. Measuring urbanization-occupation and internal conversion of peri-urban cultivated land to determine changes in the peri-urban agriculture of the black soil region. Ecol. Indic. 2019, 102, 328–337. [Google Scholar] [CrossRef]
- Luo, X.; Luo, J.; Zhang, L. Effects of labor market regulation on technology innovation: An empirical research based on the World Bank China-Enterprise Survey data. China Popul. Sci. 2015, 4, 47–59. [Google Scholar]
- Huang, J.K.; Yang, G.L. Understanding recent challenges and new food policy in China. Glob. Food Secur. 2017, 12, 119–126. [Google Scholar] [CrossRef]
- Wu, Y.Z.; Shan, L.P.; Guo, Z.; Peng, Y. Cultivated Land Protection Policies in China Facing 2030: Dynamic Balance System Versus Basic Farmland Zoning. Habitat Int. 2017, 69, 126–138. [Google Scholar] [CrossRef]
- Yan, H.M.; Liu, J.Y.; Huang, H.Q.; Dong, J.W.; Xu, X.L.; Wang, J.B. Impacts of cropland transformation on agricultural production under urbanization and grain for green project in China. Acta Geogr. Sin. 2012, 67, 579–588. [Google Scholar]
- Zhang, Z.X.; Wen, Q.K.; Liu, F.; Zhao, X.L.; Liu, B.; Xu, J.Y.; Yi, L.; Hu, S.G.; Wang, X.; Zuo, L.J.; et al. Urban expansion in China and its effect on cultivated land before and after initiating “Reform and Open Policy”. Sci. China-Earth Sci. 2016, 59, 1930–1945. [Google Scholar] [CrossRef]
- Jiang, L.; Deng, X.Z.; Seto, K.C. The impact of urban expansion on agricultural land use intensity in China. Land Use Policy 2013, 35, 33–39. [Google Scholar] [CrossRef]
- Von Der Dunk, A.; Gret-Regamey, A.; Dalang, T.; Hersperger, A.M. Defining a typology of peri-urban land-use conflicts—A case study from Switzerland. Landsc. Urban Plan. 2011, 101, 149–156. [Google Scholar] [CrossRef]
- Cai, Y.L.; Wang, Y.; Li, Y.P. Study on changing relationship of demand and supply cultivated land in China. China Land Sci. 2009, 23, 11–18. [Google Scholar]
- Liu, Y.S.; Yang, Y.Y.; Li, Y.R.; Li, J.T. Conversion from Rural Settlements and Arable Land under Rapid Urbanization in Beijing during 1985–2010. J. Rural Stud. 2017, 51, 141–150. [Google Scholar] [CrossRef]


| City | 2002 | 2010 | 2018 | |||||||||
|---|---|---|---|---|---|---|---|---|---|---|---|---|
| R1 | R2 | R3 | I | R1 | R2 | R3 | I | R1 | R2 | R3 | I | |
| Zhengzhou | 1.83 | 2.11 | 1.47 | 1.06 | 2.30 | 2.43 | 1.35 | 1.32 | 2.76 | 3.00 | 1.80 | 1.96 |
| Kaifeng | 1.04 | 0.71 | 0.67 | 1.51 | 1.24 | 0.64 | 0.65 | 1.93 | 1.12 | 0.71 | 0.65 | 1.14 |
| Anyang | 0.95 | 0.71 | 0.61 | 1.44 | 0.90 | 0.79 | 0.72 | 1.19 | 0.85 | 0.71 | 0.59 | 0.95 |
| Hebi | 2.42 | 0.81 | 2.57 | 1.96 | 2.55 | 0.88 | 2.75 | 1.91 | 2.48 | 0.87 | 2.64 | 1.86 |
| Xinxiang | 0.66 | 0.70 | 0.58 | 1.03 | 0.74 | 0.65 | 0.55 | 1.25 | 0.63 | 0.67 | 0.53 | 0.81 |
| Jiaozuo | 1.60 | 1.19 | 1.59 | 1.17 | 1.73 | 1.37 | 1.85 | 1.10 | 1.66 | 1.28 | 1.78 | 1.29 |
| Puyang | 1.20 | 0.94 | 1.19 | 1.14 | 1.46 | 0.81 | 1.07 | 1.58 | 1.36 | 0.87 | 1.04 | 1.21 |
| Zhoukou | 0.48 | 0.58 | 0.25 | 1.38 | 0.54 | 0.46 | 0.23 | 1.78 | 0.44 | 0.50 | 0.20 | 0.69 |
| Xichang | 1.20 | 1.23 | 1.23 | 0.97 | 1.36 | 1.18 | 1.29 | 1.11 | 1.28 | 1.25 | 1.27 | 1.14 |
| Shangqiu | 0.52 | 0.54 | 0.30 | 1.35 | 0.55 | 0.48 | 0.30 | 1.50 | 0.48 | 0.49 | 0.25 | 0.74 |
| Jinan | 1.10 | 2.48 | 1.94 | 0.50 | 0.98 | 2.14 | 1.49 | 0.56 | 1.22 | 2.17 | 1.71 | 1.37 |
| Zibo | 1.91 | 2.22 | 2.41 | 0.82 | 1.54 | 2.15 | 2.24 | 0.70 | 1.96 | 1.87 | 2.23 | 1.46 |
| Dongying | 0.86 | 1.15 | 2.95 | 0.52 | 1.12 | 1.33 | 3.09 | 0.60 | 0.61 | 1.11 | 2.92 | 0.83 |
| Jining | 0.61 | 1.18 | 0.66 | 0.72 | 0.61 | 1.00 | 0.58 | 0.83 | 0.63 | 0.97 | 0.56 | 0.81 |
| Taian | 1.12 | 1.12 | 0.92 | 1.11 | 0.88 | 1.18 | 1.01 | 0.81 | 1.12 | 1.04 | 0.94 | 1.06 |
| Laiwu | 7.66 | 1.07 | 3.85 | 4.58 | 7.77 | 1.09 | 3.97 | 4.54 | 8.43 | 0.99 | 3.96 | 4.76 |
| Dezhou | 0.49 | 0.75 | 0.62 | 0.72 | 0.30 | 0.72 | 0.61 | 0.46 | 0.30 | 0.72 | 0.62 | 0.57 |
| Liaocheng | 0.62 | 0.73 | 0.58 | 0.96 | 0.51 | 0.83 | 0.69 | 0.67 | 0.54 | 0.81 | 0.65 | 0.74 |
| Binzhou | 0.66 | 0.61 | 0.75 | 0.98 | 0.51 | 0.72 | 0.91 | 0.63 | 0.40 | 0.60 | 0.79 | 0.63 |
| Heze | 0.66 | 0.34 | 0.18 | 2.80 | 0.53 | 0.45 | 0.26 | 1.63 | 0.42 | 0.56 | 0.28 | 0.66 |
| Period | X1 | X2 | X3 | X4 | X5 | X6 | X7 |
|---|---|---|---|---|---|---|---|
| 1998–2002 | 0.181 | 0.265 | 0.154 | 0.348 | 0.173 | 0.217 | 0.169 |
| 2003–2006 | 0.232 | 0.140 | 0.130 | 0.188 | 0.214 | 0.135 | 0.166 |
| 2007–2010 | 0.227 | 0.186 | 0.203 | 0.170 | 0.184 | 0.113 | 0.165 |
| 2011–2014 | 0.177 | 0.199 | 0.152 | 0.214 | 0.146 | 0.169 | 0.165 |
| 2015–2018 | 0.181 | 0.266 | 0.154 | 0.349 | 0.173 | 0.218 | 0.169 |
Publisher’s Note: MDPI stays neutral with regard to jurisdictional claims in published maps and institutional affiliations. |
© 2022 by the authors. Licensee MDPI, Basel, Switzerland. This article is an open access article distributed under the terms and conditions of the Creative Commons Attribution (CC BY) license (https://creativecommons.org/licenses/by/4.0/).
Share and Cite
Yang, D.; Liu, Z.; Zhang, P.; Chen, Z.; Chang, Y.; Wang, Q.; Zhang, X.; Lu, R.; Li, M.; Xing, G.; et al. Understanding Relationships between Cultivated Land Pressure and Economic Development Level across Spatiotemporal Characteristics: Implications for Supporting Land-Use Management Decisions. Int. J. Environ. Res. Public Health 2022, 19, 16362. https://doi.org/10.3390/ijerph192316362
Yang D, Liu Z, Zhang P, Chen Z, Chang Y, Wang Q, Zhang X, Lu R, Li M, Xing G, et al. Understanding Relationships between Cultivated Land Pressure and Economic Development Level across Spatiotemporal Characteristics: Implications for Supporting Land-Use Management Decisions. International Journal of Environmental Research and Public Health. 2022; 19(23):16362. https://doi.org/10.3390/ijerph192316362
Chicago/Turabian StyleYang, Dan, Zhenyue Liu, Pengyan Zhang, Zhuo Chen, Yinghui Chang, Qianxu Wang, Xinyue Zhang, Rong Lu, Mengfan Li, Guangrui Xing, and et al. 2022. "Understanding Relationships between Cultivated Land Pressure and Economic Development Level across Spatiotemporal Characteristics: Implications for Supporting Land-Use Management Decisions" International Journal of Environmental Research and Public Health 19, no. 23: 16362. https://doi.org/10.3390/ijerph192316362