Article

16 Years (2006–2021) of Surface Ozone Measurements in Córdoba (Southern Spain): Trends and the Impact of the COVID-19 Lockdown

by
Miguel A. Hernández-Ceballos
*,
Alberto Jiménez-Solano
and
Julio Torres-Fernández
Department of Physics, University of Cordoba, 14071 Cordoba, Spain
*
Author to whom correspondence should be addressed.
Int. J. Environ. Res. Public Health 2022, 19(23), 16210; https://doi.org/10.3390/ijerph192316210
Submission received: 27 October 2022 / Revised: 29 November 2022 / Accepted: 1 December 2022 / Published: 3 December 2022
(This article belongs to the Special Issue Advances in Air Pollution Meteorology Research)

Abstract

:
Surface ozone concentrations (O3) during the period 2006–2021 are analysed at Córdoba city (southern Iberian Peninsula) in suburban and urban sampling sites. The aims are to present the levels and temporal variations, to explore trends and to quantity the variation in O3 concentrations in the context of the COVID-19 lockdown. The O3 means are higher in the suburban station (62 µg m−3 and 51.3 µg m−3), being the information level threshold only exceeded twice during this period. The daily evolution shows a maximum at about 17:00 UTC, whereas the minimum is reached at about 9:00 UTC, with higher levels in the suburban station. The seasonal evolution of this daily cycle also presents monthly differences in shape and intensity between stations. The trends are analysed by means of daily averages and daily 5th and 95th percentiles, and they show a similar increase in all of these parameters, with special emphasis on the daily P95 concentrations, with 0.27 µg m−3 year−1 and 0.24 µg m−3 year−1. Finally, the impact of the COVID-19 lockdown shows a decline in O3 concentrations over 10%.

1. Introduction

Ozone is a short-lived trace gas that, at the surface, is a pollutant, and hence, at high levels, it is harmful to both human and plant health [1]. Ozone can have a tropospheric and stratospheric origin. While it is formed naturally in the stratosphere and then transported to surface layers, in the troposphere, it is formed by the interaction of ultraviolet light with chemicals (nitrogen oxides, nonmethane volatile organic compounds, methane or carbon monoxide) emitted by natural and anthropogenic sources [2].
Globally, the spatial and temporal distribution of tropospheric ozone, also known as surface-level ozone (O3), is largely analysed, either by observations or numerical simulations [3,4,5]. In this sense, O3 concentrations and trends widely depend on the location of the sampling site. For instance, O3 has decreased since 2000 at coastal stations and at mountain sites [6,7], while at non-urban stations, it presents increasing and decreasing trends depending on the season [8]. Considering this spatial and temporal variability, the greater number of sampling sites at specific locations evaluated, the better the picture of the O3 trends we have.
In this context, many studies have pointed out that the western Mediterranean, due to its morphological characteristics and the development of mesoscale circulations [9], is a region highly affected by O3 pollution, with accumulated concentrations exceeding the threshold levels indicated by the World Health Organization “https://www.who.int/news-room/fact-sheets/detail/ambient-(outdoor)-air-quality-and-health (accessed on 5 September 2022)”. Within this region, the Guadalquivir Valley is one of three major O3 hotspots in Spain [10]. This valley (650 km and 57,000 km2) crosses the Andalusia region (southern Iberian Peninsula) along the southwest–northeast axis (Figure 1). The location within the valley of significant emission sources of both biogenic (Doñana National Park) and anthropogenic (e.g., Seville metropolitan area, Huelva, Cádiz, Jaén and Córdoba cities and the industrial area of Huelva) together with high levels of temperature and solar radiation play a key role in driving the occurrence of O3 events. Many authors have investigated the temporal and spatial variability of O3 in this specific region and the relationship with synoptic weather, and local and regional circulation patterns [11,12].
Previous studies [13,14] found persistent and high O3 concentrations in monitoring stations located in Córdoba city, which is a medium-sized city (approximately 340,000 inhabitants) placed in the middle of the valley and close to the Sierra Morena Mountain chain to the north. O3 concentrations in Córdoba were recently used to understand the local and remote contributions to O3 in a pollution event in the Guadalquivir valley [10], and O3 peak concentrations in Córdoba were included in [15] to understand the phenomenology of high O3 pollution in the Guadalquivir valley. However, to the authors’ knowledge, this is the first time that O3 concentrations in Córdoba have been solely studied. Doing this, the present analysis and results complement the previous analysis of O3 performed in this region, and at the same time, will allow the investigation of the usefulness of control strategies implemented in cities to improve air quality.
The present paper, hence, characterises and analyses changes of near-surface O3 concentrations in Córdoba city. To investigate the spatial and temporal variability at different locations within the city, we used 16 years (2006–2021) of continuous hourly O3 measurements at two surface monitoring stations. The possibility to work with this long time series ensured a large and statistically representative sample, hence allowing the possibility to determine long-term changes in the O3 concentrations at this specific site. In this sense, O3 trends during this period are studied based on daily averages and daily 95th and 5th percentiles [16].
This O3 time series covers the COVID-19 health crisis, which has been extensively analysed in terms of air quality all around the world [17,18]. In Spain [19], an analysis was performed on how O3 concentrations changed during this period at different monitoring stations, although Córdoba city was not considered in the study. Therefore, the present study is also the first analysis describing the impact of this special period on the O3 concentrations in this city.
In general, the following research issues are addressed:
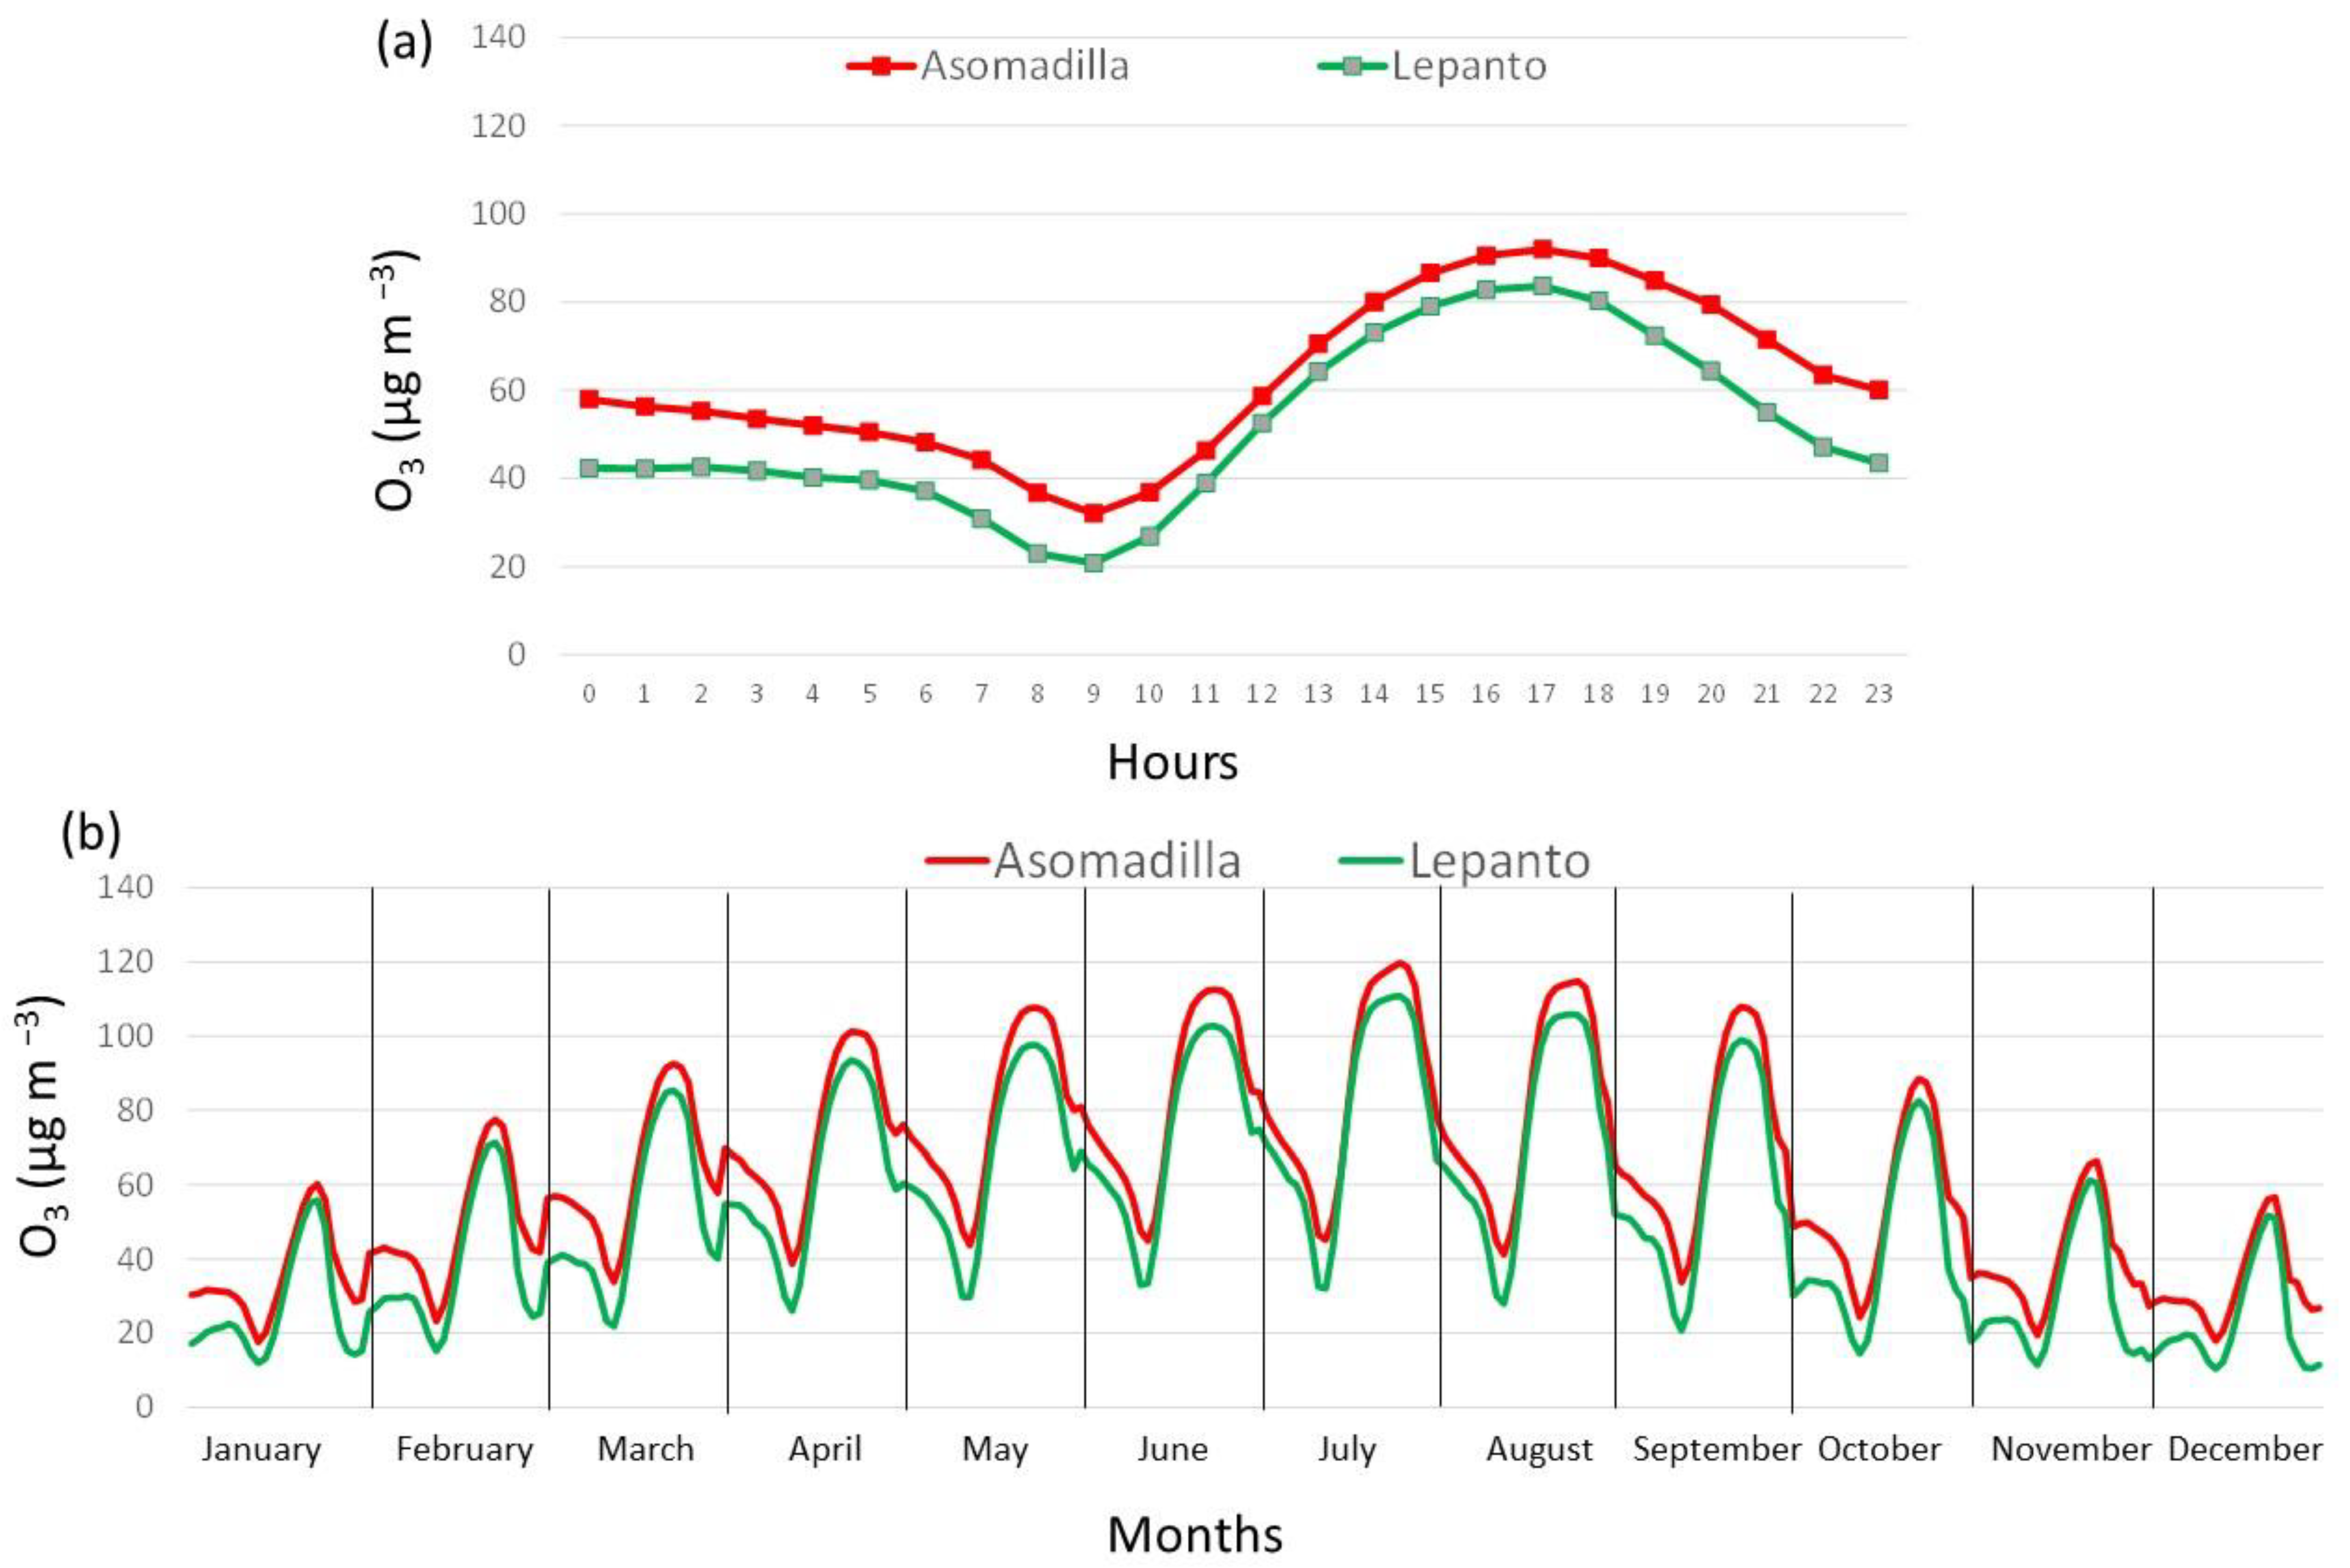
To compare between O3 concentrations at two monitoring stations placed in different urban environments;
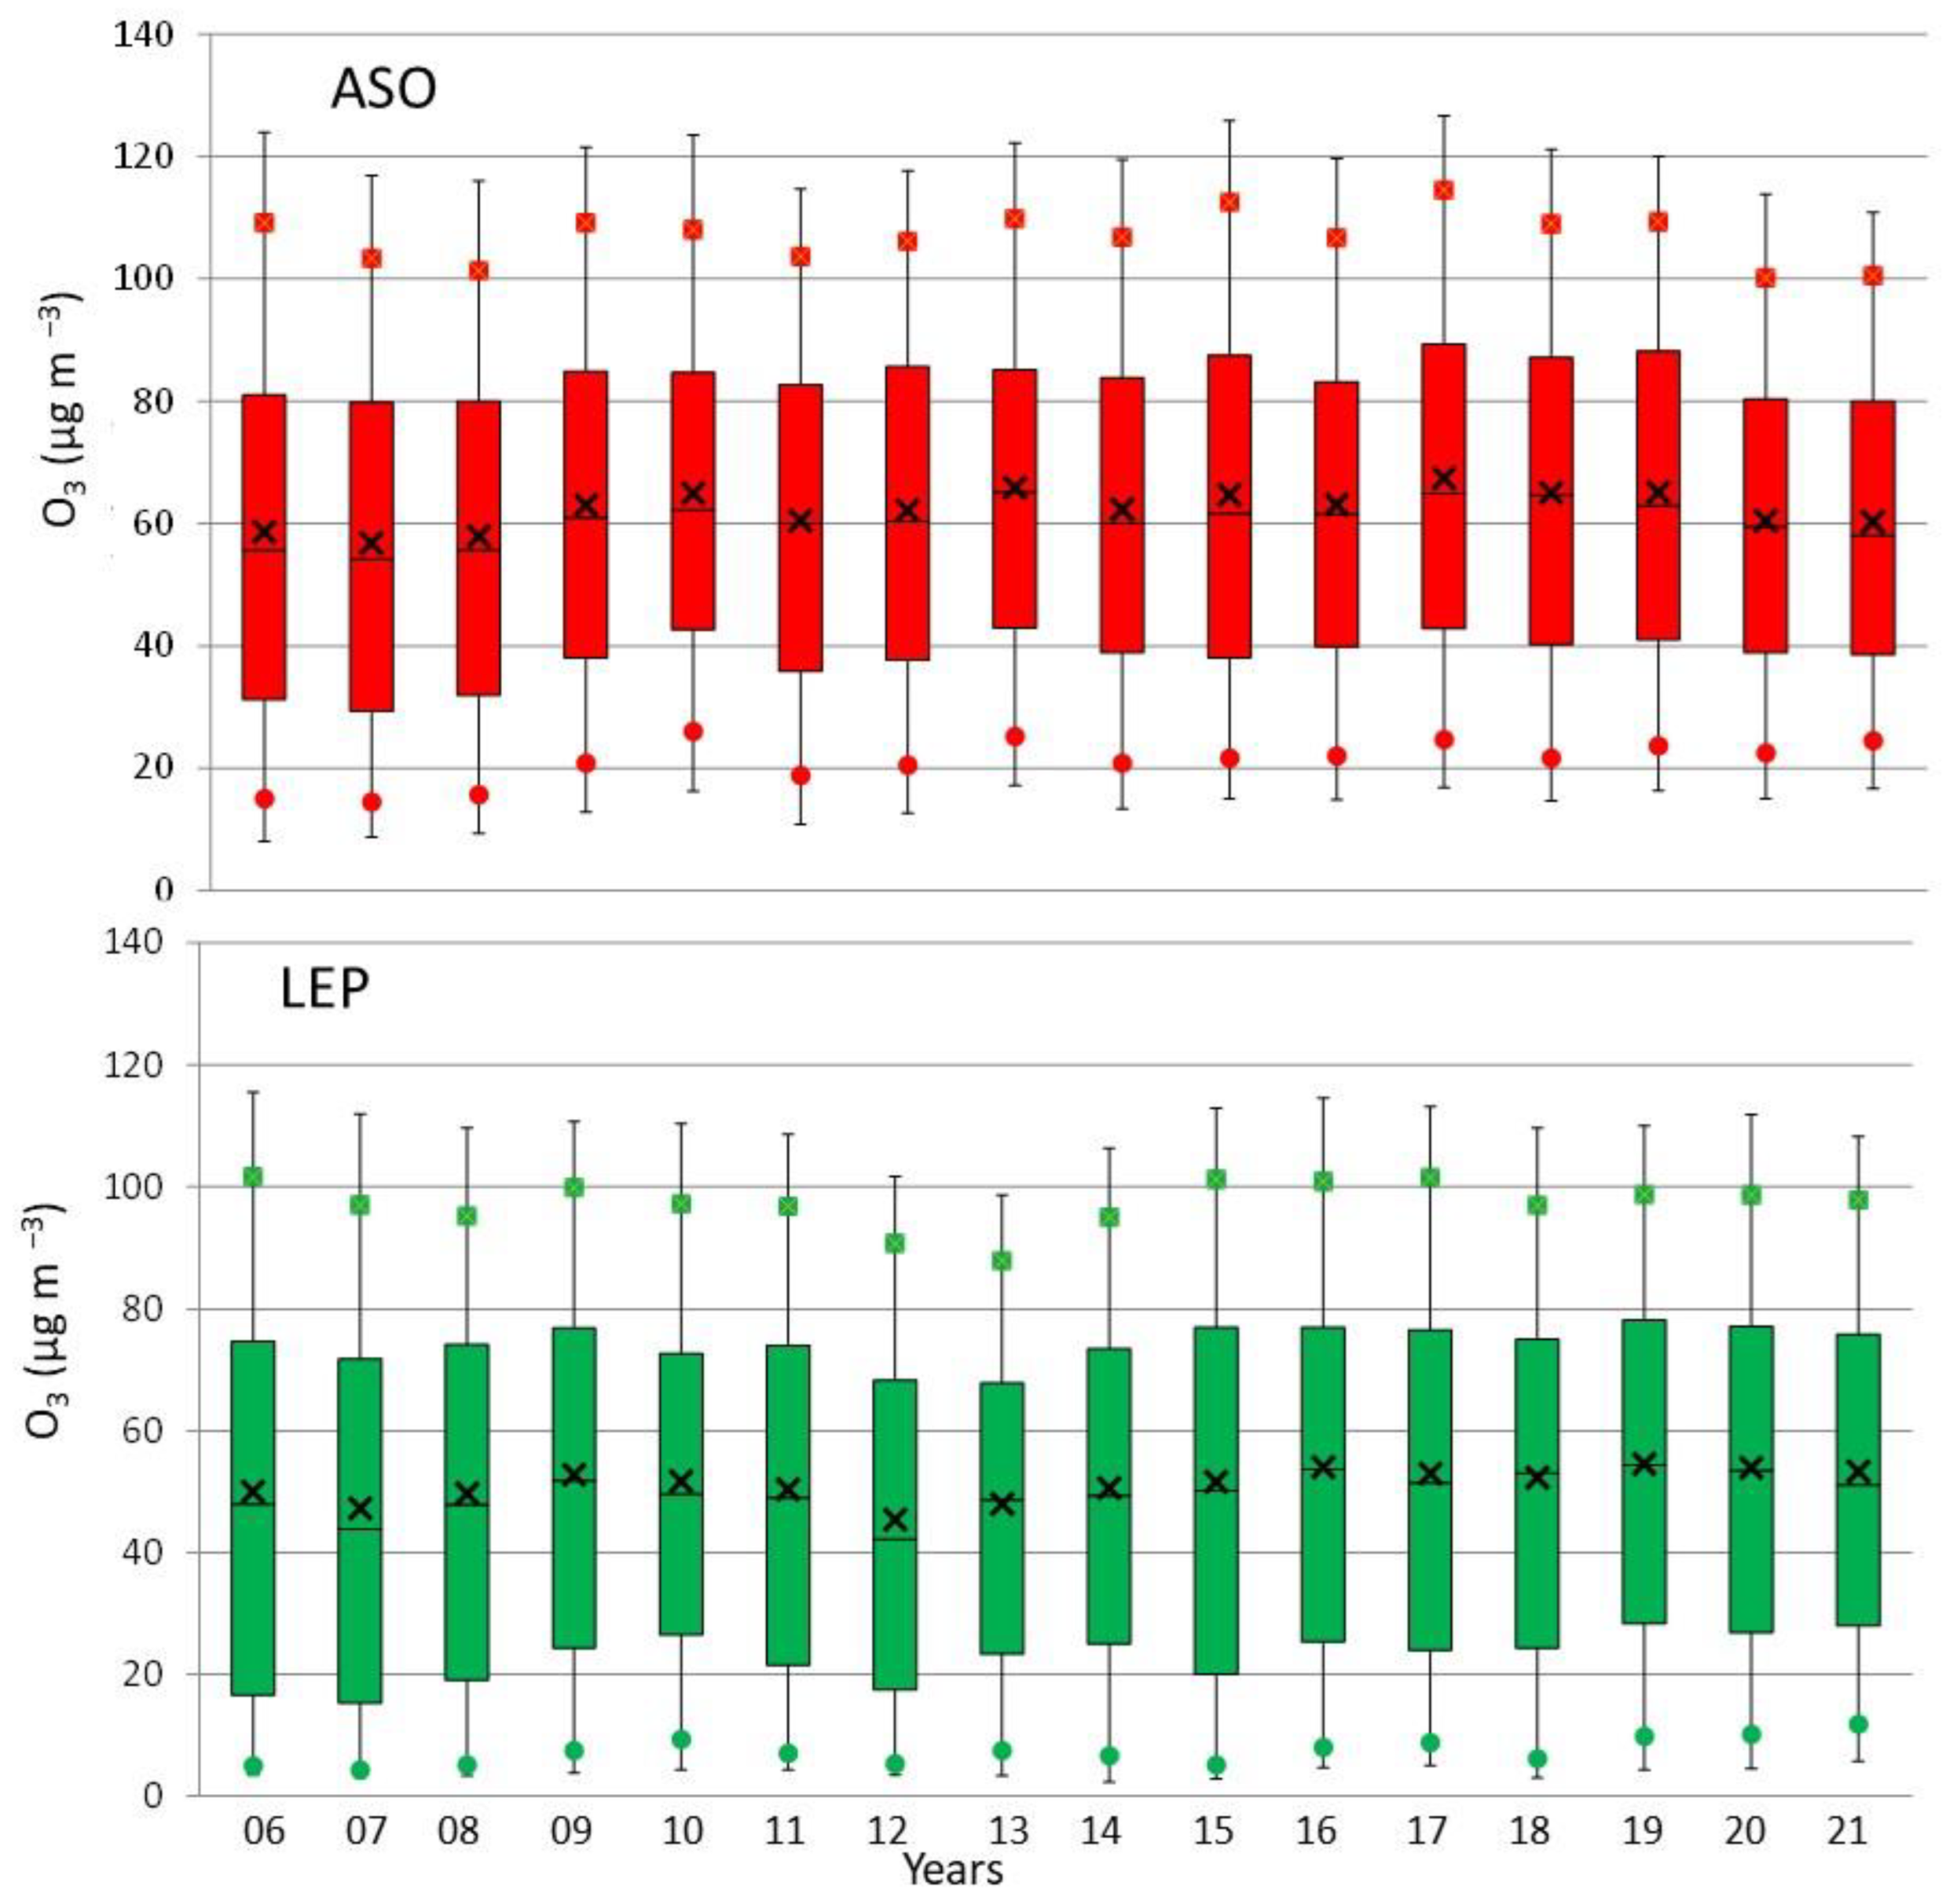
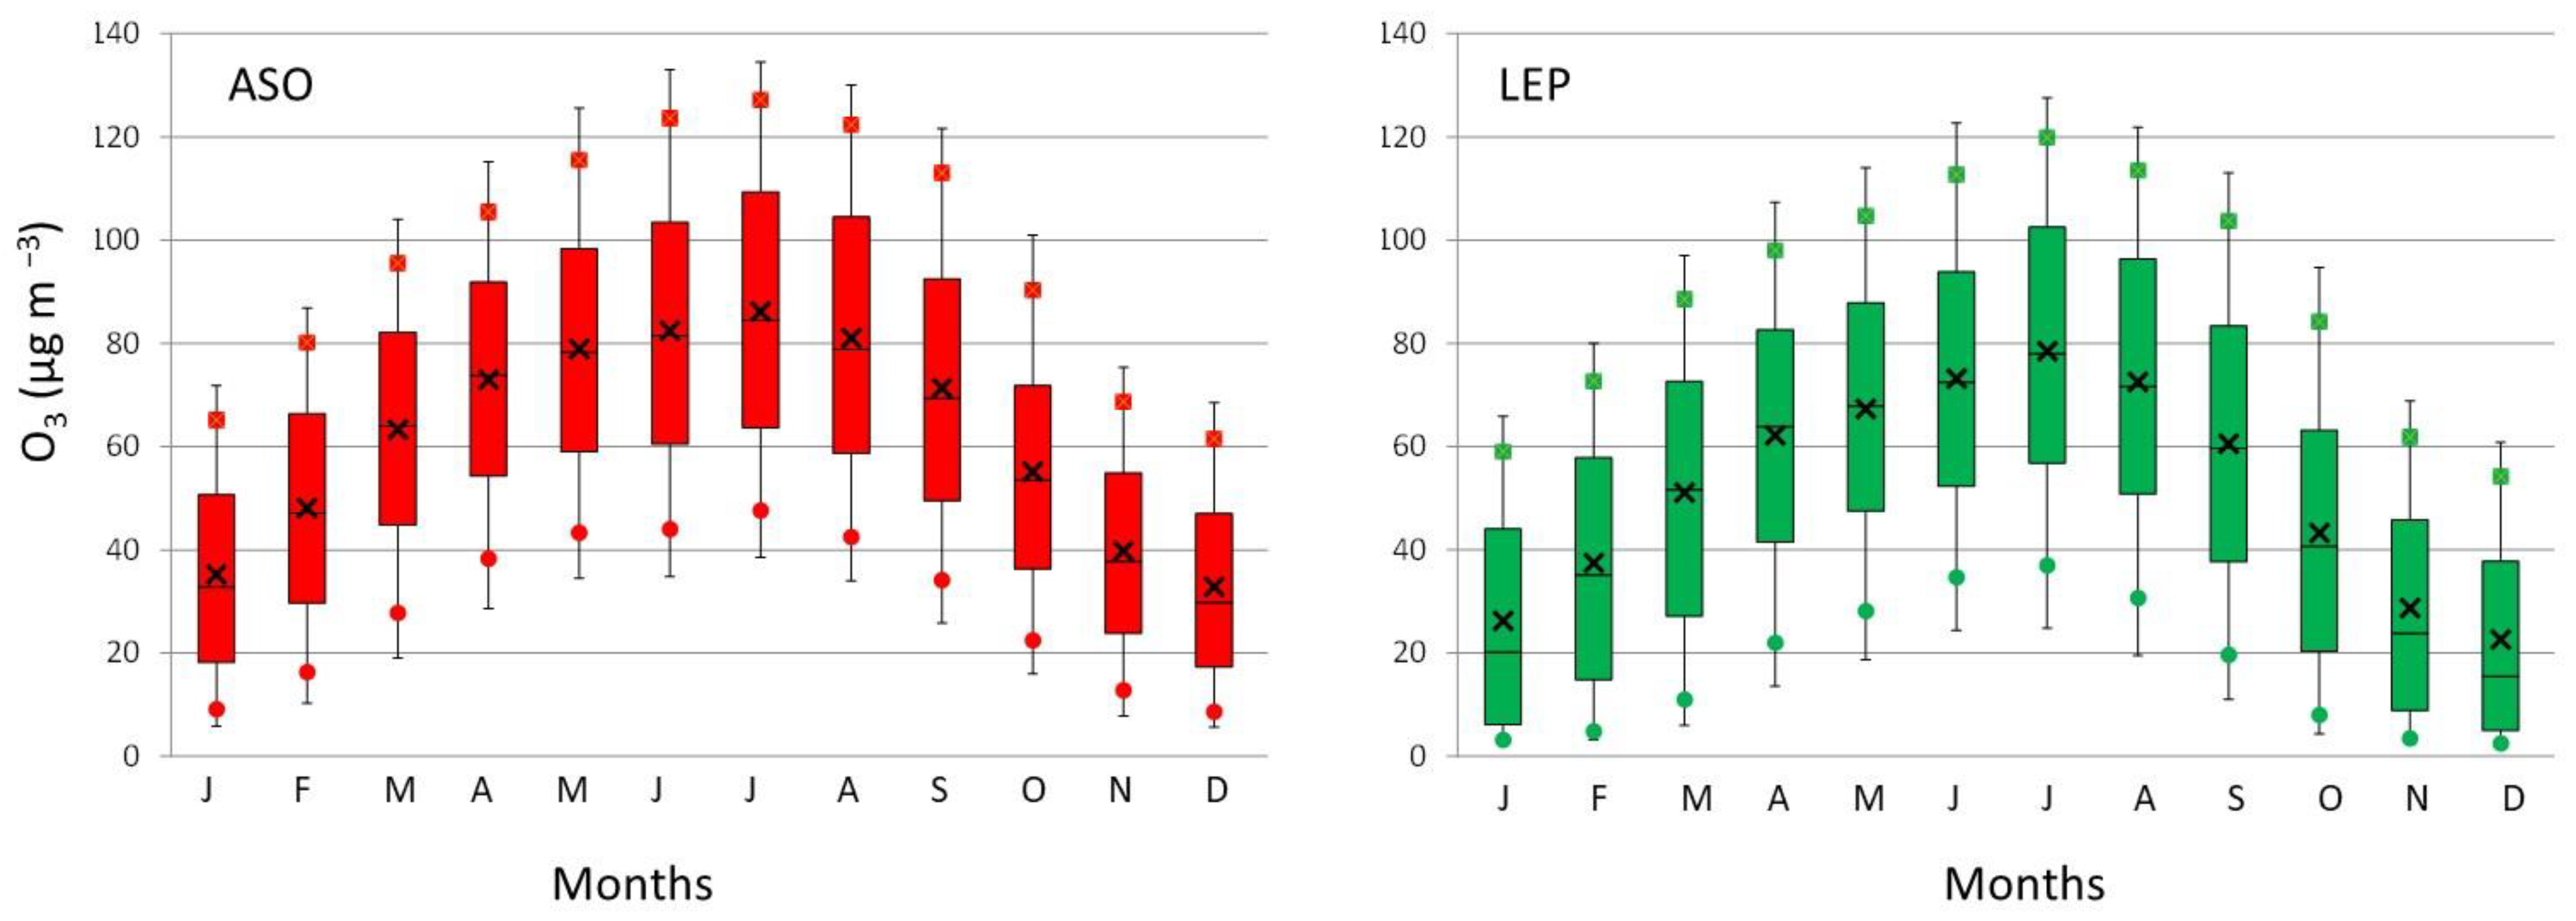
To investigate the yearly, seasonal and daily variability of O3 concentrations in Córdoba during the period 2006–2021;
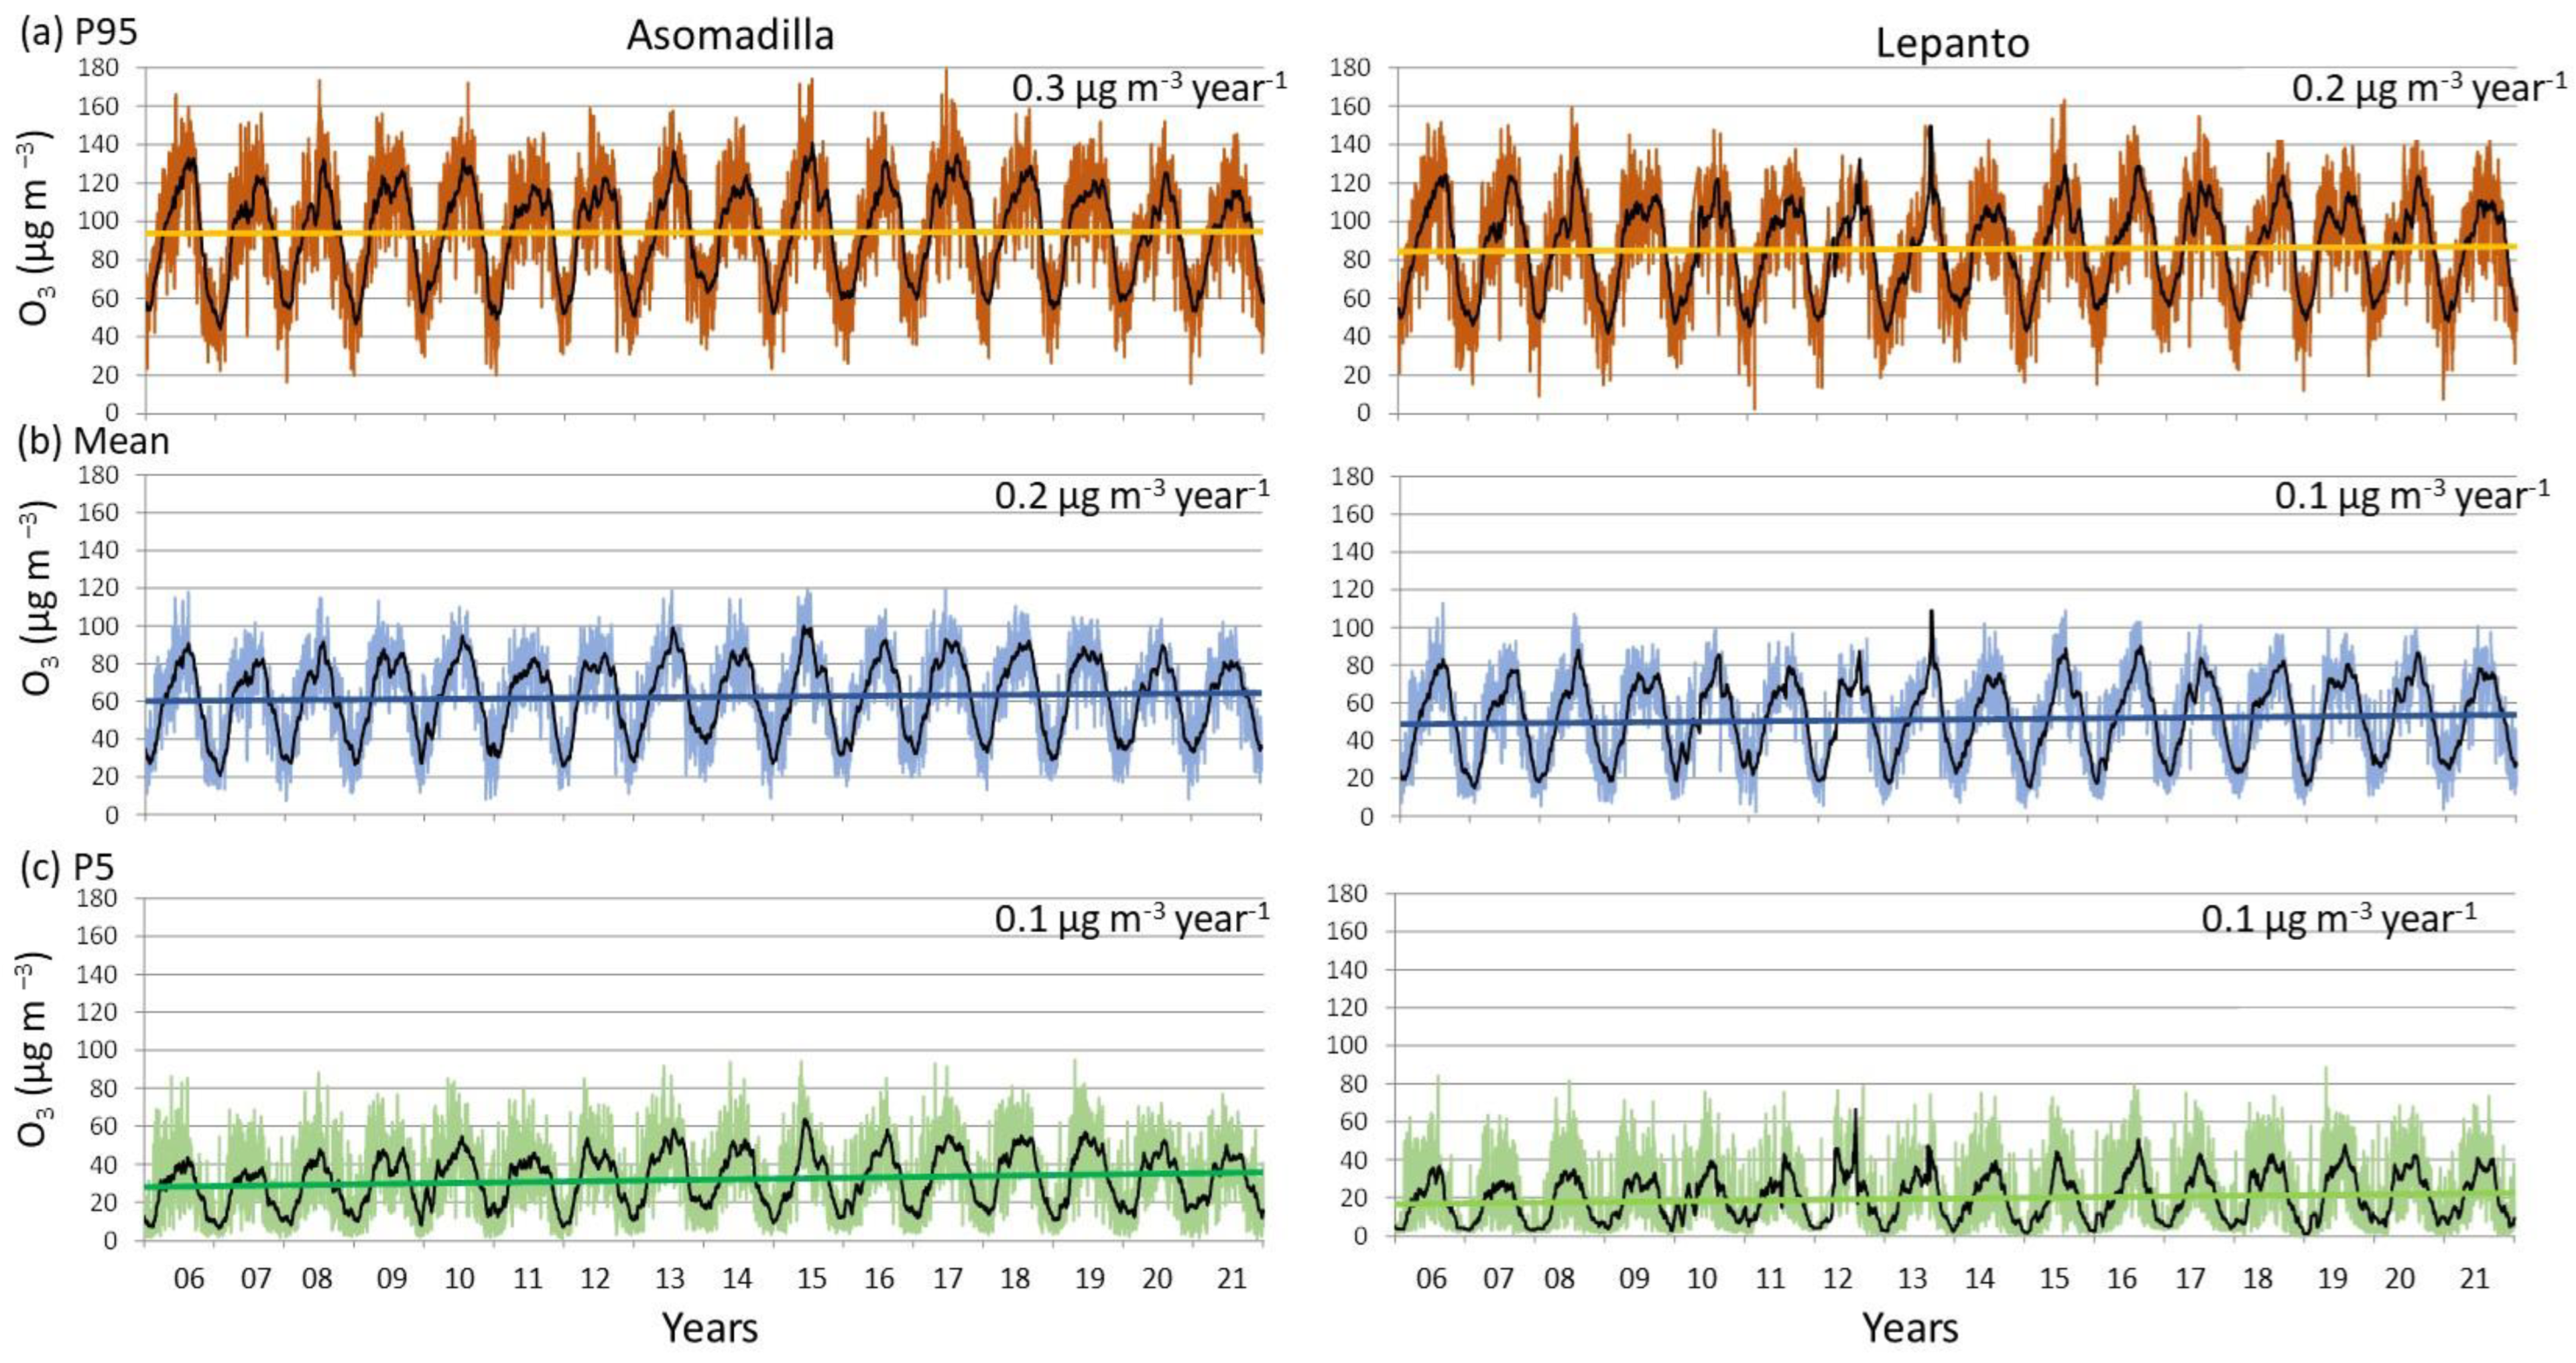
To quantify the trends for the O3 levels;
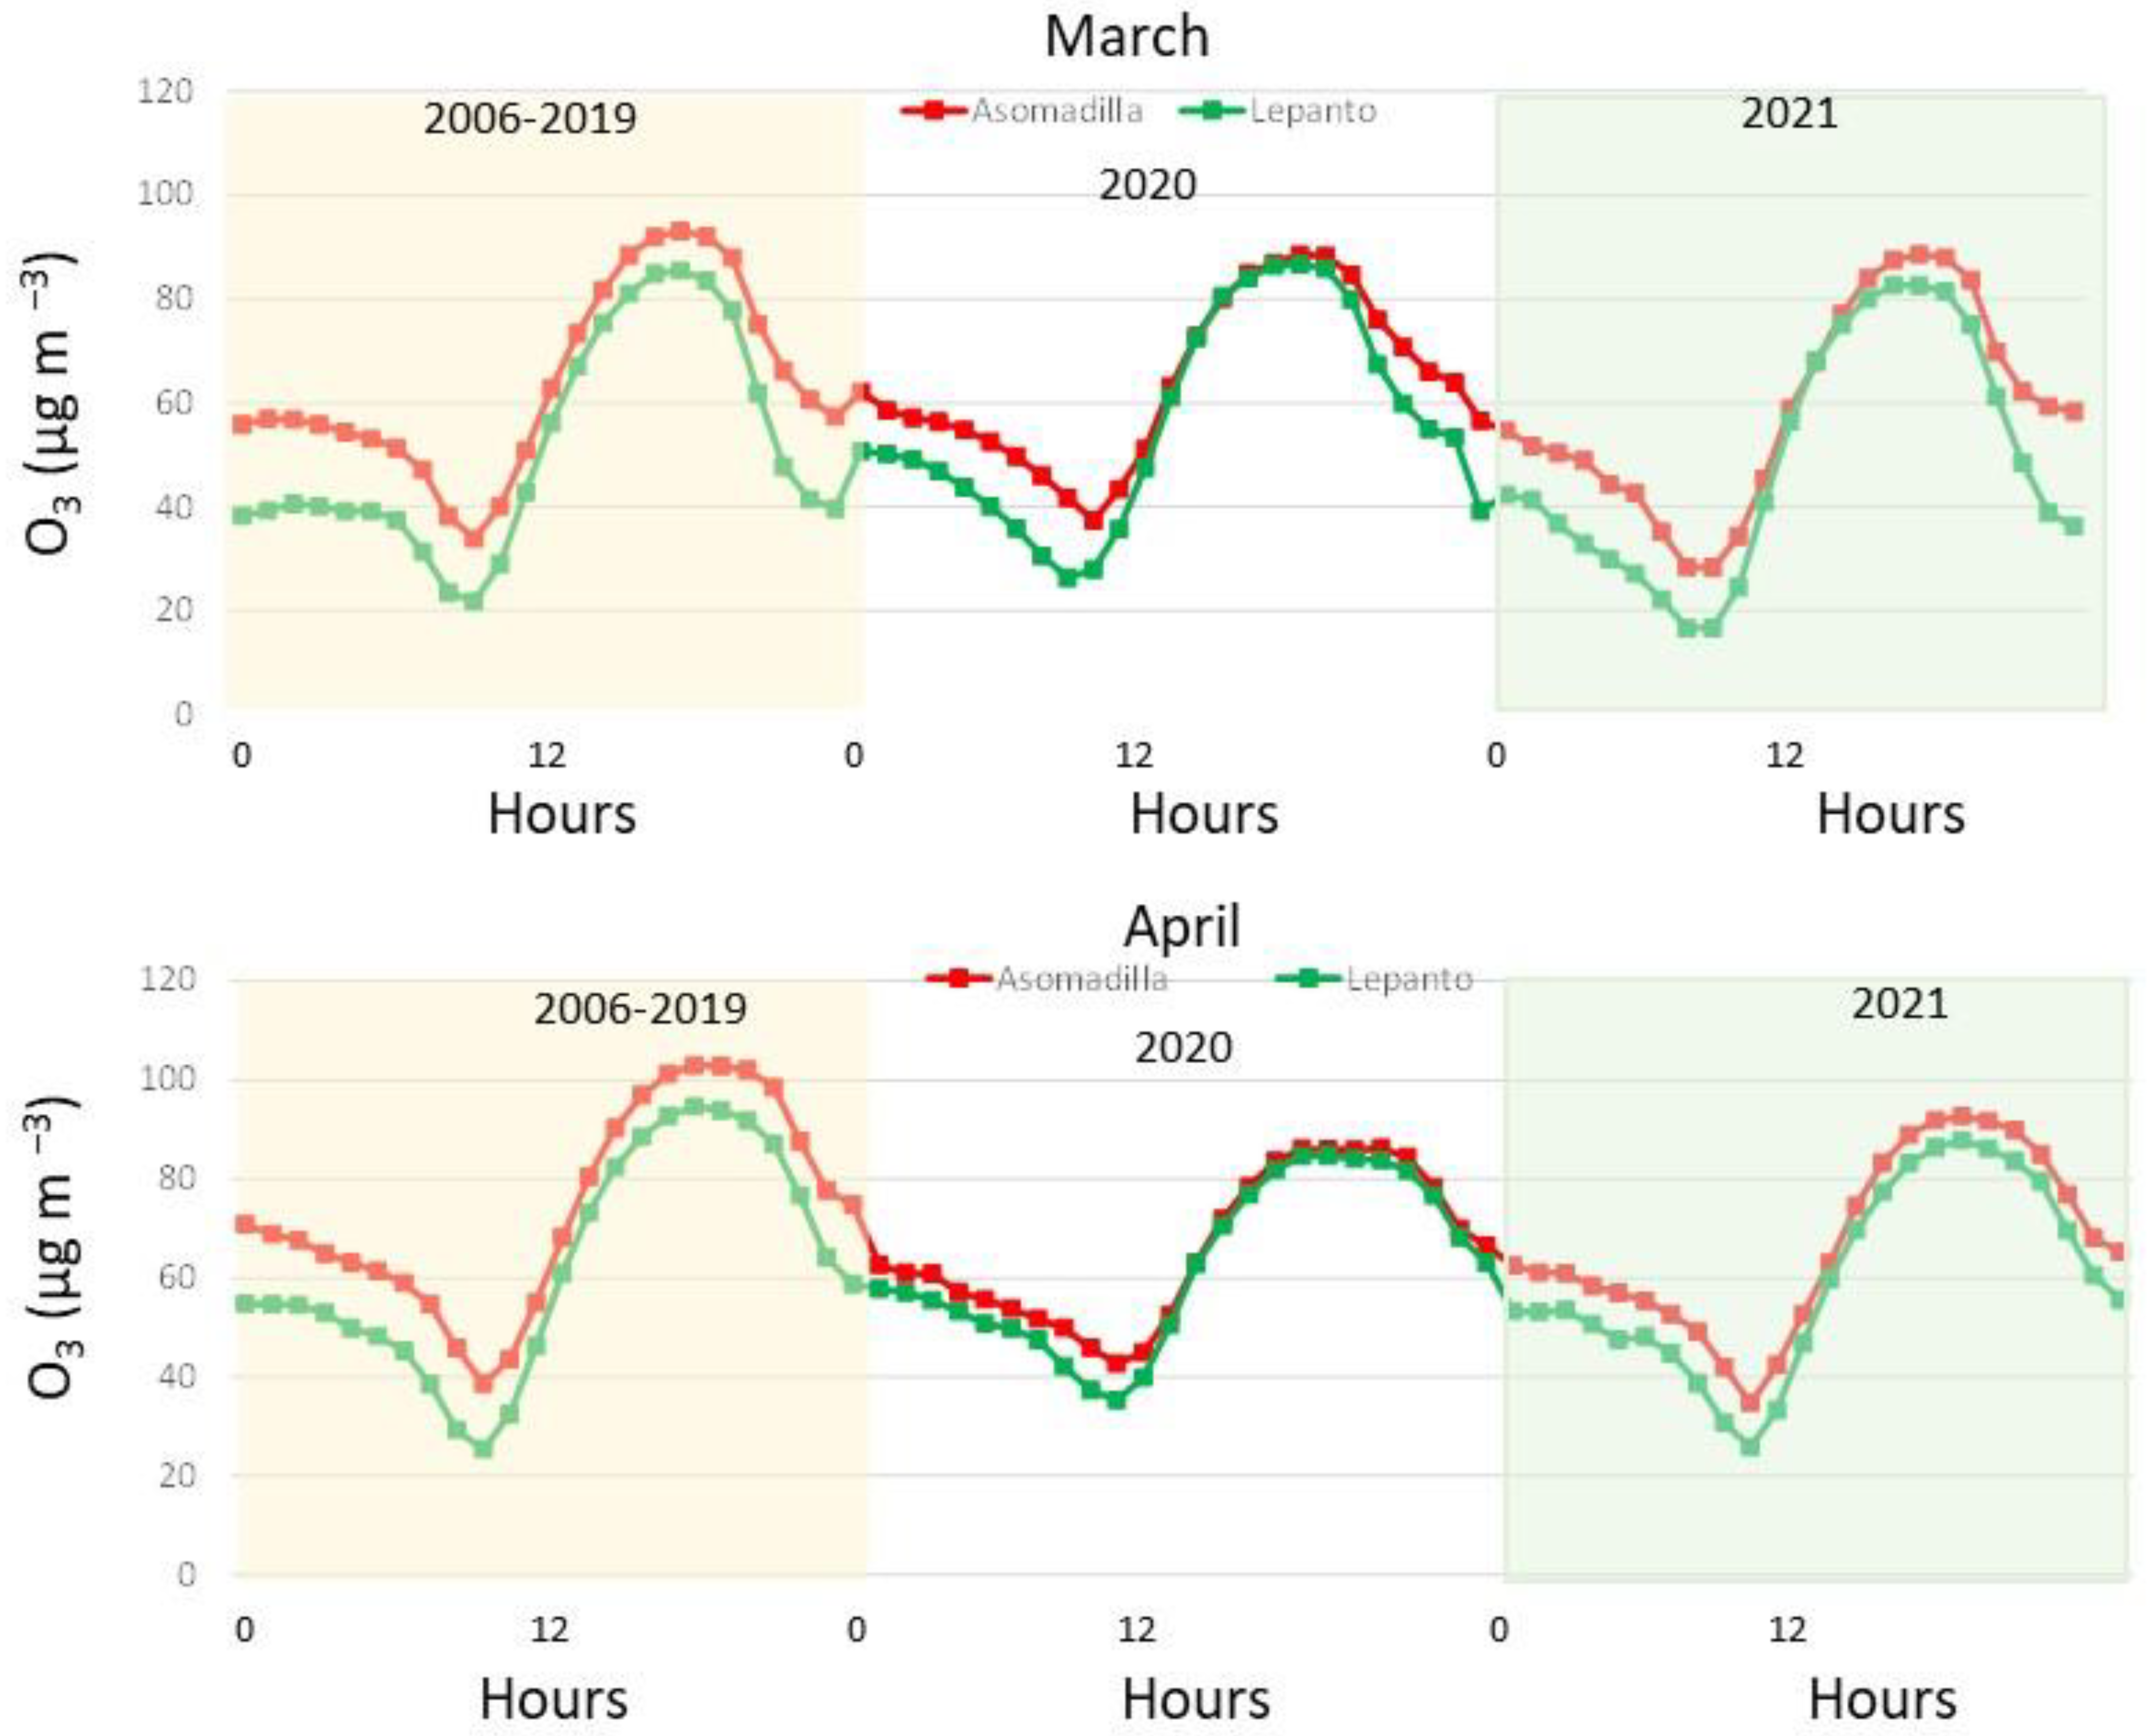
To quantify changes in the O3 concentrations associated with the COVID-19 period.

2. Description of Data

The analysed data consist of 16 years of continuous measurements with one hour resolution of O3 concentrations. These O3 data were collected at two official monitoring stations of the Andalucía regional government locates in Córdoba city. These two stations are Asomadilla (37.90 N, −4.77 W, 152 m above sea level) and Lepanto (37.89 N, −4.76 W; 119 m above sea level) (hereafter, ASO and LEP). While ASO is classified as a suburban background, LEP is an urban background. ASO is in the fairly open Asomadilla Park, which is the largest park in Córdoba and is located 2 km north of the centre the city, while LEP is located in a small city park surrounded by a built-up urban area (residential and commercial area) (Figure 1).
Concentrations were recorded at the air quality stations every hour during the period 2006–2021. Each value represents the concentration obtained with the start time of sampling. Hence, the 24-hourly concentrations are from 0:00 to 23:00 h, in Coordinated Universal Time (UTC). Working with data, it is ideal to acquire them continuously without gaps; however, this is almost impossible due to power failure or other technical problems. These gaps in the time series can be seen in Figure 2. The O3 hourly data covers 96% and 92% of the total O3 values during the sampling period (2006–2021). From this set of hourly measures, the quality criterion of 75% was applied to calculate daily values (means, 95th and 5th percentiles), and, then monthly and yearly values, i.e., at least 75% of the hourly and daily records.

3. Results

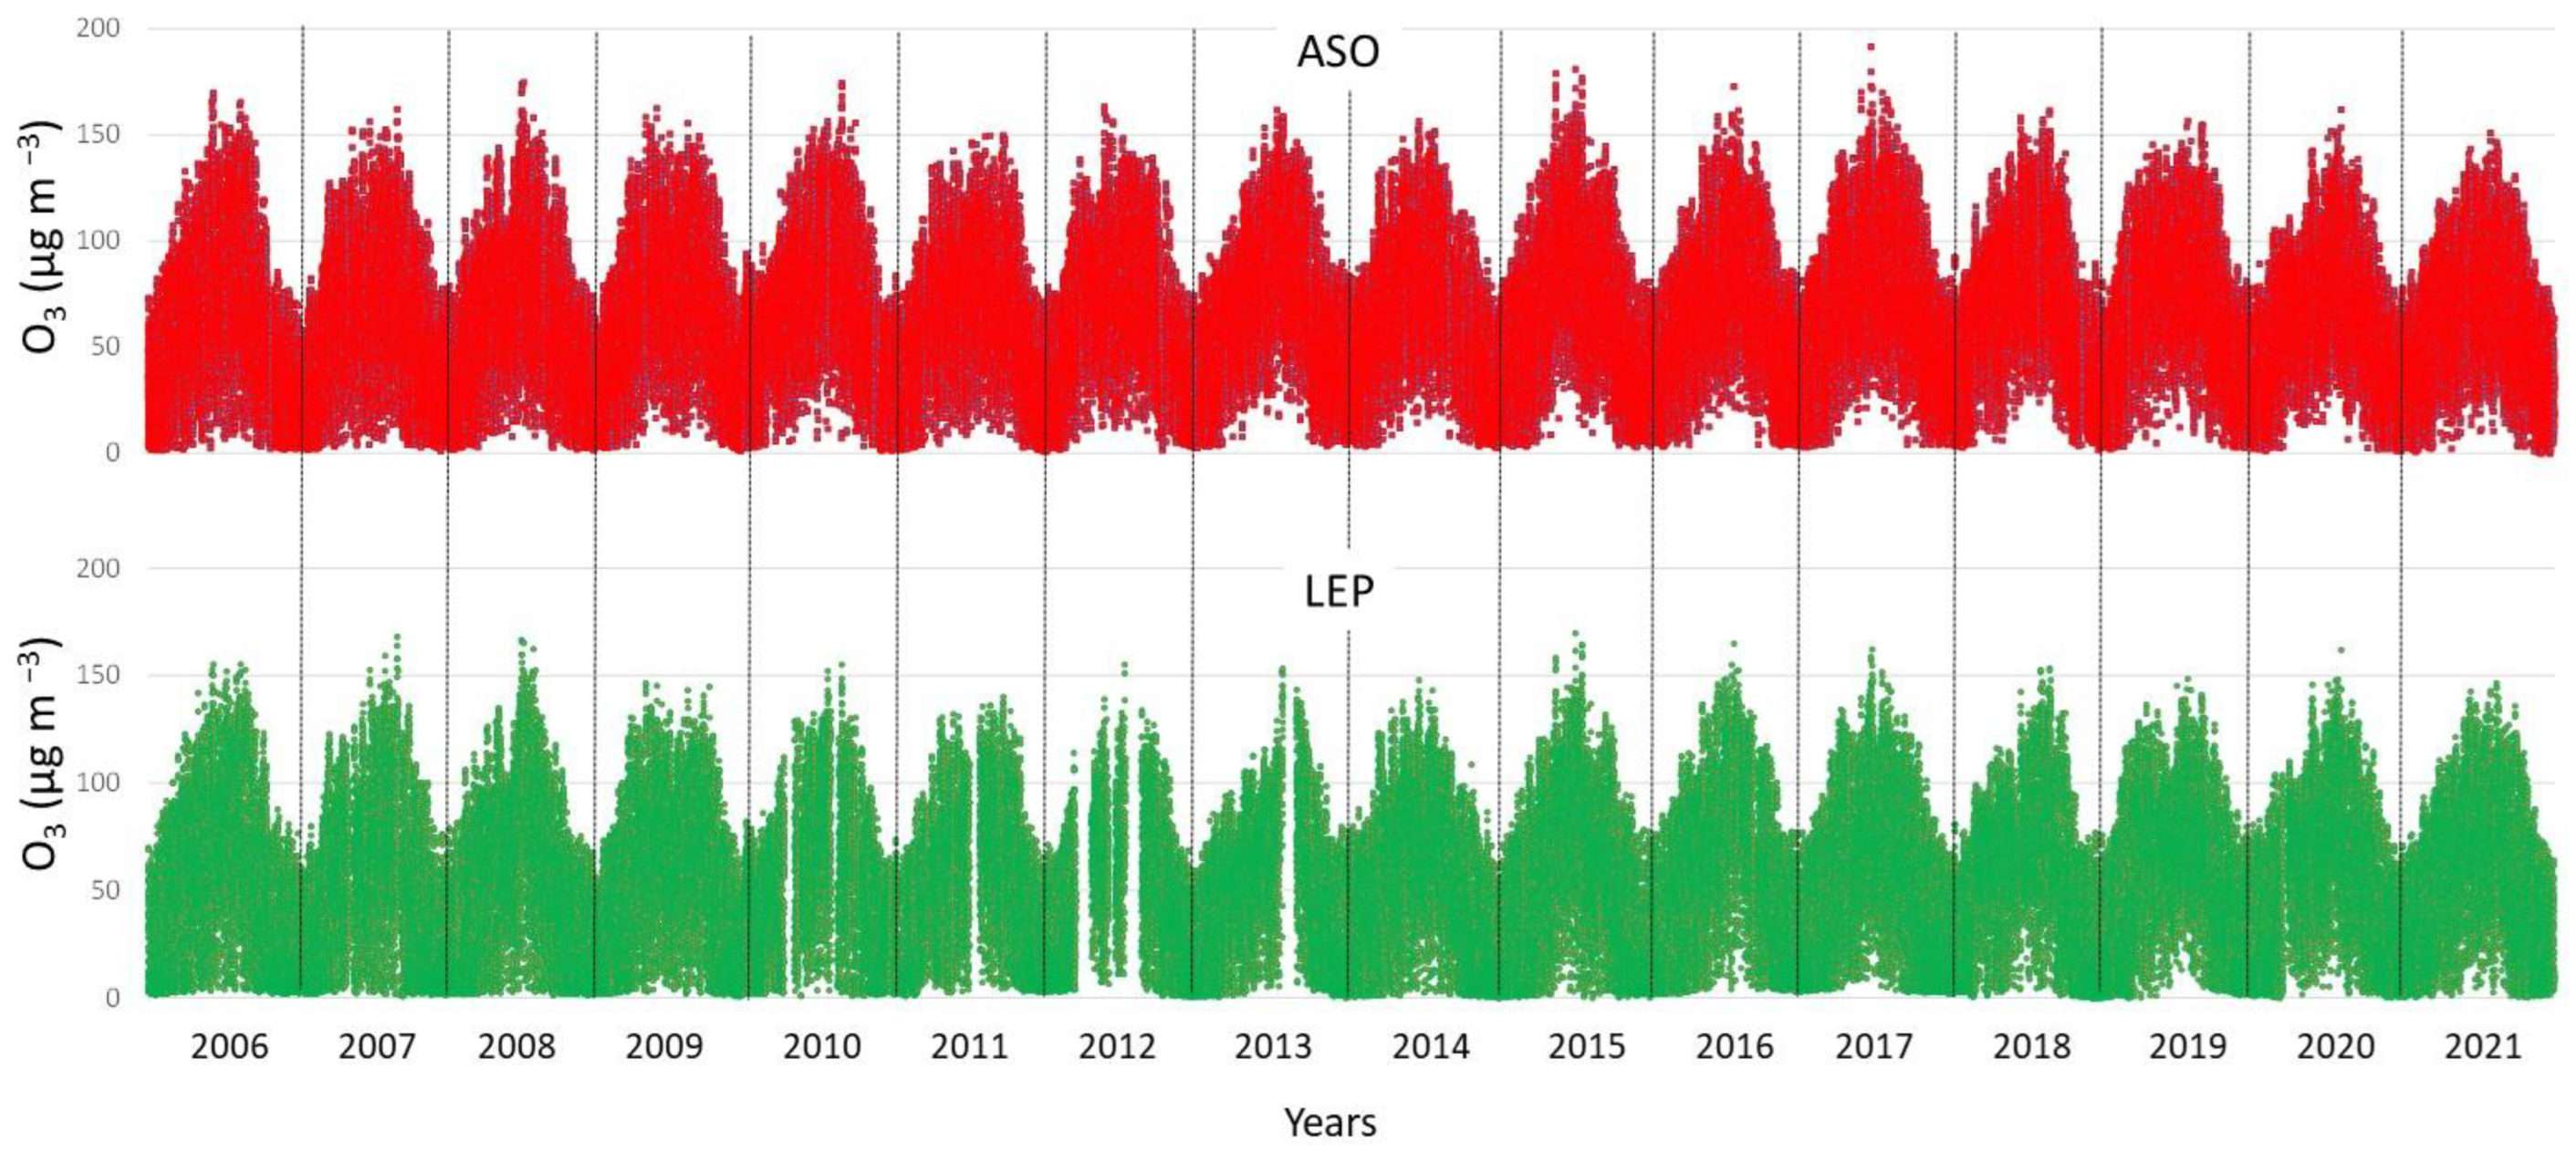
3.1. O3 Characterisation in Córdoba City

In this section, we illustrate the O3 concentrations measured in Córdoba and present similarities and differences within the city. Figure 2 displays the hourly evolution of O3 surface concentrations at ASO and LEP during the study period 2006–2021. There was a high and positive correlation between both (0.94 at the 0.05 significance level), as was expected between two stations in the same city. The means for the whole period were 62.0 µg m−3 in ASO and 51.3 µg m−3 in LEP. The highest hourly concentration was recorded in ASO, 192 µg m−3, whereas 169 µg m−3 was measured in LEP. Considering these maximum values, there were no O3 concentrations above the alert threshold (240 µg m−3) during this period, while the information level threshold (180 µg m−3) was only exceeded during the study period twice in ASO: 29/06/2015 (15:00–16:00) with 192 µg m−3 and 16 June 2017 (14:00–15:00) with 181 µg m−3. Regarding the limit for the protection of human health (120 µg m−3), on average, and during this period, the number of days exceeding this threshold level was 51 year−1 and 18 year−1 in ASO and LEP, respectively, which clearly remarks differences in the location of both monitoring sites within the city.
Daily averages, and daily 95th and 5th percentiles, all of them obtained from hourly data, were used to analyse the O3 trends for the whole period studied (2006–2021), following the methodology applied in [16]. Figure 3 provides trend estimations based on daily means and daily 5th and 95th percentiles. It is necessary to mention that p-values were calculated to determine whether a trend is statistically significant using a 95% confidence level. To obtain the p-value, the Student’s t-test was applied. All p-values were below this threshold (95%), i.e., the trend is not statistically significant. However, we report all of these p-values following the recommendations performed in [20]. For daily averages, both sites presented a positive trend of 0.18 µg m−3 year−1 (p = 0.59) and 0.15 µg m−3 year−1 (p = 0.59), while the daily 95th percentiles showed a positive and higher trend (0.27 µg m−3 year−1 (p = 0.73) and 0.24 µg m−3 year−1 (p = 0.70)) than daily P5 (0.10 µg m−3 year−1 (p = 0.49) and 0.07 µg m−3 year−1 (p = 0.46)). These results indicate that the daily, maximum (P95) and background (P5) O3 values increased at both sampling sites, with special emphasis in maximum concentrations. As is well known, the O3 trend can be the result of several factors, such as modifications in local (emissions, weather patterns) and synoptic scales (climate change, synoptic meteorological patterns). In this sense, the O3 concentrations in the coastal area of the southwestern Iberian Peninsula [16] suggest that changes in the temperature and pressure during 2000–2021 point to a clear trend towards anticyclonic and warmer conditions, which, along with the reduction of precursor emissions, would contribute to the increasing trend of O3.

3.2. Yearly, Seasonal and Daily Evolution

In this section, we illustrate the temporal variation of O3 in both sites at different temporal scales. As discussed above, the use of 16 years of data in this study allows the possibility to investigate the O3 year-to-year variability under different meteorological scenarios. This evolution is assessed in the corresponding box-and-whisker plots in Figure 4, which were calculated based on hourly data. Within this variability, it is interesting to note that the highest P95 value in ASO (126.6 µg m−3 in 2017) and the second one in LEP (113.2 µg m−3 in 2017) coincided with the highest occurrence of heat waves in the province (four events in 2017) [21], which clearly suggest a direct and positive influence of this synoptic scenario on high O3 concentrations. This result agrees with the conclusions of the recent analysis of the Copernicus Atmosphere Monitoring Service, in which temperature peaks are related to an increase in O3 levels [22].
In general, the distribution of O3 concentrations (P75-P25) was larger in LEP than in ASO. On average and for the whole period, this range was 51.5 µg m−3 and 46.0 µg m−3, respectively, with maximum ranges of 58.6 µg m−3 in LEP and 50.1 µg m−3 in ASO. On the contrary, the comparison also showed that the 50th percentile (P50) values from ASO were systematically higher than those from LEP. In this sense, the average of P50 during the whole period was 60.4 µg m−3 in ASO and 49.8 µg m−3 in LEP. Indeed, all percentiles calculated (Figure 4) were higher in ASO than in LEP, reinforcing the different urban environment in which each monitoring site is placed (Section 2). The largest differences between both were found for the smallest concentrations, which agree with the classification of each station (urban and suburban). LEP is more influenced by traffic density, while ASO is in a cleaner environment and is less directly affected by traffic emissions.
As expected, the O3 showed both monthly and daily temporal variations at both monitoring stations. The monthly variability is shown in Figure 5, which clearly agrees with the seasonality suggested in Figure 2. The monthly variability showed that during the first months of the year and for both stations, there was a continuous increase in the monthly value of O3, reaching higher concentrations in the warm months (May–August) than in the cold ones (December–January). From April to September, the monthly means were over 60.0 µg m−3, reaching the monthly maximum in July, with an average of 86.2 µg m−3 and 78.5 µg m−3 in ASO and LEP, respectively. There was a large agreement in the occurrence of the maximum monthly concentrations between both stations (88% of the years). There were only two years (2008 and 2021) in which there was no coincidence in the monthly maximum between the sampling stations. While 2021 is the year after the strict COVID-19 lockdown in Spain, 2008 coincides with the beginning of the economic recession in Spain, in which an abrupt reduction in NO2 concentrations of about 7% per year from 2008 to 2012 was observed in densely populated cities in Spain [23].
Both stations presented a similar growth rate in the monthly average from December to July—6.6 µg m−3 in ASO and 6.9 µg m−3 in LEP—while the amplitude of the monthly cycle (the difference between the maximum and minimum) was similar at 54 µg m−3 in ASO and 55.9 µg m−3 in LEP. These monthly concentrations represent a balance between the generation–destruction processes of O3 and meteorological conditions on local, regional, and global scales [24]. While changes in the emissions within the city causes temporal variability in the presence of precursors during the year, this pattern also reacts to changes in the meteorological conditions, such as solar radiation and temperature increasing or limiting the photolytic cycle [2], and synoptic patterns and mesoscale circulations ventilating or accumulating air masses in the area [11,25].
Figure 6a displays the daily cycle of hourly O3 concentrations at both sampling sites considering the whole sampling period (2006–2021). This figure shows that, on average, higher concentrations were recorded during the daytime than during the night, following the daily solar radiation cycle. It is well documented that solar radiation is one of the main factors in understanding the diurnal variability of O3 [26,27] due to O3 being a secondary photochemical pollutant generated by the photochemical reaction between NO2 and VOCs. The O3 concentrations gradually increase just after sunrise, which is associated with the increase in the convective activity in the planetary boundary layer causing the collapse of the nocturnal inversion layer. This fact favours the down-mixing processes of the previous day’s O3 from the reservoir layer, and photochemical reactions with NOx and VOCs, explaining the observed progressive increase from mid-morning to noon. Low concentrations of ozone at night are attributed primarily to the lack of photochemical reactions [28]. The lowest concentrations are registered in LEP, while the highest ones in ASO, coinciding in time, i.e., the highest concentration (91.9 µg m−3 and 83.6 µg m−3) at 17:00 UTC, and the lowest (32.0 µg m−3 and 20.8 µg m−3) in the early morning at 9:00 UTC, around sunrise. Differences in the intensity of the daily values observed between both stations reflect the combination of different factors, such as the precursor emissions, and chemical and physical processes [29,30]. In this sense, differences in the urban environment (Section 2) influence the intensity of the minimum concentrations, for instance, favouring reactions between O3 and NO2, which results the formation of dinitrogen pentoxide (N2O5) and nitric acid (HNO3) [31].
This daily evolution was observed during the whole year, although with differences in intensity and in the hours of maximum values. Figure 6 displays the monthly variability of the daily cycles at both sampling stations. The maximum values were in ASO and LEP from 119.6 µg m−3 and 110.8 µg m−3 in July to 56.3 µg m−3 and 51.7 µg m−3 in December, respectively, while the minimum values were in ASO from 45.2 µg m−3 in July to 17.9 µg m−3 in December, while in LEP were from 32.9 µg m−3 in June to 10.3 µg m−3 in January. The time occurrence of the maximum and minimum values also presented a seasonal variability. The daily maximum was registered between 18:00 and 19:00 UTC in summer in ASO and LEP, but in winter it was observed at 17:00 UTC in ASO and between 16:00 and 17:00 UTC in LEP. On the contrary, the minimum was at 9:00 UTC in ASO and between 8:00 and 9:00 UTC in LEP. In agreement with previous work [32], during the warm months, the O3 diurnal cycle showed high values between 12:00 and 18:00 UTC. This figure also shows monthly differences in the maximum and minimum values between the sites. While both stations present similar maximum values and more differences in the minimums in winter and autumn, there are many more differences in the maximum and more similarities between the minimum values in summer and spring. In the case of the minimum values, the combination of limited mixing in the nocturnal boundary layer, dry deposition, and nitric oxide titration help to reach the minimum values in LEP, and more differences with those minimum values were registered in ASO in winter. The occurrence of higher maximum values in ASO in summer and spring, on the contrary, can be associated with local photochemical production and with the transport of O3 precursors to areas a bit out of the city (suburban).

3.3. Impact of the COVID-19 Lockdown on O3 Surface Concentrations

In the present section, we investigate the variation in the O3 concentrations in both monitoring stations in the context of COVID-19 disease. On 14 March 2020, a state of alarm was declared in Spain due to the COVID-19 outbreak (Real Decreto 463/2020). The strict lockdown started on 16 March and ended on 2 May. During this period, all non-essential workers were ordered to remain at home and only the supply of food and products necessary for public health was guaranteed. In a general context, while the impact of this lockdown had enormous repercussions for individuals and communities, one of the most positive impacts was the reduction in pollutants and greenhouse gases, i.e., primary atmospheric pollutants reduced by 50% [33].
Considering the strict lockdown period, we focus on two months, March and April, and we have compared the O3 concentrations in these months across three different periods, from 2006 to 2019, in 2020, and in 2021, one year after the lockdown. Figure 7 displays the corresponding daily cycles of March and April in ASO and LEP for each period considered. On average, the O3 concentrations (2006–2019) in both stations ranged from 41.3 µg m−3 (in 2012) to 72.0 µg m−3 (in 2019) in March and from 55.3 µg m−3 (2012) to 82.5 µg m−3 (2017) in April. These values were in line with those calculated in March 2021 (58.7 µg m−3 in ASO and 48.2 µg m−3 in LEP) and in April 2021 (66.5 µg m−3 in ASO and 59.4 µg m−3 in LEP). The averages obtained at both stations in 2020 reveal a different impact of the lockdown period. In March, the averages were higher at both stations compared to the 2006–2019 average (O3 increment of 0.5% in ASO and 11% in LEP), while in April, the O3 concentrations drastically decreased in ASO (−11%) and it was similar to the 2006–2021 average in LEP (0.03%). Hence, these results indicate that there was not a large decline in O3 concentrations in Córdoba city compared to the 2006–2019 average. However, and taking as reference the averages of March and April in 2019 and 2020, a large influence of the lockdown is well observed, with a reduction in March of 7.8% in ASO and 1% in LEP, while in April, it was of 12% in ASO and 8% in LEP. This can be associated with the large decrease in the anthropogenic NOx emissions during the lockdown. The authors in [34] reported that the reductions were at least 15% globally and 18% to 25% regionally in April and May 2020, while urban emissions were reduced in Spain up to 50% or 60% [35].
Following the methodology applied in [19], we have calculated the averages between 22–09 h and 12–18 h for each period to quantify the differences between the background values and local–regional O3 production. The averages and differences are shown in Table 1. These results revealed that the regional-to-hemispheric O3 background (averages from 22–9 h) only decreased in April 2020 in ASO with respect to historic data, from 62.1 to 56.5 µg m−3, while there was a decrease in the local diurnal O3 formation at both stations, being more intense in April (from 91.9 to 79.3 µg m−3 in ASO and from 84.1 to 77.9 µg m−3 in LEP). These values revealed that the diurnal O3 formation (DOF) (difference between averages 22–09 h and 12–18 h) decreased in March and especially in April 2020, while in 2021, the numbers were similarly reversed with respect to 2020.
These results indicate that the strict lockdown mainly impacted the production of O3 in Córdoba city, while the background values presented similar or even higher values. These results do not agree with those observed in 15 regional background sites in the Iberian Peninsula [19] since at these sampling sites, the hemispheric regional O3 background was significantly reduced during the health crisis. This fact, in a general framework of a decrease in anthropogenic emissions over the Iberian Peninsula [35], and hence, fewer precursors available, pointed to the large variability in O3 concentrations and the different impact of this lockdown on the sampling stations, according to their location and environment.

4. Conclusions

In this work, the temporal and spatial variations of the O3 concentrations measured at two sites in Córdoba city were characterised. For this purpose, 16 years of O3 concentrations at the Asomadilla (suburban) and Lepanto (urban) stations were used. The hourly mean concentrations of O3 in Asomadilla were 62.0 µg m−3, while they were 51.3 µg m−3 in Lepanto. Only twice did the maximum hourly concentrations exceed the value of 180 μg m−3 during this period. The analysis of trends presented a positive trend, between 0.07 and 0.27 µg m−3 year−1 for daily means, and daily P95 and P5, registering the highest annual variability in daily P95 concentrations in both stations. The monthly means showed a clear seasonal cycle, with the maximum levels in July and the minimum levels in December, while the daily cycle presented minimum values in the early morning (9:00 UTC) and maximum values in the afternoon (17:00 UTC), with differences according to the time of the year and the measurement site. In this work, we have also demonstrated that the impact of the COVID-19 lockdown was mainly registered in April 2020, with a decline in O3 concentrations of over 10%. This reduction was mainly associated with the decrease in the local O3 production (average of hourly concentrations between 12 and 18 h). These results will allow the possibility to perform future analyses to investigate, for instance, the impact of local and synoptic meteorological conditions on O3 concentrations, and the influence of heatwave events.

Author Contributions

Conceptualization, M.A.H.-C. and J.T.-F.; methodology, M.A.H.-C. and J.T.-F.; validation, M.A.H.-C., J.T.-F. and A.J.-S.; formal analysis, M.A.H.-C. and J.T.-F.; data curation, M.A.H.-C.; writing—original draft preparation, M.A.H.-C.; writing—review and editing, M.A.H.-C. and A.J.-S.; All authors have read and agreed to the published version of the manuscript.

Funding

This research received no external funding.

Institutional Review Board Statement

Not applicable.

Informed Consent Statement

Not applicable.

Acknowledgments

M.A.H.-C. and A.J.-S. gratefully acknowledge the Spanish Ministry of Universities for funding through Beatriz Galindo Research fellowships BG20/00016 and BG20/00015, respectively. The authors thank the Environmental Information Network of Andalusia (REDIAM), part of the Regional Ministry of Environment and Spatial Planning of the Government of Andalusia, Spain. https://www.juntadeandalucia.es/medioambiente/portal/landing-page-%C3%ADndice/-/asset_publisher/zX2ouZa4r1Rf/content/red-de-vigilancia-y-control-de-la-calidad-del-aire-de-andaluc-c3-ada/20151 (accessed on 15 September 2022).

Conflicts of Interest

The authors declare no conflict of interest.

References

  1. Amann, M.; Derwent, D.; Forsberg, B.; Hänninen, O.; Hurley, F.; Krzyzanowski, M.; de Leeuw, F.; Liu, S.J.; Mandin, C.; Schneider, J.; et al. World Health Organization. Regional Office for Europe. 2008. Available online: https://www.euro.who.int/__data/assets/pdf_file/0005/78647/E91843.pdf (accessed on 6 August 2022).
  2. Seinfeld, J.; Pandis, S. Atmospheric Chemistry and Physics: From Air Pollution to Climate Change, 3rd ed.; Wiley: New York, NY, USA, 2016; ISBN 10-1118947401. [Google Scholar]
  3. Sinha, P.R.; Sahu, L.K.; Manchanda, R.K.; Sheel, V.; Deushi, M.; Kajino, M.; Schultz, M.; Nagendra, N.; Kumar, P.; Trivedi, D.; et al. Transport of tropospheric and stratospheric ozone over India: Balloon-borne observations and modeling analysis. Atmos. Environ. 2016, 131, 228–242. [Google Scholar] [CrossRef]
  4. Matthew, L.R.; Watt, S.; Jiang, N. Tropospheric ozone measurements at a rural town in New South Wales, Australia. Atmos. Environ. 2022, 281, 119143. [Google Scholar] [CrossRef]
  5. Baruah, U.D.; Robeson, S.M.; Saikia, A.; Mili, N.; Sung, K.; Chand, P. Spatio-temporal characterization of tropospheric ozone and its precursor pollutants NO2 and HCHO over South Asia. Sci. Total Environ. 2022, 809, 151135. [Google Scholar] [CrossRef] [PubMed]
  6. Parrish, D.D.; Law, K.S.; Staehelin, J.; Derwent, R.; Cooper, O.R.; Tanimoto, H.; Volz Thomas, A.; Gilge, S.; Scheel, H.-E.; Steinbacher, M.; et al. Long-term changes in lower tropospheric baseline ozone concentrations at northern midlatitudes. Atmos. Chem. Phys. 2012, 12, 11485–11504. [Google Scholar] [CrossRef] [Green Version]
  7. Cristofanelli, P.; Fierli, F.; Graziosi, F.; Steinbacher, M.; Couret, C.; Calzolari, F.; Roccato, F.; Landi, T.; Putero, D.; Bonasoni, P. Decadal O3 variability at the Mt. Cimone WMO/GAW global station (2165 m asl, Italy) and comparison with two high-mountain “reference” sites in Europe. Elem. Sci. Anthr. 2020, 8, 00042. [Google Scholar] [CrossRef]
  8. Gaudel, A.; Cooper, O.R.; Ancellet, G.; Barret, B.; Boynard, A.; Burrows, J.P.; Clerbaux, C.; Coheur, P.-F.; Cuesta, J.; Cuevas, E.; et al. Tropospheric Ozone Assessment Report: Present-day distribution and trends of tropospheric ozone relevant to climate and global atmospheric chemistry model evaluation. Elem. Sci. Anthr. 2018, 6, 39. [Google Scholar] [CrossRef] [Green Version]
  9. Jiménez, P.; Lelieveld, J.; Baldasano, J.M. Multiscale modellingof air pollutants dynamics in the northwestern mediterraneanbasing during a typical summertime episode. J. Geophys. Res. 2006, 111, D18306. [Google Scholar] [CrossRef] [Green Version]
  10. Veld, M.; Carnerero, C.; Massagué, J.; Alastuey, A.; de la Rosa, J.D.; Sánchez de la Campa, A.M.; Escudero, M.; Mantilla, E.; Gangoiti, G.; García-Pando, C.P.; et al. Understanding the local and remote source contributions to ambient O3 during a pollution episode using a combination of experimental approaches in the Guadalquivir valley, southern Spain. Sci. Total Environ. 2021, 777, 144579. [Google Scholar] [CrossRef]
  11. Adame, J.A.; Serrano, E.; Bolivar, J.P.; de la Morena, B.A. On the Tropospheric Ozone Variations in a Coastal Area of Southwestern Europe under a Mesoscale Circulation. J. Appl. Meteorol. Climatol. 2010, 49, 748–759. Available online: https://www.jstor.org/stable/26173778 (accessed on 10 September 2022). [CrossRef]
  12. Pay, M.T.; Gangoiti, G.; Guevara, M.; Napelenok, S.; Querol, X.; Jorba, O.; Pérez García-Pando, C. Ozone source apportionment during peak summer events over southwestern Europe. Atmos. Chem. Phys. 2019, 19, 5467–5494. [Google Scholar] [CrossRef]
  13. Castell, N.; Stein, A.F.; Mantilla, E.; Salvador, R.; Millán, M. Evaluation of the use of photochemical indicators to assess ozone-NOx-VOC sensitivity in the southwestern Iberian Peninsula. J. Atmos. Chem. 2009, 63, 73–91. [Google Scholar] [CrossRef]
  14. Dieguez, J.J.; Calatayud, V.; Mantilla, E. CEAM Report for the Ministry of Agriculture, Food and Environment, Fundación Biodiversidad, Informe Final, Memoria Técnica Proyecto CONOZE, CONtaminación por OZono en España, 2014. 137p. Available online: http://www.mapama.gob.es/es/calidad-y-evaluacion-ambiental/temas/atmosfera-y-calidad-del-aire/Informe_t%C3%A9cnico_CONOZE[1]_tcm7-330956.pdf (accessed on 15 September 2022).
  15. Massagué, J.; Contreras, J.; Campos, A.; Alastuey, A.; Querol, A. 2005–2018 trends in ozone peak concentrations and spatial contributions in the Guadalquivir Valley, southern Spain. Atmos. Environ. 2021, 254, 118385. [Google Scholar] [CrossRef]
  16. Adame, J.A.; Gutierrez-Alvarez, I.; Cristofanelli, P.; Notario, A.; Bogeat, J.A.; Bolivar, J.P.; Yela, M. Surface ozone trends at El Arenosillo observatory from a new perspective. Environ. Res. 2022, 214, 113887. [Google Scholar] [CrossRef] [PubMed]
  17. Pérez-Martínez, P.J.; Dunck, J.A.; de Assunção, J.V.; Connerton, P.; Slovic, A.D.; Ribeiro, H.; Miranda, R.M. Long-term commuting times and air quality relationship to COVID-19 in São Paulo. J. Transp. Geogr. 2022, 101, 103349. [Google Scholar] [CrossRef]
  18. Wang, D.; Zhou, T.; Sun, J. Effects of urban form on air quality: A case study from China comparing years with normal and reduced human activity due to the COVID-19 pandemic. Cities 2022, 131, 104040. [Google Scholar] [CrossRef]
  19. Pey, J.; Cerro, J.C. Reasons for the observed tropospheric ozone weakening over south-western Europe during COVID-19: Strict lockdown versus the new normal. Sci. Tot. Environ. 2022, 833, 155162. [Google Scholar] [CrossRef]
  20. Wasserstein, R.L.; Schirm, A.L.; Lazar, N.A. Moving to a world beyond “p < 0.05”. Am. Stat. 2019, 73, 1–19. [Google Scholar] [CrossRef] [Green Version]
  21. AEMET. Olas de calor en España desde 1975: Listado de Provincias Afectadas por las Olas de calor Registradas desde 1975. 2021. Available online: https://www.aemet.es/documentos/es/conocermas/recursos_en_linea/publicaciones_y_estudios/estudios/Olas_calor/RelacionProvincias2021.pdf (accessed on 20 August 2022).
  22. Copernicus Atmosphere Monitoring Service. Repeated Summer Heatwaves Trigger New Ozone Level Peaks throughout Europe. 2022. Available online: https://atmosphere.copernicus.eu/repeated-summer-heatwaves-trigger-new-ozone-level-peaks-throughout-europe (accessed on 20 September 2022).
  23. Cuevas, C.A.; Notario, A.; Adame, J.A.; Hilboll, A.; Richter, A.; Burrows, J.P.; Saiz-Lopez, A. Evolution of NO2 levels in Spain from 1996 to 2012. Sci. Rep. 2014, 4, srep05887. [Google Scholar] [CrossRef] [Green Version]
  24. Derwent, R.G.; Jenkin, M.E.; Saunders, S.M.; Pilling, M.J.; Simmonds, P.G.; Passant, N.R.; Dollard, G.J.; Dumitrean, P.; Kent, A. Photochemical ozone formation in north west Europe and its control. Atmos. Environ. 2003, 37, 1983–1991. [Google Scholar] [CrossRef]
  25. Saavedra, S.; Rodríguez, A.; Taboada, J.J.; Souto-González, J.A.; Casares Long, J.J. Synoptic patterns and air mass transport during ozone episodes in northwestern Iberia. Sci. Tot. Environ. 2012, 441C, 97–110. [Google Scholar] [CrossRef]
  26. Atkinson, R. Atmospheric chemistry of VOCs and NO(x). Atmos. Environ. 2000, 34, 2063–2101. [Google Scholar] [CrossRef]
  27. Sadeghi, B.; Ghahremanloo, M.; Mousavinezhad, S.; Lops, Y.; Pouyaei, A.; Choi, Y. Contributions of meteorology to ozone variations: Application of deep learning and the Kolmogorov-Zurbenko filter. Environ. Pollut. 2022, 310, 119863. [Google Scholar] [CrossRef] [PubMed]
  28. Ghazali, N.A.; Ramli, N.A.; Yahaya, A.S.; Fitri, N.F.; Yusof, M.D.; Sansuddin, N.; Al Madhoun, W.A. Transformation of nitrogen dioxide into ozone and prediction of ozone concentrations using multiple linear regression techniques. Environ. Monit. Assess. 2010, 165, 475–489. [Google Scholar] [CrossRef] [PubMed]
  29. Strode, S.A.; Ziemke, J.R.; Oman, L.D.; Lamsal, L.N.; Olsen, M.A.; Liu, J. Global changes in the diurnal cycle of surface ozone. Atmos. Environ. 2019, 199, 323–333. [Google Scholar] [CrossRef] [Green Version]
  30. Adame, J.A.; Gutierrez-Alvarez, I.; Cristofanelli, P.; Notario, A.; Bogeat, J.A.; Lopez, A.; Gomez, A.; Bolívar, J.P.; Yela, M. Surface ozone trends over a 21-year period at El Arenosillo observatory (Southwestern Europe). Atmos. Res. 2022, 269, 106048. [Google Scholar] [CrossRef]
  31. Colls, J.; Tiwary, A. Air Pollution: Measurements, Modelling and Mitigation, 3rd ed.; Routledge: Abingdon, UK, 2010; 528p, ISBN 10-0415479320. [Google Scholar]
  32. Adame, J.A.; Bolivar, J.P.; de la Morena, B.A. Surface ozone measurements in the southwest of the Iberian Peninsula (Huelva, Spain). Environ. Sci. Pollut. Res. 2010, 17, 355–368. [Google Scholar] [CrossRef]
  33. European Environmental Agency. Europe’s Air Quality Status 2022; ISBN 978-92-9480-464-8. 2022. Available online: https://www.eea.europa.eu/publications/status-of-air-quality-in-Europe-2022/europes-air-quality-status-2022 (accessed on 20 September 2022).
  34. Miyazaki, K.; Bowman, K.; Sekiya, T.; Takigawa, M.; Neu, J.L.; Sudo, K.; Osterman, G.; Eskes, H. Global tropospheric ozone responses to reduced NOxemissions linked to the COVID-19 worldwide lockdowns. Sci. Adv. 2021, 7, 1–14. [Google Scholar] [CrossRef]
  35. Querol, X.; Massagué, J.; Alastuey, A.; Moreno, T.; Gangoiti, G.; Mantilla, E.; Diéguez, J.; Escudero, M.; Monfort, E.; García-Pando, C.P.; et al. Lessons from the COVID-19 air pollution decrease in Spain: Now what? Sci. Total Environ. 2021, 779, 146380. [Google Scholar] [CrossRef]
Figure 1. Study area and the location of both air quality stations in Córdoba city.
Ijerph 19 16210 g001
Figure 2. Hourly evolution of O3 concentrations in Asomadilla and Lepanto monitoring stations during the period 2006–2021.
Ijerph 19 16210 g002
Figure 3. Temporal evolution for (a) daily 95th percentile, (b) mean and (c) 5th percentile of ozone from 2006 to 2021 at ASO and LEP, and the corresponding linear trend. One-month running average values for each time series are also shown.
Ijerph 19 16210 g003
Figure 4. Box plots for ozone concentrations in ASO and LEP during the period 2006–2021. The centre of each box denotes the 50% (P50), and the bottom and top of the box correspond to the 25% (P25) and 75% (P75) values, respectively. The squares indicate the P90 and the circles the P10 values, while the extremes of the box represent the P95 and P5 values. The black cross indicates the average.
Ijerph 19 16210 g004
Figure 5. Monthly evolution of ozone concentration at Asomadilla and Lepanto sites (2006–2021).
Ijerph 19 16210 g005
Figure 6. (a) Daily cycle and (b) monthly daily cycle in Asomadilla and Lepanto during the whole sampling period (2006–2021).
Ijerph 19 16210 g006
Figure 7. Daily cycles in March and April calculated for the whole period (2006–2019) for 2020 and for 2021 in Asomadilla and Lepanto.
Ijerph 19 16210 g007
Table 1. Differences in O3 concentrations in March and April considering three periods (2006–2019, 2020, and 2021). DOF means diurnal.
Ozone Formation.
MarchApril
ASOLEPASOLEP
2006–201922–9 h51.935.762.148.0
12–18 h83.775.691.984.1
DOF31.939.929.836.0
202022–9 h53.942.656.551.5
12–18 h80.779.679.377.9
DOF26.837.122.826.5
202122–9 h46.631.755.646.8
12–18 h79.575.284.579.3
DOF32.843.528.932.4
Publisher’s Note: MDPI stays neutral with regard to jurisdictional claims in published maps and institutional affiliations.

