
Radon Hazard in Central Italy: Comparison among Areas with Different Geogenic Radon Potential

 , , , , and
Abstract
:1. Introduction
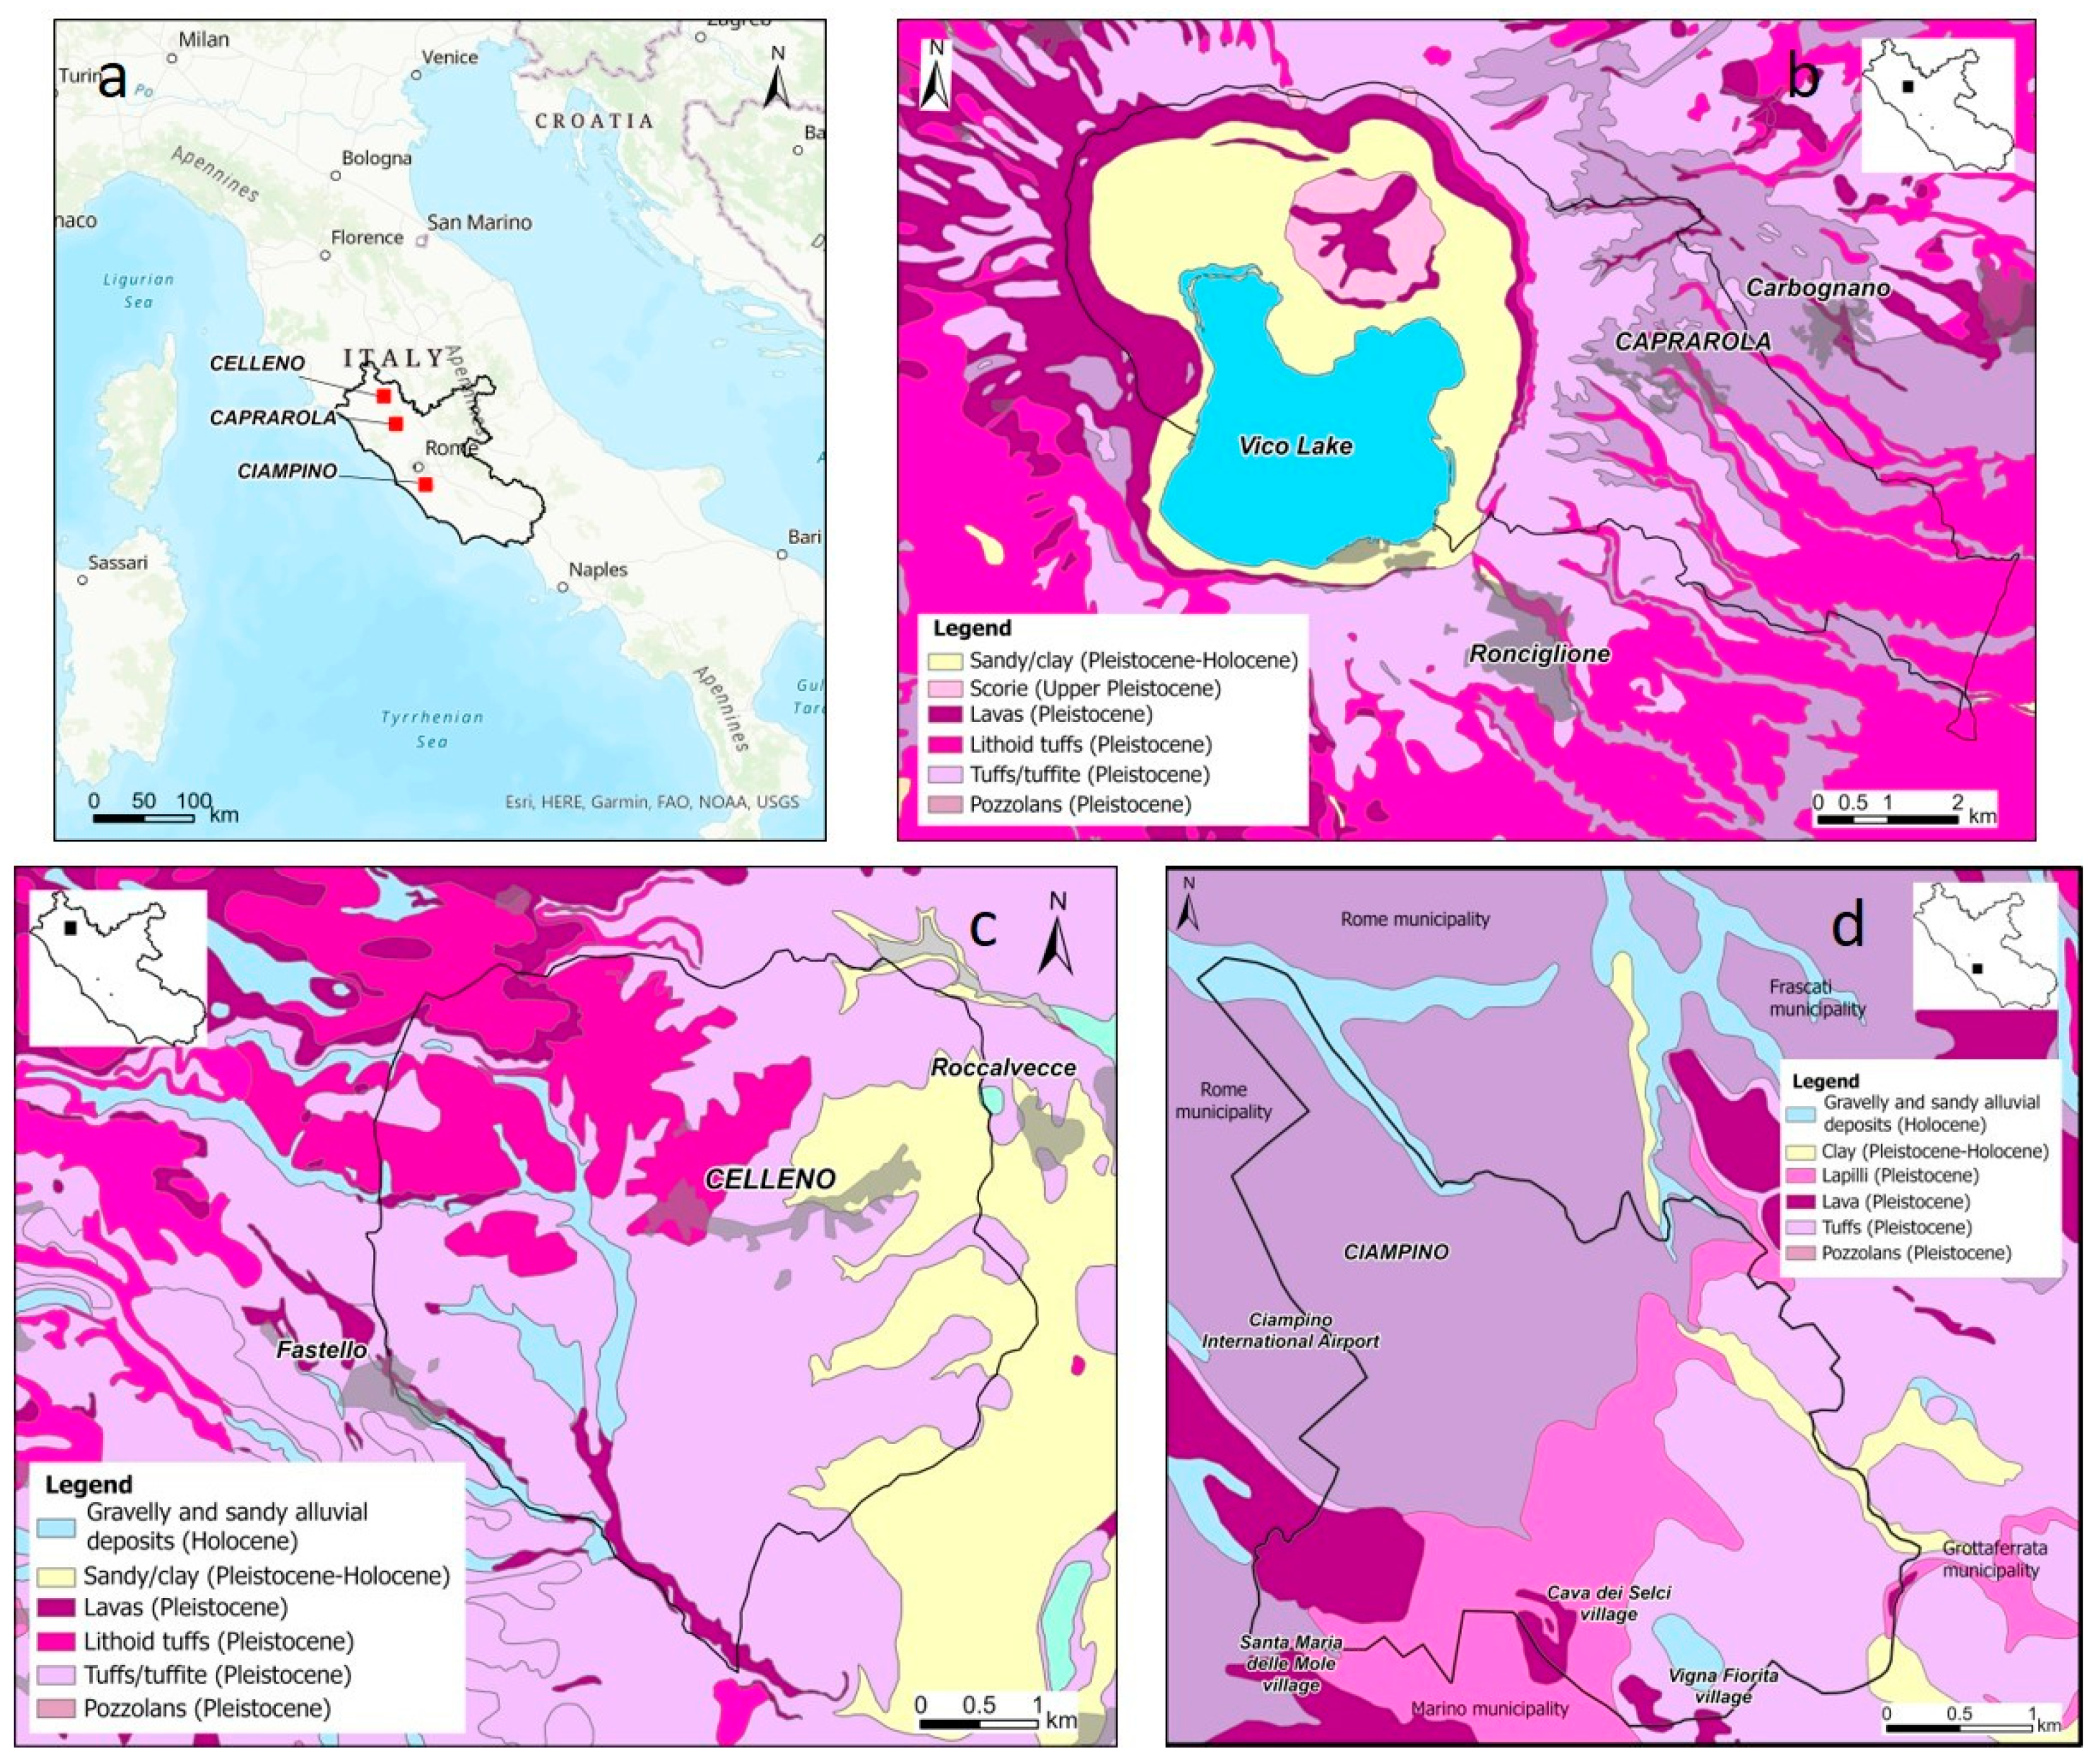
2. Geological Setting of the Study Areas
3. Methodology
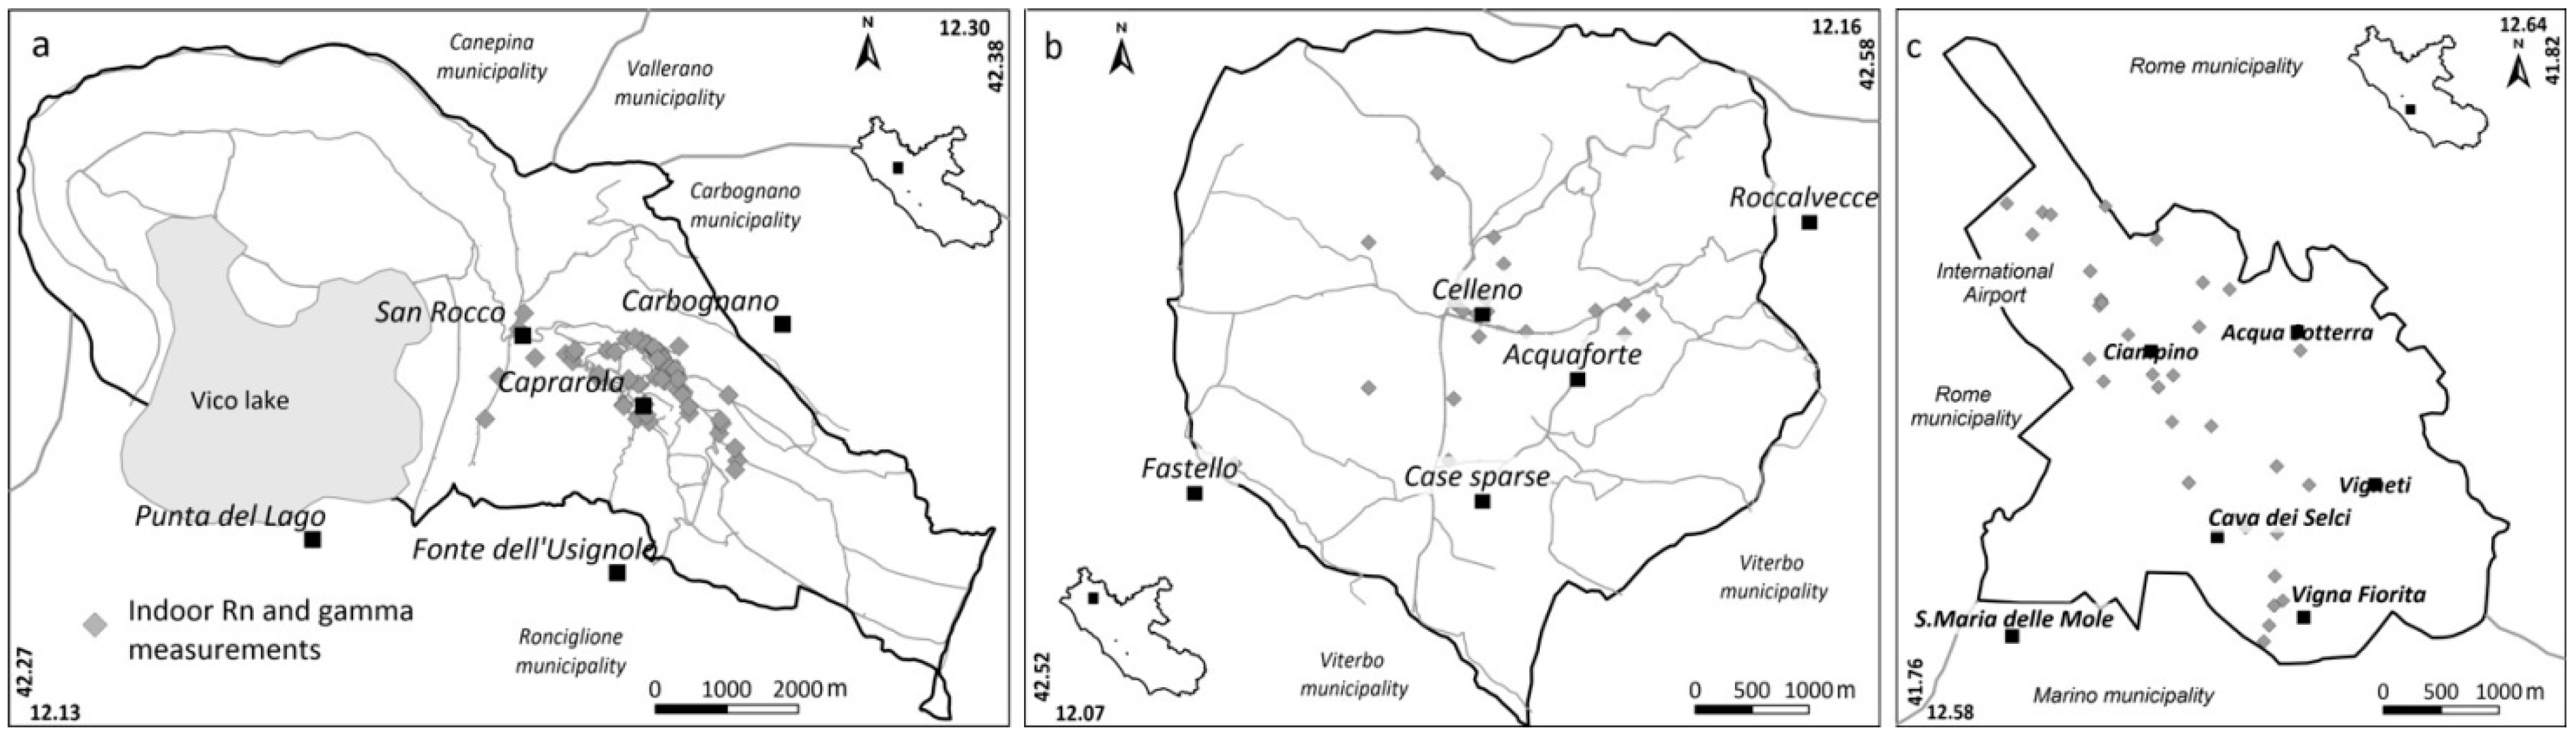
3.1. Site Selection
3.2. Field Activities and Laboratory Analyses
3.2.1. Soil Gas Sampling
3.2.2. Gamma Dose Rate Measurements
3.2.3. Indoor Radon Concentration Measurements
3.2.4. High Resolution Gamma Spectrometry
3.3. Assessment of Radiological Risk Parameters
3.4. Statistical Data Analysis and Mapping Techniques
3.4.1. Exploratory Data Analysis (EDA)
3.4.2. Geostatistics and Spatial Analysis
4. Results
4.1. Outdoor Surveys
- 180 soil gas samples, 187 outdoor gamma measurements and 12 rock/soil samples in the Caprarola municipality (about 57 km2) (new data) (Figure 2a);
4.1.1. Soil Gas and Terrestrial Gamma Dose Surveys
4.1.2. Radionuclide Content of Soil/Rock Samples
4.1.3. Geogenic Radon Potential Maps
4.2. Indoor Surveys
4.2.1. Indoor Gamma Radiation Measurements
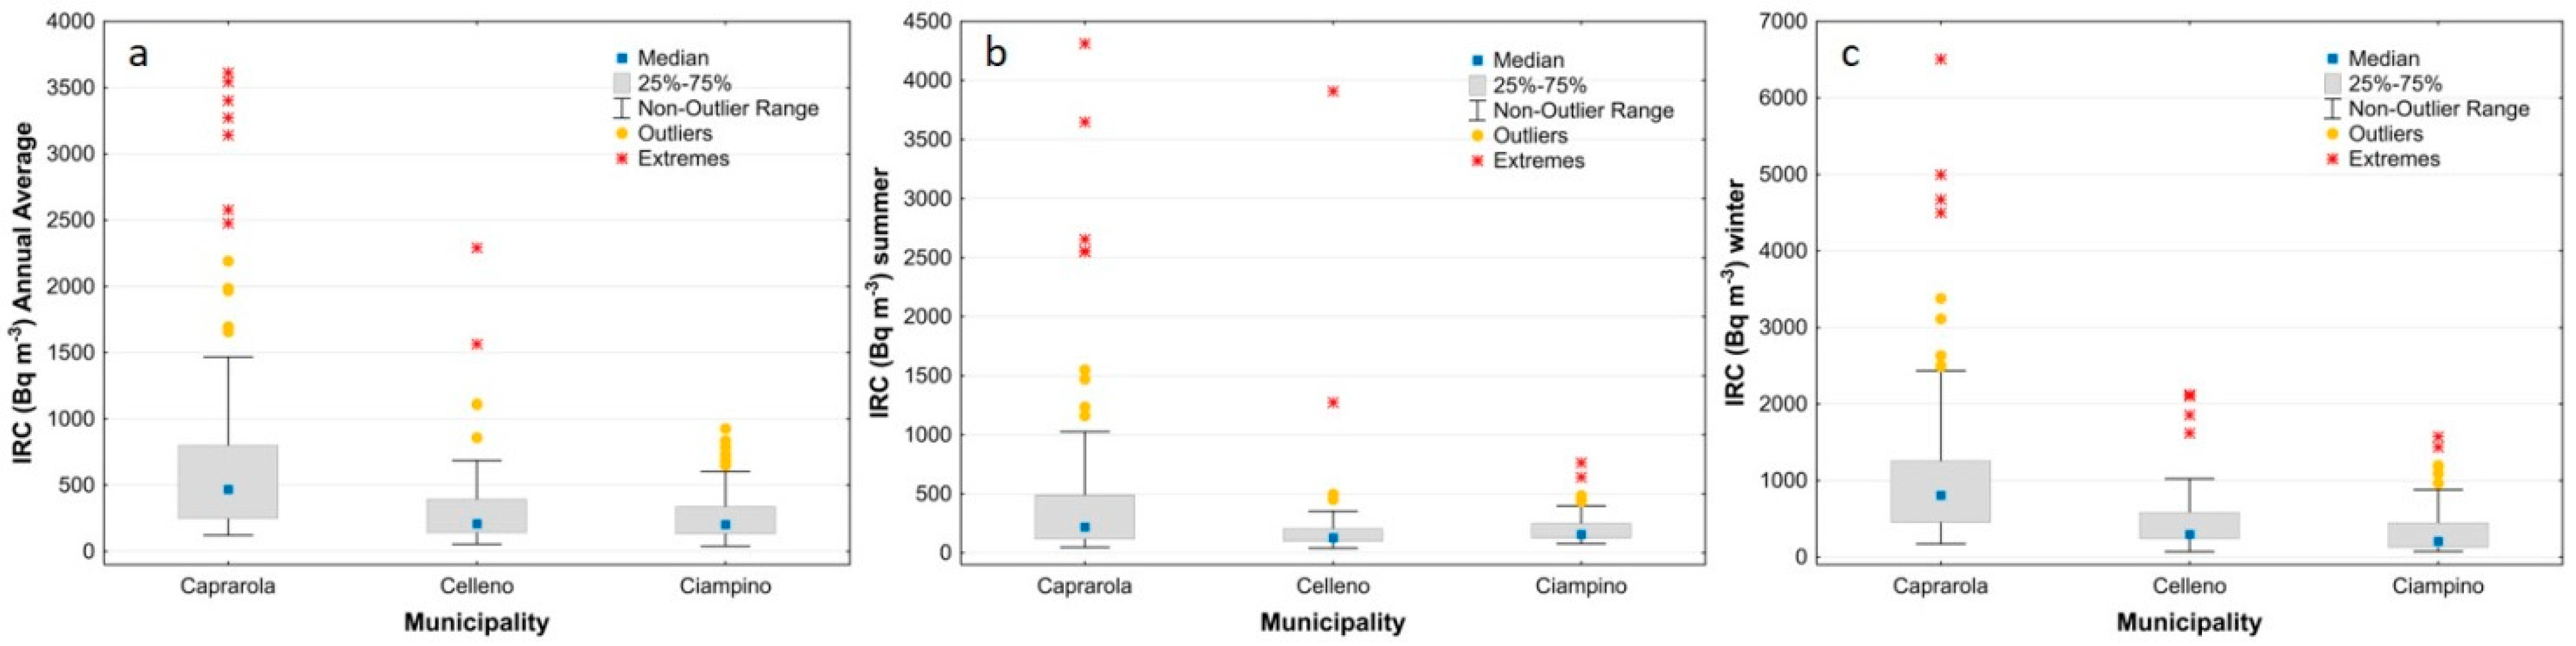
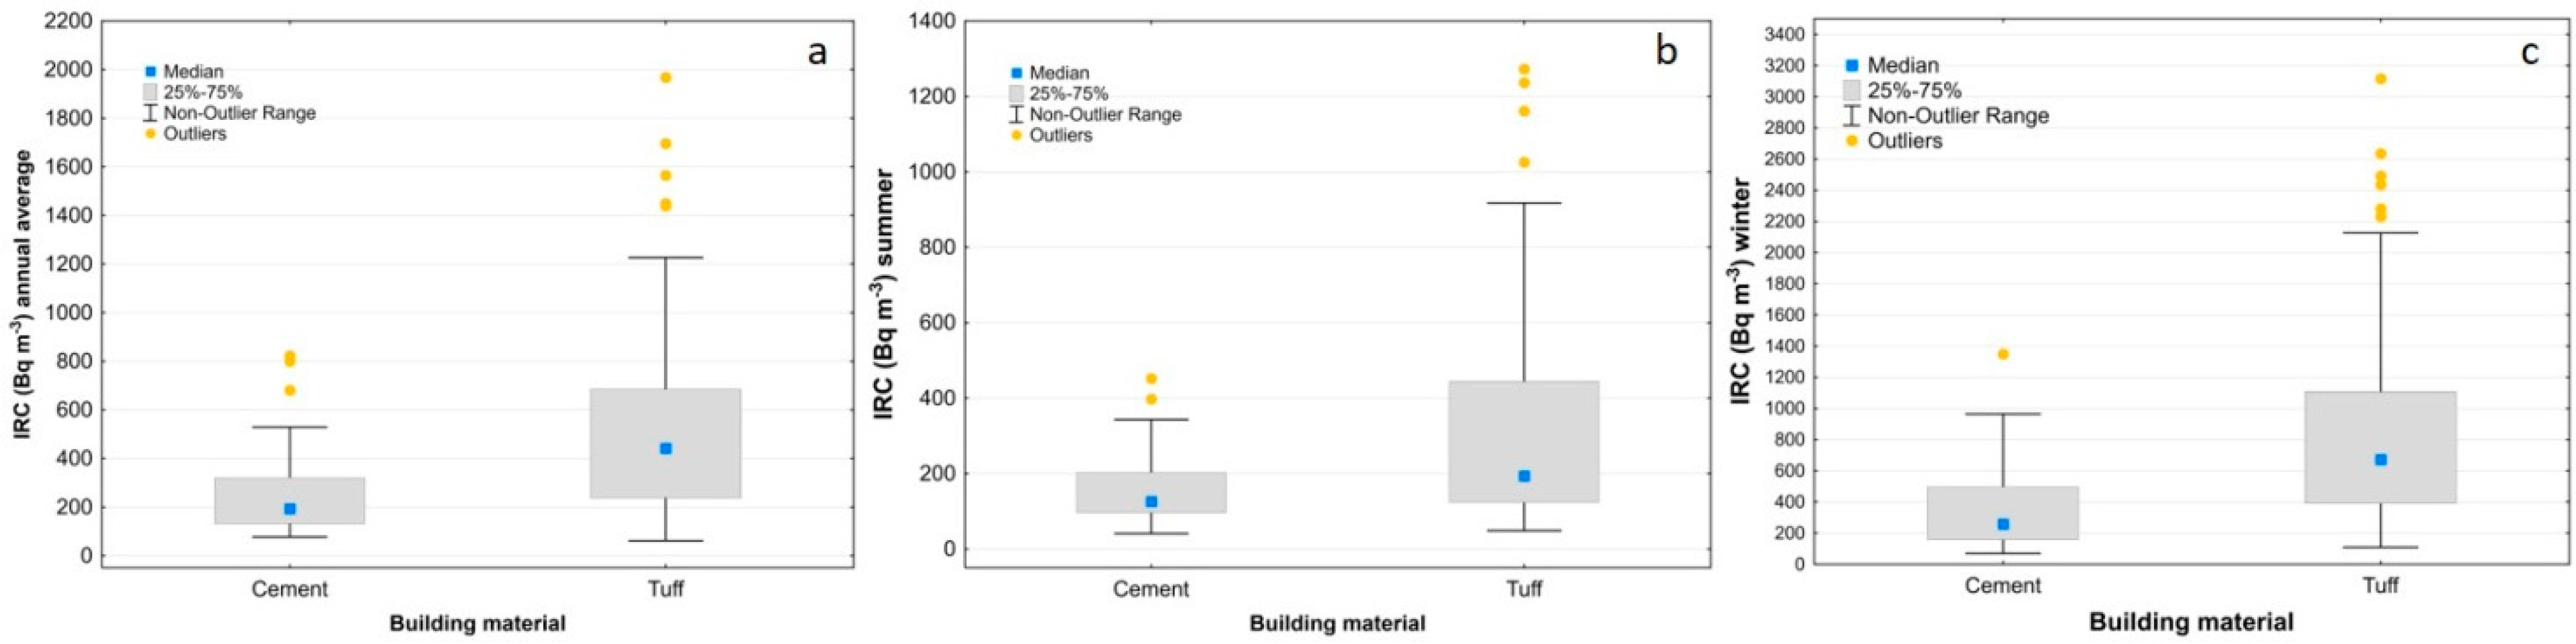
4.2.2. Indoor Radon Concentration Measurements
4.2.3. Radiological Parameters
5. Discussion
5.1. Definition of the Radon Priority Areas
5.2. Assessment of the Radiological Risk
6. Conclusions
Author Contributions
Funding
Institutional Review Board Statement
Informed Consent Statement
Data Availability Statement
Acknowledgments
Conflicts of Interest
References
- National Council on Radiation Protection and Measurements (NCRP). Ionizing Radiation Exposure of the Population of the United States; Report n. 160; National Council on Radiation: Bethesda, MD, USA, 2009. [Google Scholar]
- Thomas, J.R.; Sreejith, M.V.; Aravind, U.K.; Sahu, S.K.; Shetty, P.G.; Swarnakar, M.; Takale, R.A.; Pandit, G.; Aravindakumar, C.T. Outdoor and indoor natural background gamma radiation across Kerala, India. Environ. Sci. Atmos. 2022. [Google Scholar] [CrossRef]
- Zhang, S.-P.; Wu, Z.-Z.; Wu, Y.-W.; Su, S.-B.; Tong, J. Mechanism study of adaptive response in high background radiation area of Yangjiang in China. Chin. J. Prev. Med. 2010, 44, 815–819. [Google Scholar]
- Amiri, M.; Abdi, R.; Shabestani Monfared, A. Estimation of external natural background gamma ray doses to the population of Caspian coastal provinces in North of Iran. Iran J. Radiat. Res. 2011, 9, 183–186. [Google Scholar]
- Field, R.W. Radon: A Leading Environmental Cause of Lung Cancer. Am. Fam. Phys. 2018, 98, 280–282. [Google Scholar]
- Bossew, P. Mapping the Geogenic Radon Potential and Estimation of Radon Prone Areas in Germany. Radiat. Emerg. Med. 2015, 4, 13–20. [Google Scholar]
- Chao, Y.H.C.; Tung, T.C.; Chan, D.W.; Burnett, J. Determination of radon emanation and back diffusion characteristics of building materials in small chamber tests. Build. Environ. 1997, 32, 355–362. [Google Scholar] [CrossRef]
- Tuccimei, P.; Moroni, M.; Norcia, D. Simultaneous determination of 222Rn and 220Rn exhalation rates from building materials used in Central Italy with accumulation chambers and a continuous solid state alpha detector: Influence of particle size, humidity and precursors concentration. Appl. Radiat. Isot. 2006, 64, 254–263. [Google Scholar] [CrossRef] [PubMed]
- Lucchetti, C.; Castelluccio, M.; Altamore, M.; Briganti, A.; Galli, G.; Soligo, M.; Tuccimei, P.; Voltaggio, M. Using a scale model room to assess the contribution of building material of volcanic origin to indoor radon. Nukleonica 2020, 65, 71–76. [Google Scholar] [CrossRef]
- Ciotoli, G.; Voltaggio, M.; Tuccimei, P.; Soligo, M.; Pasculli, A.; Beaubien, S.; Bigi, S. Geographically weighted regression and geostatistical techniques to construct the geogenic radon potential map of the Lazio region: A methodological proposal for the European Atlas of Natural Radiation. J. Environ. Radioact. 2017, 166, 355–375. [Google Scholar] [CrossRef] [PubMed]
- Giustini, F.; Ciotoli, G.; Rinaldini, A.; Ruggiero, L.; Voltaggio, M. Mapping the geogenic radon potential and radon risk by using Empirical Bayesian Kriging regression: A case study from a volcanic area of central Italy. Sci. Total Environ. 2019, 661, 449–464. [Google Scholar] [CrossRef] [PubMed]
- Gruber, V.; Bossew, P.; De Cort, M.; Tollefsen, T. The European map of the geogenic radon potential. J. Radiol. Prot. 2013, 33, 51–60. [Google Scholar] [CrossRef] [PubMed]
- Neznal, M.; Neznal, M.; Matolin, M.; Barnet, I.; Miksova, J. The New Method for Assessing the Radon Risk of Building Sites, Czech Geol; Survey Special Papers; Czech Geological Survey: Prague, Czech Republic, 2004. [Google Scholar]
- Pásztor, L.; Szabó, K.Z.; Szatmári, G.; Laborczi, A.; Horváth, Á. Mapping geogenic radon potential by regression kriging. Sci. Total Environ. 2016, 544, 883–891. [Google Scholar] [CrossRef]
- Dubois, G.A.G. An Overview of Radon Surveys in Europe; Office for Official Publication of the European Communities: Luxembourg, 2005; p. 172. ISBN 92-79-01066-2. [Google Scholar]
- Cafaro, C.; Bossew, P.; Giovani, C.; Garavaglia, M. Definition of radon prone areas in Friuli Venezia Giulia region, Italy, using geostatistical tools. J. Environ. Radioact. 2014, 138, 208–219. [Google Scholar] [CrossRef] [PubMed]
- Coletti, C.; Ciotoli, G.; Benà, E.; Brattich, E.; Cinelli, G.; Galgaro, A.; Massironi, M.; Mazzoli, C.; Mostacci, D.; Morozzi, P.; et al. The assessment of local geological factors for the construction of a Geogenic Radon Potential map using regression kriging. A case study from the Euganean Hills volcanic district (Italy). Sci. Total Environ. 2021, 808, 152064. [Google Scholar] [CrossRef]
- Funiciello, R.; Parotto, M. Il substrato sedimentario nell’area dei Colli Albani: Considerazioni geodinamiche e paleogeografiche sul margine tirrenico dell’Appennino centrale. Geol. Rom. 1978, 17, 233–287. [Google Scholar]
- Faccenna, C.; Funiciello, R.; Mattei, M. Late Pleistocene N–S shear zone along Latium Thyrrenian margin: Structural characters and volcanological implications. Boll. Geofis. Teor. Appl. 1994, 36, 141–144. [Google Scholar]
- Barberi, F.; Buonasorte, G.; Cioni, R.; Fiordelisi, A.; Foresi, L.; Iaccarino, S.; Laurenzi, M.A.; Sbrana, A.; Vernia, A.; Villa, I.M. Plio–Pleistocene geological evolution of the geothermal area of Tuscany and Latium. Mem. Descr. Carta Geol. d’Italia 1994, 49, 77–135. [Google Scholar]
- Peccerillo, A. Plio-Quaternary magmatism in Italy. Episodes 2003, 26, 222–226. [Google Scholar] [CrossRef]
- Laurenzi, M.A.; Villa, I.M. 40Ar/39Ar chronostratigraphy of Vico ignimbrites. Period. Mineral. 1987, 56, 285–293. [Google Scholar]
- Perini, G.; Conticelli, S.; Francalanci, L.; Davidson, J.P. The relationship between potassic and calc-alkaline post-orogenic magmatism at Vico volcano, central Italy. J. Volcanol. Geotherm. Res. 2000, 95, 247–272. [Google Scholar] [CrossRef]
- Gillot, P.Y.; Nappi, G.; Santi, P.; Renzulli, A. Spacetime evolution of the Vulsini Volcanic Complexes, central Italy. Terra Abstr. 1991, 3, 446. [Google Scholar]
- Nappi, G.; Renzulli, A.; Santi, P.; Gillot, Y.P. Geological evolution and geochronology of the Vulsini volcanic district (central Italy). Boll. Soc. Geol. Ital. 1995, 114, 599–613. [Google Scholar]
- Nappi, G.; Marini, A. I cicli eruttivi dei Vulsini Orientali nell’ambito della vulcano tettonica del complesso. Mem. Soc. Geol. Ital. 1986, 35, 679–687. [Google Scholar]
- Palladino, D.M.; Simei, S.; Sottili, G.; Trigila, R. Integrated approach for the reconstruction of stratigraphy and geology of Quaternary volcanic terrains: An application to the Vulsini Volcanoes. Geol. Soc. Am. 2010, 464, 63–84. [Google Scholar]
- Capaccioni, B.; Cinelli, G.; Mostacci, D.; Tositti, L. Long-term risk in a recently active volcanic system: Evaluation of doses and indoor radiological risk in the quaternary Vulsini Volcanic District. J. Volcanol. Geotherm. Res. 2012, 247–248, 26–36. [Google Scholar] [CrossRef]
- De Rita, D.; Faccenna, C.; Funiciello, R.; Rosa, C. Stratigraphy and volcano-tectonics. In The Volcano of the Alban Hills; Trigila, R., Ed.; Università degli Studi di Roma “La Sapienza”: Rome, Italy, 1995; pp. 33–71. [Google Scholar]
- Trigila, R.; Agosta, E.; Currado, C.; De Benedetti, A.A.; Freda, C.; Gaeta, M.; Palladino, D.M.; Rosa, C. Petrology. In The Volcano of the Alban Hills; Trigila, R., Ed.; Università degli Studi di Roma “La Sapienza”: Rome, Italy, 1995; pp. 95–165. [Google Scholar]
- Gerundo, R.; Grimaldi, M.; Marra, A. A methodology Hazard-Based for the Mitigation of the radon risk in the Urban planning. J. Urban Plan. Landsc. Environ. Des.-UPLanD 2016, 1, 27–38. [Google Scholar]
- Mancini, S.; Vilnitis, M.; Guida, M. A Novel Strategy for the Assessment of Radon Risk Based on Indicators. Int. J. Environ. Res. Public Health 2021, 18, 8089. [Google Scholar] [CrossRef]
- Ball, T.K.; Cameron, D.G.; Colman, T.B.; Roberts, P.D. Behaviour of radon in the geological environment: A review. Q. J. Eng. Geol. Hydrogeol. 1991, 24, 169–182. [Google Scholar] [CrossRef]
- Bossew, P.; Cinelli, G.; Ciotoli, G.; Crowley, Q.G.; De Cort, M.; Elio Medina, J.; Gruber, V.; Petermann, E.; Tollefsen, T. Development of a Geogenic Radon Hazard Index—Concept, History, Experiences. Int. J. Environ. Res. Public Health 2020, 17, 4134. [Google Scholar] [CrossRef]
- Haneberg, W.C.; Wiggins, A.; Curl, D.C.; Greb, S.F.; Andrews, W.M., Jr.; Rademacher, K.; Rayens, M.K.; Hahn, E.J. A Geologically Based Indoor-Radon Potential Map of Kentucky. GeoHealth 2020, 4, e2020GH000263. [Google Scholar] [CrossRef]
- Rezaie, F.; Kim, S.W.; Alizadeh, M.; Panahi, M.; Kim, H.; Kim, S.; Lee, J.; Lee, J.; Yoo, J.; Lee, S. Application of Machine Learning Algorithms for Geogenic Radon Potential Mapping in Danyang-Gun, South Korea. Front. Environ. Sci. 2021, 9, 753028. [Google Scholar] [CrossRef]
- Petermann, E.; Meyer, H.; Nussbaum, M.; Bossew, P. Mapping the geogenic radon potential for Germany by machine learning. Sci. Total Environ. 2021, 754, 142291. [Google Scholar] [CrossRef] [PubMed]
- Loffredo, F.; Scala, A.; Serra, M.; Quarto, M. Radon risk mapping: A new geostatistical method based on Lorenz Curve and Gini index. J. Environ. Radioact. 2021, 233, 106612. [Google Scholar] [CrossRef] [PubMed]
- Fernández, A.; Sainz, C.; Celaya, S.; Quindós, L.; Rábago, D.; Fuente, I. A New Methodology for Defining Radon Priority Areas in Spain. Int. J. Environ. Res. Public Health 2021, 18, 1352. [Google Scholar] [CrossRef] [PubMed]
- Gruber, V.; Baumann, S.; Alber, O.; Laubbichler, C.; Bossew, P.; Petermann, E.; Ciotoli, G.; Pereira, A.; Domingos, F.; Tondeur, F.; et al. Comparison of radon mapping methods for the delineation of radon priority areas—An exercise. J. Eur. Radon Assoc. 2021, 2, 5755. [Google Scholar] [CrossRef]
- Annunziatellis, A.; Ciotoli, G.; Lombardi, S.; Nolasco, F. Short- and long-term gas hazard: The release of toxic gases in the Alban Hills volcanic area (central Italy). J. Geochem. Explor. 2003, 77, 93–108. [Google Scholar] [CrossRef]
- Beaubien, S.E.; Ruggiero, L.; Annunziatellis, A.; Bigi, S.; Ciotoli, G.; Deiana, P.; Graziani, S.; Lombardi, S.; Tartarello, M.C. The Importance of Baseline Surveys of Near-Surface Gas Geochemistry for CCS Monitoring, as Shown from Onshore Case Studies in Northern and Southern Europe. Oil Gas Sci. Technol.-Rev. l’IFP 2014, 70, 615–633. [Google Scholar] [CrossRef] [Green Version]
- Ciotoli, G.; Lombardi, S.; Annunziatellis, A. Geostatistical analysis of soil gas data in a high seismic intermontane basin: Fucino Plain, central Italy. J. Geophys. Res. Space Phys. 2007, 112, 05407. [Google Scholar] [CrossRef]
- Hinkle, M.E. Environmental conditions affecting concentrations of He, CO2, O2 and N2 in soil gases. Appl. Geochem. 1994, 9, 53–63. [Google Scholar] [CrossRef]
- Sciarra, A.; Mazzini, A.; Inguaggiato, S.; Vita, F.; Lupi, M.; Hadi, S. Radon and carbon gas anomalies along the Watukosek Fault System and Lusi mud eruption, Indonesia. Mar. Pet. Geol. 2018, 90, 77–90. [Google Scholar] [CrossRef]
- Daniela, G.; Carloni, S.; Voltaggio, M.; Di Lisa, G.A. Pre-anthropic and present outdoor gamma equivalent dose rate of the historic center of Rome (Italy). Radiat. Prot. Dosim. 2019, 187, 518–534. [Google Scholar] [CrossRef]
- Voltaggio, M. Radon progeny in hydrometeors at the earth’s surface. Radiat. Prot. Dosim. 2011, 150, 334–341. [Google Scholar] [CrossRef]
- United Nations Scientific Committee on the Effects of Atomic Radiation (UNSCEAR). Sources and Effects of Ionizing Radiation; Report to the General Assembly, with Scientific Annexes; United Nations: New York, NY, USA, 2000.
- ICRP (International Commission on Radiological Protection). The 2007 recommendations of the. ICRP publication 103. Ann. ICRP 2007, 37, 2–4. [Google Scholar]
- Filzmoser, P.; Garrett, R.G.; Reimann, C. Multivariate outlier detection in exploration geochemistry. Comput. Geosci. 2005, 31, 579–587. [Google Scholar] [CrossRef]
- Reimann, C.; Filzmoser, P.; Garrett, R.G. Background and threshold: Critical comparison of methods of determination. Sci. Total Environ. 2005, 346, 1–16. [Google Scholar] [CrossRef] [PubMed]
- Ciotoli, G.; Etiope, G.; Marra, F.; Florindo, F.; Giraudi, C.; Ruggiero, L. Tiber delta CO2-CH4 degassing: A possible hybrid, tectonically active Sediment-Hosted Geothermal System near Rome. J. Geophys. Res. Solid Earth 2016, 121, 48–69. [Google Scholar] [CrossRef]
- Sinclair, A.J. A fundamental approach to threshold estimation in exploration geochemistry: Probability plots revisited. J. Geochem. Explor. 1991, 41, 1–22. [Google Scholar] [CrossRef]
- Krivoruchko, K.; Gribov, A. Evaluation of empirical Bayesian kriging. Spat. Stat. 2019, 32. [Google Scholar] [CrossRef]
- Matheron, G. Principles of Geostatistics. Econ. Geol. 1963, 58, 1246–1266. [Google Scholar] [CrossRef]
- Journel, A.G.; Huijbregts, C.J. Mining Geostatistics; Academic Press: London, UK; New York, NY, USA, 1978. [Google Scholar]
- Isaaks, E.H.; Srivastava, R.M. An Introduction to Applied Geostatistics; Oxford University Press: New York, NY, USA, 1989. [Google Scholar]
- Clark, I.; Harper, W.V. Practical Geostatistics 2000; Ecosse North America LLC: Columbus, OH, USA, 2000. [Google Scholar]
- Ly, S.; Charles, C.; Degré, A. Geostatistical interpolation of daily rainfall at catchment scale: The use of several variogram models in the Ourthe and Ambleve catchments, Belgium. Hydrol. Earth Syst. Sci. 2011, 15, 2259–2274. [Google Scholar] [CrossRef] [Green Version]
- Castelluccio, M. Soil Radon Concentration Survey in Caffarella Valley Test Site. Ph.D. Thesis, Roma Tre University, Rome, Italy, 2010. [Google Scholar]
- Lucchetti, C. Valutazione Dell’influenza di Cavità Sotterranee e Campi di Fratturazione Sulle Concentrazioni di Radon e Thoron nel Suolo in Aree Idrotermali e Perivulcaniche Della Regione Lazio. Ph.D. Thesis, Roma Tre University, Rome, Italy, 2014. [Google Scholar]
- Annunziatellis, A.; Beaubien, S.E.; Bigi, S.; Ciotoli, G.; Coltella, M.; Lombardi, S. Gas migration along fault systems and through the vadose zone in the Latera caldera (central Italy): Implications for CO2 geological storage. Int. J. Greenh. Gas Control 2008, 2, 353–372. [Google Scholar] [CrossRef]
- Annunziatellis, A.; Ciotoli, G.; Guarino, P.M.; Nisio, S. Nuovi dati sui sinkholes del bacino delle Acque Albule (Tivoli, Roma). In Atti del 2° Workshop Internazionale “I sinkholes. Gli Sprofondamenti Catastrofici Nell’ambiente Naturale ed in Quello Antropizzato”; ISPRA: Rome, Italy, 2010; pp. 395–412. [Google Scholar]
- Beaubien, S.E.; Ciotoli, G.; Lombardi, S. Carbon dioxide and radon gas hazard in the Alban Hills area (central Italy). J. Volcanol. Geotherm. Res. 2003, 123, 63–80. [Google Scholar] [CrossRef]
- Bigi, S.; Beaubien, S.E.; Ciotoli, G.; D’Ambrogi, C.; Doglioni, C.; Ferrante, V.; Lombardi, S.; Mill, S.; Orlando, L.; Ruggiero, L.; et al. Mantle-derived CO2 migration along active faults within an extensional basin margin (Fiumicino, Rome, Italy). Tectonophysics 2014, 637, 137–149. [Google Scholar] [CrossRef]
- ARPA Lazio; ISPRA. Il Monitoraggio del Gas Radon Nel Lazio; Arpa Lazio: Rieti, Italy, 2013; p. 56. [Google Scholar]
- Pereira, A.J.S.C.; Neves, L.J.P.F. Estimation of the radiological background and dose assessment in areas with naturally occurring uranium geochemical anomalies: A case study in the Iberian Massif (Central Portugal). J. Environ. Radioact. 2012, 112, 96–107. [Google Scholar] [CrossRef]
- Senitkova, I.J.; Kraus, M. Seasonal and Floor Variations of Indoor Radon Concentration. IOP Conf. Ser. Earth Environ. Sci. 2019, 221, 012127. [Google Scholar] [CrossRef]
- International Commission on Radiological Protection (ICRP). Protection Against Rn-222 at Home and at Work International Commission on Radiological Protection Publication 65; ICRP Publication: Oxford, UK, 1993. [Google Scholar]
- Dionisi, M.; Fontani, S.; Innocenzi, V.; Menna, G.; Parisi, D.; Salierno, C.; Torri, G.; Zeppa, P.; Wells, J. Environmental Data Yearbook APAT; APAT: Rome, Italy, 2005. [Google Scholar]
- United Nations Scientific Committee on the Effects of Atomic Radiation (UNSCEAR). Sources and Effects of Ionizing Radiation; Report to General Assembly; United Nations: New York, NY, USA, 2008.
- Quarto, M.; Pugliese, M.; La Verde, G.; Loffredo, F.; Roca, V. Radon Exposure Assessment and Relative Effective Dose Estimation to Inhabitants of Puglia Region, South Italy. Int. J. Environ. Res. Public Health 2015, 12, 14948–14957. [Google Scholar] [CrossRef] [PubMed] [Green Version]
- Pugliese, M.; Quarto, M.; De Cicco, F.; De Sterlich, C.; Roca, V. Radon Exposure Assessment for Sewerage System’s Workers in Naples, South Italy. Indoor Built. Environ. 2013, 22, 575–579. [Google Scholar] [CrossRef]
- Loffredo, F.; Savino, F.; Amato, R.; Irollo, A.; Gargiulo, F.; Sabatino, G.; Serra, M.; Quarto, M. Indoor Radon Concentration and Risk Assessment in 27 Districts of a Public Healthcare Company in Naples, South Italy. Life 2021, 11, 178. [Google Scholar] [CrossRef] [PubMed]
- Qureshi, A.A.; Tariq, S.; Ud Din, K.; Manzoor, S.; Calligaris, C.; Waheed, A. Evaluation of excessive lifetime cancer risk due to natural radioactivity in the rivers sediments of Northern Pakistan. J. Radiat. Res. Appl. Sci. 2014, 7, 438–447. [Google Scholar] [CrossRef] [Green Version]
- NCU. Surveillance, Epidemiology, and End Results (SEER) Program. Annual Report to the Nation on the Status of Cancer. 2009. Available online: https://seer.cancer.gov/report_to_nation/ (accessed on 11 December 2021).


| Site | N | Mean (CI ± 95%) | GM | Median | Min | Max | St.Dev. | G.Std.Dev. | Sk | CV | Std.Sk | Std.Kur |
|---|---|---|---|---|---|---|---|---|---|---|---|---|
| Caprarola | 180 | 157.9 (142.9–168.4) | 130.4 | 142.0 | 17.0 | 865.0 | 98.9 | 1.9 | 2.4 | 0.6 | −4.9 | 2.3 |
| Celleno * | 185 | 60.0 (53.3–67.4) | 45.1 | 40.2 | 6.4 | 253.0 | 48.7 | 2.1 | 1.5 | 0.8 | 1.1 | −1.5 |
| Ciampino ** | 120 | 56.2 (51.7–60.3) | 41.3 | 41.3 | 1.5 | 444.0 | 48.0 | 2.2 | 2.7 | 0.8 | −3.2 | 2.5 |
| Lazio Region *** | 7610 | 38.6 (37.4–39.8) | 19.5 | 21.5 | 0.37 | 828.0 | 54.4 | 3.7 | 4.7 | 1.4 |
| Site | N | Mean (CI ± 95%) | GM | Median | Min | Max | St.Dev. | G.Std.Dev. | Sk | CV | Std.Sk | Std.Kur |
|---|---|---|---|---|---|---|---|---|---|---|---|---|
| Caprarola | 187 | 0.36 (0.35–0.38) | 0.35 | 0.34 | 0.15 | 0.97 | 0.11 | 1.34 | 1.36 | 0.31 | 0.18 | 0.35 |
| Celleno * | 82 | 0.23 (0.22–0.24) | 0.22 | 0.22 | 0.13 | 0.42 | 0.05 | 1.22 | 0.96 | 0.20 | 0.27 | 0.54 |
| Ciampino | 96 | 0.15 (0.14–0.15) | 0.15 | 0.15 | 0.10 | 0.24 | 0.02 | 1.15 | 0.97 | 0.14 | 0.25 | 0.49 |
| Caprarola | Celleno * | Ciampino ** | ||||||||||
|---|---|---|---|---|---|---|---|---|---|---|---|---|
| Lithology | 238U Bq/kg | 226Ra Bq/kg | 232Th Bq/kg | 40K Bq/kg | 238U Bq/kg | 226Ra Bq/kg | 232Th Bq/kg | 40K Bq/kg | 238U Bq/kg | 226Ra Bq/kg | 232Th Bq/kg | 40K Bq/kg |
| Alluvial deposits (Holocene) | 253 ± 5 | 102 ± 2 | 222 ± 1 | 642 ± 10 | 127 ± 2 | 112 ± 1 | 141 ± 1 | 457 ± 8 | 71 ± 3 | 67 ± 1 | 205 ± 4 | 916 ± 13 |
| 144 ± 4 | 169 ± 2 | 241 ± 1 | 1019 ± 15 | 250 ± 5 | 261 ± 4 | 256 ± 2 | 1046 ± 13 | |||||
| 139 ± 4 | 98 ± 2 | 156 ± 1 | 317 ± 5 | 80 ± 2 | 81 ± 1 | 192 ± 1 | 629 ± 9 | |||||
| Sandy-clay (Pleistocene-Holocene) | 231 ± 5 | 193 ± 4 | 356 ± 2 | 1236 ± 19 | 42 ± 1 | 47 ± 1 | 80 ± 1 | 572 ± 8 | ||||
| 85 ± 2 | 83 ± 1 | 146 ± 1 | 653 ± 10 | 43 ± 1 | 46 ± 1 | 78 ± 1 | 605 ± 9 | |||||
| 183 ± 4 | 171 ± 2 | 247 ± 1 | 921 ± 14 | |||||||||
| Lava (Pleistocene) | 196 ± 4 | 181 ± 2 | 183 ± 1 | 1671 ± 13 | ||||||||
| 107 ± 2 | 119 ± 2 | 335 ± 2 | 1504 ± 23 | |||||||||
| Tuff and tuffite (Pleistocene) | 201 ± 4 | 194 ± 4 | 371 ± 2 | 774 ± 12 | 89 ± 2 | 74 ± 1 | 211 ± 2 | 1460 ± 15 | 158 | 398 | 187 | |
| 185 ± 4 | 157 ± 2 | 358 ± 2 | 766 ± 11 | 135 ± 4 | 127 ± 1 | 247 ± 2 | 798 ± 10 | 150 | 470 | 181 | ||
| 171 ± 4 | 133 ± 2 | 238 ± 2 | 658 ± 10 | 92 ± 2 | 87 ± 1 | 249 ± 2 | 815 ± 12 | |||||
| 129 ± 4 | 103 ± 2 | 206 ± 1 | 482 ± 7 | 281 ± 5 | 295 ± 4 | 282 ± 2 | 916 ± 14 | |||||
| 140 ± 4 | 147 ± 2 | 299 ± 2 | 710 ± 11 | |||||||||
| 102 ± 2 | 103 ± 2 | 252 ± 2 | 562 ± 8 | |||||||||
| Lithoid tuff (Pleistocene) | 145 ± 4 | 166 ± 2 | 218 ± 1 | 722 ± 11 | 119 ± 2 | 84 ± 1 | 182 ± 1 | 403 ± 8 | 227 ± 4 | 66 ± 1 | 204 ± 4 | 600 ± 13 |
| 369 ± 6 | 318 ± 4 | 481 ± 3 | 1231 ± 18 | 78 ± 2 | 60 ± 1 | 170 ± 1 | 665 ± 10 | 45 ± 3 | 43 ± 41 | 79 ± 2 | 471 ± 10 | |
| 147 ± 4 | 145 ± 2 | 195 ± 1 | 619 ± 9 | 118 ± 2 | 124 ± 2 | 254 ± 2 | 681 ± 10 | 55 ± 3 | 58 ± 1 | 108 ± 2 | 557 ± 12 | |
| 272 ± 5 | 185 ± 4 | 304 ± 2 | 604 ± 9 | 98 ± 2 | 108 ± 2 | 216 ± 1 | 299 ± 4 | 97 | 195 | 128 | ||
| 94 ± 2 | 89 ± 1 | 226 ± 1 | 826 ± 12 | |||||||||
| 173 ± 4 | 165 ± 2 | 293 ± 2 | 1313 ± 20 | |||||||||
| 186 ± 4 | 207 ± 3 | 365 ± 2 | 2480 ± 37 | |||||||||
| 120 ± 2 | 121 ± 2 | 320 ± 2 | 1452 ± 22 | |||||||||
| 53 ± 1 | 56 ± 1 | 162 ± 1 | 725 ± 11 | |||||||||
| Lapilli (Pleistocene) | 220 | 379 | 251 | |||||||||
| 228 | 376 | 264 | ||||||||||
| Pozzolana (Pleistocene) | 132 ± 3 | 111 ± 2 | 213 ± 4 | 1484 ± 8 | ||||||||
| 142 | 341 | 85 | ||||||||||
| Municipality | Very Low | Low | Medium | High | Very High |
|---|---|---|---|---|---|
| Caprarola | 0–70 | 70–110 | 110–160 | 160–220 | 220–360 |
| Celleno | 0–40 | 40–70 | 70–100 | 100–150 | 150–270 |
| Ciampino | 0–20 | 10–55 | 55–70 | 70–100 | 100–230 |
| Indoor Gamma Radiation (μSv/h) | Municipality | N | Mean (CI ± 95%) | GM | Median | Min | Max | LQ | UQ | St.Dev. | CV | Sk |
|---|---|---|---|---|---|---|---|---|---|---|---|---|
| Room centre | Caprarola | 142 | 0.43 (0.40–0.46) | 0.40 | 0.40 | 0.11 | 1.42 | 0.30 | 0.54 | 0.18 | 42.27 | 1.52 |
| Celleno | 43 | 0.29 (0.26–0.33) | 0.27 | 0.29 | 0.13 | 0.57 | 0.19 | 0.36 | 0.11 | 37.47 | 0.63 | |
| Ciampino | 74 | 0.18 (0.16–0.19) | 0.16 | 0.17 | 0.06 | 0.38 | 0.11 | 0.22 | 0.07 | 41.26 | 0.42 | |
| All data | 259 | 0.34 (0.31–0.36) | 0.29 | 0.31 | 0.06 | 1.42 | 0.21 | 0.43 | 0.19 | 55.23 | 1.38 | |
| Wall | Caprarola | 141 | 0.57 (0.53–0.61) | 0.53 | 0.56 | 0.10 | 1.64 | 0.42 | 0.68 | 0.22 | 38.49 | 1.23 |
| Celleno | 43 | 0.37 (0.33–0.42) | 0.34 | 0.38 | 0.14 | 0.75 | 0.26 | 0.45 | 0.15 | 40.61 | 0.41 | |
| Ciampino | 74 | 0.20 (0.18–0.23) | 0.18 | 0.19 | 0.06 | 0.42 | 0.12 | 0.29 | 0.10 | 49.02 | 0.30 | |
| All data | 258 | 0.43 (0.40–0.46) | 0.36 | 0.40 | 0.06 | 1.64 | 0.26 | 0.58 | 0.24 | 56.19 | 0.95 |
| Indoor Radon Concentration (Bq/m3) | Municipality | N | Mean (CI ± 95%) | GM | Median | Min | Max | LQ | UQ | St.Dev. | CV |
|---|---|---|---|---|---|---|---|---|---|---|---|
| Annual average | Caprarola | 127 | 701 (573–829) | 491 | 470 | 123 | 3613 | 248 | 800 | 728 | 104 |
| Celleno | 44 | 378 (247–509) | 256 | 211 | 55 | 2291 | 142 | 392 | 431 | 114 | |
| Ciampino | 76 | 283 (237–329) | 227 | 203 | 40 | 926 | 134 | 338 | 202 | 71 | |
| Summer | Caprarola | 118 | 455 (335–576) | 259 | 221 | 49 | 4313 | 118 | 490 | 661 | 145 |
| Celleno | 41 | 285 (92–479) | 160 | 129 | 41 | 3909 | 100 | 206 | 614 | 215 | |
| Ciampino | 76 | 205 (177–233) | 181 | 157 | 79 | 764 | 126 | 248 | 121 | 59 | |
| Winter | Caprarola | 114 | 1091 (900–1283) | 801 | 808 | 174 | 6507 | 455 | 1256 | 1032 | 95 |
| Celleno | 41 | 527 (362–692) | 373 | 298 | 70 | 2126 | 242 | 584 | 522 | 99 | |
| Ciampino | 76 | 362 (287–437) | 259 | 209 | 74 | 1575 | 128 | 447 | 329 | 91 |
| Municipality | Inhalation Dose (D) (mSv/y) (Min–Max) | AEDEin (mSv/y) (Min–Max) | AEDEout (mSv/y) (Min–Max) | ELCRin (×10−3) (Min–Max) | ELCRout (×10−3) (Min–Max) |
|---|---|---|---|---|---|
| Caprarola | 12.06 (0.16–91.05) | 3.04 (0.74–9.92) | 0.64 (0.27–1.70) | 11.71 (2.87–38.19) | 2.55 (1.08–6.80) |
| Celleno | 8.11 (0.35–39.43) | 2.06 (0.92–4.03) | 0.40 (0.23–0.73) | 7.94 (3.55–15.50) | 1.60 (0.91–2.91) |
| Ciampino | 5.18 (0.70–23.35) | 1.24 (0.44–2.68) | 0.26 (0.18–0.41) | 4.77 (1.70–10.33) | 1.03 (0.73–1.65) |
| World average * | 3.50 | 0.45 | 0.11 | 1.16 | 0.29 |
| Health District | Cancer Type | Crude Incidence Rate (CIR) |
|---|---|---|
| ASL Viterbo Distretto C (Caprarola) | All cancer types | 643.3 |
| Tracheal, bronchus and lung cancer | 68.4 | |
| ASL Viterbo Distretto B (Celleno) | All cancer types | 633.0 |
| Tracheal, bronchus and lung cancer | 58.8 | |
| ASL Roma 6, Distretto H3 (Ciampino) | All cancer types | 630.9 |
| Tracheal, bronchus and lung cancer | 62.1 |
Publisher’s Note: MDPI stays neutral with regard to jurisdictional claims in published maps and institutional affiliations. |
© 2022 by the authors. Licensee MDPI, Basel, Switzerland. This article is an open access article distributed under the terms and conditions of the Creative Commons Attribution (CC BY) license (https://creativecommons.org/licenses/by/4.0/).
Share and Cite
Giustini, F.; Ruggiero, L.; Sciarra, A.; Beaubien, S.E.; Graziani, S.; Galli, G.; Pizzino, L.; Tartarello, M.C.; Lucchetti, C.; Sirianni, P.; et al. Radon Hazard in Central Italy: Comparison among Areas with Different Geogenic Radon Potential. Int. J. Environ. Res. Public Health 2022, 19, 666. https://doi.org/10.3390/ijerph19020666
Giustini F, Ruggiero L, Sciarra A, Beaubien SE, Graziani S, Galli G, Pizzino L, Tartarello MC, Lucchetti C, Sirianni P, et al. Radon Hazard in Central Italy: Comparison among Areas with Different Geogenic Radon Potential. International Journal of Environmental Research and Public Health. 2022; 19(2):666. https://doi.org/10.3390/ijerph19020666
Chicago/Turabian StyleGiustini, Francesca, Livio Ruggiero, Alessandra Sciarra, Stan Eugene Beaubien, Stefano Graziani, Gianfranco Galli, Luca Pizzino, Maria Chiara Tartarello, Carlo Lucchetti, Pietro Sirianni, and et al. 2022. "Radon Hazard in Central Italy: Comparison among Areas with Different Geogenic Radon Potential" International Journal of Environmental Research and Public Health 19, no. 2: 666. https://doi.org/10.3390/ijerph19020666