Article

Transcriptional Responses of Stress-Related Genes in Pale Chub (Zacco platypus) Inhabiting Different Aquatic Environments: Application for Biomonitoring Aquatic Ecosystems

1
Department of Ocean Integrated Science, Chonnam National University, Yeosu 59626, Korea
2
Fisheries Science Institute, Chonnam National University, Yeosu 59626, Korea
*
Author to whom correspondence should be addressed.
These authors contributed equally to this work.
Int. J. Environ. Res. Public Health 2022, 19(18), 11471; https://doi.org/10.3390/ijerph191811471
Submission received: 12 August 2022 / Revised: 7 September 2022 / Accepted: 8 September 2022 / Published: 12 September 2022

Abstract

:
Pale chub (Zacco platypus) is a dominant species in urban rivers and reservoirs, and it is used as an indicator to monitor the effects of environmental contaminants. Gene responses at the molecular level can reflect the health of fish challenged with environmental stressors. The objective of this study was to identify correlations between water quality factors and the expression of stress-related genes in Z. platypus from different lake environments (Singal and Juam Lakes). To do so, transcriptional responses of genes involving cellular homeostasis (heat-shock protein 70, HSP70; heat-shock protein 90, HSP90), metal detoxification (metallothionein, MT), and antioxidation (superoxide dismutase, SOD; catalase, CAT) were analyzed in the gill and liver tissues of Z. platypus. HSP70, HSP90, and MT genes were overall upregulated in Z. platypus from Singal Lake, which suffered from poorer water quality than Juam Lake. In addition, gene responses were significantly higher in Singal Lake outflow. Upregulation of HSP70, HSP90, and MT was significantly higher in Z. platypus gills than in the liver tissue. In addition, integrated biomarker response and heatmap analysis determined correlations between expression of biomarker genes or water quality factors and sampling sites of both lakes. These results suggest that stress-related genes used as multiple biomarkers may reflect spatial characteristics and water quality of different lake environments, and they can be used for biomonitoring and ecological risk assessment.

1. Introduction

Aquatic environments are the ultimate sink for a wide variety of pollutants whose range and intensity are increasing in the organisms inhabiting these environments [1]. Scientific technological development and industrial advancement have resulted in a massive upsurge in the amount of industrial chemicals produced in recent decades. As the release of wastewater chemicals and manmade industrial products increases, emerging and persistent pollutants are frequently detected in aquatic ecosystems. These processes also lead to the enrichment of toxic and bioaccumulative compounds in aquatic organisms, such as fish [2]. Fish can be a useful species for biomonitoring aquatic environments because of their ubiquity and key ecological position at a high tropic level in aquatic ecosystems [3,4,5]. To understand how fish respond to the stressors of an aquatic environment, the use of complementary biomarkers is recommended for risk monitoring in aquatic ecosystems [6,7,8].
From the organism to molecular level, biomarker responses have been broadly used to assess the potential effects of environmental stressors, including toxic chemicals, wastewater mixtures, and hazardous substances, in aquatic environments [5,7,9,10,11]. Biomarkers as “early warning” signs have been used to identify the comprehensive effects of toxicants on the health of the individual before these effects are observed at the population level in an ecosystem [12,13]. In addition, biomonitoring through a comprehensive understanding of biomarkers can represent measures of health in the freshwater environments. In particular, molecular biomarkers can reflect potential toxicities in the form of altered gene expression in cellular defense systems in fish [5,7,14,15,16]. The pale chub (Zacco platypus) is a dominant species in freshwater environments that is distributed in a wide range of eastern Asian regions such as Korea, Japan, and China [17,18]. It is omnivorous and consumes aquatic insects and algae as main food sources [5]. At this time, the molecular responses in fish have mostly been studied with respect to the effects of exposures to chemical compounds such as benzo(a)pyrene in Oryzias latipes or Oreochromis niloticus fish [4,16]. The previous reported studies on molecular biomarkers were mostly limited to toxicity tests in the laboratory, using experimental rearing species that are relatively easy to handle. In addition, although antioxidant and physiological responses to toxicants or wastewater are reported in Z. platypus, there is not enough information regarding the molecular responses to environmental stressors in wild fish such as Z. platypus.
Ecosystems of standing (lentic) reservoirs easily accumulate environmental pollutants from natural and anthropogenic sources [19,20]. In this study, we analyzed stress-related genes in Z. platypus inhabiting two different lentic ecosystems (Singal and Juam Lakes) in order to evaluate gene expression responses for biomonitoring applications in aquatic environments. Singal Lake is situated in an urban environment, which exposes it to anthropogenic inputs, whereas Juam Lake is surrounded by forest. We observed the transcription of genes involving cellular homeostasis (heat-shock protein 70, HSP70; heat-shock protein 90, HSP90), metal detoxification (metallothionein, MT), and antioxidation (superoxide dismutase, SOD; catalase, CAT) in the gills and livers of Z. platypus from each lake. In addition, the integration of biomarker responses (IBR) and heatmap analysis were used to compare gene expression, water quality factors, and sampling sites (inflow or outflow) of each lake.

2. Materials and Methods

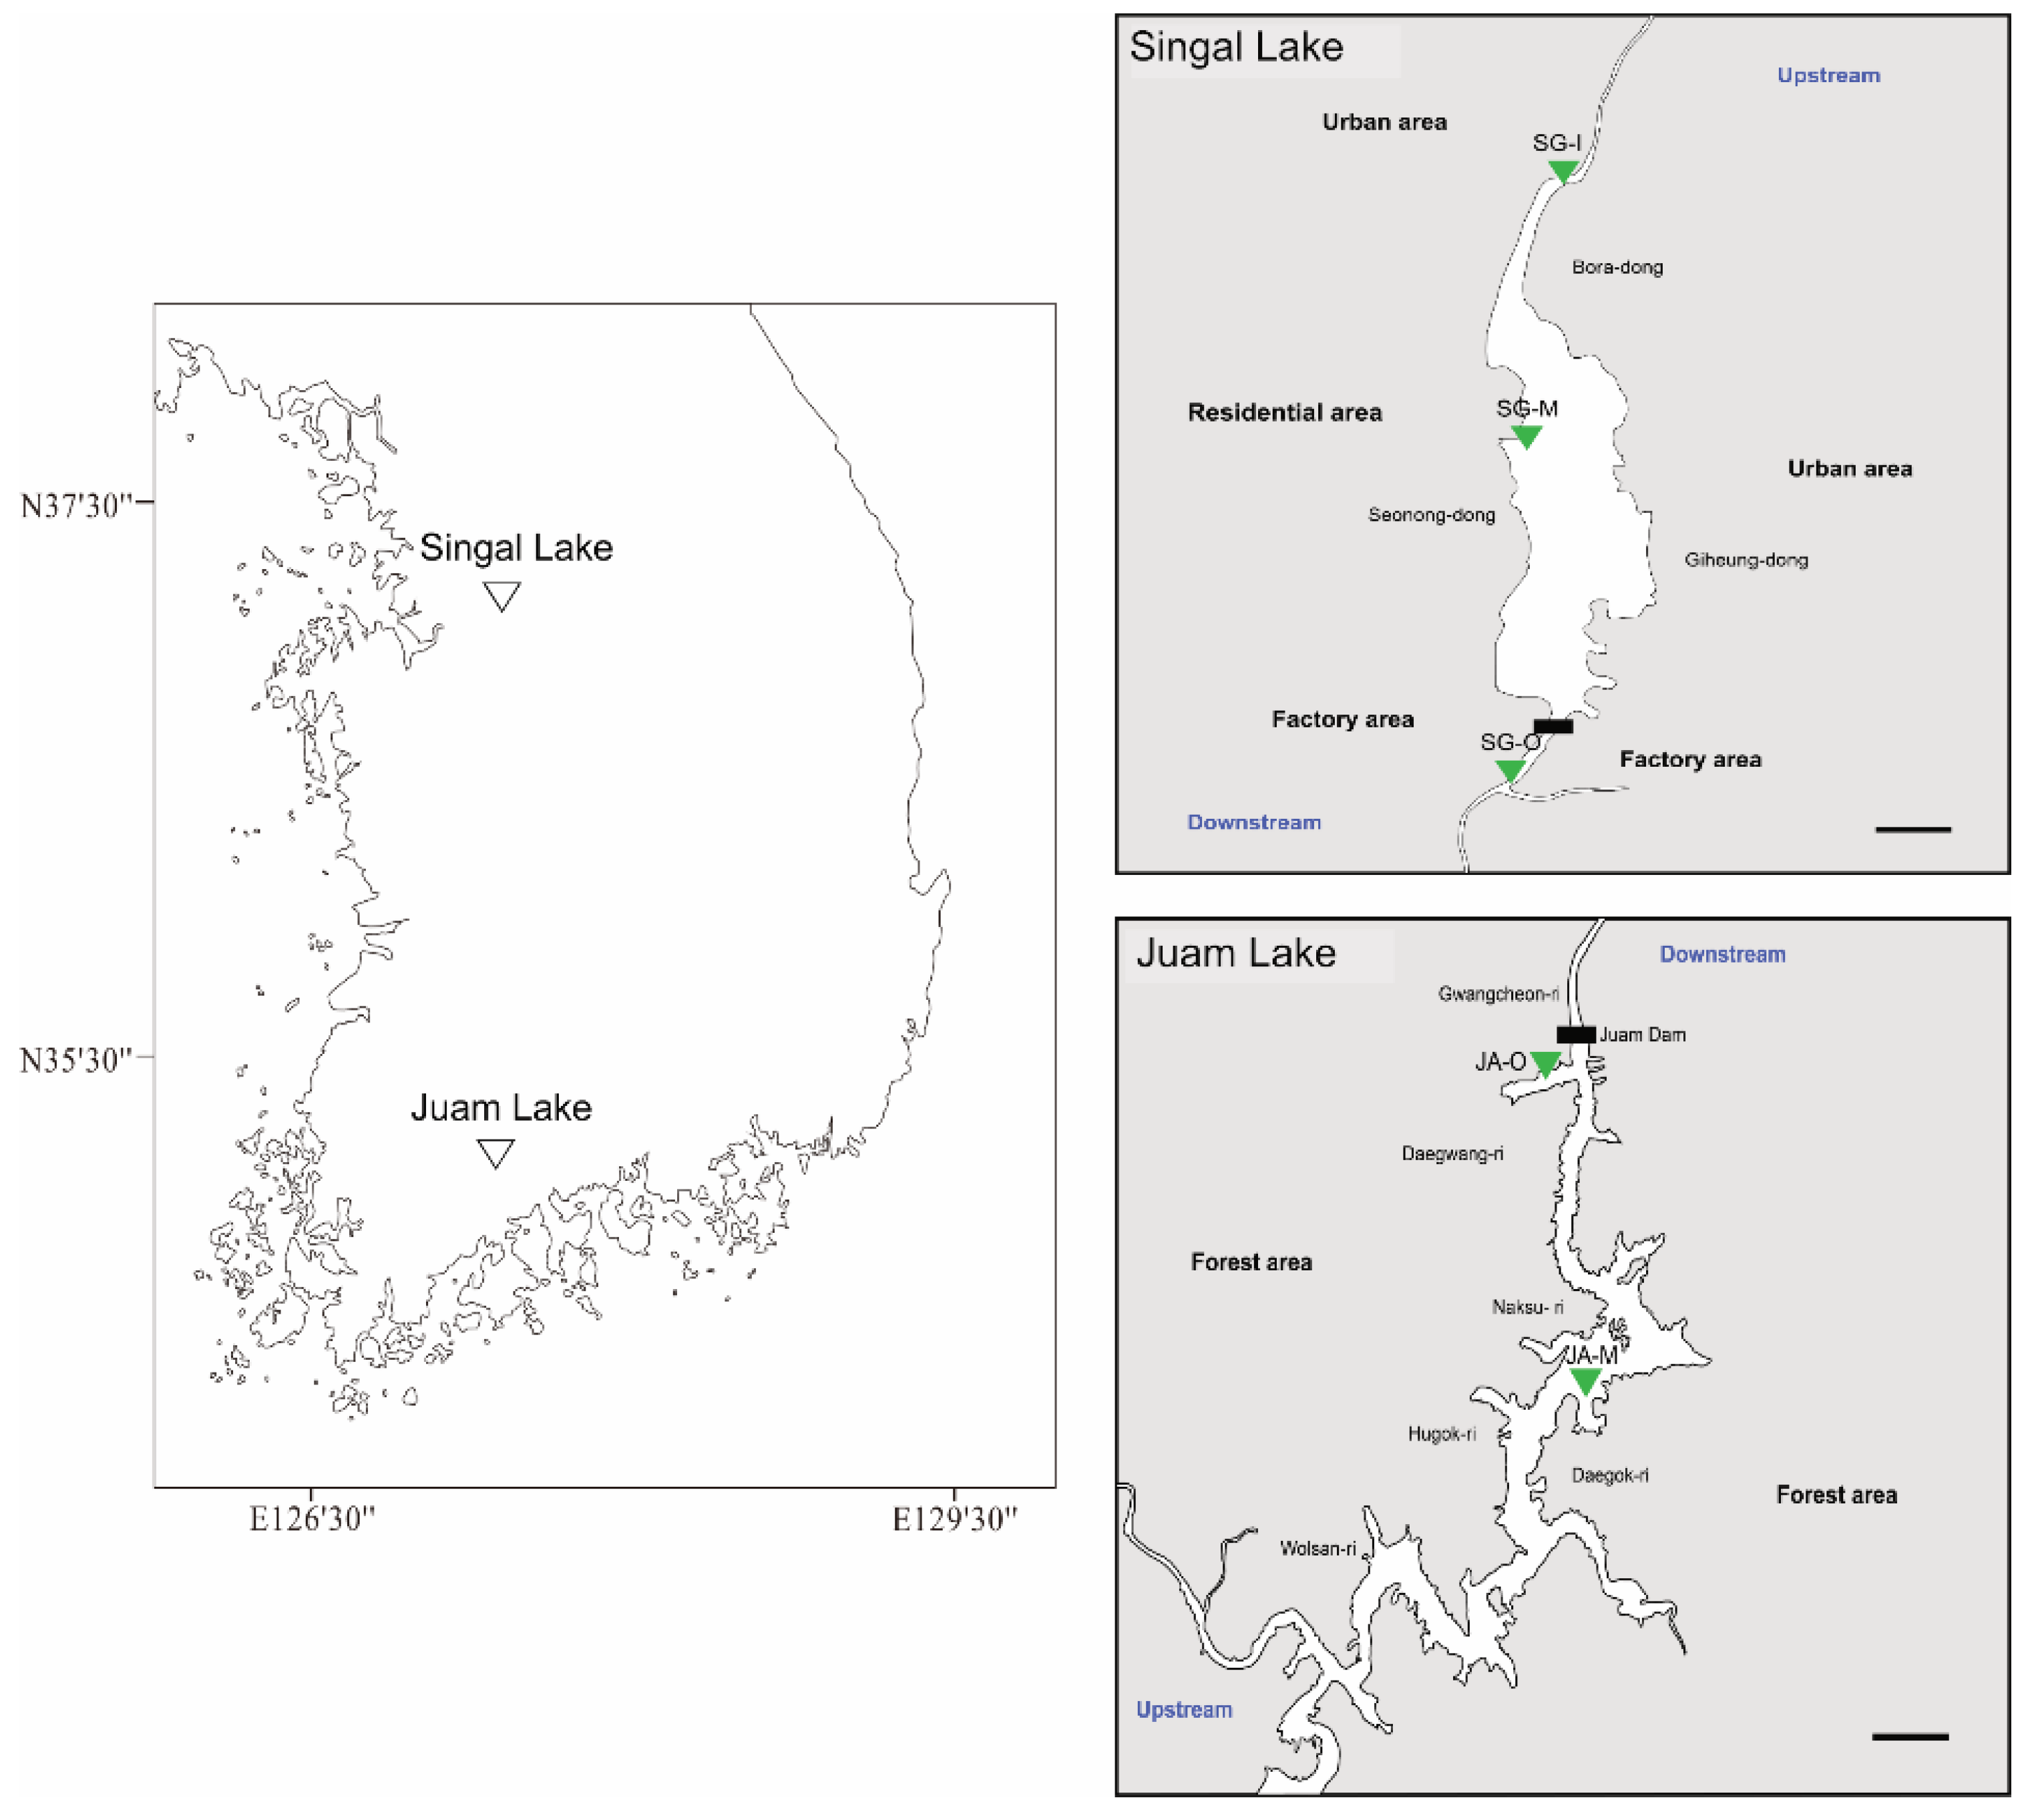
2.1. Sampling Preparation

Fish were collected at 2–3 sites within the two major lakes (Singal and Juam Lakes) of South Korea (Figure 1) using a kick net (4 mm × 4 mm, 30 min), cast net (6 mm × 6 mm, 10 times per site), gill net (100 m total length, 1.5 m height, 45 mm and 12 mm stretched mesh sizes), and fyke net (three pockets, 3 mm mesh size, 20 × 2.4 m lead height). Fish were sampled in September 2020, and tissue samples were immediately extracted from fish (n = 3 at each site) in the field and stored in RNAlater (Invitrogen, Waltham, MA, USA). The fish had an average weight of 11.25 ± 4.41 g, total length of 10.59 ± 1.13 cm, and body length of 8.58 ± 0.84 cm. The samples were transported to the laboratory and stored at 4 °C for 12 h, before being stored at −80 °C.

2.2. Total RNA Extraction and cDNA Synthesis

Total RNA was extracted using RNA isoplus (Takara, Shiga, Japan) according to the manufacturer’s protocol. Recombinant DNase I (Takara, Shiga, Japan) treatment was used to remove genomic DNA contamination in the extracted RNA. RNA concentration and quality (260:280 ratios >1.8) were verified using a microplate reader with a nanodrop plate (Thermo Scientific, Waltham, MA, USA). RNA integrity was confirmed by 1.2% agarose gel electrophoresis. Then, total RNA (2 µg) was used as a template to synthesize cDNA using a PrimerScriptTM First-Strand cDNA Synthesis Kit (Takara, Shiga, Japan) according to the manufacturer’s protocol. cDNA was stored at −20 °C, in 15-fold diluted conditions.

2.3. Gene Expression Analysis Using Quantitative Real-Time PCR (RT-qPCR)

To amplify the expression of stress-related genes in fish tissue, RT-qPCR was performed on a CFX Connect Real-Time PCR system (Bio-Rad, Hercules, CA, USA). Before the experiment, gene-specific primers were designed on the basis of the full or partial coding sequences of candidate genes using Primer3 software (Version 0.4.0). An efficiency test was conducted to validate the designed primers (E: 88–96%). Table 1 contains the information for all primers used in this study. Each reaction was conducted in a final volume of 20 µL containing 10 µL of Accuprep 2× Greenstar qPCR Master Mix (Bioneer, Daejeon, Korea), 6 µL of DEPC-treated water, 0.5 µL of each forward and reverse primer (10 pM), and 3 µL of 15-fold-dilution cDNA as a template. RT-qPCR was carried out for 40 cycles at 95 °C for 15 s, a primer-specific temperature (Table 1) for 30 s, and 60 °C for 45 s. Melting curves were determined by increasing the temperature from 65 °C to 95 °C. All samples were amplified in triplicate to ensure reproducibility. The relative expression level of each gene was determined using glyceraldehyde-3-phosphate dehydrogenase (GAPDH) as an internal reference gene and calculated using the 2−ΔΔCt method [21].

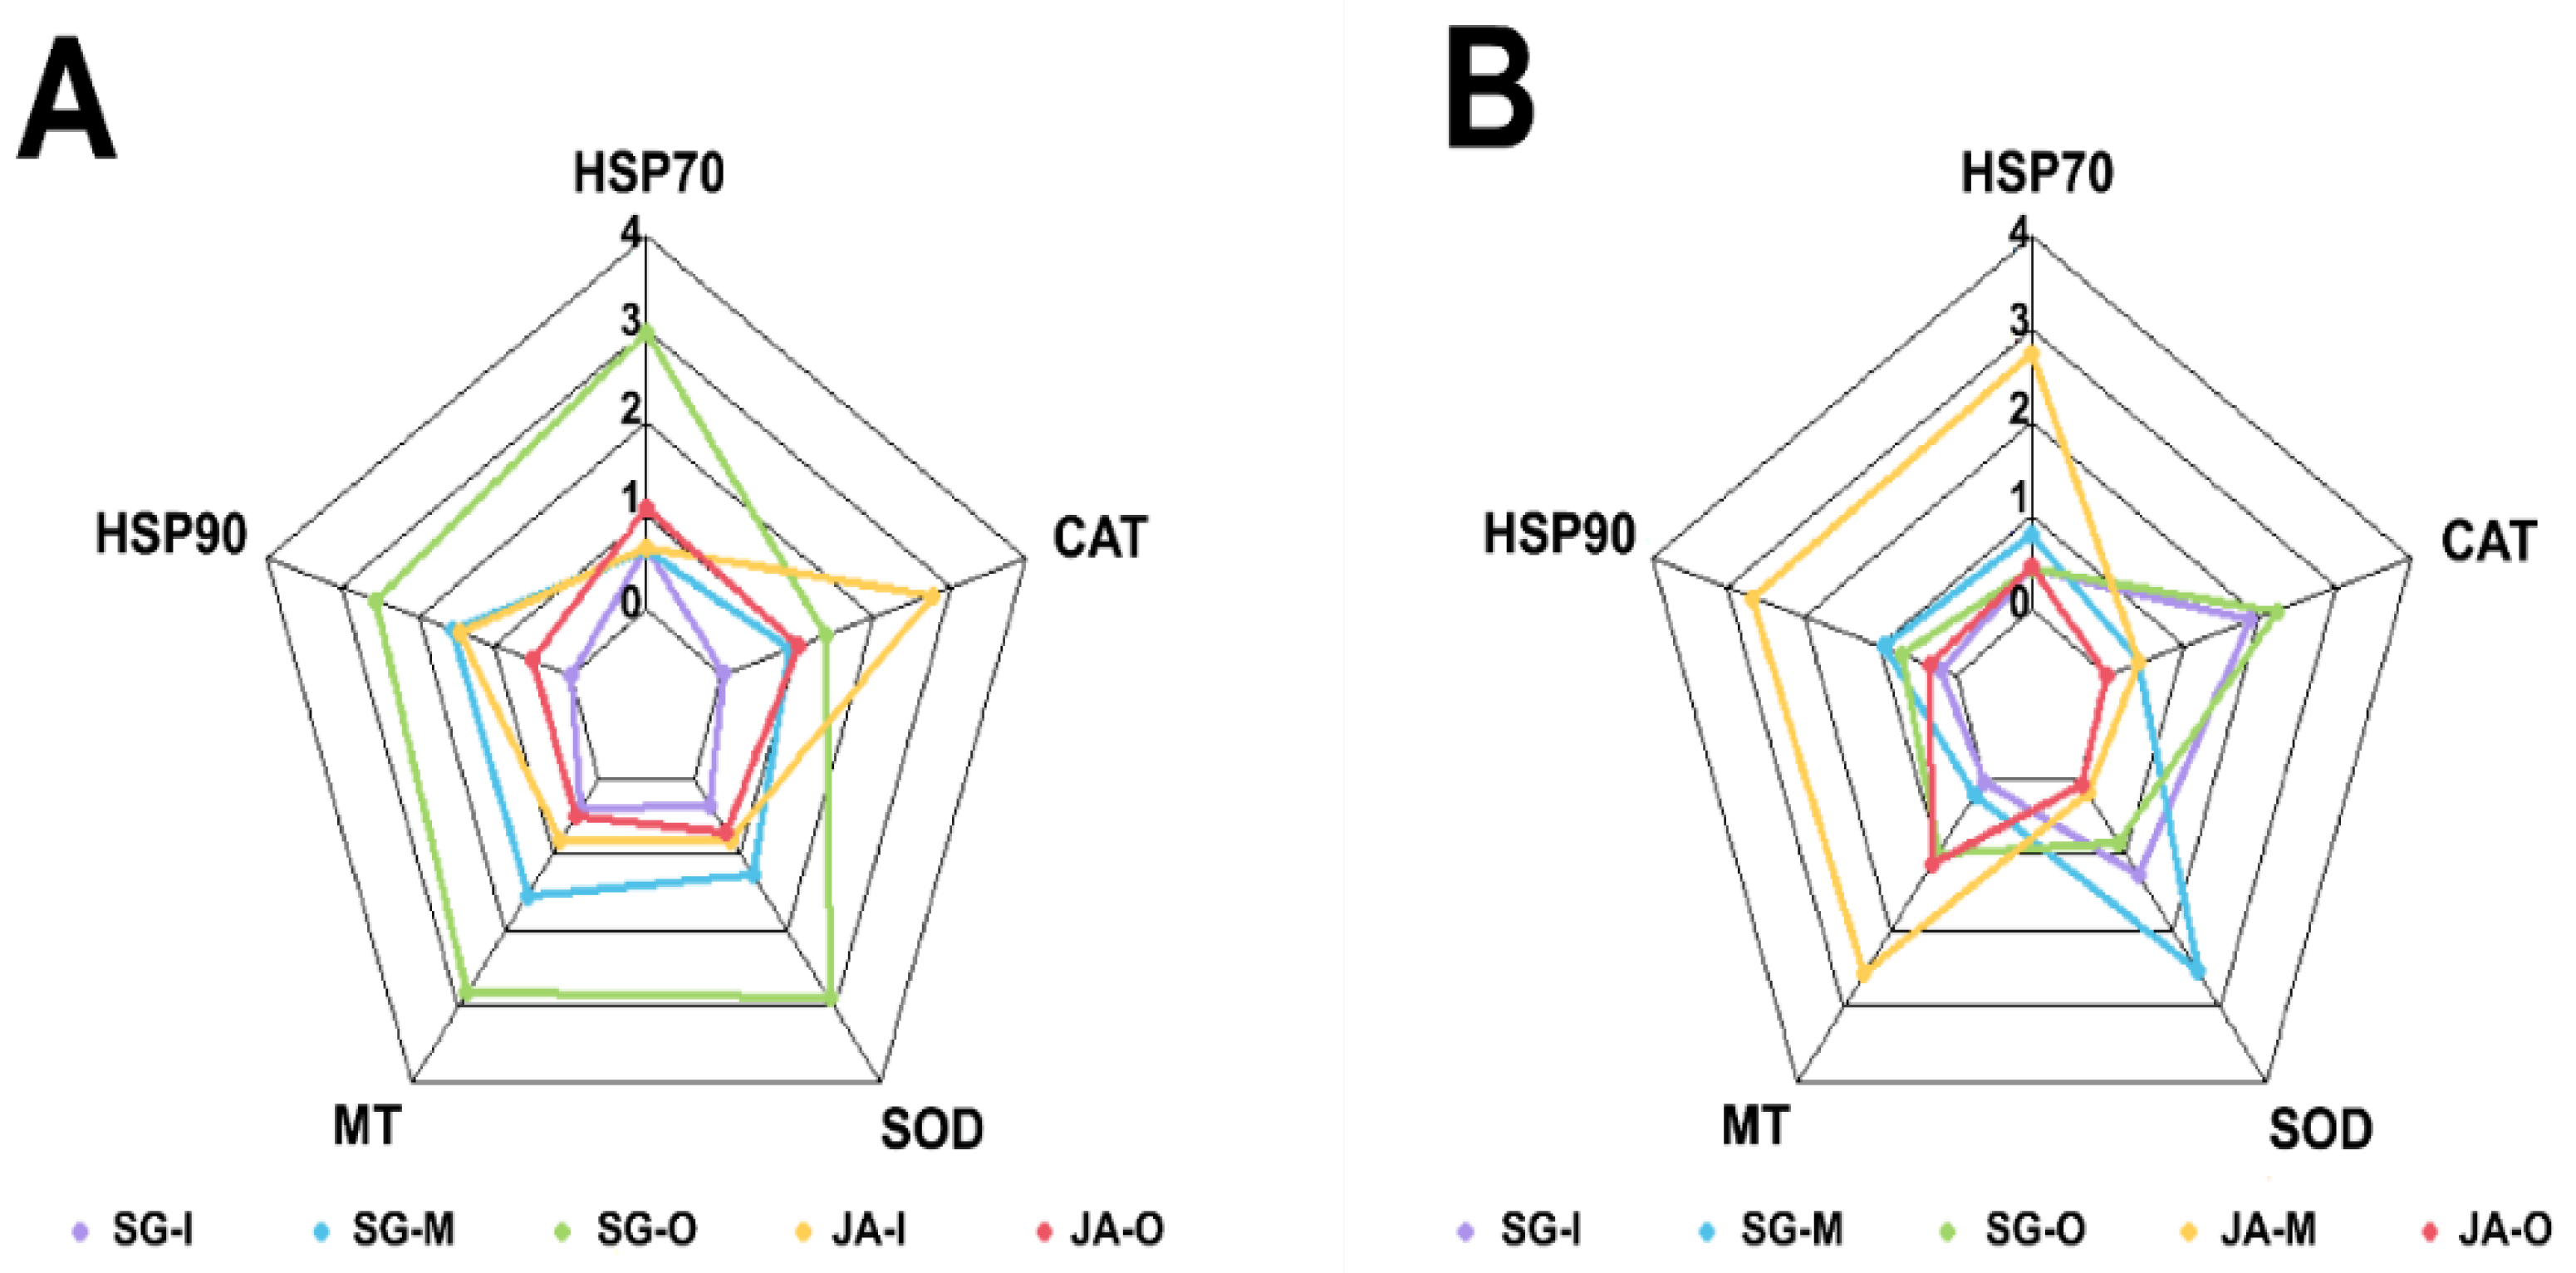
2.4. Integration of Biomarker Responses (IBR)

The IBR index was calculated according to Beliaeff and Burgeot [22]. Briefly, biomarkers (HSP70, HSP90, SOD, CAT, and MT expression) were standardized to compare the relative values at each site as follows:
Y = ( X m ) s ,
where Y is the standardized biomarker response, X is the general mean value of each biomarker, and s is the standard deviation of X. The score (S) was computed as S = Y + |min|, where S ≥ 0, and |min| is the absolute value of each biomarker value. The score was averaged at different levels of biomarker responses to create a star plot by connecting endpoints of each vector using R (version 4.0.5). The IBR value can be calculated follows:
A i = S i 2 β ( S i cos β + S i + 1 sin β ) ,
where
β = Arctan ( S i + 1 sin α S i S i + 1 cos α ) ,
where α = 2π/n radians, Sn + 1 = S1, and n = 3.

2.5. Statistical Analysis

R statistical software (version 4.0.5) was used for statistical analyses in this study. Data are presented as the mean ± standard deviation. A one-way analysis of variance was conducted to test for significant differences in biomarker responses among different survey areas. In addition, significant differences were determined using a Tukey test at the p < 0.05 (*) and p < 0.01 (**) significance levels.

3. Results

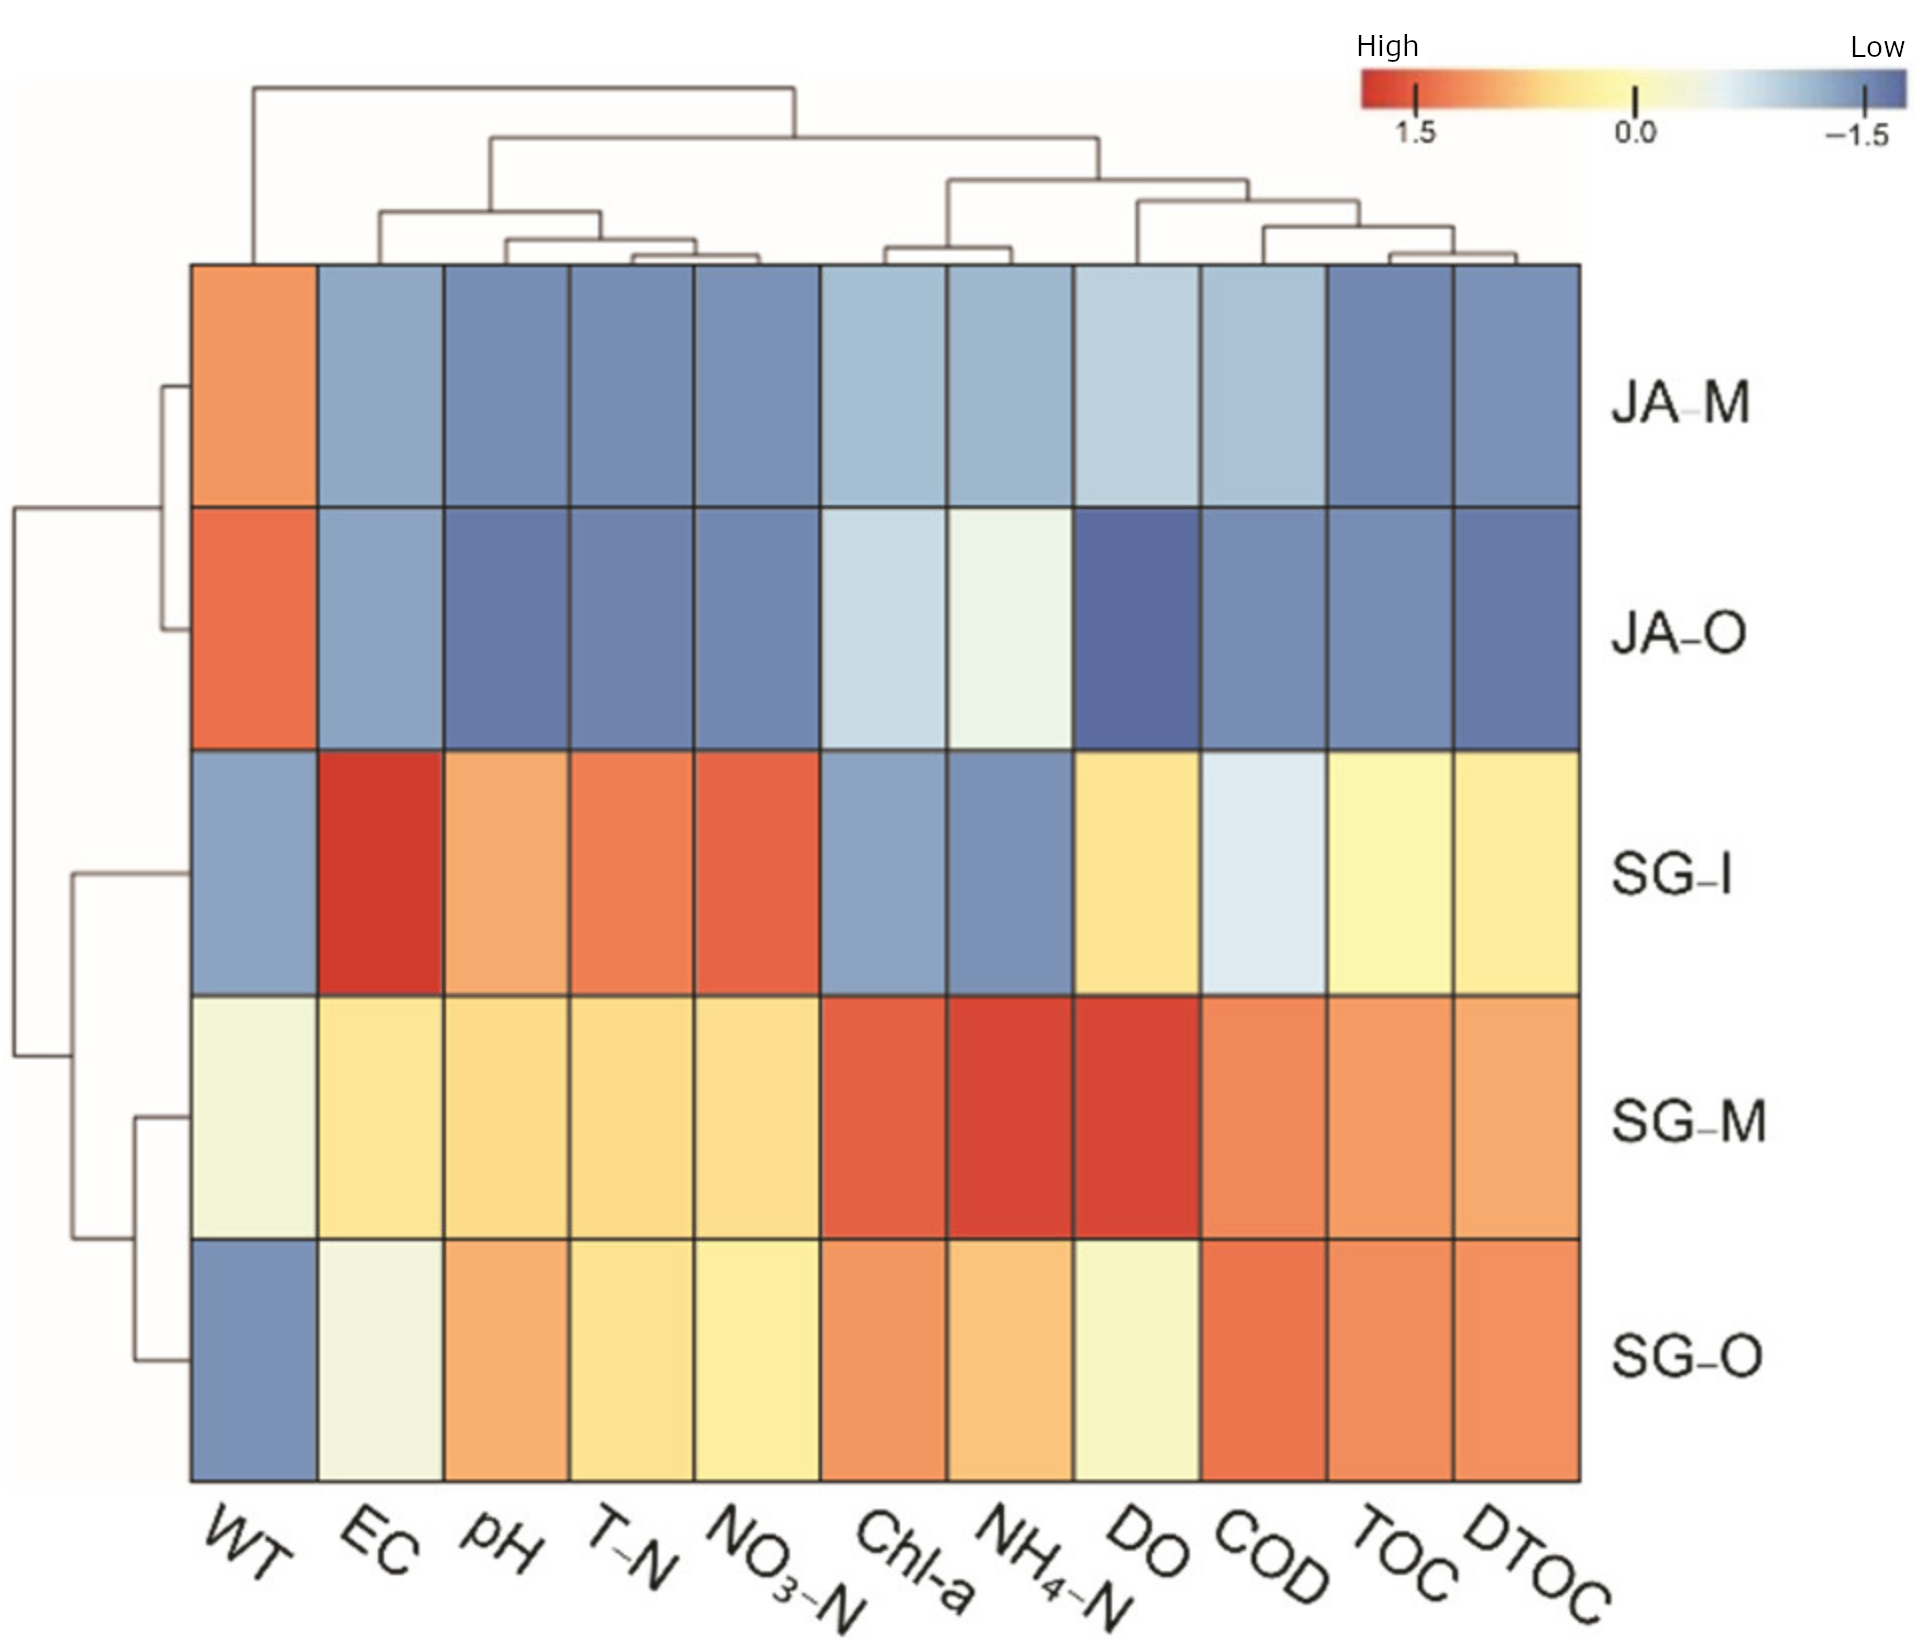
3.1. Water Quality and Hydrological Environments of Lakes

Hydrological and geographical features differ between Singal and Juam Lakes of South Korea. Singal Lake is located in an urban area, close to a factory, whereas Juam Lake is situated in a forest (Figure 1). Juam Lake is much larger and deeper than Singal Lake (Table 2). The physicochemical properties of lake water were analyzed at inflow, middle, and outflow sites of Singal Lake, and at middle and outflow sites of Juam Lake. Water temperatures were higher in Juam Lake than Singal Lake. Dissolved oxygen (DO) and pH were lower in Juam Lake than in Singal Lake, possibly due to differences in water temperature and depth. Sampling sites within Singal Lake had electric conductivity (EC) values ranging from 273 to 723 µS/cm (Table 2), while Juam Lake had an average EC of 74.4 µS/cm. Moreover, compared to Juam Lake, Singal Lake had higher values of most water quality factors, including levels of organic contaminants (chemical oxygen demand, COD), nutrient levels (total organic carbon, TOC and total nitrogen, TN), nitrogen levels (NO3-N, NH3-N), an indicator of phytoplankton biomass (chlorophyll a, Chl-a), and dissolved TOC (DTOC).

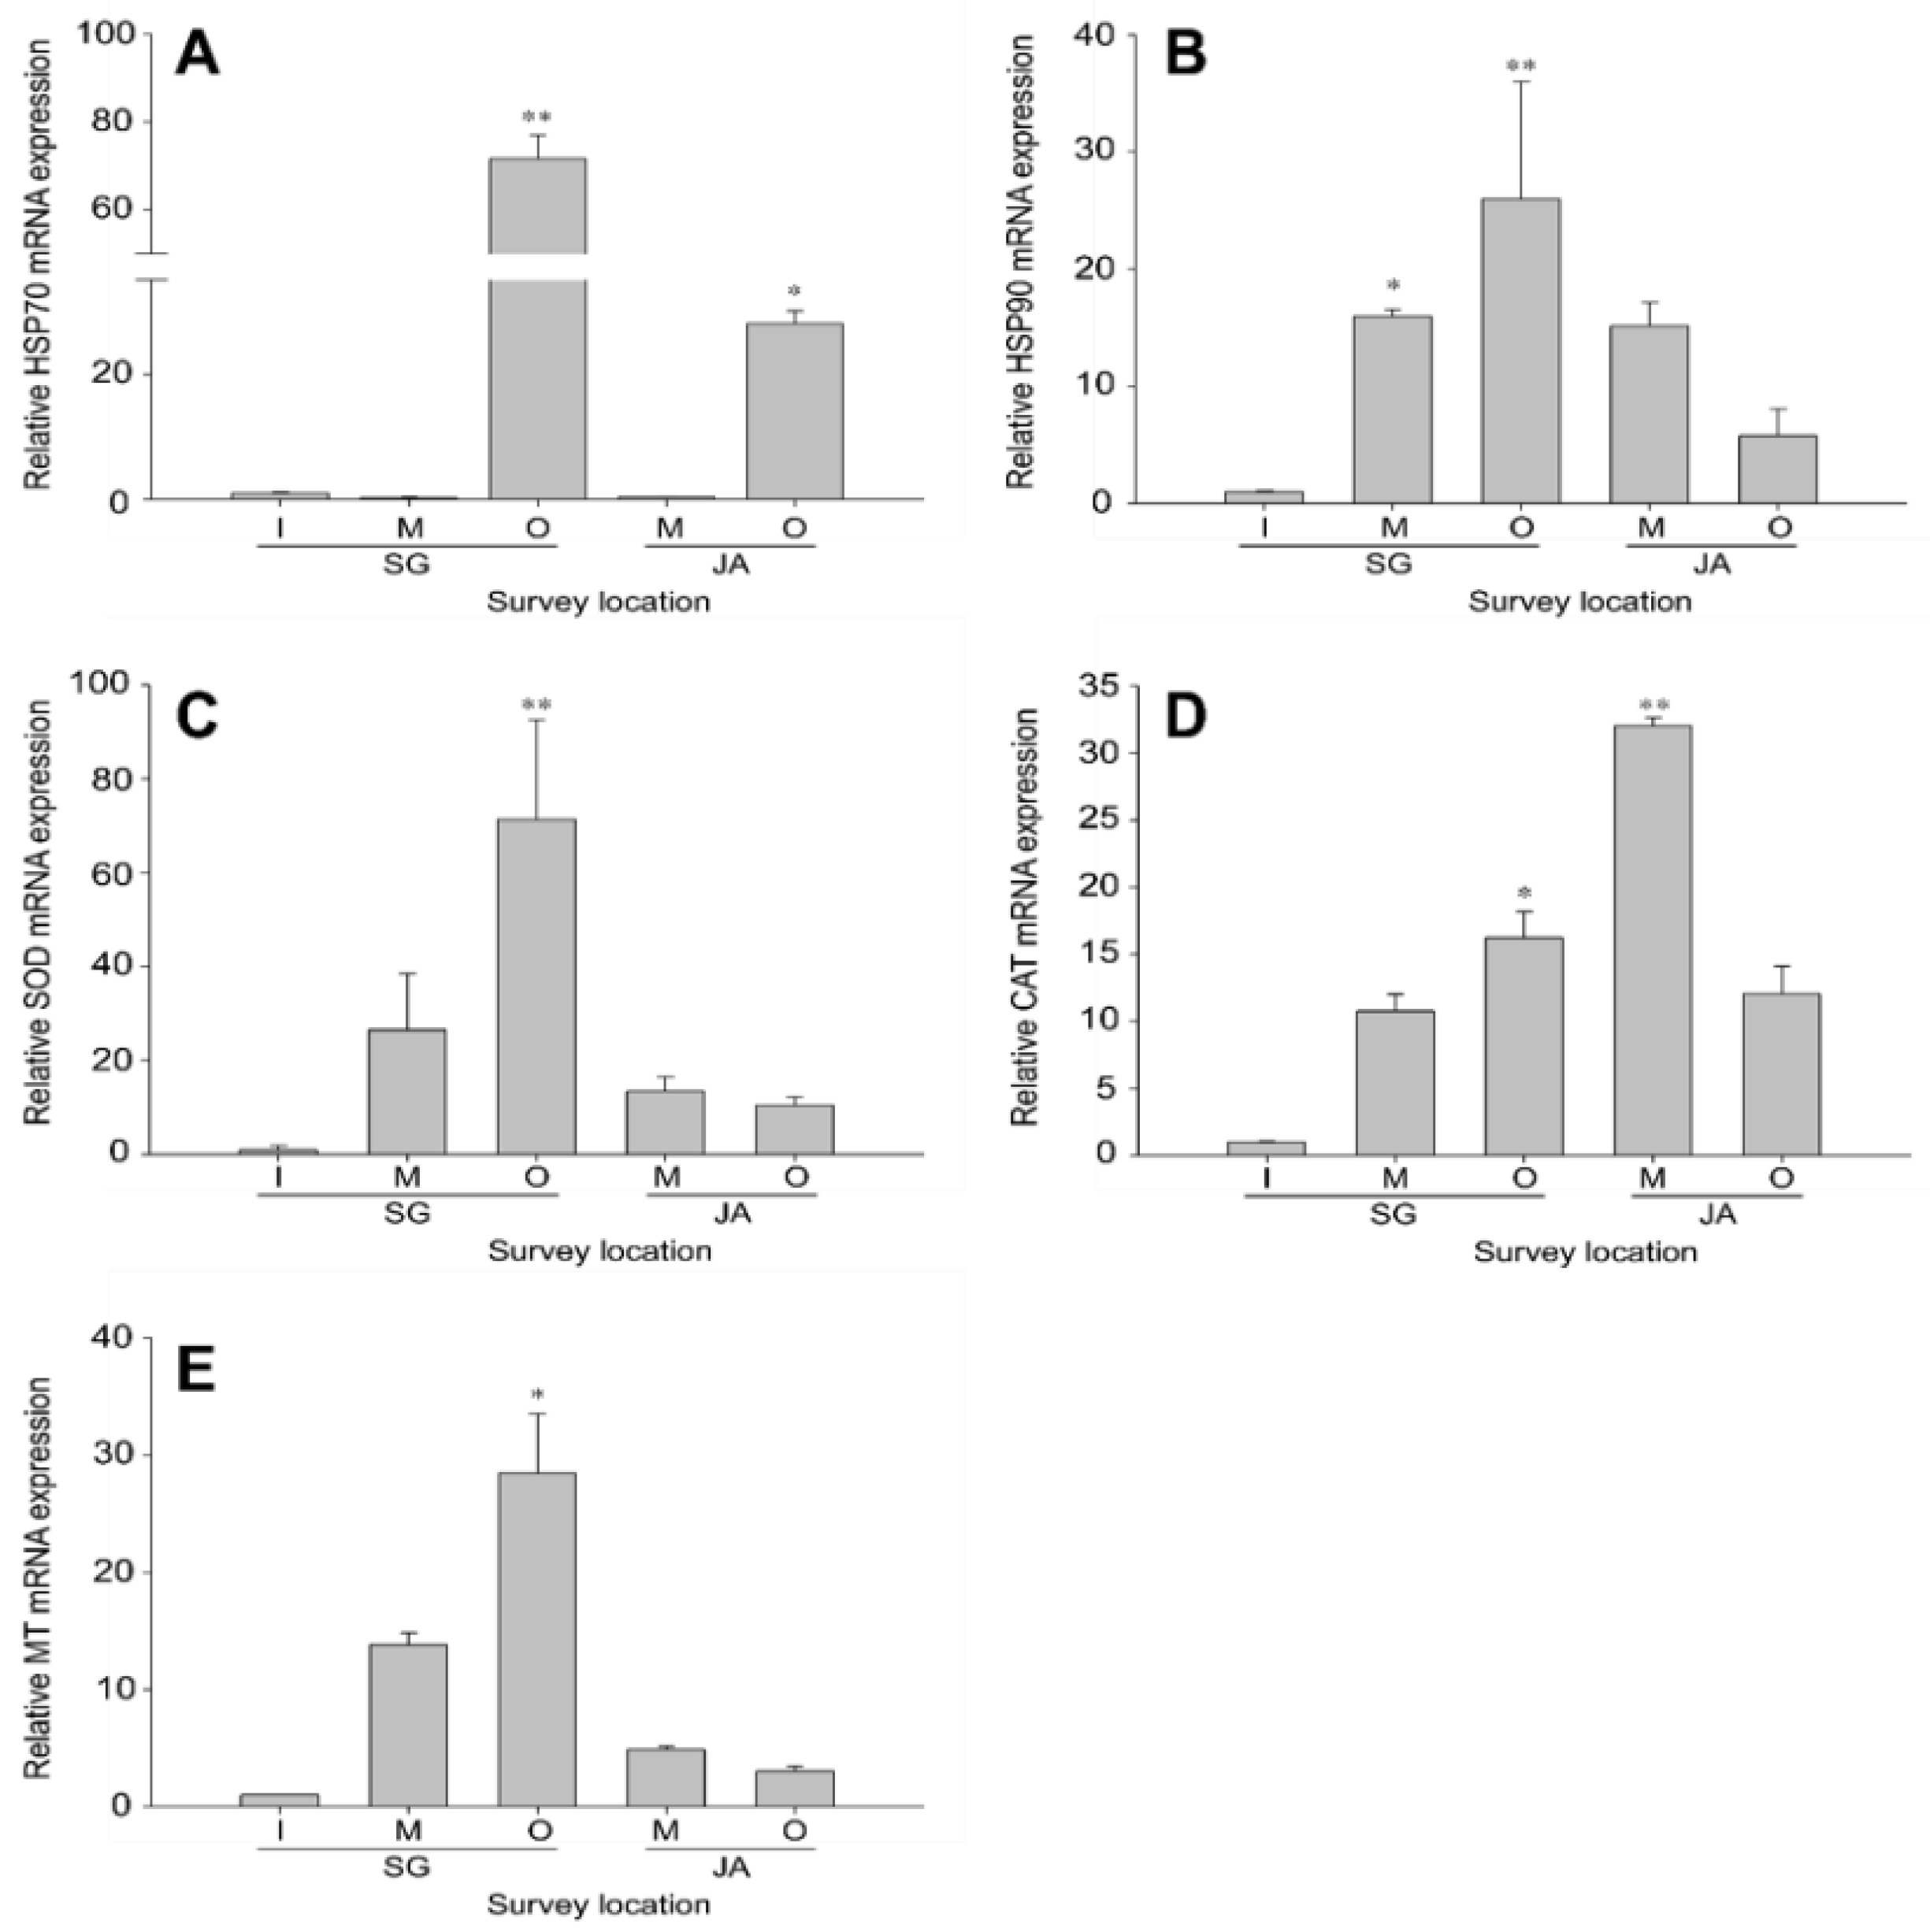
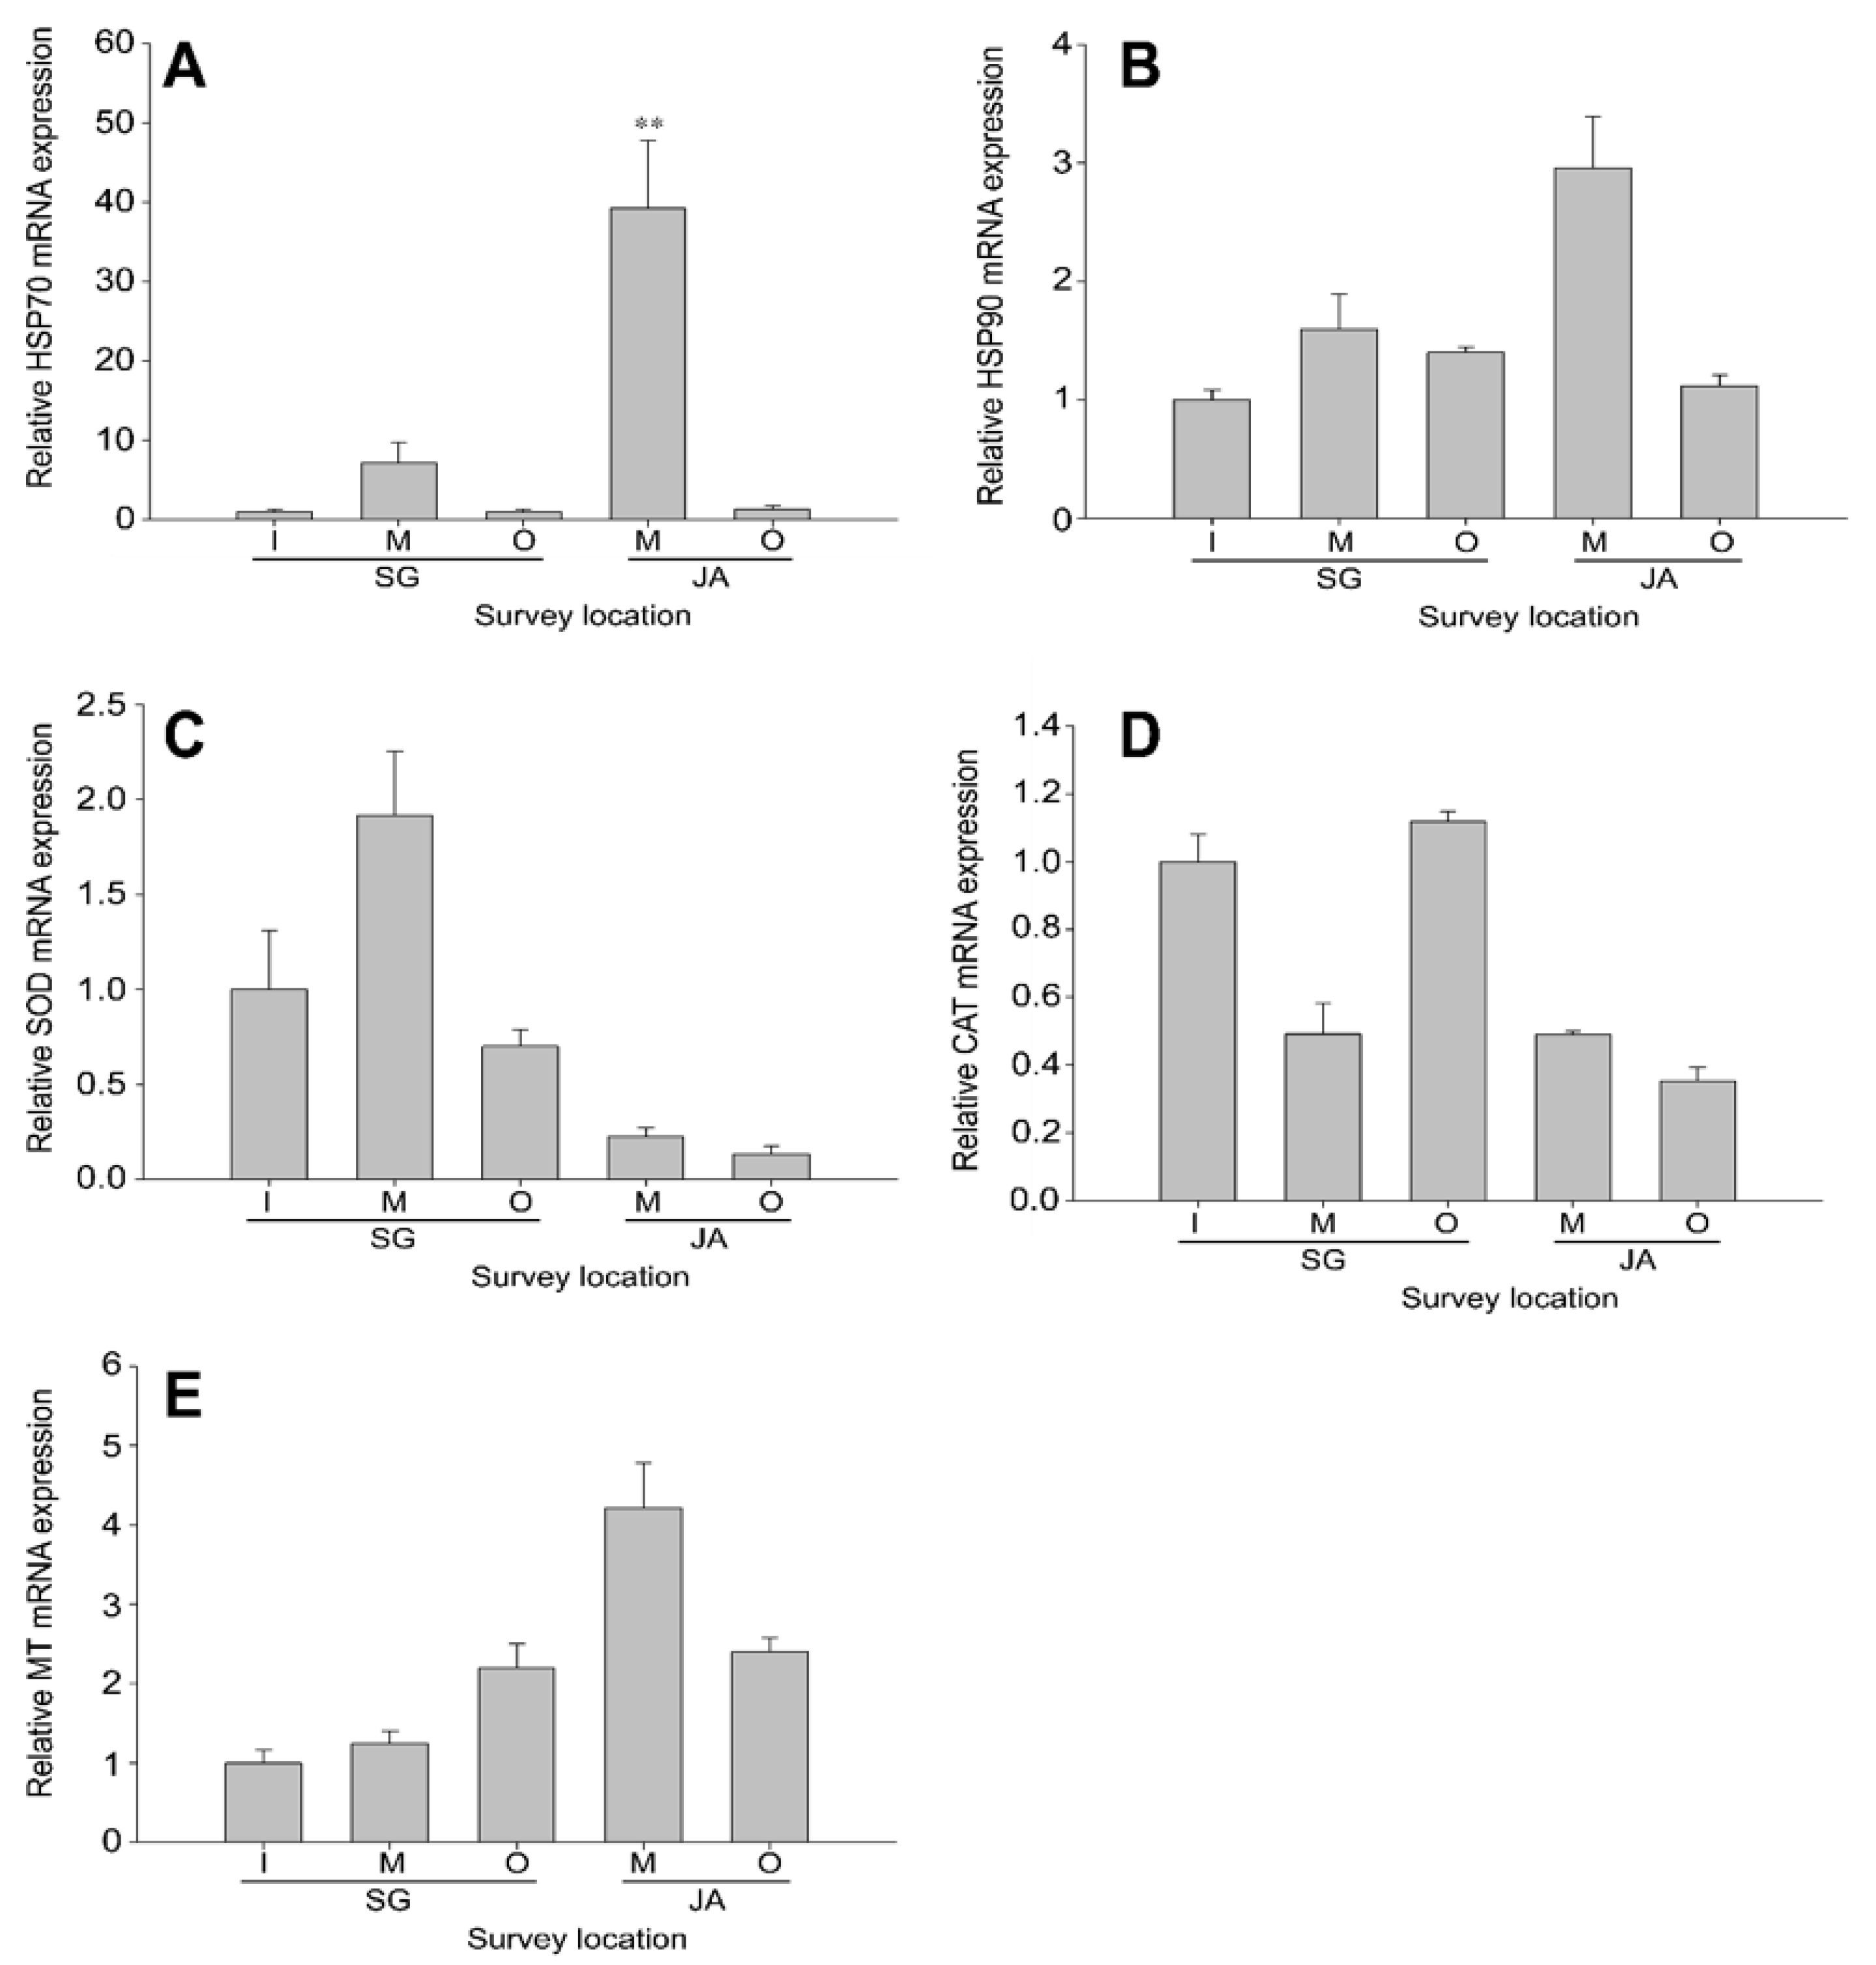
3.2. Transcriptional Responses of Stress-Related Genes in Z. platypus

3.2.1. Cellular Homeostasis in Zacco platypus from Different Lakes

The gene expression of heat-shock proteins (HSP70 and HSP90) in gills (Figure 2) and livers (Figure 3) of Z. platypus was analyzed to evaluate the cellular homeostasis responses in fish collected from Singal and Juam Lakes. In Z. platypus gills, HSP70 expression was only significantly higher in the outflow of Singal Lake (71.6-fold) and in the outflow of Juam Lake (14.2-fold) (Figure 2A). HSP90 expression tended to increase from the inflow (16.0-fold) to outflow (26.0-fold) site in Singal Lake, but the opposite pattern was observed in Juam Lake (Figure 2B). In livers, HSP70 mRNA expression was highest in Z. platypus collected from the middle of Juam Lake and did not reach significance at other survey points (Figure 3A). In addition, HSP90 expression was similar to that of HSP70, although HSP90 levels were lower than HSP70 levels in liver tissue. There were no significant levels of HSP90 expression in Singal and Juam Lakes (Figure 3B). The expression of HSPs was generally higher in the gill tissue than liver tissue of Z. platypus from both lakes (Figure 2 and Figure 3).

3.2.2. Antioxidant Defense in Zacco platypus from Different Lakes

The transcription of antioxidant enzymes (SOD and CAT) in gills (Figure 2) and livers (Figure 3) of Z. platypus was analyzed to identify how responses to oxidative stress differed among fish collected from Singal and Juam Lakes. In the gills of Z. platypus collected from Singal Lake outflow, SOD expression increased significantly, mirroring HSP90 expression patterns (Figure 2C). In addition, the level of CAT mRNA increased in the outflow (16.2-fold) of Singal Lake (Figure 2D). However, the highest level (32.0-fold) of CAT expression was observed in the middle of Juam Lake. In liver tissue, SOD was upregulated in the middle of Singal Lake (1.9-fold), but downregulated in Juam Lake compared to Singal Lake (Figure 3C). Furthermore, the lowest level of CAT transcripts was found in Z. platypus from the middle of Singal Lake and Juam Lake (Figure 3D). However, the expression levels of SOD or CAT were not significant in the liver of Z. platypus from each lake. The mRNA levels of antioxidant genes were generally higher in gill tissue than in the liver tissue of Z. platypus from both lakes (Figure 2 and Figure 3).

3.2.3. Metal Detoxification in Zacco platypus from Different Lakes

MT expression was analyzed in the gills (Figure 2) and livers (Figure 3) of Z. platypus collected from Singal and Juam Lakes to investigate changes in metal detoxification in these environments. In the gills of Z. platypus, MT expression resembled that of SOD in Singal Lake (Figure 2E), with the expression of MT being significantly highest in Singal Lake outflow. In general, low MT expression was observed in Juam Lake (middle: 13.8-fold; outflow: 28.5-fold), with MT expression being non-significantly elevated in Z. platypus collected from the middle of Juam Lake (4.2-fold) (Figure 3E). The transcriptional levels of the metal detoxification gene considered here were generally higher in gill tissue than in the liver tissue of Z. platypus from both lakes (Figure 2 and Figure 3).

3.3. Integration of Biomarker Responses (IBR) and Heatmap Analysis

The IBR index values in each tissue were calculated to evaluate the relative environmental health of Singal and Juam Lakes using sampling sites from both lakes and biomarker gene levels from Z. platypus (Figure 4). A heatmap analysis was used to determine correlations between sampling sites and physicochemical factors in order to assess water quality (Figure 5). In Z. platypus gills, the IBR values of HSP70, HSP90, MT, and SOD were significantly highest in Singal Lake outflow, although a high CAT IBR was observed in Juam Lake inflow (Figure 4A). However, in Z. platypus livers, the IBR index values of HSP70, HSP90, and MT were high in the middle of Juam Lake (Figure 4B). The IBR index of antioxidant genes such as SOD or CAT was higher in liver tissue than in gills of Z. platypus from Singal Lake. The biological response values for HSPs and MT were high in Z. platypus gill tissue from Singal Lake outflow (IBR value = 12.62). In addition, the positive correlation between Singal Lake sampling sites and physicochemical properties indicating impaired water quality in the heatmap suggests that water quality was poorer in Singal Lake (Figure 5).

4. Discussion

Zacco platypus has been used as a model for evaluating the biological and molecular consequences of the surrounding water environment, as well as exposure to heavy metals and toxicants [5,7,8,9]. In addition, genes have been used as biomarkers that reflect aquatic environmental conditions shaped by wastewater effluents or environmental pollutants [5,7]. In addition, the molecular biomarker approach using Z. platypus, which is distributed over a wide range of rivers, is a useful tool that can represent the health of the fish habitat environment using native fish. This study is the first to analyze multilevel genetic biomarkers in Z. platypus gill and liver tissues from standing (lentic) water of different lake environments.
Fish gills are in direct contact with the surrounding environment and have several vital functions involving ionic and osmotic regulation, aquatic gas exchange, excretion of nitrogenous wastes, and acid–base regulation [23,24]. In addition, gills play pivotal roles in stress responses to environmental hypoxia [25]. In the present study, basal expression levels of biomarker genes were higher in Z. platypus gills than in livers of fish collected from Singal and Juam Lakes. These results indicate that fish gills are an optimal organ for the assessment of aquatic environments such as lakes, as well as rivers and streams. In Z. platypus gills, HSP70 and HSP90 were significantly upregulated in Singal Lake sampling sites, especially the outflow. HSPs play an important role in biological metabolism and cell activity, and many studies have utilized these genes as molecular markers for external stress [26]. In addition, through activities such as chaperone folding and translocation, HSPs are reported to play a role in maintaining protein homeostasis in the face of oxidative stress caused by heavy metals [27]. In this study, molecular responses against potential environmental stressors appeared higher in the gills of Z. platypus inhabiting Singal Lake than in those inhabiting Juam Lake. A manufacturing plant and food plant sit close to the outflow of Singal Lake (Figure 1). Moreover, the responses of HSPs were not dependent on water temperature (Juam Lake > Singal Lake) in both lakes, although HSPs act as molecular chaperones to prevent protein denaturation in response to heat-shock stress [15].
MT was also significantly upregulated in the gills of Z. platypus from Singal Lake in this study. MT primarily contributes to cytoprotection, which prevents oxidation stress caused by the toxicity of heavy metals, such as cadmium, zinc, and copper [28]. In addition, MT plays critical roles in the regulation of metal homeostasis in the intracellular detoxification of heavy metals [7]. In past studies, MT mRNA was significantly increased in Z. platypus located downstream of wastewater treatment plant effluents [7,29]. However, antioxidant enzyme responses to the production of oxidative stress differed by Z. platypus tissue type in this study. Upregulated expression of SOD was observed in the gills and liver of Z. platypus from Singal Lake, whereas upregulation of CAT differed in Singal and Juam Lakes depending on whether the gill or liver tissue was examined. When an intracellular oxidation reaction occurs in response to an externally derived xenobiotic, antioxidant genes create balance within the oxidation mechanism. Superoxide radicals (O2) produced due to external stress are transformed by SOD and converted into hydrogen peroxide (H2O2) and molecular oxygen (O2) [30]. H2O2 can accumulate in biological cells and tissues and cause cell death. To mitigate the toxic effects of H2O2 and protect the organism from oxidative damage, CAT decomposes H2O2 into H2O and O2. SOD and CAT are considered to be the first line of defense against ROS damage [31]. Differing expression patterns of SOD and CAT were also reported in Z. platypus exposed to wastewater effluents [7]. Thus, antioxidant biomarker genes can reflect the oxidative stress conditions experienced by Z. platypus from Singal Lake, which has poor water quality.
The IBR index was first proposed for the purpose of star plot visualizations as an indicator of environmental stress [22]. The IBR index has been used to assess the stress of organisms in aquatic environments [5,7]. In this study, IBR index values were analyzed on the basis of the star plot areas to identify the adverse effects of different lake environments. In the gills of Z. platypus, the total IBR value was the highest in Singal Lake outflow (12.62), clearly suggesting that Z. platypus gills can reflect stressful environments. The poor water quality properties observed at this site may have been caused by an adjacent factory. IBR values also indicated stressful water conditions downstream, potentially affected by wastewater effluents [7]. The high IBR index values obtained in this study indicated that impaired water quality or exposure stressors (toxicants or high temperature) were correlated with an overall higher degree of stress [32,33,34].

5. Conclusions

In this study, we identified correlations between the water conditions of two lake ecosystems (Singal and Juam) and the expression of stress-related genes as biomarkers in the gills and liver of Z. platypus. Cellular homeostasis (HSP70 and HSP90) and metal detoxification (MT) genes were significantly upregulated in the gills of Z. platypus collected from the outflow area of Singal Lake, which possessed poorer water quality conditions than Juam Lake. In Z. platypus, the gills proved to be a more useful organ to assess stressful water environments of lentic ecosystems than the liver. However, the expression patterns of antioxidant genes (SOD and CAT) were more sensitive in liver tissues than in the gills of Z. platypus from Singal Lake, although the relative levels of SOD and CAT were lower in the liver than in the gills of Z. platypus. The IBR value also indicated a high degree of stress, presented as a high IBR index, in Z. platypus gills at the Singal Lake outflow. These results indicate that transcriptional responses of biomarker genes in lake-inhabiting fish can indicate stressful water environments in ecosystems.

Author Contributions

Conceptualization, I.-S.K. and W.-S.K.; methodology, W.-S.K., J.-W.P. (Jae-Won Park), S.-H.L. and K.P.; software, W.-S.K., J.-H.K. and K.P.; validation, K.P. and I.-S.K.; formal analysis, W.-S.K., T.-S.Y. and K.P.; investigation, W.-S.K., Y.-J.K., G.-H.O., B.-S.K., J.-W.P. (Ji-Won Park), C.H. and K.P.; resources, K.P. and I.-S.K.; data curation, K.P. and I.-S.K.; writing—original draft preparation, W.-S.K. and K.P.; writing—review and editing, K.P. and I.-S.K.; visualization, W.-S.K.; supervision, I.-S.K.; project administration, I.-S.K.; funding acquisition, I.-S.K. All authors have read and agreed to the published version of the manuscript.

Funding

This research was funded by the National Research Foundation of Korea (grant number NRF-2018-R1A6A1A-03024314) and the Korea Environment Industry and Technology Institute (KEITI) through the Aquatic Ecosystem Conservation Research Program funded by the Korea Ministry of Environment (MOE) (2021003050001, 2020003050003).

Institutional Review Board Statement

The study was conducted according to the guidelines of the Chonnam National University Institutional Animal Care and Use Committee.

Informed Consent Statement

Not applicable.

Data Availability Statement

The data presented in this study are available on request from the corresponding author. The data are not publicly available due to reasons of privacy.

Conflicts of Interest

The authors declare no conflict of interest.

References

  1. Cox, K.; Brennan, L.P.; Gerwing, T.G.; Dudas, S.E.; Juanes, F. Sound the alarm: A meta-analysis on the effect of aquatic noise on fish behavior and physiology. Glob. Change Biol. 2018, 24, 3105–3116. [Google Scholar] [CrossRef] [PubMed]
  2. Adeola, A.O.; Abiodun, B.A.; Adenuga, D.O.; Nomngongo, P.N. Adsorptive and photocatalytic remediation of hazardous organic chemical pollutants in aqueous medium: A review. J. Contam. Hydrol. 2022, 248, 104019. [Google Scholar] [CrossRef] [PubMed]
  3. Van der Oost, R.; Beyer, J.; Vermeulen, N.P.E. Fish bioaccumulation and biomarkers in environmental risk assessment: A review. Environ. Toxicol. Pharmacol. 2003, 13, 57–149. [Google Scholar] [CrossRef]
  4. Lee, J.W.; Yoon, H.G.; Lee, S.K. Benzo(a)pyrene-induced cytochrome p4501A expression of four freshwater fishes (Oryzias latipes, Danio rerio, Cyprinus carpio, and Zacco platypus). Environ. Toxicol. Pharmacol. 2015, 39, 1041–1050. [Google Scholar] [CrossRef] [PubMed]
  5. Park, C.B.; Kim, G.E.; Kim, D.W.; Kim, S.; Yeom, D.H. Biomonitoring the effects of urban-stream waters on the health status of pale chub (Zacco platypus): A comparative analysis of biological indexes and biomarker levels. Ecotoxicol. Environ. Saf. 2021, 208, 111452. [Google Scholar] [CrossRef]
  6. Cazenave, J.; Bacchetta, C.; Rossi, A.; Ale, A.; Campana, M.; Parma, M.J. Deleterious effects of wastewater on the health status of fish: A field caging study. Ecol. Indic. 2014, 38, 104–112. [Google Scholar] [CrossRef]
  7. Kim, W.K.; Jung, J. In situ impact assessment of wastewater effluents by integrating multi-level biomarker responses in the pale chub (Zacco platypus). Ecotoxicol. Environ. Saf. 2016, 128, 246–251. [Google Scholar] [CrossRef]
  8. Samanta, P.; Im, H.; Yoo, J.; Lee, H.; Kim, N.Y.; Kim, W.; Hwang, S.J.; Kim, W.K.; Jung, J. Comparative assessment of the adverse outcome of wastewater effluents by integrating oxidative stress and histopathological alterations in endemic fish. J. Hazard. Mater. 2018, 344, 81–89. [Google Scholar] [CrossRef]
  9. Kim, W.K.; Lee, S.K.; Jung, J. Integrative assessment of biomarker responses in pale chub (Zacco platypus) exposed to copper and benzo[a]pyrene. Ecotoxicol. Environ. Saf. 2013, 92, 71–78. [Google Scholar] [CrossRef]
  10. Houde, M.; Giraudo, M.; Douville, M.; Bougas, B.; Couture, P.; DeSilva, A.O.; Spencer, C.; Lair, S.; Verreault, J.; Bernatchez, L.; et al. A multi-level biological approach to evaluate impacts of a major municipal effluent in wild St. Lawrence River yellow perch (Perca flavescens). Sci. Total Environ. 2014, 497–498, 307–318. [Google Scholar] [CrossRef]
  11. Park, K.; Kwak, I.S. Environmental co-exposure of high temperature and Cu induce hormonal disturbance of cortisol signaling and altered responses of cellular defense genes in zebrafish. Sci. Total Environ. 2022, 842, 156555. [Google Scholar] [CrossRef] [PubMed]
  12. Booth, L.H.; Bithell, S.L.; Wratten, S.D.; Heppelthwaite, V.J. Vineyard pesticides and their effects on invertebrate biomarkers and bioindicator species in New Zealand. Bull. Environ. Contam. Toxicol. 2003, 71, 1131–1138. [Google Scholar] [CrossRef] [PubMed]
  13. Celander, M.C. Cocktail effects on biomarker responses in fish. Aquat. Toxicol. 2011, 105, 72–77. [Google Scholar] [CrossRef] [PubMed]
  14. Kumar, G.; Denslow, N.D. Gene expression profiling in fish toxicology: A review. Rev. Environ. Contam. Toxicol. 2017, 241, 1–38. [Google Scholar] [PubMed]
  15. Park, K.; Kim, W.S.; Kwak, I.S. Effects of di-(2-ethylhexyl) phthalate on transcriptional expression of cellular protection-related HSP60 and HSP67B2 genes in the mud crab Macrophthalmus japonicus. Appl. Sci. 2020, 10, 2766. [Google Scholar] [CrossRef]
  16. Albornoz-Abud, N.A.; Canul-Marín, G.F.; Chan-Cuá, I.; Hernández-Núñez, E.; Cañizares-Martínez, M.A.; Valdés-Lozano, D.; Rodríguez-Canul, R.; Albores-Medina, A.; Colli-Dula, R.C. Gene expression analysis on growth, development and toxicity pathways of male Nile tilapia (Oreochromis niloticus), after acute and sub-chronic benzo (α) pyrene exposures. Comp. Biochem. Physiol. C Toxicol. Pharmacol. 2021, 250, 109160. [Google Scholar] [CrossRef]
  17. Berrebi, P.; Boissin, E.; Fang, F.; Cattaneo-Berrebi, G. Intron polymorphism(EPIC-PCR) reveals phylogeographic structure of Zacco platypus in China: A possible target for aquaculture development. Heredity 2005, 94, 589–598. [Google Scholar] [CrossRef]
  18. Kim, J.H.; Yeom, D.H.; Kim, J.H.; Kim, W.K.; An, K.G. Regional ecological health or risk assessments of stream ecosystems using biomarkers and bioindicators of target species (pale chub). Water Air Soil Pollut. 2016, 227, 469. [Google Scholar] [CrossRef]
  19. Simmons, D.B.; Wallschläger, D. A critical review of the biogeochemistry and ecotoxicology of selenium in lotic and lentic environments. Environ. Toxicol. Chem. 2005, 24, 1331–1343. [Google Scholar] [CrossRef]
  20. Meena, R.A.A.; Sathishkumar, P.; Ameen, F.; Yusoff, A.R.M.; Gu, F.L. Heavy metal pollution in immobile and mobile components of lentic ecosystems-a review. Environ. Sci. Pollut. Res. Int. 2018, 25, 4134–4148. [Google Scholar] [CrossRef]
  21. Livak, K.J.; Schmittgen, T.D. Analysis of relative gene expression data using real time quantitative PCR and the 2−ΔΔCT method. Methods 2001, 25, 402–408. [Google Scholar] [CrossRef] [PubMed]
  22. Beliaeff, B.; Burgeot, T. Integrated biomarker response: A useful tool for ecological risk assessment. Environ. Toxicol. Chem. 2002, 21, 1316–1322. [Google Scholar] [CrossRef]
  23. Evans, D.H.; Piermarini, P.M.; Choe, K.P. The multifunctional fish gill: Dominant site of gas exchange, osmoregulation, acid-base regulation, and excretion of nitrogenous waste. Physiol. Rev. 2005, 85, 97–177. [Google Scholar] [CrossRef] [PubMed]
  24. Emam, M.; Caballero-Solares, A.; Xue, X.; Umasuthan, N.; Milligan, B.; Taylor, R.G.; Balder, R.; Rise, M.L. Gill and liver transcript expression changes associated with gill damage in Atlantic salmon (Salmo salar). Front. Immunol. 2022, 13, 806484. [Google Scholar] [CrossRef] [PubMed]
  25. Li, H.L.; Lin, H.R.; Xia, J.H. Differential gene expression profiles and alternative isoform regulations in gill of Nile tilapia in response to acute hypoxia. Mar. Biotechnol. 2017, 19, 551–562. [Google Scholar] [CrossRef]
  26. Ireland, H.E.; Harding, S.J.; Bonwick, G.A.; Jones, M.; Smith, C.J.; Williams, J.H.H. Evaluation of heat shock protein 70 as a biomarker of environmental stress in Fucus serratus and Lemna minor. Biomarkers 2004, 9, 139–155. [Google Scholar] [CrossRef]
  27. Hall, J.L. Cellular mechanisms for heavy metal detoxification and tolerance. J. Exp. Bot. 2002, 53, 1–11. [Google Scholar] [CrossRef]
  28. Amiard, J.C.; Amiard-Triquet, C.; Barka, S.; Pellerin, J.; Rainbow, P.S. Metallothioneins in aquatic invertebrates: Their role in metal detoxification and their use as biomarkers. Aquat. Toxicol. 2006, 76, 160–202. [Google Scholar] [CrossRef]
  29. Mijošek, T.; Marijić, V.F.; Dragun, Z.; Krasnići, N.; Ivanković, D.; Erk, M. Evaluation of multi-biomarker response in fish intestine as an initial indication of anthropogenic impact in the aquatic karst environment. Sci. Total Environ. 2019, 660, 1079–1090. [Google Scholar] [CrossRef]
  30. Ighodaro, O.M.; Akinloye, O.A. First line defence antioxidants-superoxide dismutase (SOD), catalase (CAT) and glutathione peroxidase (GPX): Their fundamental role in the entire antioxidant defence grid. Alex. J. Med. 2018, 54, 287–293. [Google Scholar] [CrossRef] [Green Version]
  31. Carvalho, C.D.S.; Bernusso, V.A.; Araújo, H.S.S.D.; Espíndola, E.L.G.; Fernandes, M.N. Biomarker responses as indication of contaminant effects in Oreochromis niloticus. Chemosphere 2012, 89, 60–69. [Google Scholar] [CrossRef] [PubMed]
  32. Kim, W.K.; Lee, S.K.; Jung, J. Integrated assessment of biomarker responses in common carp (Cyprinus carpio) exposed to perfluorinated organic compounds. J. Hazard. Mater. 2010, 180, 395–400. [Google Scholar] [CrossRef] [PubMed]
  33. Maulvault, A.L.; Barbosa, V.; Alves, R.; Anacleto, P.; Camacho, C.; Cunha, S.; Fernandes, J.O.; Ferreira, P.P.; Rosa, R.; Marques, A.; et al. Integrated multi-biomarker responses of juvenile seabass to diclofenac, warming and acidification co-exposure. Aquat. Toxicol. 2018, 202, 65–79. [Google Scholar] [CrossRef]
  34. Beghin, M.; Schmitz, M.; Betoulle, S.; Palluel, O.; Baekelandt, S.; Mandiki, S.N.M.; Gillet, E.; Nott, K.; Porcher, J.M.; Robert, C.; et al. Integrated multi-biomarker responses of juvenile rainbow trout (Oncorhynchus mykiss) to an environmentally relevant pharmaceutical mixture. Ecotoxicol. Environ. Saf. 2021, 221, 112454. [Google Scholar] [CrossRef] [PubMed]
Figure 1. Location of the study area and sampling sites (Black line: 1 km).
Ijerph 19 11471 g001
Figure 2. Gene expression analysis of HSP70 (A), HSP90 (B), SOD (C), CAT (D), and MT (E) in Zacco platypus gills. The data are presented as the mean ± SD. The expression levels of each gene were compared with the expression level in Singal Lake inflow (expression level = 1). Significant differences are indicated with asterisks: * p < 0.05 and ** p < 0.01.
Ijerph 19 11471 g002
Figure 3. Gene expression analysis of HSP70 (A), HSP90 (B), SOD (C), CAT (D), and MT (E) in Zacco platypus liver. The data are presented as the mean ± SD. The expression levels of each gene were compared with the expression level in Singal Lake inflow (expression level = 1). Significant differences are indicated with asterisks: ** p < 0.01.
Ijerph 19 11471 g003
Figure 4. Star plots of IBR values for evaluating multiple gene responses in the gills (A) and liver (B) of Zacco platypus from each sampling site of Singal and Juam lakes.
Ijerph 19 11471 g004
Figure 5. Heatmap of water quality factors at each sampling site in Singal and Juam Lakes. Cell color represents high or low levels of water quality factors. Each group underwent Z-score normalization.
Ijerph 19 11471 g005
Table 1. List of specific primers used for quantitative real-time PCR.
GenePrimerTm (°C)Efficiency (%)Reference
GAPDHF: ACGCGGAAGGCCATACC5390Kim and Jung, 2016 [7]
R: GGCTGTGGGCAAAGTCATTC
HSP70F: CCTCAATGGTCCTGGTGAAG6196KY926431
R: TCACCTTCTGCCCCAGATAA
HSP90F: TGGTGTGGGCTTCTACTCTG6088KM201321
R: CCCTCTTCTCCTCGACGTAC
SODF: GAAGGAGGATGACTTGGGTAAGG6290KF515699
R: CCGGCGTTGCCAGTTTTA
CATF: AAATCCGCAGACTCACCTAAA5389KF515698
R: GGACGCAAACCCCAGAAA
MTF: GATTGCGCCAAGACTGGAA6091KC952875
R: CTGGCAGTTAGTGCACTTGCA
Table 2. Hydrological and physicochemical factors in each lake.
LakeHydrological FactorsPhysicochemical Factors
Basin Area
(km2)
Reservoir Area
(km2)
Maximum Water
Level (EL·m)
PlaceDepth
(m)
WT
(°C)
Do
(mg·L−1)
pHEC (µmhos/cm) COD
(mg·L−1)
TOC
(mg·L−1)
TN
(mg·L−1)
Chl-a
(mg·m−3)
NO3-N
(mg·L−1)
NH3-N
(mg·L−1)
DTOC
(mg·L−1)
Singal
(SG)
532.346Inflow (I)0.417.412.98.3723.04.33.04.35.22.90.12.8
Middle (M)5.019.415.18.1439.35.93.43.521.32.10.43.1
Outflow (O)0.517.111.88.3273.06.03.53.419.12.00.33.3
Average5.918.013.38.2478.45.43.33.715.22.30.23.1
Juam
(JA)
101033108.5Middle (M)36.622.210.36.278.33.93.90.96.40.40.11.7
Outflow (O)38.522.88.86.170.53.52.20.98.20.40.21.6
Average37.622.59.66.174.43.72.10.97.30.40.11.6
Publisher’s Note: MDPI stays neutral with regard to jurisdictional claims in published maps and institutional affiliations.

