
Attempting to Increase the Effectiveness of the Antidepressant Trazodone Hydrochloride Drug Using π-Acceptors
 , , , , , , , and
Abstract
:1. Introduction
2. Materials and Methods
2.1. Preface
2.2. Molecular Docking
2.3. Molecular Dynamics (MD) Simulation Study
2.4. Density Functional Theory
3. Results and Discussion
3.1. Multi-Spectroscopic Investigation
3.2. Molecular Docking Investigation
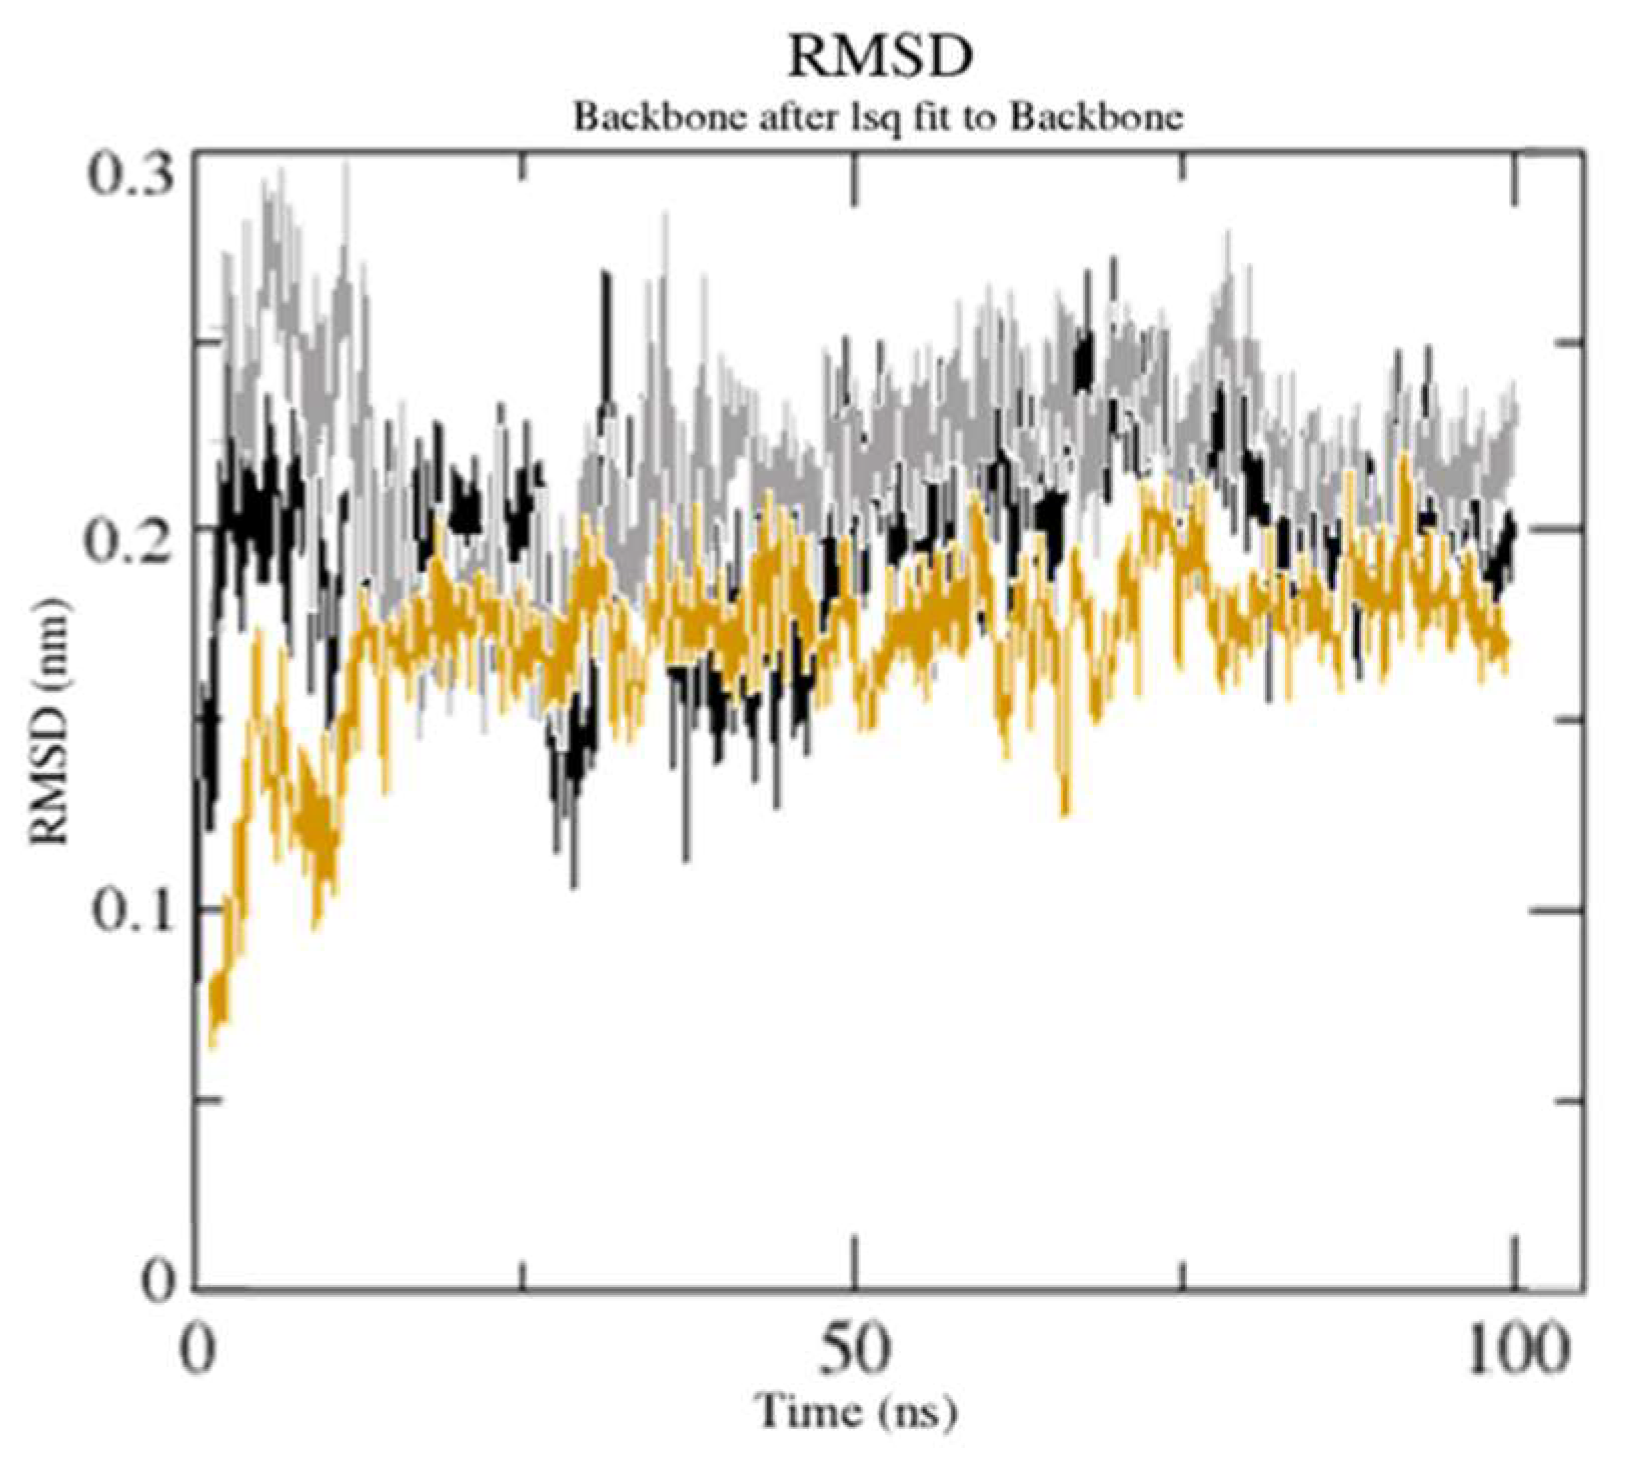
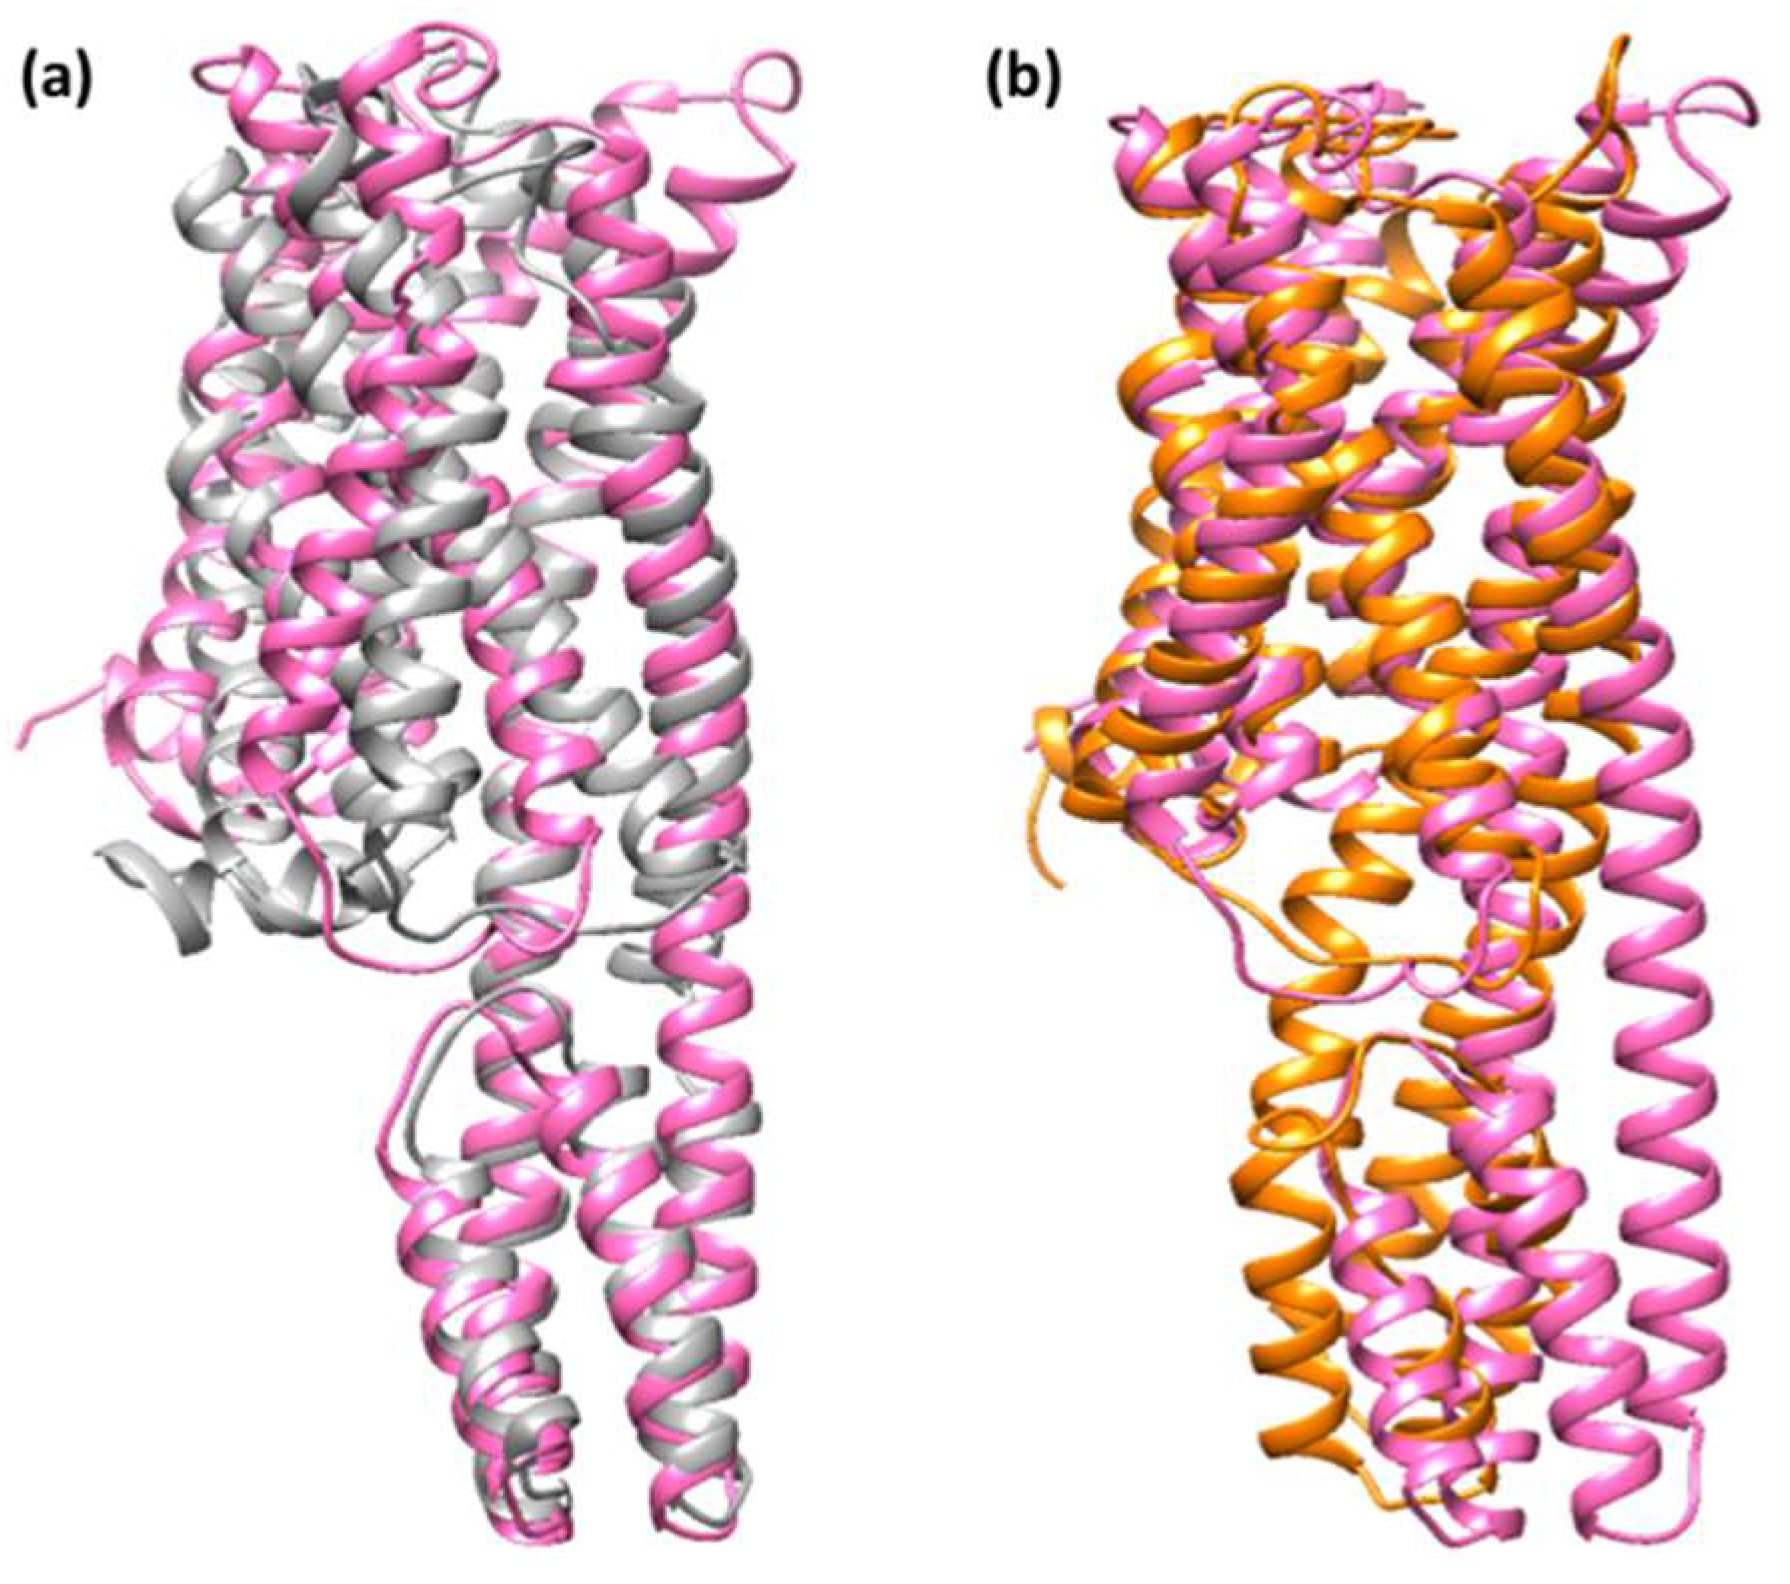
3.3. Structural Stability Analysis upon Ligand Binding
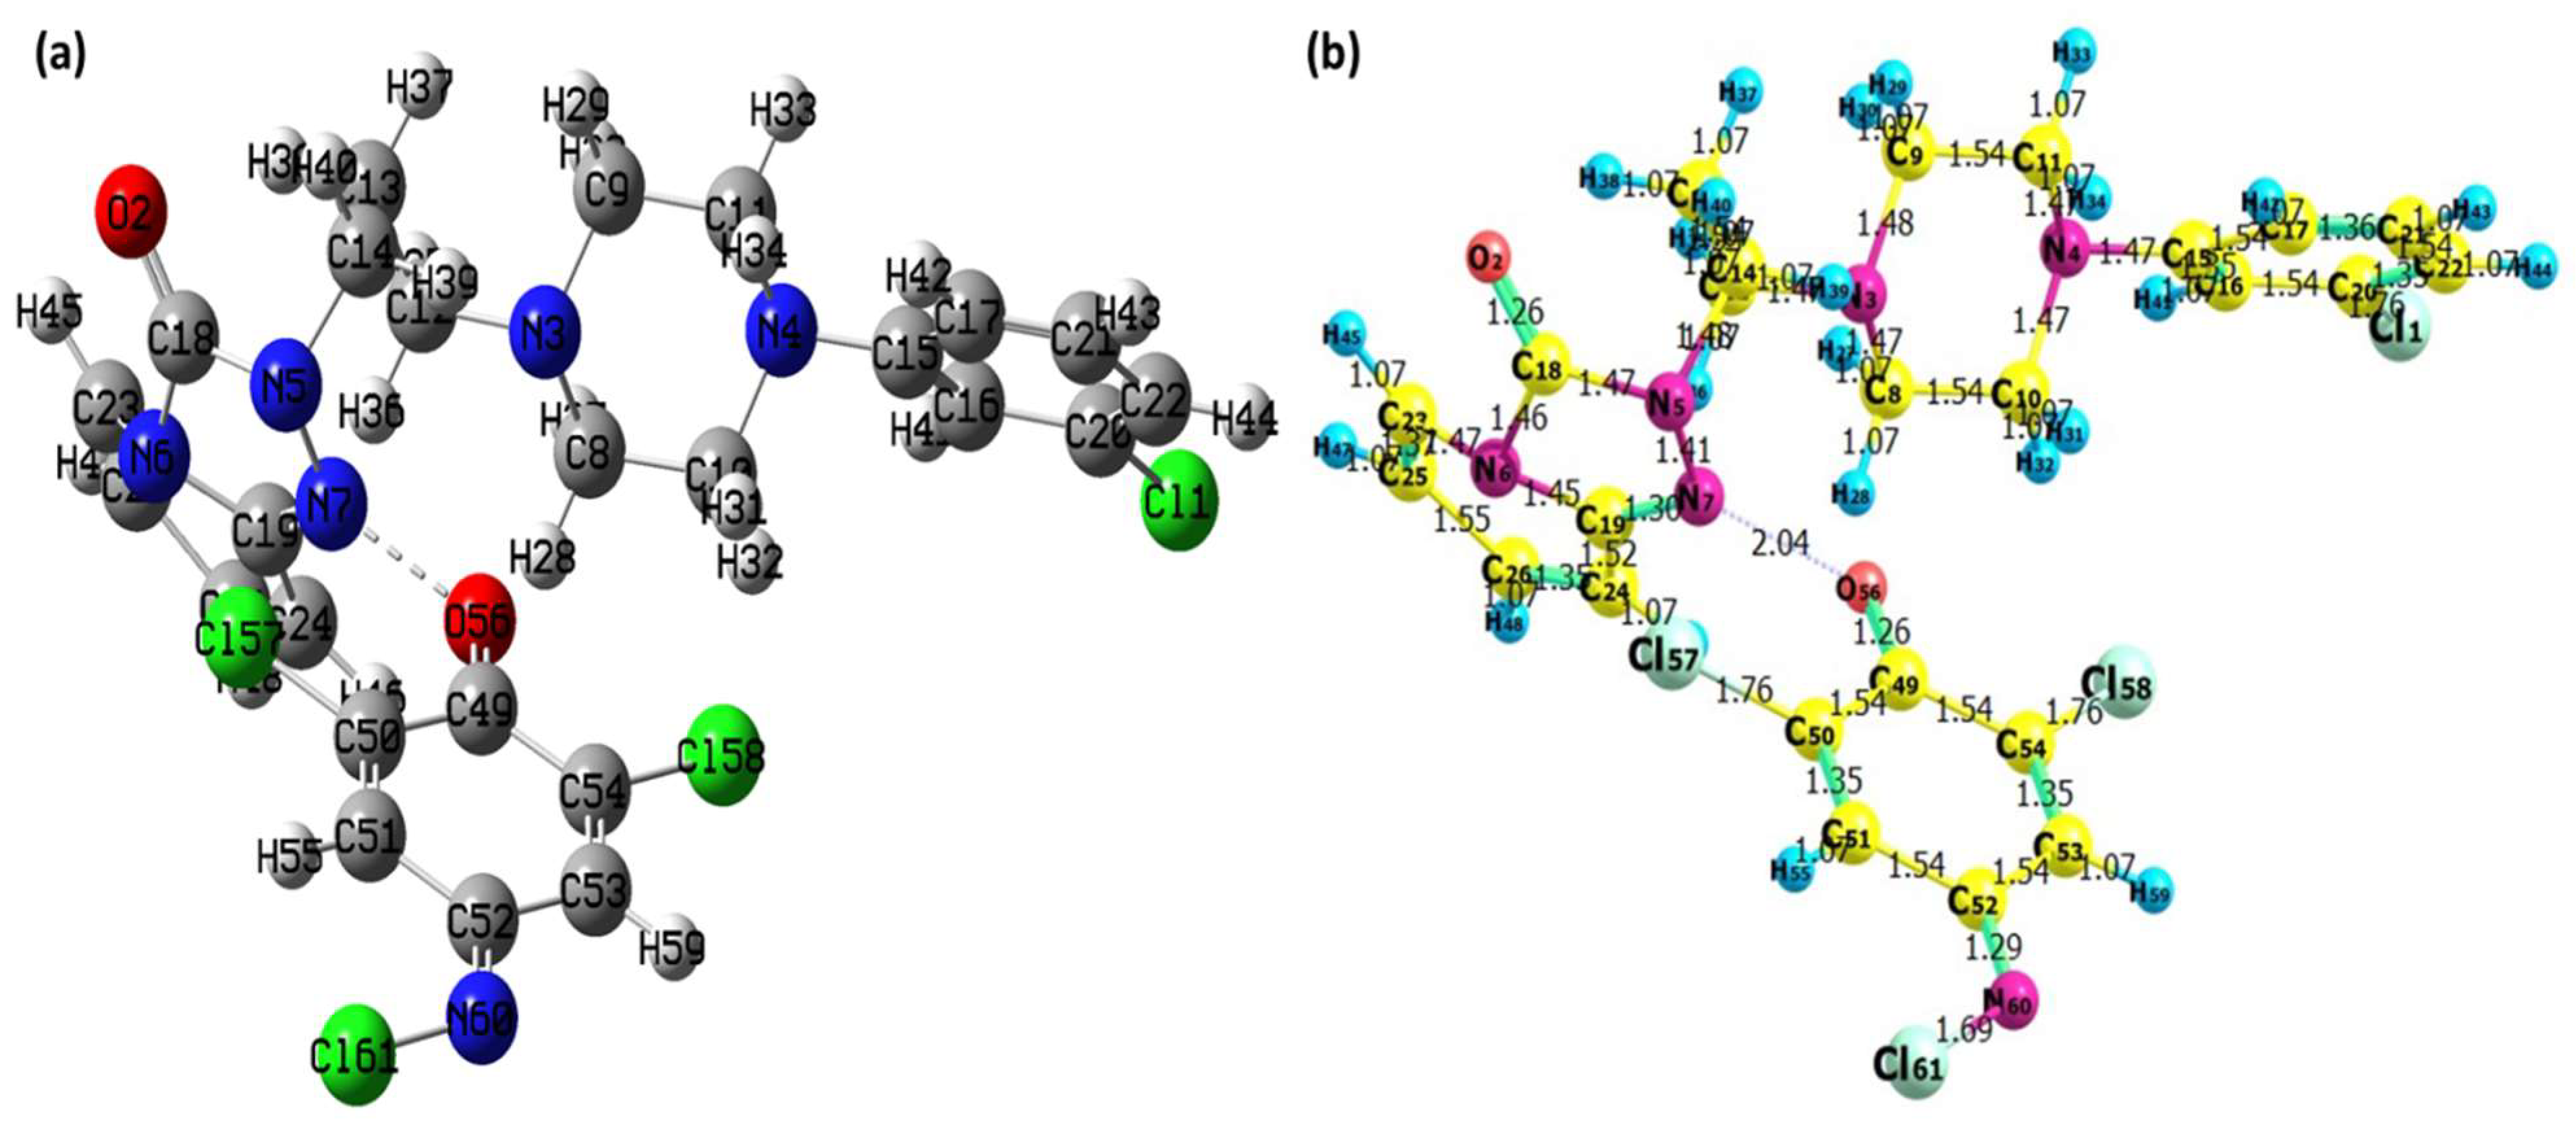
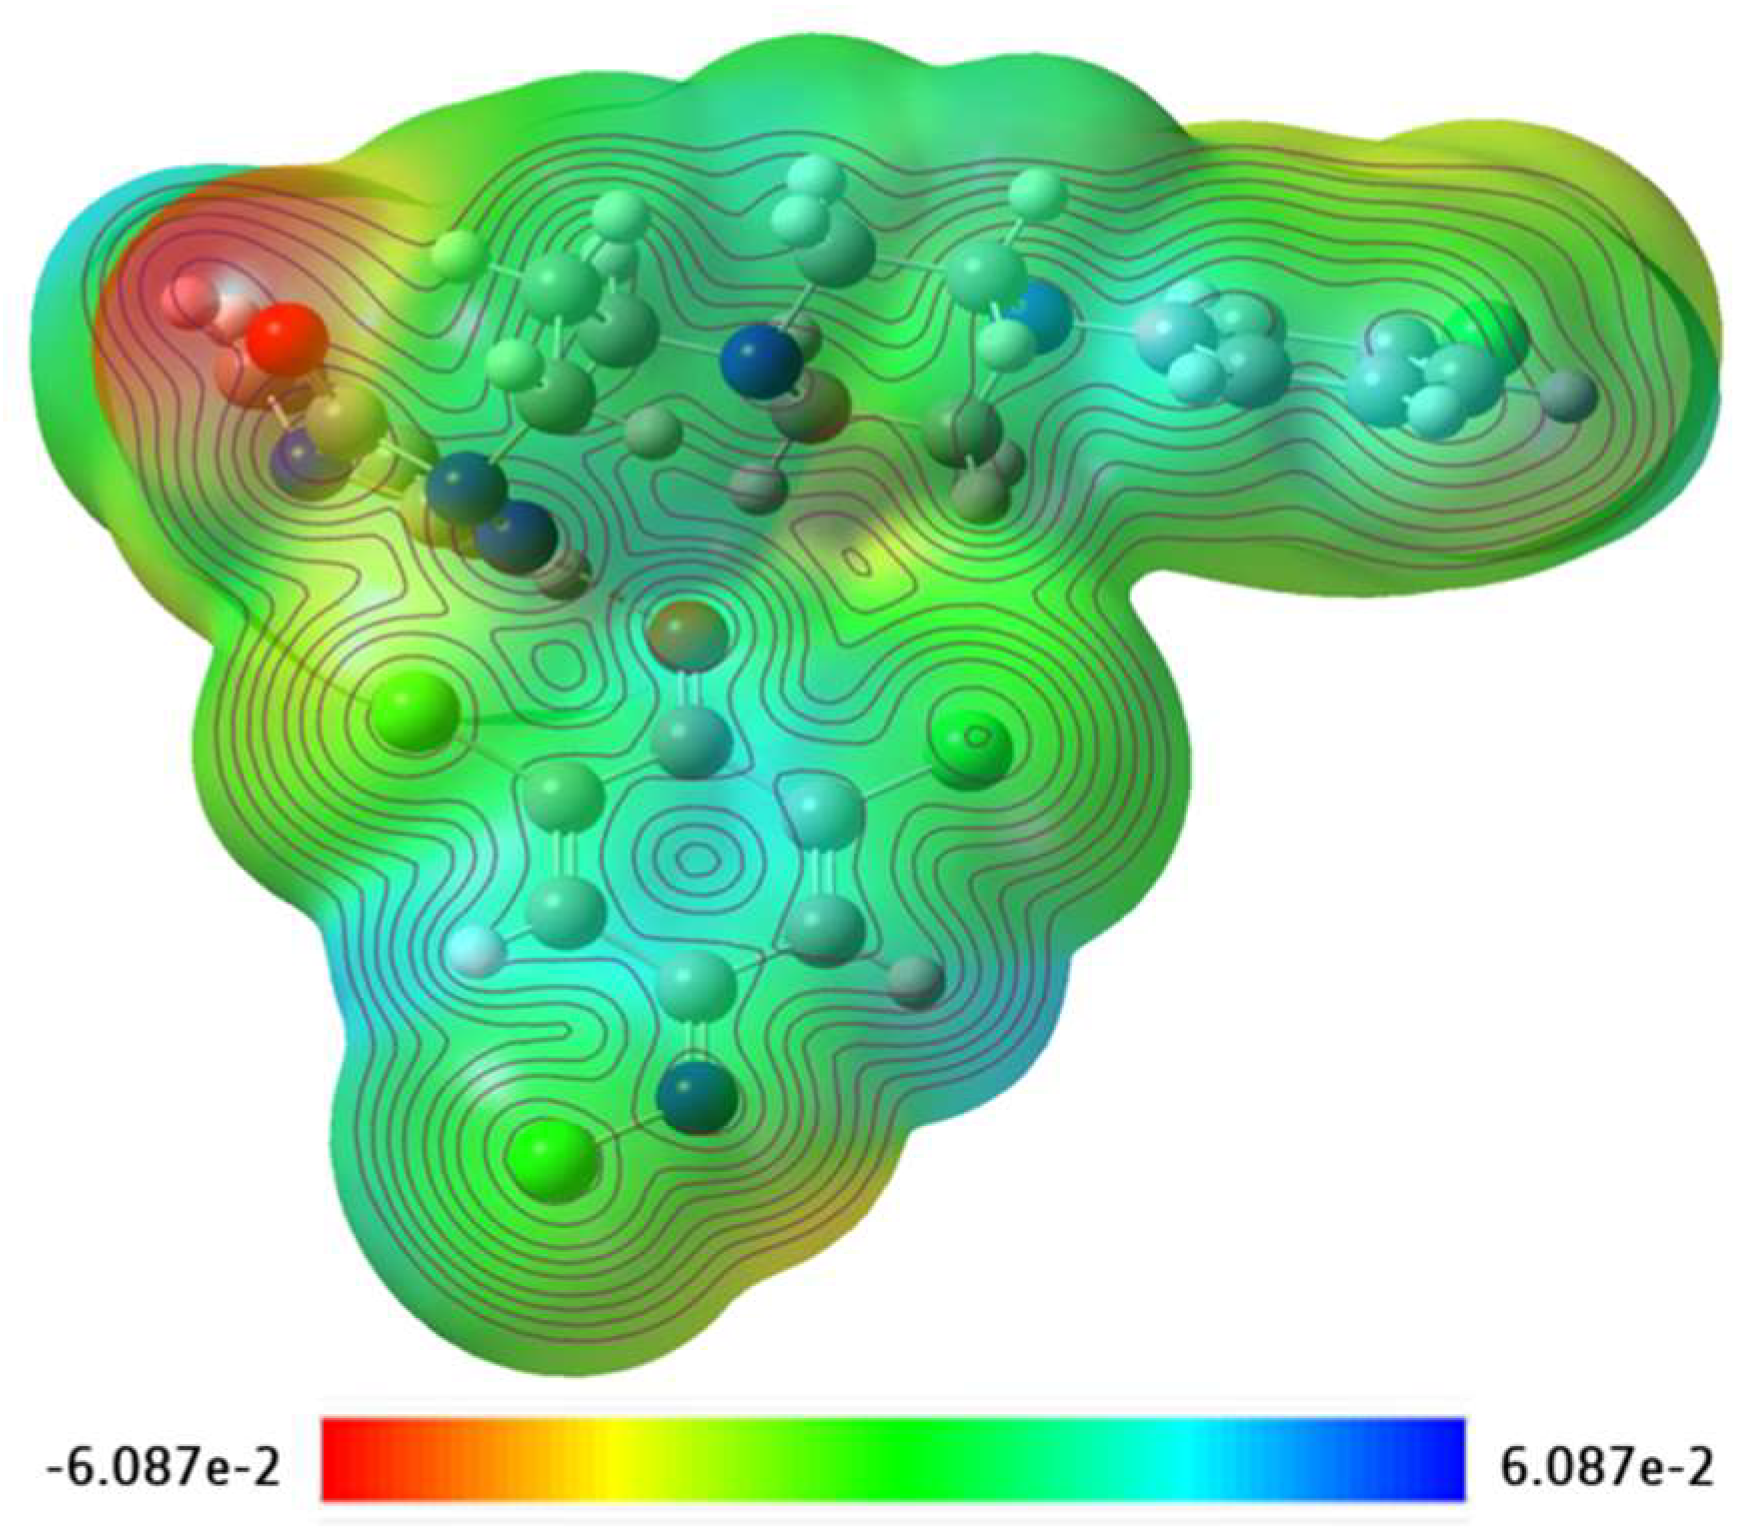
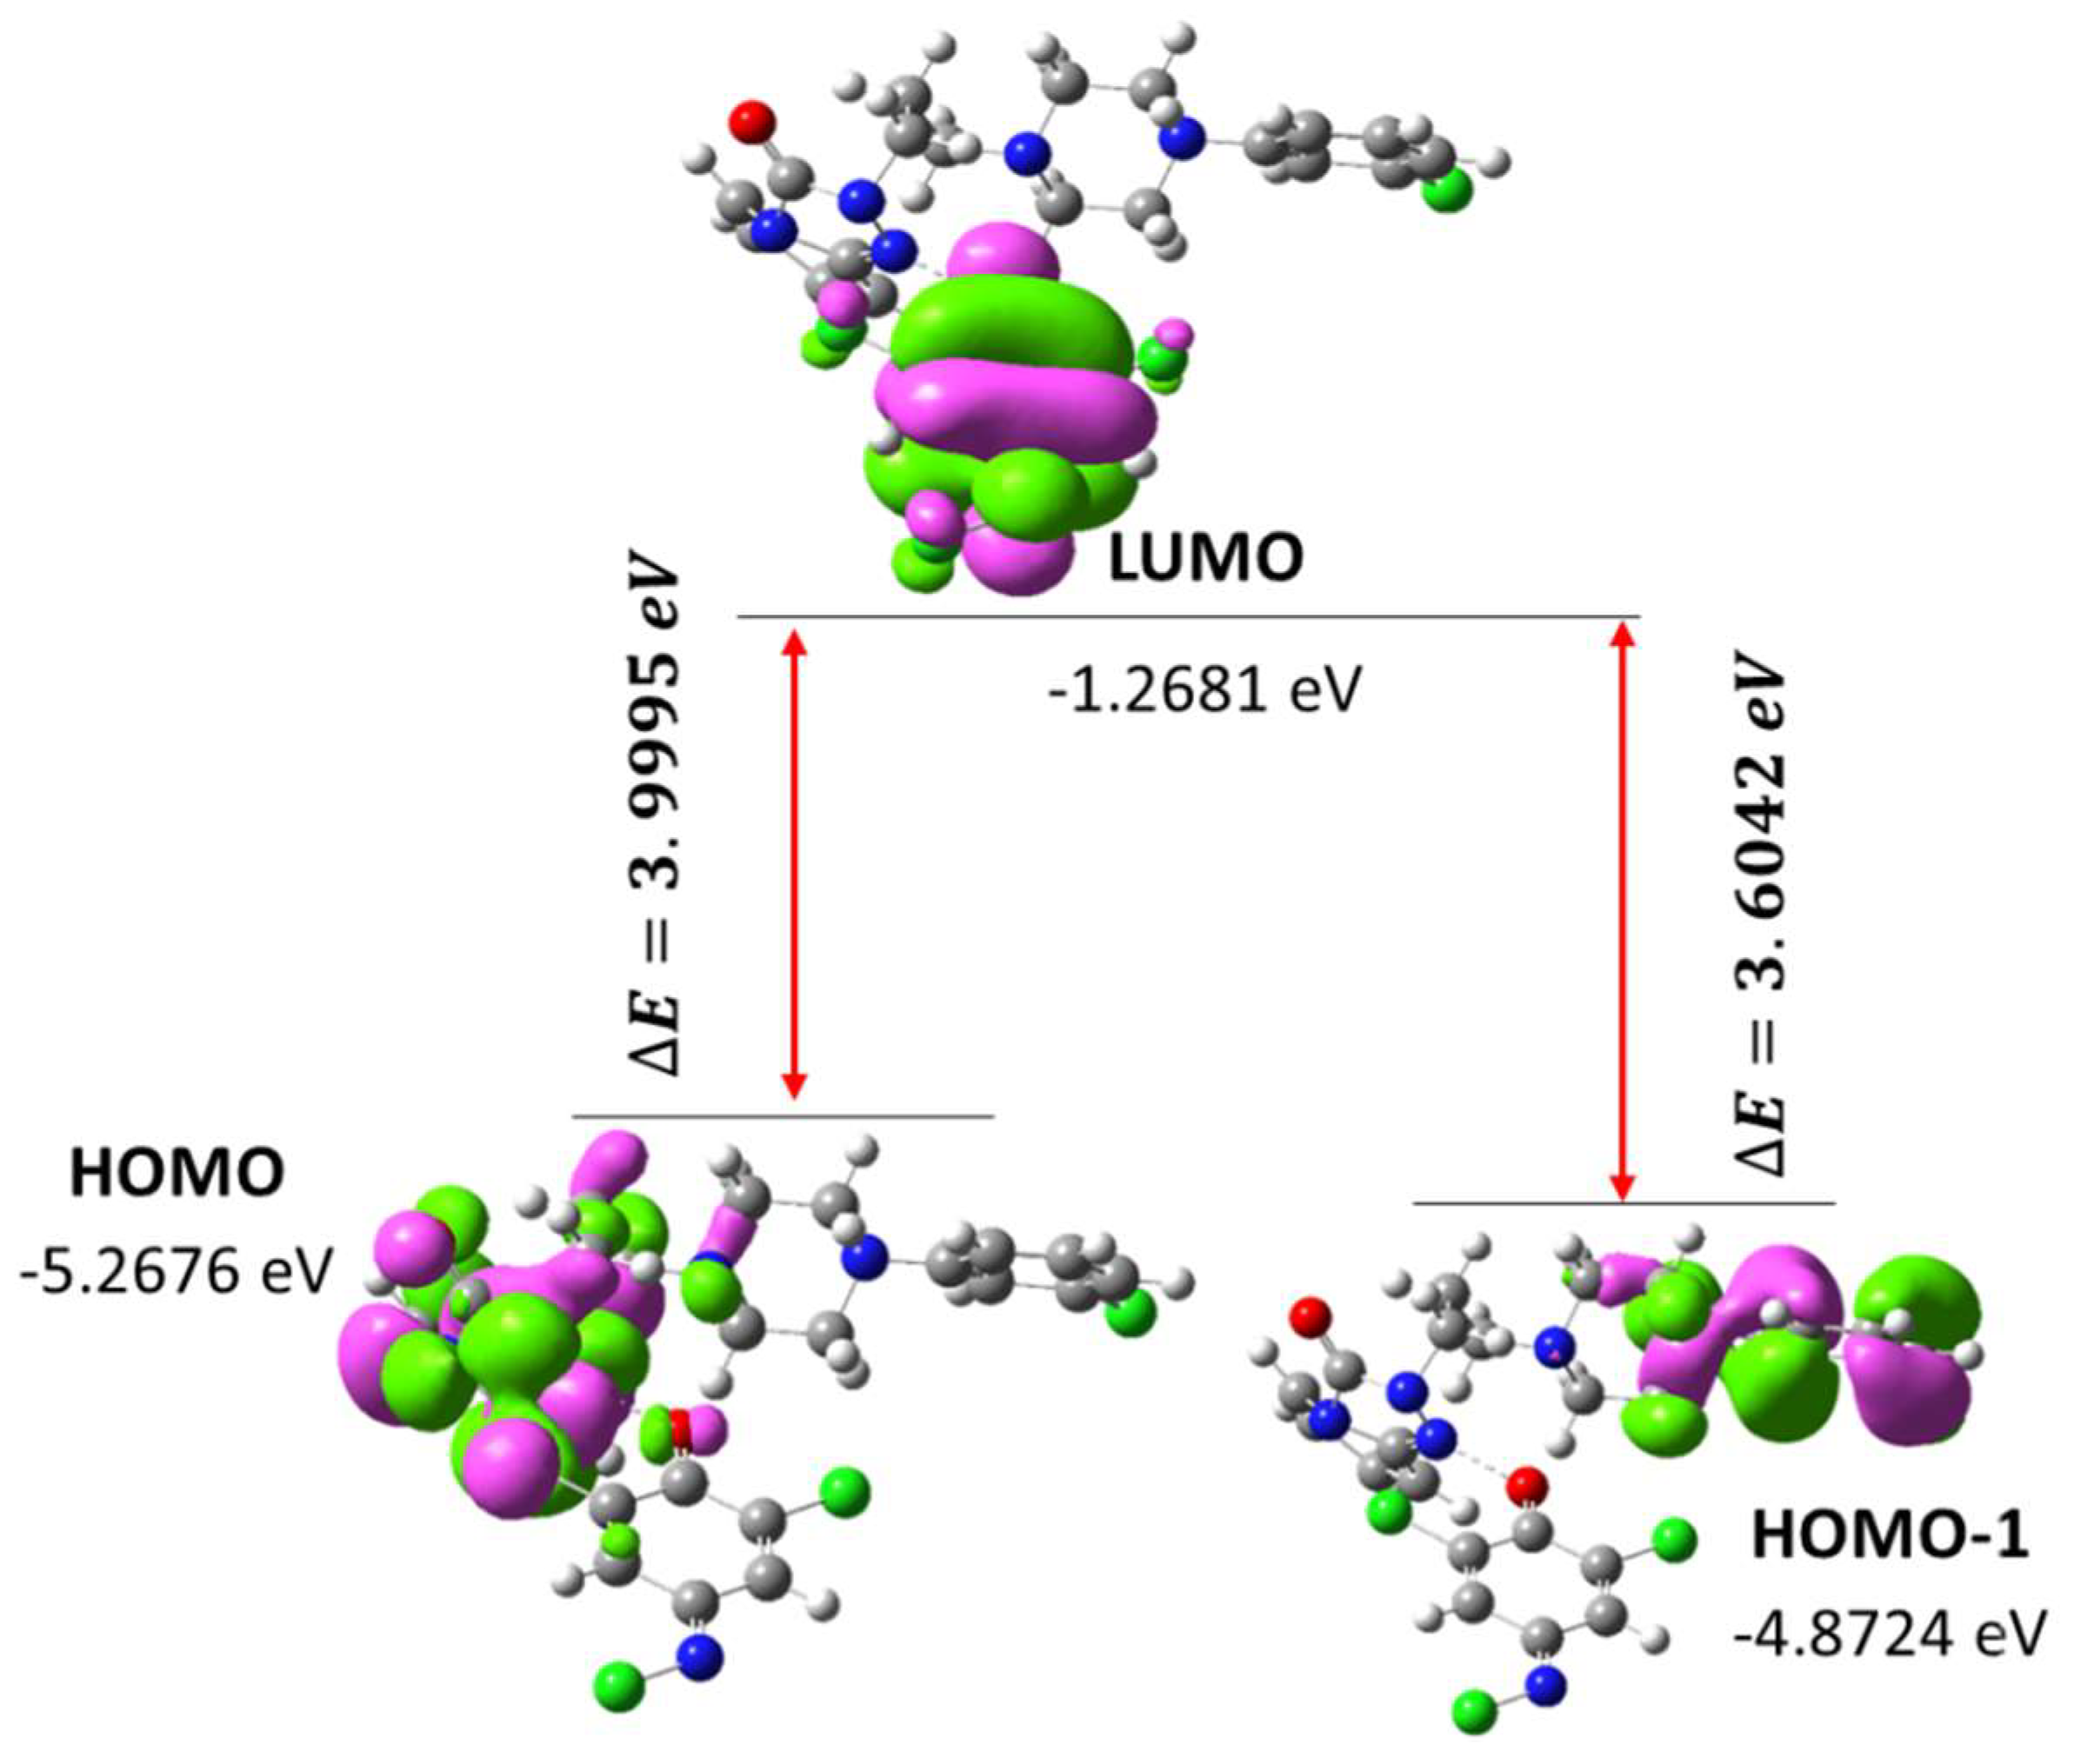
3.4. DFT Investigation
4. Conclusions
Supplementary Materials
Author Contributions
Funding
Institutional Review Board Statement
Informed Consent Statement
Data Availability Statement
Acknowledgments
Conflicts of Interest
References
- Hasin, D.S.; Goodwin, R.D.; Stinson, F.S.; Grant, B.F. Epidemiology of major depressive disorder: Results from the National Epidemiologic Survey on Alcoholism and Related Conditions. Arch. Gen. Psychiatry 2005, 62, 1097–1106. [Google Scholar] [CrossRef] [PubMed]
- GBD 2015 Disease and Injury Incidence and Prevalence Collaborators. Global, regional, and national incidence, prevalence, and years lived with disability for 310 diseases and injuries, 1990–2015: A systematic analysis for the Global Burden of Disease Study 2015. Lancet 2016, 388, 1545–1602. [Google Scholar] [CrossRef]
- Sullivan, P.F.; Neale, M.C.; Kendler, K.S. Genetic epidemiology of major depression: Review and meta-analysis. Am. J. Psychiatry 2000, 157, 1552–1562. [Google Scholar] [CrossRef]
- Major Depressive Disorder Working Group of the Psychiatric GWAS Consortium. A mega-analysis of genome-wide association studies for major depressive disorder. Mol. Psychiatry 2013, 18, 497–511. [Google Scholar] [CrossRef] [PubMed]
- Hek, K.; Demirkan, A.; Lahti, J.; Terracciano, A.; Teumer, A.; Cornelis, M.C.; Amin, N.; Bakshis, E.; Baumert, J.; Ding, J.; et al. A genome-wide association study of depressive symptoms. Biol. Psychiatry 2013, 73, 667–678. [Google Scholar] [CrossRef]
- Yohn, C.N.; Gergues, M.M.; Samuels, B.A. The role of 5-HT receptors in depression. Mol. Brain 2017, 10, 28. [Google Scholar] [CrossRef]
- Ramesh, V.; Venkatesan, V.; Ramasamy, B. Role of serotonin transporter and receptor gene polymorphisms in treatment re-sponse to selective serotonin reuptake inhibitors in major depressive disorder. Hum. Psychopharmacol. 2022, 6, e2830. [Google Scholar] [CrossRef]
- Ghanbari, R.; El Mansari, M.; Blier, P. Electrophysiological impact of trazodone on the dopamine and norepinephrine systems in the rat brain. Eur. Neuropsychopharmacol. 2012, 22, 518–526. [Google Scholar] [CrossRef]
- Golden, R.N.; Dawkins, K.; Nicholas, L. Trazodone and nefazodone. In The American Psychiatric Publishing Textbook of Psychopharmacology, 4th ed.; Schatzberg, A.F., Nemeroff, C.B., Eds.; American Psychiatric Publishing: Washington, DC, USA, 2009; p. 403. [Google Scholar]
- Fagiolini, A.; Comandini, A.; Dell’Osso, M.C.; Kasper, S. Rediscovering trazodone for the treatment of major depressive disorder. CNS Drugs 2012, 26, 1033–1049. [Google Scholar] [CrossRef]
- Stahl, S.M. Mechanism of action of trazodone: A multifunctional drug. CNS Spectr. 2009, 14, 536–546. [Google Scholar] [CrossRef]
- Cuomo, A.; Bianchetti, A.; Cagnin, A.; De Berardis, D.; Di Fazio, I.; Incalzi, R.A.; Marra, C.; Neviani, F.; Laurenzi, P.F.; Nicoletti, F. Trazodone: A multifunctional antidepressant. Evaluation of its properties and real-world use. J. Gerontol. Geriatr. 2021, 69, 120–129. [Google Scholar] [CrossRef]
- Hyslop, D.K.; Allen, L.E.; Taylor, D.P. Triazolo antidepressants do not inhibit monoamine oxidase. Drug Dev. Res. 1988, 12, 77–79. [Google Scholar] [CrossRef]
- Owens, M.J.; Morgan, W.N.; Plott, S.J.; Nemeroff, C.B. Neurotransmitter receptor and transporter binding profile of antidepressants and their metabolites. J. Pharmacol. Exp. Ther. 1997, 283, 1305–1322. [Google Scholar] [PubMed]
- Korolkovas, A. Essentials of Medicinal Chemistry, 2nd ed.; Wiley: New York, NY, USA, 1998; Chapter 3. [Google Scholar]
- Slifkin, A.M. Charge Transfer Interactions of Biomolecules; Academic Press: New York, NY, USA, 1971. [Google Scholar]
- Abou Attia, F.M. Use of charge-transfer complex formation for the spectrophotometric determination of nortriptyline. II Farm. 2000, 55, 659. [Google Scholar] [CrossRef]
- Basavaiah, K. Determination of some psychotropic phenothiazine drugs by charge-transfer complexation reaction with chloranilic acid. II Farm. 2004, 59, 315–321. [Google Scholar] [CrossRef] [PubMed]
- Refat, M.S.; Ibrahim, O.B.; Saad, H.A.; Adam, A.M.A. Usefulness of charge–transfer complexation for the assessment of sympathomimetic drugs: Spectroscopic properties of drug ephedrine hydrochloride complexed with some π-acceptors. J. Mol. Struct. 2014, 1064, 58–69. [Google Scholar] [CrossRef]
- Eldaroti, H.H.; Gadir, S.A.; Refat, M.S.; Adam, A.M.A. Charge-transfer interaction of drug quinidine with quinol, picric acid and DDQ: Spectroscopic characterization and biological activity studies towards understanding the drug–receptor mechanism. J. Pharm. Anal. 2014, 4, 81–95. [Google Scholar] [CrossRef]
- El-Habeeb, A.A.; Al-Saif, F.A.; Refat, M.S. Charge-transfer interactions of metoclopramide nausea drug against six kind of π-acceptors: Spectral and thermal discussions. Spectrochim. Acta Part A 2014, 123, 455–466. [Google Scholar] [CrossRef]
- Elqudaby, H.M.; Mohamed, G.G.; El-Din, G.M.G. Analytical studies on the charge transfer complexes of loperamide hydrochloride and trimebutine drugs. Spectroscopic and thermal characterization of CT complexes. Spectrochim. Acta Part A 2014, 129, 84–95. [Google Scholar] [CrossRef]
- Eldaroti, H.H.; Gadir, S.A.; Refat, M.S.; Adam, A.M.A. Spectroscopic investigations of the charge-transfer interaction between the drug reserpine and different acceptors: Towards understanding of drug–receptor mechanism. Spectrochim. Acta Part A 2013, 115, 309–323. [Google Scholar] [CrossRef]
- El-Habeeb, A.A.; Al-Saif, F.A.; Refat, M.S. Spectroscopic and thermal investigations on the charge transfer interaction between risperidone as a schizophrenia drug with some traditional π-acceptors: Part 2. J. Mol. Struct. 2013, 1036, 464–477. [Google Scholar] [CrossRef]
- El-Habeeb, A.A.; Al-Saif, F.A.; Refat, M.S. Charge transfer complex of some nervous and brain drugs–Part 1: Synthesis, spectroscopic, analytical and biological studies on the reaction between haloperidol antipsychotic drugs with π-acceptors. J. Mol. Struct. 2013, 1034, 1–18. [Google Scholar] [CrossRef]
- El-Habeeb, A.A.; Refat, M.S. Synthesis and spectroscopic characterization of trazodone charge transfer complexes with different types of π-acceptors. Russ. J. Gen. Chem. 2015, 85, 951–958. [Google Scholar] [CrossRef]
- O’Boyle, N.M.; Banck, M.; James, C.A.; Morley, C.; Vandermeersch, T.; Hutchison, G.R. Open Babel: An open chemical toolbox. J. Cheminform. 2011, 3, 33. [Google Scholar] [CrossRef]
- Dallakyan, S. PyRx-Python Prescription v. 0.8; The Scripps Research Institute: San Diego, CA, USA, 2008. [Google Scholar]
- Chu, C.-H.; Li, K.-M.; Lin, S.-W.; Chang, M.D.-T.; Jiang, T.-Y.; Sun, Y.-J. Crystal structures of starch binding domain from Rhizopus oryzae glucoamylase in complex with isomaltooligosaccharide: Insights into polysaccharide binding mechanism of CBM21 family. Proteins Struct. Funct. Bioinform. 2014, 82, 1079–1085. [Google Scholar] [CrossRef]
- Morris, G.M.; Goodsell, D.S.; Halliday, R.S.; Huey, R.; Hart, W.E.; Belew, R.K.; Olson, A.J. Automated docking using a Lamarckian genetic algorithm and an empirical binding free energy function. J. Comput. Chem. 1998, 19, 1639–1662. [Google Scholar] [CrossRef]
- Trott, O.; Olson, A.J. AutoDock Vina: Improving the speed and accuracy of docking with a new scoring function, efficient optimization, and multithreading. J. Comput. Chem. 2010, 31, 455–461. [Google Scholar] [CrossRef]
- Yu, W.; He, X.; Vanommeslaeghe, K.; MacKerell, A.D., Jr. Extension of the CHARMM General Force Field to sulfonylcontaining compounds and its utility in biomolecular simulations. J. Comput. Chem. 2012, 33, 2451–2468. [Google Scholar] [CrossRef]
- Jorgensen, W.L.; Chandrasekhar, J.; Madura, J.D.; Impey, R.W.; Klein, M.L. Comparison of Simple Potential Functions for Simulating Liquid Water. J. Chem. Phys. 1983, 79, 926–935. [Google Scholar] [CrossRef]
- Allen, M.P.; Tildesley, D.J. Computer Simulations of Liquids; Clarendon Press: Oxford, UK, 1987. [Google Scholar]
- Essmann, U.; Perera, L.; Berkowitz, M.L.; Darden, T.; Lee, H.; Pedersen, L.G. A Smooth Particle Mesh Ewald Method. J. Chem. Phys. 1995, 103, 8577–8593. [Google Scholar] [CrossRef] [Green Version]
- Steinbach, P.J.; Brooks, B.R. New Spherical-Cutoff Methods for Long-Range Forces in Macromolecular Simula-tion. J. Comput. Chem. 1994, 15, 667–683. [Google Scholar] [CrossRef]
- Humphrey, W.; Dalke, A.; Schulten, K. VMD: Visual molecular dynamics. J. Mol. Graph. 1996, 14, 28–33. [Google Scholar] [CrossRef]
- DeLano, W.L. PyMOL; DeLano Scientific: San Francisco, CA, USA, 2002. [Google Scholar]
- Frisch, M.J.; Trucks, G.W.; Schlegel, H.B.; Scuseria, G.E.; Robb, M.A.; Cheeseman, J.R.; Scalmani, G.; Barone, V.; Petersson, G.A.; Nakatsuji, H.; et al. Gaussian 09, Revision E.01; Gaussian, Inc.: Wallingford, CT, USA, 2009. [Google Scholar]
- Becke, A.D. Density-functional thermochemistry. III. The role of exact exchange. J. Chem. Phys. 1993, 98, 5648. [Google Scholar] [CrossRef]
- Hariharan, P.C.; Pople, J.A. The effect of d-functions on molecular orbital energies for hydrocarbons. Chem. Phys. Lett. 1972, 16, 217–219. [Google Scholar] [CrossRef]
- Zhurko, G.A.; Zhurko, D.A. Chemcraft—Graphical Program for Visualization of Quantum Chemistry Computations; Academic Version 1.5: Ivanovo, Russia, 2004. [Google Scholar]
- Demirhan, H.; Arslan, M.; Zengin, M.; Kucukislamoglu, M.J. Investigation of Charge Transfer Complexes Formed between Mirtazapine and Some π-Acceptors. J. Spectrosc. 2013, 2013, 875953. [Google Scholar] [CrossRef]
- Kross, R.D.; Fassel, V.A. Regularities in the infrared spectra of picric acid molecular complexes. J. Am. Chem. Soc. 1957, 79, 38–41. [Google Scholar] [CrossRef]
- Akram, M.; Lal, H.; Shakya, S.; Kabir-ud-Din. Multispectroscopic and Computational Analysis Insight into the Interaction of Cationic Diester-Bonded Gemini Surfactants with Serine Protease α-Chymotrypsin. ACS Omega 2020, 5, 3624–3637. [Google Scholar] [CrossRef]
- Khan, I.M.; Shakya, S.; Islam, M.; Khan, S.; Najnin, H. Synthesis and spectrophotometric studies of CT complex between 1, 2-dimethylimidazole and picric acid in different polar solvents: Exploring antimicrobial activities and molecular (DNA) docking. Phys. Chem. Liq. 2021, 59, 753–769. [Google Scholar] [CrossRef]
- Krivák, R.; Jendele, L.; Hoksza, D. Peptide-Binding Site Prediction From Protein Structure via points on the Solvent Accessible Surface. In Proceedings of the 2018 ACM International Conference on Bioinformatics, Computational Biology, and Health Informatics, Washington, DC, USA, 29 August 2018–1 September 2018. [Google Scholar] [CrossRef]
- Ranjbar, A.; Jamshidi, M.; Torabi, S. Molecular modelling of the antiviral action of Resveratrol derivatives against the activity of two novel SARS CoV-2 and 2019-nCoV receptors. Eur. Rev. Med. Pharmacol. Sci. 2020, 24, 7834–7844. [Google Scholar] [CrossRef]
- Kufareva, I.; Abagyan, R. Methods of protein structure comparison. In Methods in Molecular Biology; Humana Press: Clifton, NJ, USA, 2012; Volume 857, pp. 231–257. [Google Scholar]
- Wu, S.; Zhang, Y. A comprehensive assessment of sequence-based and template-based methods for protein contact prediction. Bioinformatics 2008, 24, 924–931. [Google Scholar] [CrossRef]
- Shakya, S.; Khan, I.M.; Ahmad, M. Charge transfer complex based real-time colorimetric chemosensor for rapid recognition of dinitrobenzene and discriminative detection of Fe2+ ions in aqueous media and human hemoglobin. J. Photochem. Photobiol. A Chem. 2020, 392, 112402. [Google Scholar] [CrossRef]
- Islam, M.R.; Shakya, S.; Selim, A.; Alam, M.S.; Ali, M. Solvatochromic Absorbance and Fluorescence Probe Behavior within Ionic Liquid+ γ-Butyrolactone Mixture. J. Chem. Eng. Data 2019, 64, 4169–4180. [Google Scholar] [CrossRef]
- Murugavel, S.; Ravikumar, C.; Jaabil, G.; Alagusundaram, P. Synthesis, crystal structure analysis, spectral investigations (NMR, FT-IR, UV), DFT calculations, ADMET studies, molecular docking and anticancer activity of 2-(1-benzyl-5-methyl-1H-1, 2, 3-triazol-4-yl)-4-(2-chlorophenyl)-6-methoxypyridine–a novel potent human topoisomerase IIα inhibitor. J. Mol. Struct. 2019, 1176, 729–742. [Google Scholar]
- Ferreira, L.G.; Dos Santos, R.N.; Oliva, G.; Andricopulo, A.D. Molecular docking and structure-based drug design strategies. Molecules 2015, 22, 13384–13421. [Google Scholar] [CrossRef] [PubMed]
- Pauli, I.; dos Santos, R.N.; Rostirolla, D.C.; Martinelli, L.K.; Ducati, R.G.; Timmers, L.F.S.M.; Basso, L.A.; Santos, D.S.; Guido, R.V.C.; Andricopulo, A.D.; et al. Discovery of new inhibitors of Mycobacterium tuberculosis InhA enzyme using virtual screening and a 3D-pharmacophore-based approach. J. Chem. Inf. Model. 2013, 53, 2390–2401. [Google Scholar] [CrossRef]
- Miller, Z.; Kim, K.S.; Lee, D.M.; Kasam, V.; Baek, S.E.; Lee, K.H.; Zhang, Y.Y.; Ao, L.; Carmony, K.; Lee, N.R.; et al. Proteasome inhibitors with pyrazole scaffolds from structure-based virtual screening. J. Med. Chem. 2015, 58, 2036–2041. [Google Scholar] [CrossRef]
- Matsuno, K.; Masuda, Y.; Uehara, Y.; Sato, H.; Muroya, A.; Takahashi, O.; Yokotagawa, T.; Furuya, T.; Okawara, T.; Otsuka, M.; et al. Identification of a new series of STAT3 inhibitors by virtual screening. ACS Med. Chem. Lett. 2010, 1, 371–375. [Google Scholar] [CrossRef]
- Wang, L.; Gu, Q.; Zheng, X.; Ye, J.; Liu, Z.; Li, J.; Hu, X.; Hagler, A.; Xu, J. Discovery of new selective human aldose reductase inhibitors through virtual screening multiple binding pocket conformations. J. Chem. Inf. Model. 2013, 53, 2409–2422. [Google Scholar] [CrossRef]


| Ligand | Binding Free Energy (kcal/mol) |
|---|---|
| [(TZD-PA)] | −8.7 |
| [(TZD-NBS)] | −8.3 |
| [(TZD-DDB)] | −8.2 |
| [(TZD–DCQ)] | −8.9 |
| [(TZD-DBQ)] | −7.2 |
| [(TZD–TCNQ)] | −7.4 |
| TZD | −6.5 |
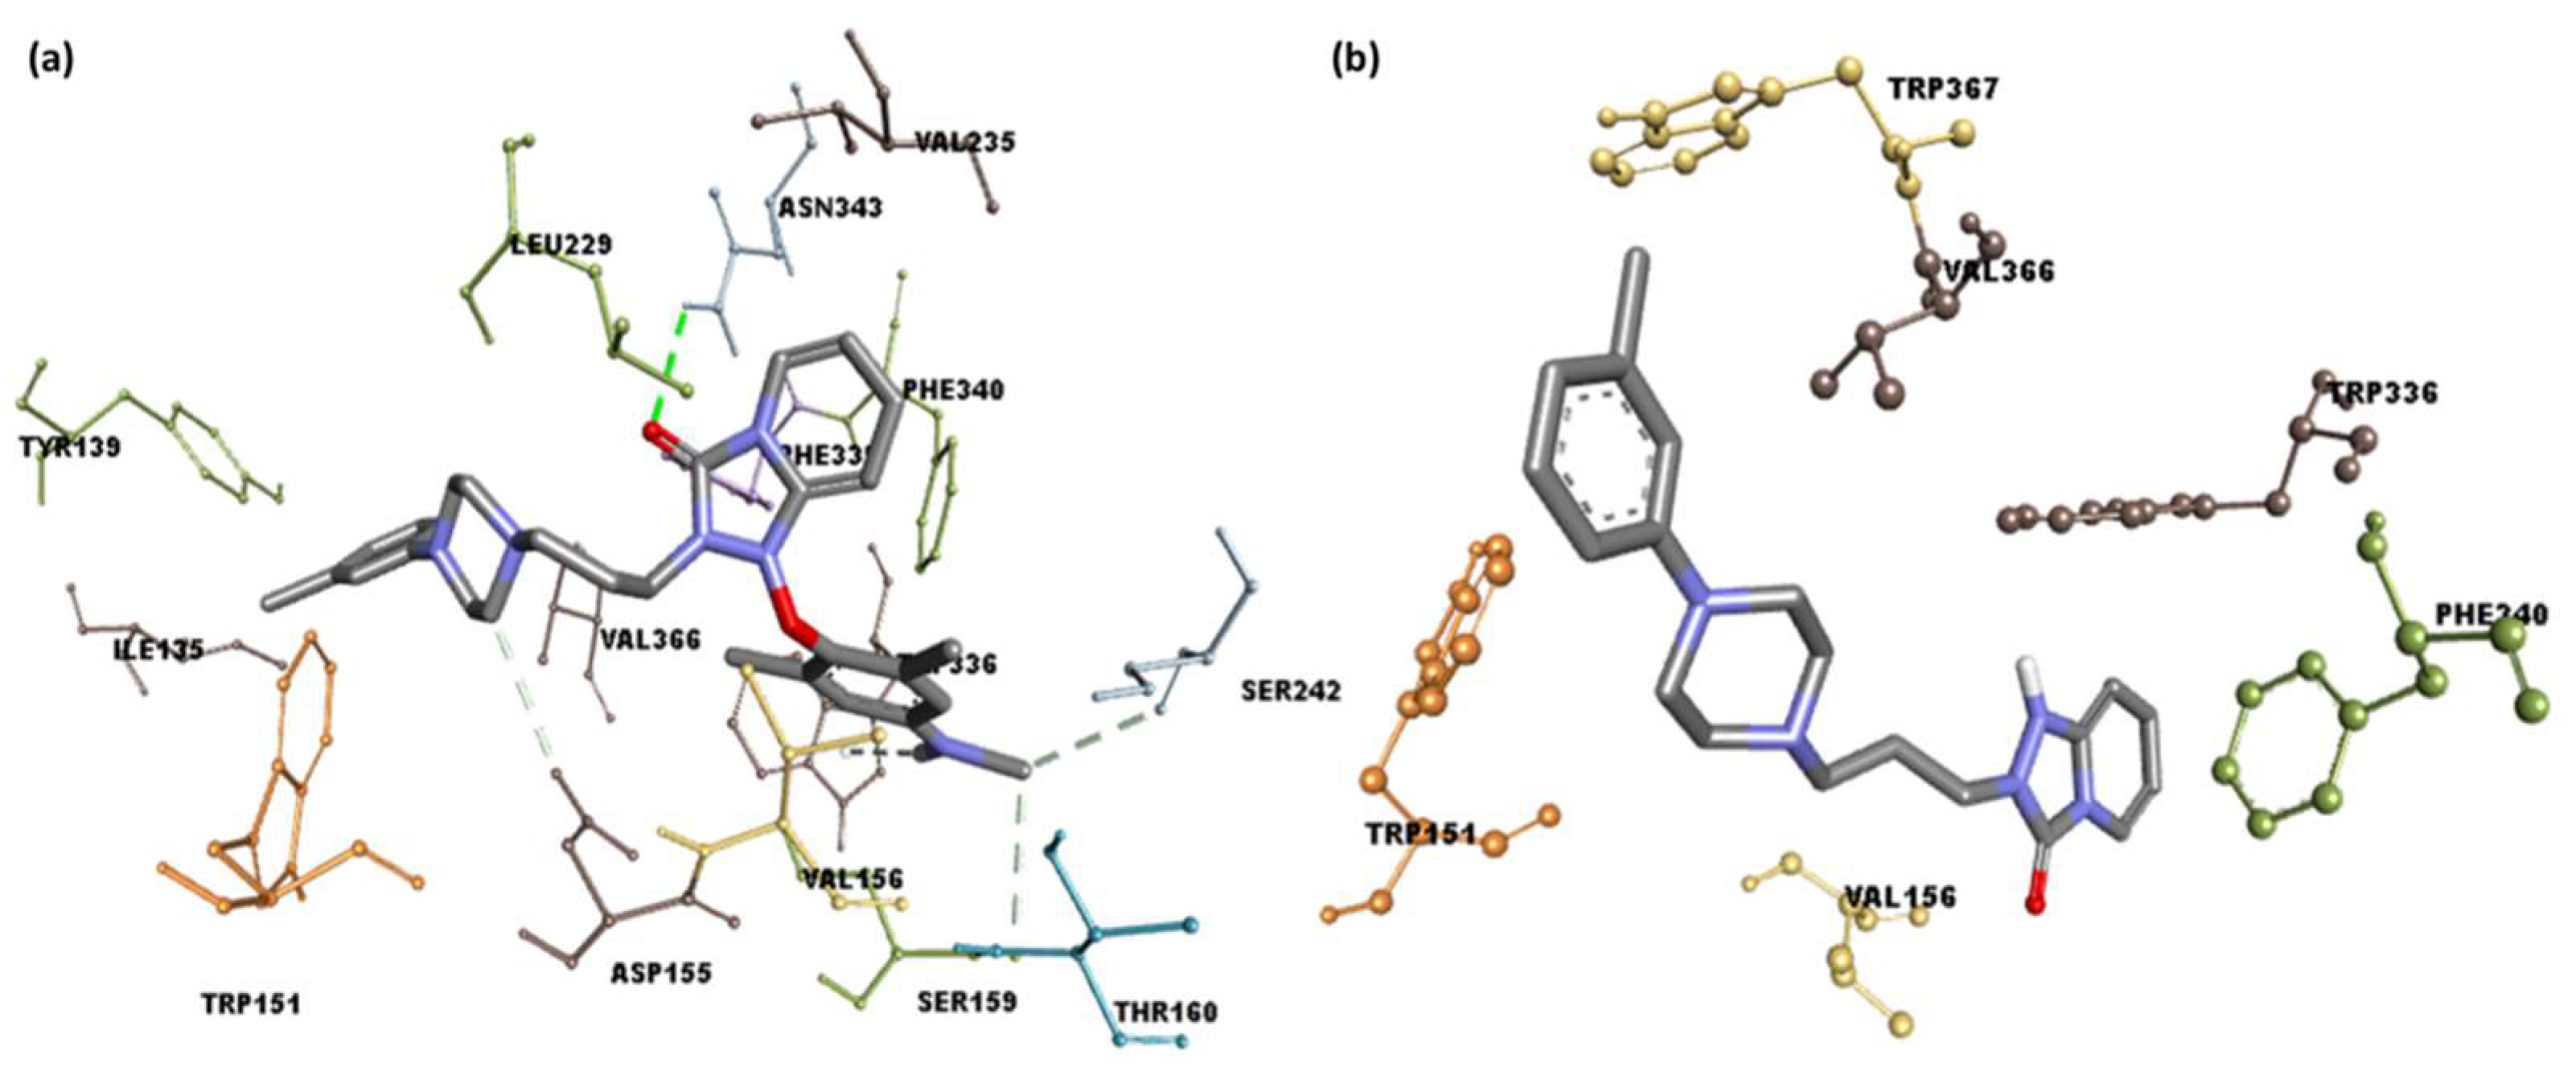
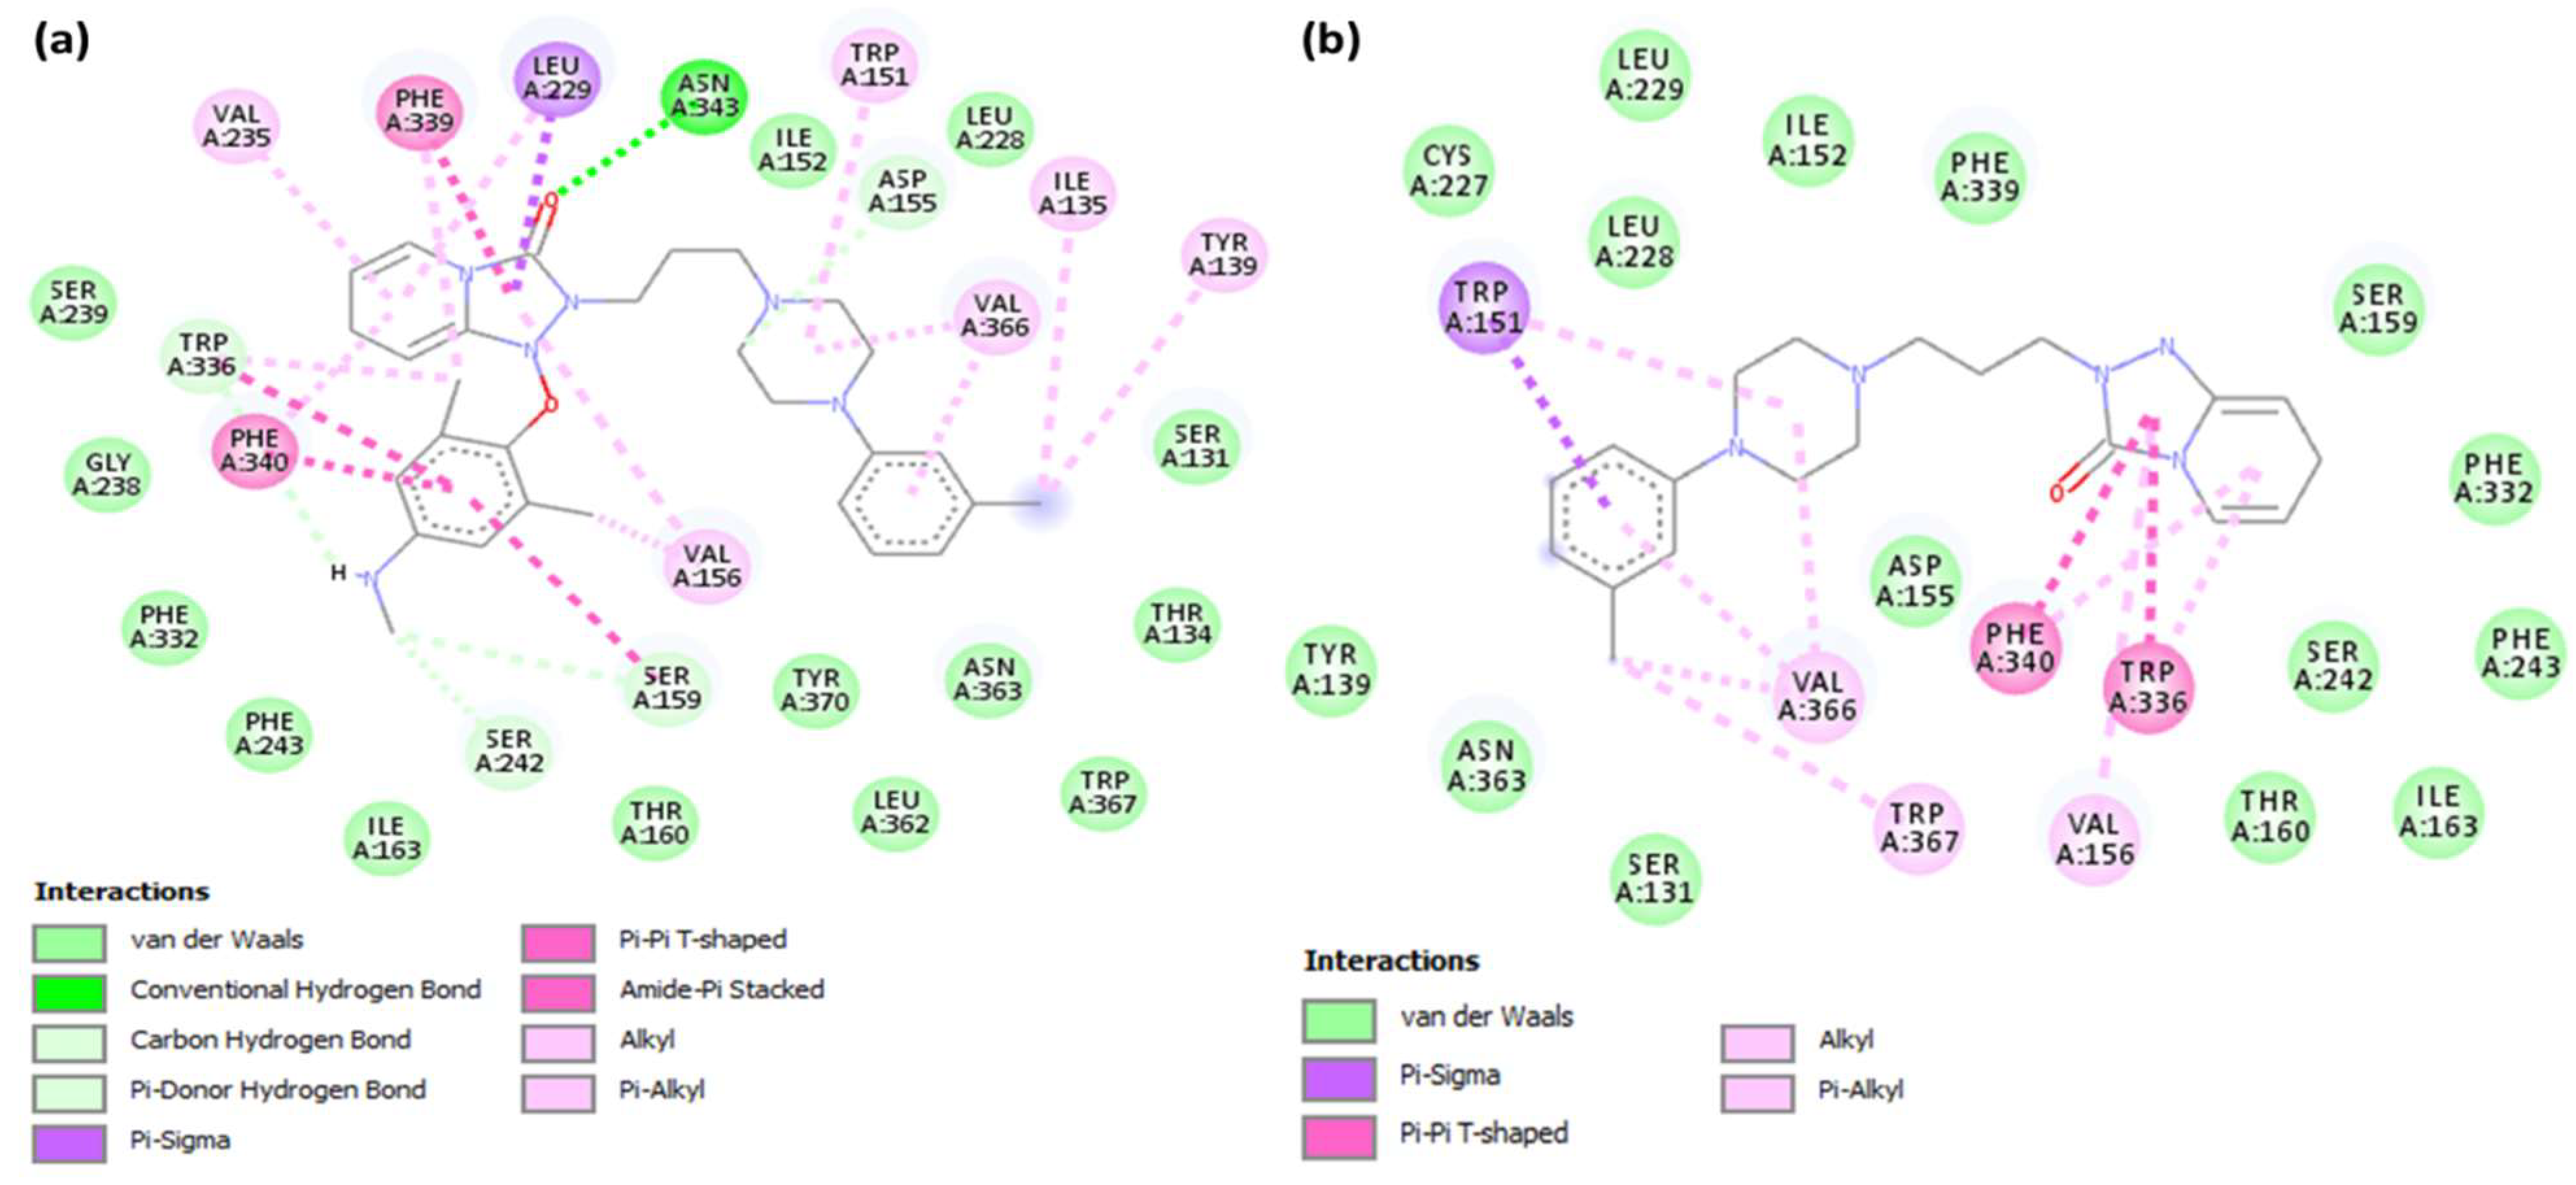
| Ligand | Binding Free Energy (kcal/mol) | Interactions | |
|---|---|---|---|
| H-Bond | Others | ||
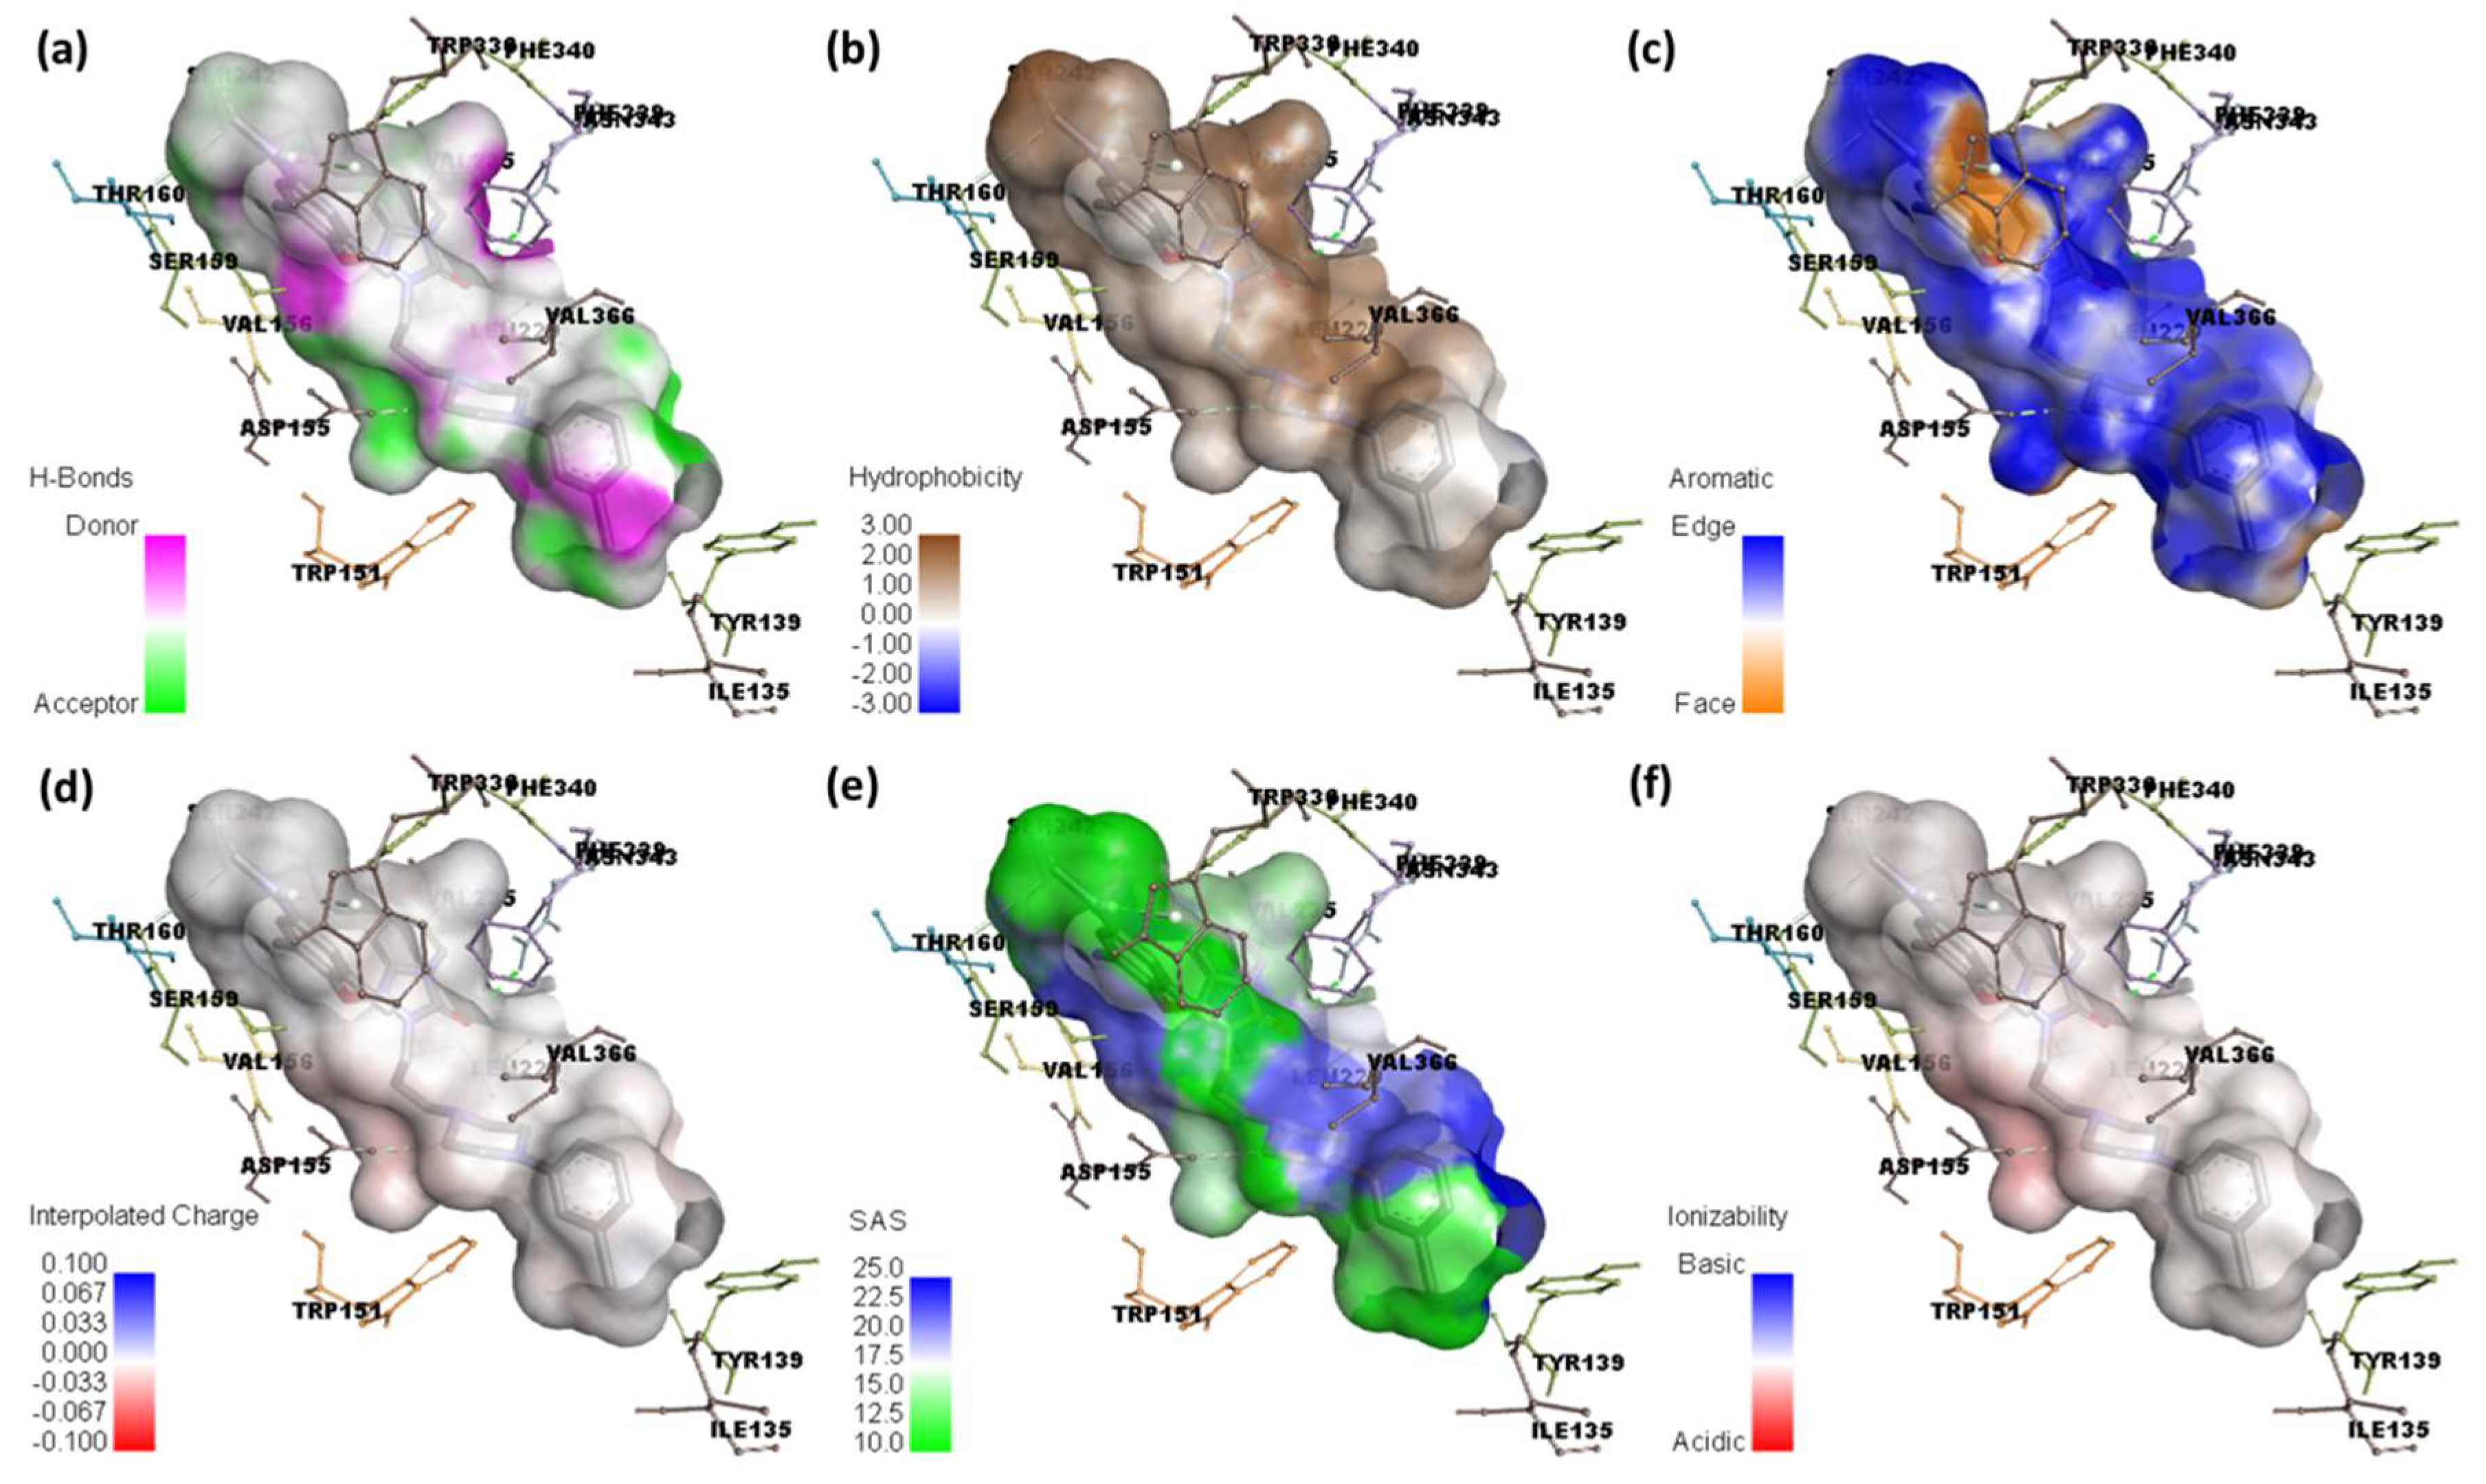
| TZD–DCQ | −8.9 | Asn343 | Trp151, Val235, Val156, Val366, Ile135, Typ139 (π-Alkyl); Phe339, Phe340 (π-π T-shaped); Leu229 (π-Sigma) |
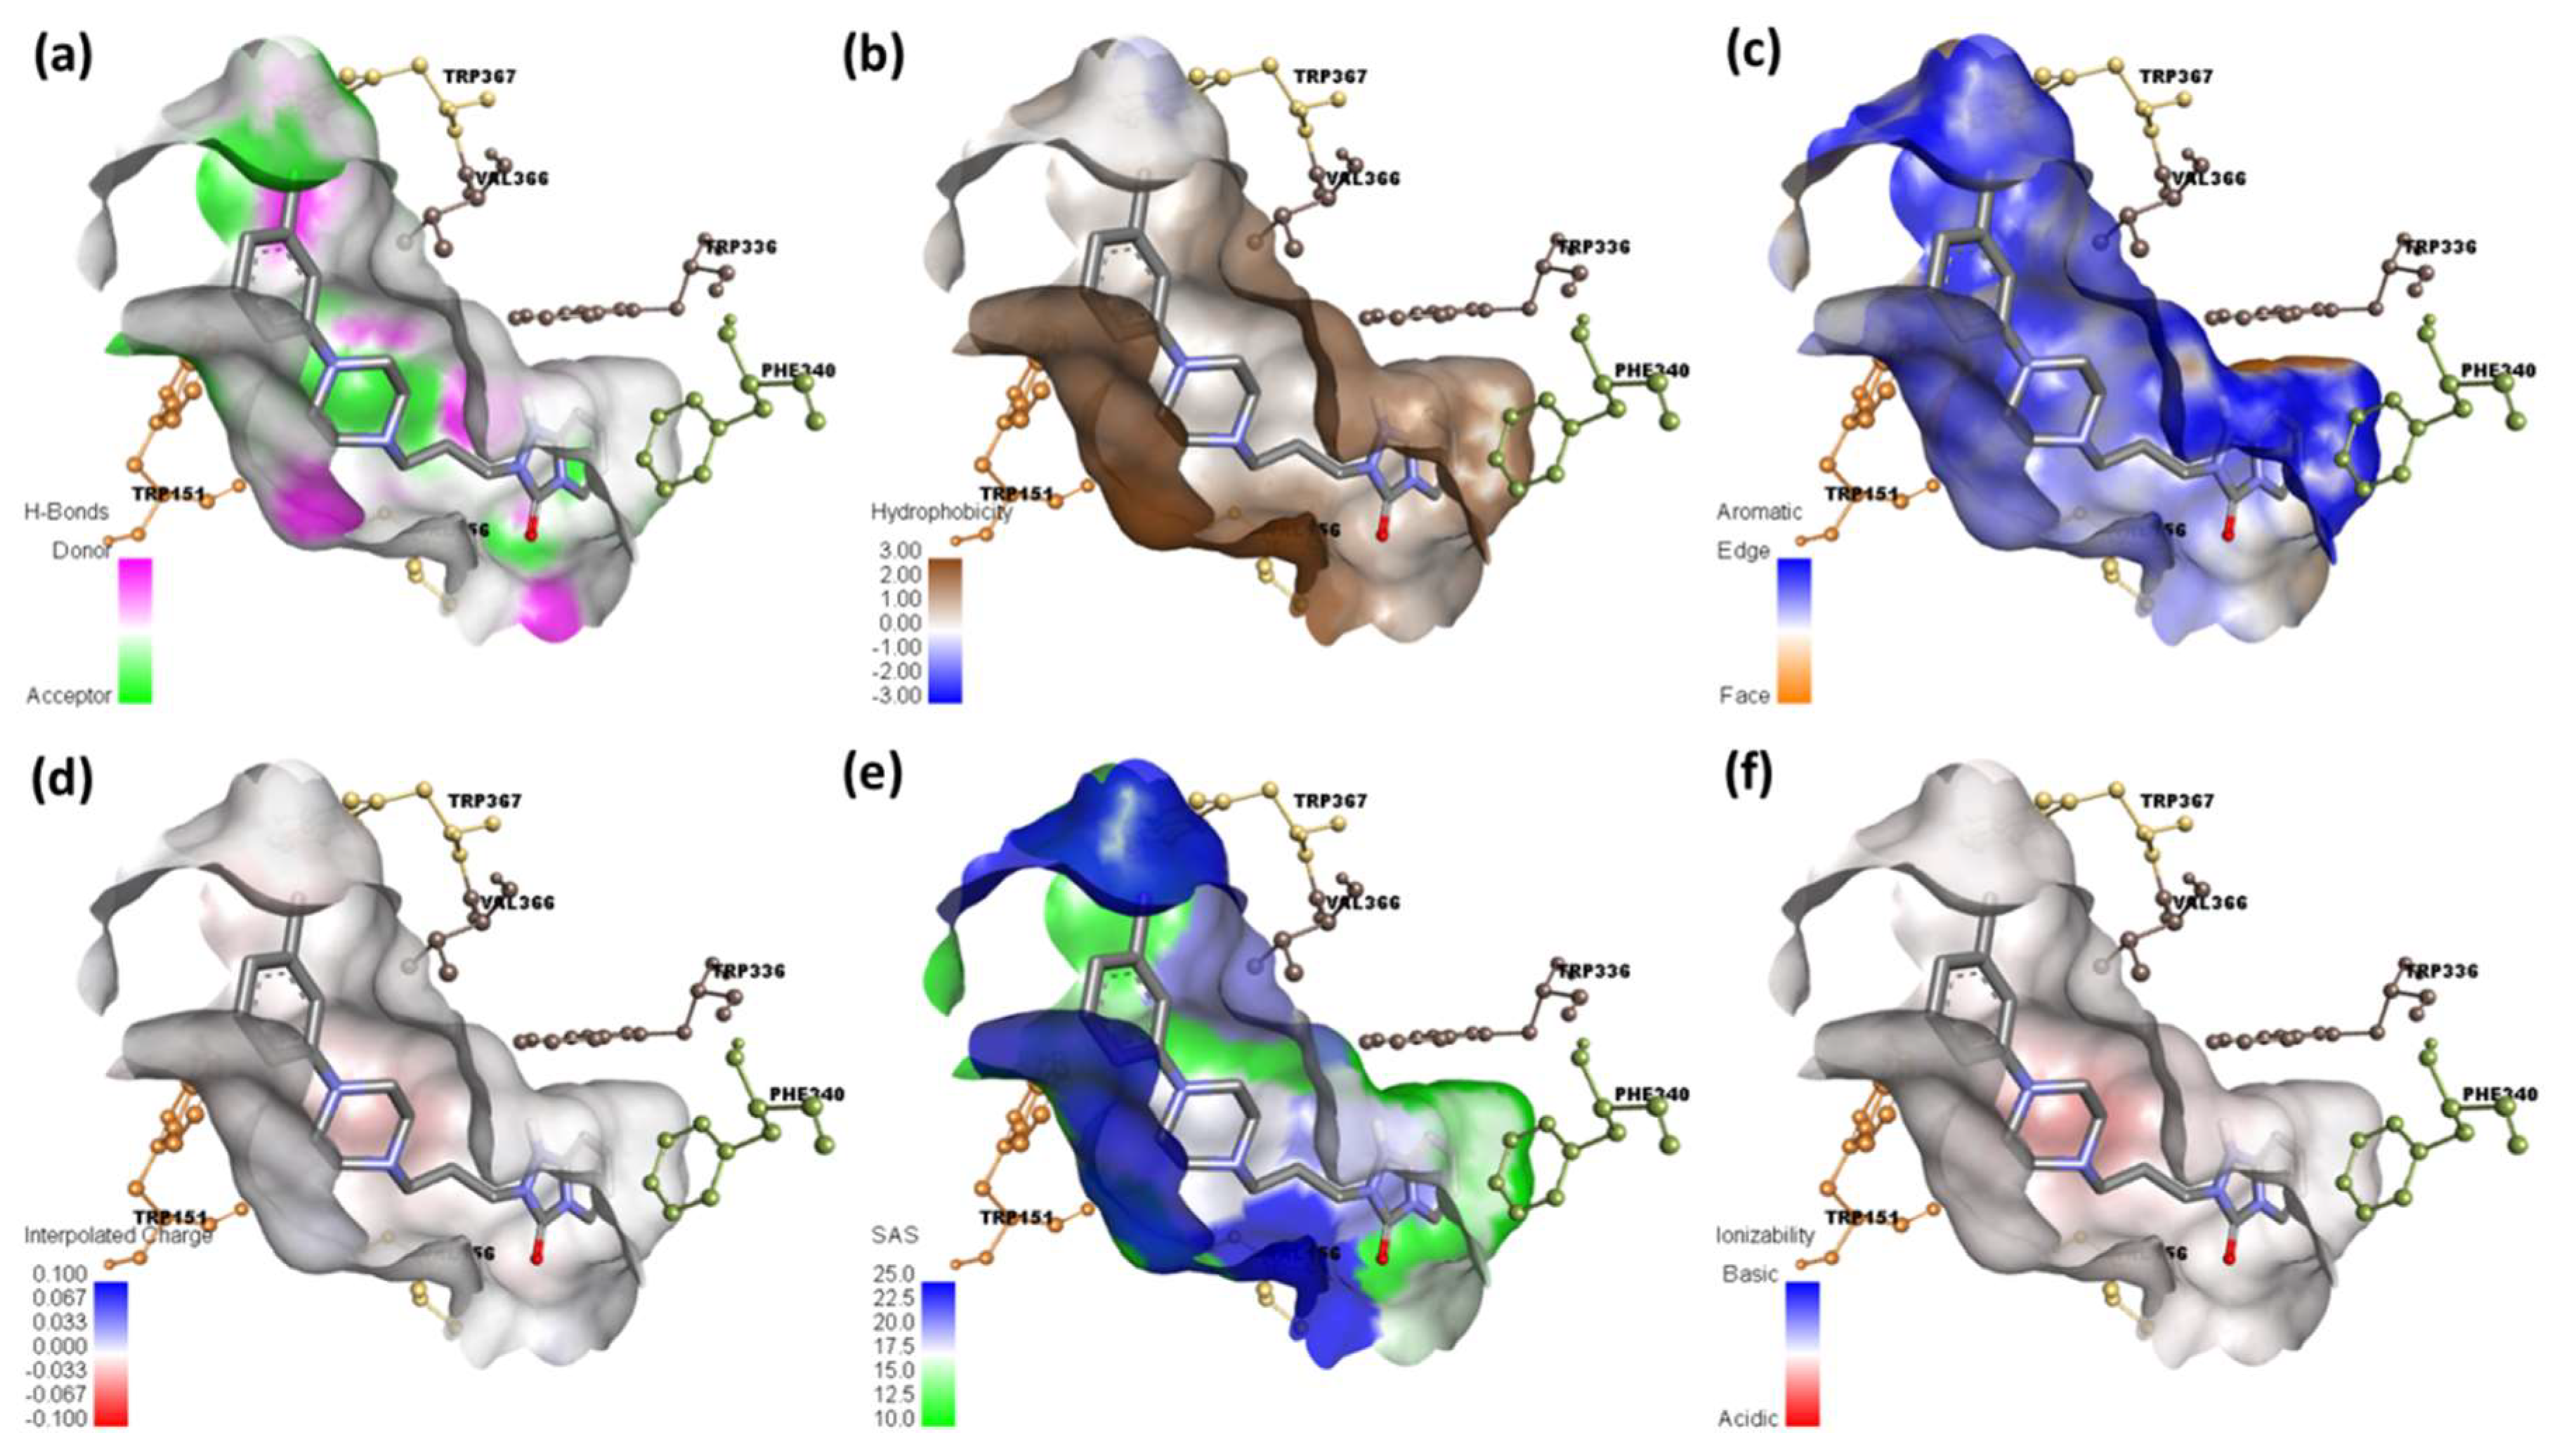
| TZD | −6.5 | Val366, Trp367, Val156 (π-Alkyl); Trp336, Phe340 (π-π T-shaped); Trp151 (π-Sigma) | |
| Parameters | RB3LYP/6-311G++ |
|---|---|
| Minimum SCF energy (a.u.) | −2165.654571 |
| Polarizability (α) (a.u.) | 681.95124751 |
| Dipole Moment (Debye) | 8.124223274 |
| Zero-point vibrational energy (kcal/mol) | 241.2323514 |
| Total thermal energy (kcal/mol) | 198.1235462 |
| Electronic spatial extent (a.u.) | 40,012.12321 |
| Frontier MO energies (eV) | |
| LUMO | −1.2681 |
| HOMO | −5.2676 |
| HOMO-1 | −4.8724 |
| Gap (HOMO–LUMO) | 3.9995 |
| Gap (HOMO-1–LUMO) | 3.6042 |
Publisher’s Note: MDPI stays neutral with regard to jurisdictional claims in published maps and institutional affiliations. |
© 2022 by the authors. Licensee MDPI, Basel, Switzerland. This article is an open access article distributed under the terms and conditions of the Creative Commons Attribution (CC BY) license (https://creativecommons.org/licenses/by/4.0/).
Share and Cite
Alsanie, W.F.; Alhomrani, M.; Alamri, A.S.; Alyami, H.; Shakya, S.; Habeeballah, H.; Alkhatabi, H.A.; Felimban, R.I.; Alamri, A.; Alhabeeb, A.A.; et al. Attempting to Increase the Effectiveness of the Antidepressant Trazodone Hydrochloride Drug Using π-Acceptors. Int. J. Environ. Res. Public Health 2022, 19, 11281. https://doi.org/10.3390/ijerph191811281
Alsanie WF, Alhomrani M, Alamri AS, Alyami H, Shakya S, Habeeballah H, Alkhatabi HA, Felimban RI, Alamri A, Alhabeeb AA, et al. Attempting to Increase the Effectiveness of the Antidepressant Trazodone Hydrochloride Drug Using π-Acceptors. International Journal of Environmental Research and Public Health. 2022; 19(18):11281. https://doi.org/10.3390/ijerph191811281
Chicago/Turabian StyleAlsanie, Walaa F., Majid Alhomrani, Abdulhakeem S. Alamri, Hussain Alyami, Sonam Shakya, Hamza Habeeballah, Heba A. Alkhatabi, Raed I. Felimban, Abdulwahab Alamri, Abdulhameed Abdullah Alhabeeb, and et al. 2022. "Attempting to Increase the Effectiveness of the Antidepressant Trazodone Hydrochloride Drug Using π-Acceptors" International Journal of Environmental Research and Public Health 19, no. 18: 11281. https://doi.org/10.3390/ijerph191811281