

Association between Official Development Assistance for Water and Sanitation and Countries’ Needs from 2002 to 2019

Abstract
:1. Introduction
2. Materials and Methods
2.1. Target Countries
2.2. Data Sources and Definition
2.3. Data Analysis
3. Results
4. Discussion
5. Conclusions
Supplementary Materials
Author Contributions
Funding
Institutional Review Board Statement
Informed Consent Statement
Data Availability Statement
Conflicts of Interest
References
- UN. World General Assembly Resolution 64/292: The Human Right to Water and Sanitation; United Nations: New York, NY, USA, 2010. [Google Scholar]
- UNDP. Beyond Scarcity: Power, Poverty and the Global Water Crisis, Human Development Report; United Nations Development Programme: New York, NY, USA, 2006. [Google Scholar]
- UN. World General Assembly Resolution 70/1: Transforming Our World: The 2030 Agenda for Sustainable Development; United Nations: New York, NY, USA, 2015. [Google Scholar]
- Perin, J.; Mulick, A.; Yeung, D.; Villavicencio, F.; Lopez, G.; Strong, K.L.; Prieto-Merino, D.; Cousens, S.; Black, R.E.; Liu, L. Global, regional, and national causes of under-5 mortality in 2000-19: An updated systematic analysis with implications for the Sustainable Development Goals. Lancet Child Adolesc. Health 2022, 6, 106–115. [Google Scholar] [CrossRef]
- Zhang, Y.; Jiang, H.; Bian, K.; Wang, H.; Wang, C. A critical review of control and removal strategies for microplastics from aquatic environments. J. Environ. Chem. Eng. 2021, 9, 105463. [Google Scholar] [CrossRef]
- Wang, C.; Huang, R.; Sun, R.; Yang, J.; Sillanpää, M. A review on persulfates activation by functional biochar for organic contaminants removal: Synthesis, characterizations, radical determination, and mechanism. J. Environ. Chem. Eng. 2021, 9, 106267. [Google Scholar] [CrossRef]
- Prüss-Ustün, A.; Bartram, J.; Clasen, T.; Colford, J.M., Jr.; Cumming, O.; Curtis, V.; Bonjour, S.; Dangour, A.D.; de France, J.; Fewtrell, L.; et al. Burden of disease from inadequate water, sanitation and hygiene in low- and middle-income settings: A retrospective analysis of data from 145 countries. Trop. Med. Int. Health 2014, 19, 894–905. [Google Scholar] [CrossRef] [PubMed]
- Walker, C.L.F.; Rudan, I.; Liu, L.; Nair, H.; Theodoratou, E.; Bhutta, Z.A.; O’Brien, K.L.; Campbell, H.; Black, R.E. Global burden of childhood pneumonia and diarrhoea. Lancet 2013, 381, 1405–1416. [Google Scholar] [CrossRef]
- WHO. Progress on Drinking Water, Sanitation and Hygiene: 2017 Update and SDG Baselines; World Health Organization: Geneva, Switzerland, 2017. [Google Scholar]
- WHO/UNICEF. Progress on Sanitation and Drinking Water—2015 Update and MDG Assessment; World Health Organization & United Nations Children’s Fund: Geneva, Switzerland, 2015. [Google Scholar]
- WHO/UNICEF. Progress on Household Drinking Water, Sanitation and Hygiene 2000–2020: Five Years into the SDGs; World Health Organization & United Nations Children’s Fund: Geneva, Switzerland, 2021. [Google Scholar]
- WHO/UNICEF. Financing Water and Sanitation in Developing Countries—Key Trends and Figures; World Health Organization & United Nations Children’s Fund: Geneva, Switzerland, 2017. [Google Scholar]
- WHO/UNICEF. Progress on Sanitation and Drinking Water: 2014 Update; World Health Organization & United Nations Children’s Fund: Geneva, Switzerland, 2014. [Google Scholar]
- WHO. Water, Sanitation, Hygiene and Health: A Primer for Health Professionals; World Health Organization: Geneva, Switzerland, 2019. [Google Scholar]
- OECD. Creditor Reporting System; Organisation for Economic Co-Operation and Development: Paris, France, 2022. Available online: https://stats.oecd.org/Index.aspx?DataSetCode=CRS1/ (accessed on 25 August 2022).
- OECD. Financing a Water Secure Future; Organisation for Economic Co-Operation and Development: Paris, France, 2022. [Google Scholar]
- SWA. Sanitation and Water for All: Annual Report 2021; Sanitation and Water for All: New York, NY, USA, 2022. [Google Scholar]
- UN. The Sustainable Development Goals Report 2021; United Nations: New York, NY, USA, 2021. [Google Scholar]
- WHO. WHO Global Water, Sanitation and Hygiene: Annual Report 2019; World Health Organization: Geneva, Switzerland, 2020. [Google Scholar]
- WHO. WHO Global Water, Sanitation and Hygiene: Annual Report 2018; World Health Organization: Geneva, Switzerland, 2019. [Google Scholar]
- WHO. Water, Sanitation and Hygiene Strategy 2018–2025; World Health Organization: Geneva, Switzerland, 2018. [Google Scholar]
- Roche, R.; Bain, R.; Cumming, O. A long way to go—Estimates of combined water, sanitation and hygiene coverage for 25 sub-Saharan African countries. PLoS ONE 2017, 12, e0171783. [Google Scholar] [CrossRef]
- Botting, M.J.; Porbeni, E.O.; Joffres, M.R.; Johnston, B.C.; Black, R.E.; Mills, E.J. Water and sanitation infrastructure for health: The impact of foreign aid. Glob. Health 2010, 6, 12. [Google Scholar] [CrossRef] [PubMed]
- Local Burden of Disease WaSH Collaborators. Mapping geographical inequalities in access to drinking water and sanitation facilities in low-income and middle-income countries, 2000–2017. Lancet Glob. Health 2020, 8, e1162–e1185. [Google Scholar] [CrossRef]
- Cha, S.; Mankadi, P.M.; Elhag, M.S.; Lee, Y.; Jin, Y. Trends of improved water and sanitation coverage around the globe between 1990 and 2010: Inequality among countries and performance of official development assistance. Glob. Health Action 2017, 10, 1327170. [Google Scholar] [CrossRef] [PubMed]
- WHO/UNICEF. Joint Monitoring Programme (JMP) for Water Supply and Sanitation Database; World Health Organization & United Nations Children’s Fund: Geneva, Switzerland, 2022. Available online: https://washdata.org/data (accessed on 25 August 2022).
- WHO/UNICEF. Safely Managed Drinking Water: Thematic Report on Drinking Water 2017; World Health Organization & United Nations Children’s Fund: Geneva, Switzerland, 2017. [Google Scholar]
- WHO/UNICEF. An Urgent Call to Transform Sanitation for Better Health, Environments, Economies and Societies; World Health Organization & United Nations Children’s Fund: Geneva, Switzerland, 2020. [Google Scholar]
- World Bank Group. World Bank Development Indicators; World Bank: Washington, DC, USA, 2021. Available online: https://data.worldbank.org/indicator/SH.HIV.INCD.TL.P3 (accessed on 25 August 2022).
- World Bank Group. World Population Indicators; World Bank: Washington, DC, USA, 2021. Available online: https://data.worldbank.org/indicator/SP.POP.TOTL (accessed on 25 August 2022).
- GBD 2019 Universal Health Coverage Collaborators. Measuring universal health coverage based on an index of effective coverage of health services in 204 countries and territories, 1990–2019: A systematic analysis for the Global Burden of Disease Study 2019. Lancet 2020, 396, 1250–1284. [Google Scholar] [CrossRef]
- UN. The Sustainable Development Goals Report 2020; United Nations: New York, NY, USA, 2020. [Google Scholar]
- The Lancet Public Health. Will the COVID-19 pandemic threaten the SDGs? Lancet Public Health 2020, 5, e460. [CrossRef]
- Global Burden of Disease 2020 Health Financing Collaborator Network. Tracking development assistance for health and for COVID-19: A review of development assistance, government, out-of-pocket, and other private spending on health for 204 countries and territories, 1990–2050. Lancet 2021, 398, 1317–1343. [Google Scholar] [CrossRef]
- Ooms, G.; Decoster, K.; Miti, K.; Rens, S.; van Leemput, L.; Vermeiren, P.; van Damme, W. Crowding out: Are relations between international health aid and government health funding too complex to be captured in averages only? Lancet 2010, 375, 1403–1405. [Google Scholar] [CrossRef]
- Commissioners of the Lancet Commission on Water, Sanitation and Hygiene, and Health. The Lancet Commission on water, sanitation and hygiene, and health. Lancet 2021, 398, 1469–1470. [Google Scholar] [CrossRef]


| Year | 2002 | 2003 | 2004 | 2005 | 2006 | 2007 | 2008 | 2009 | - | - | |
|---|---|---|---|---|---|---|---|---|---|---|---|
| OECD CRS Code a | |||||||||||
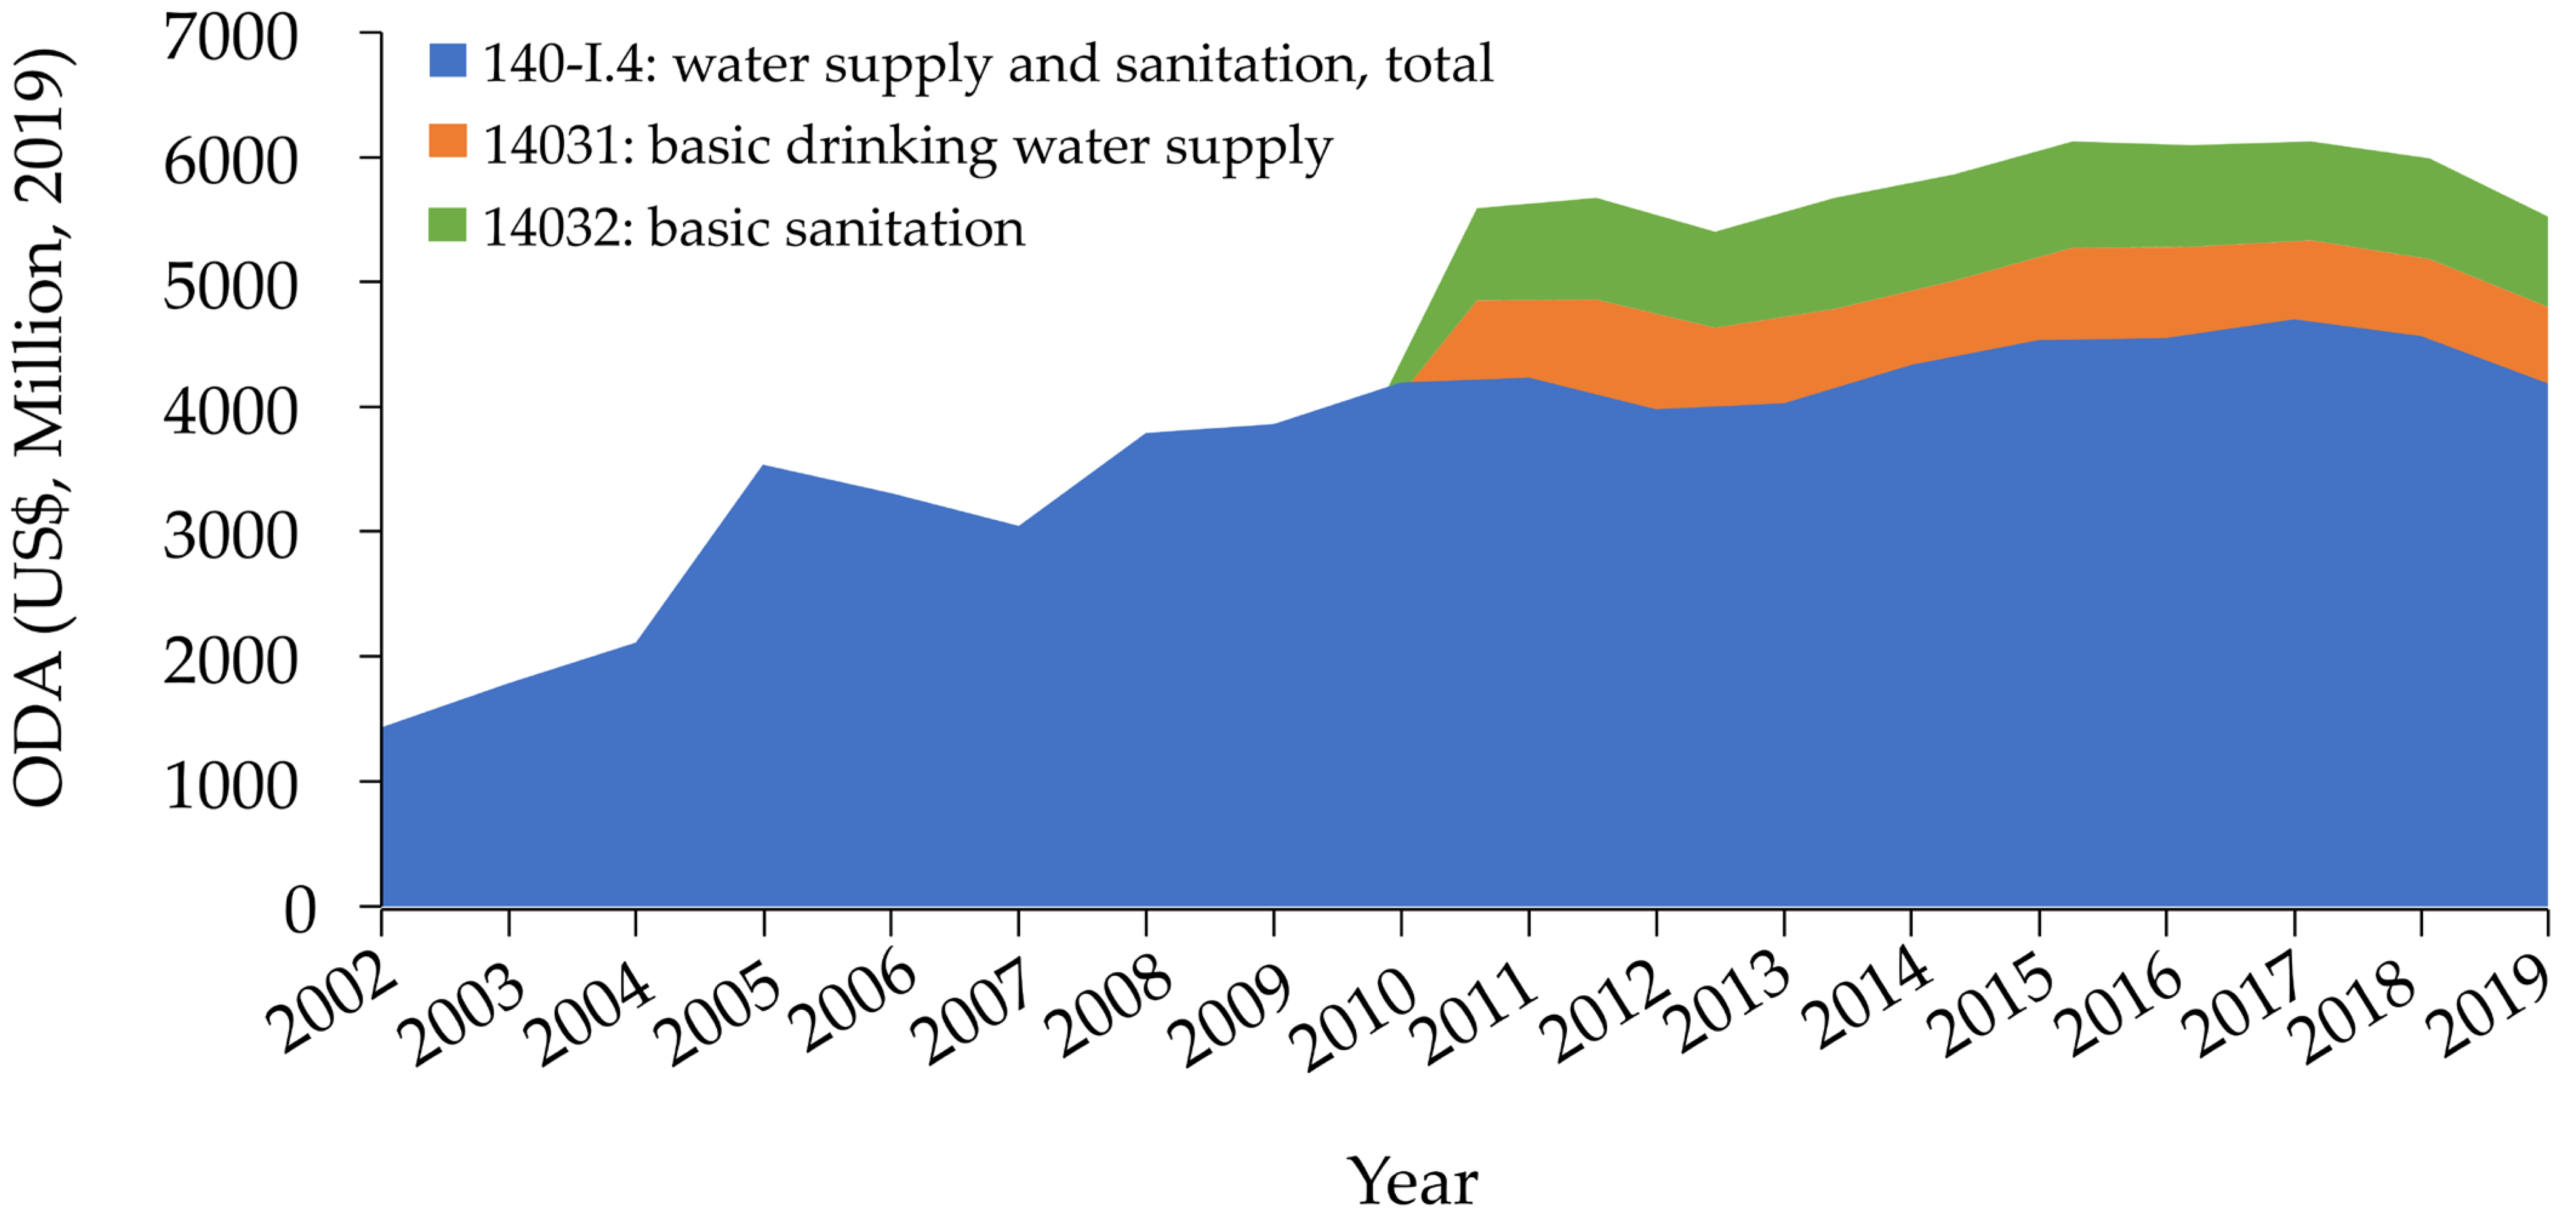
| ODA b for water supply and sanitation, total (CRS code:140-I.4) c | 1359 | 1695 | 2006 | 3362 | 3144 | 2900 | 3610 | 3677 | |||
| Annual growth rate (%) | 24.7 | 18.3 | 67.6 | −6.5 | −7.7 | 24.5 | 1.9 | ||||
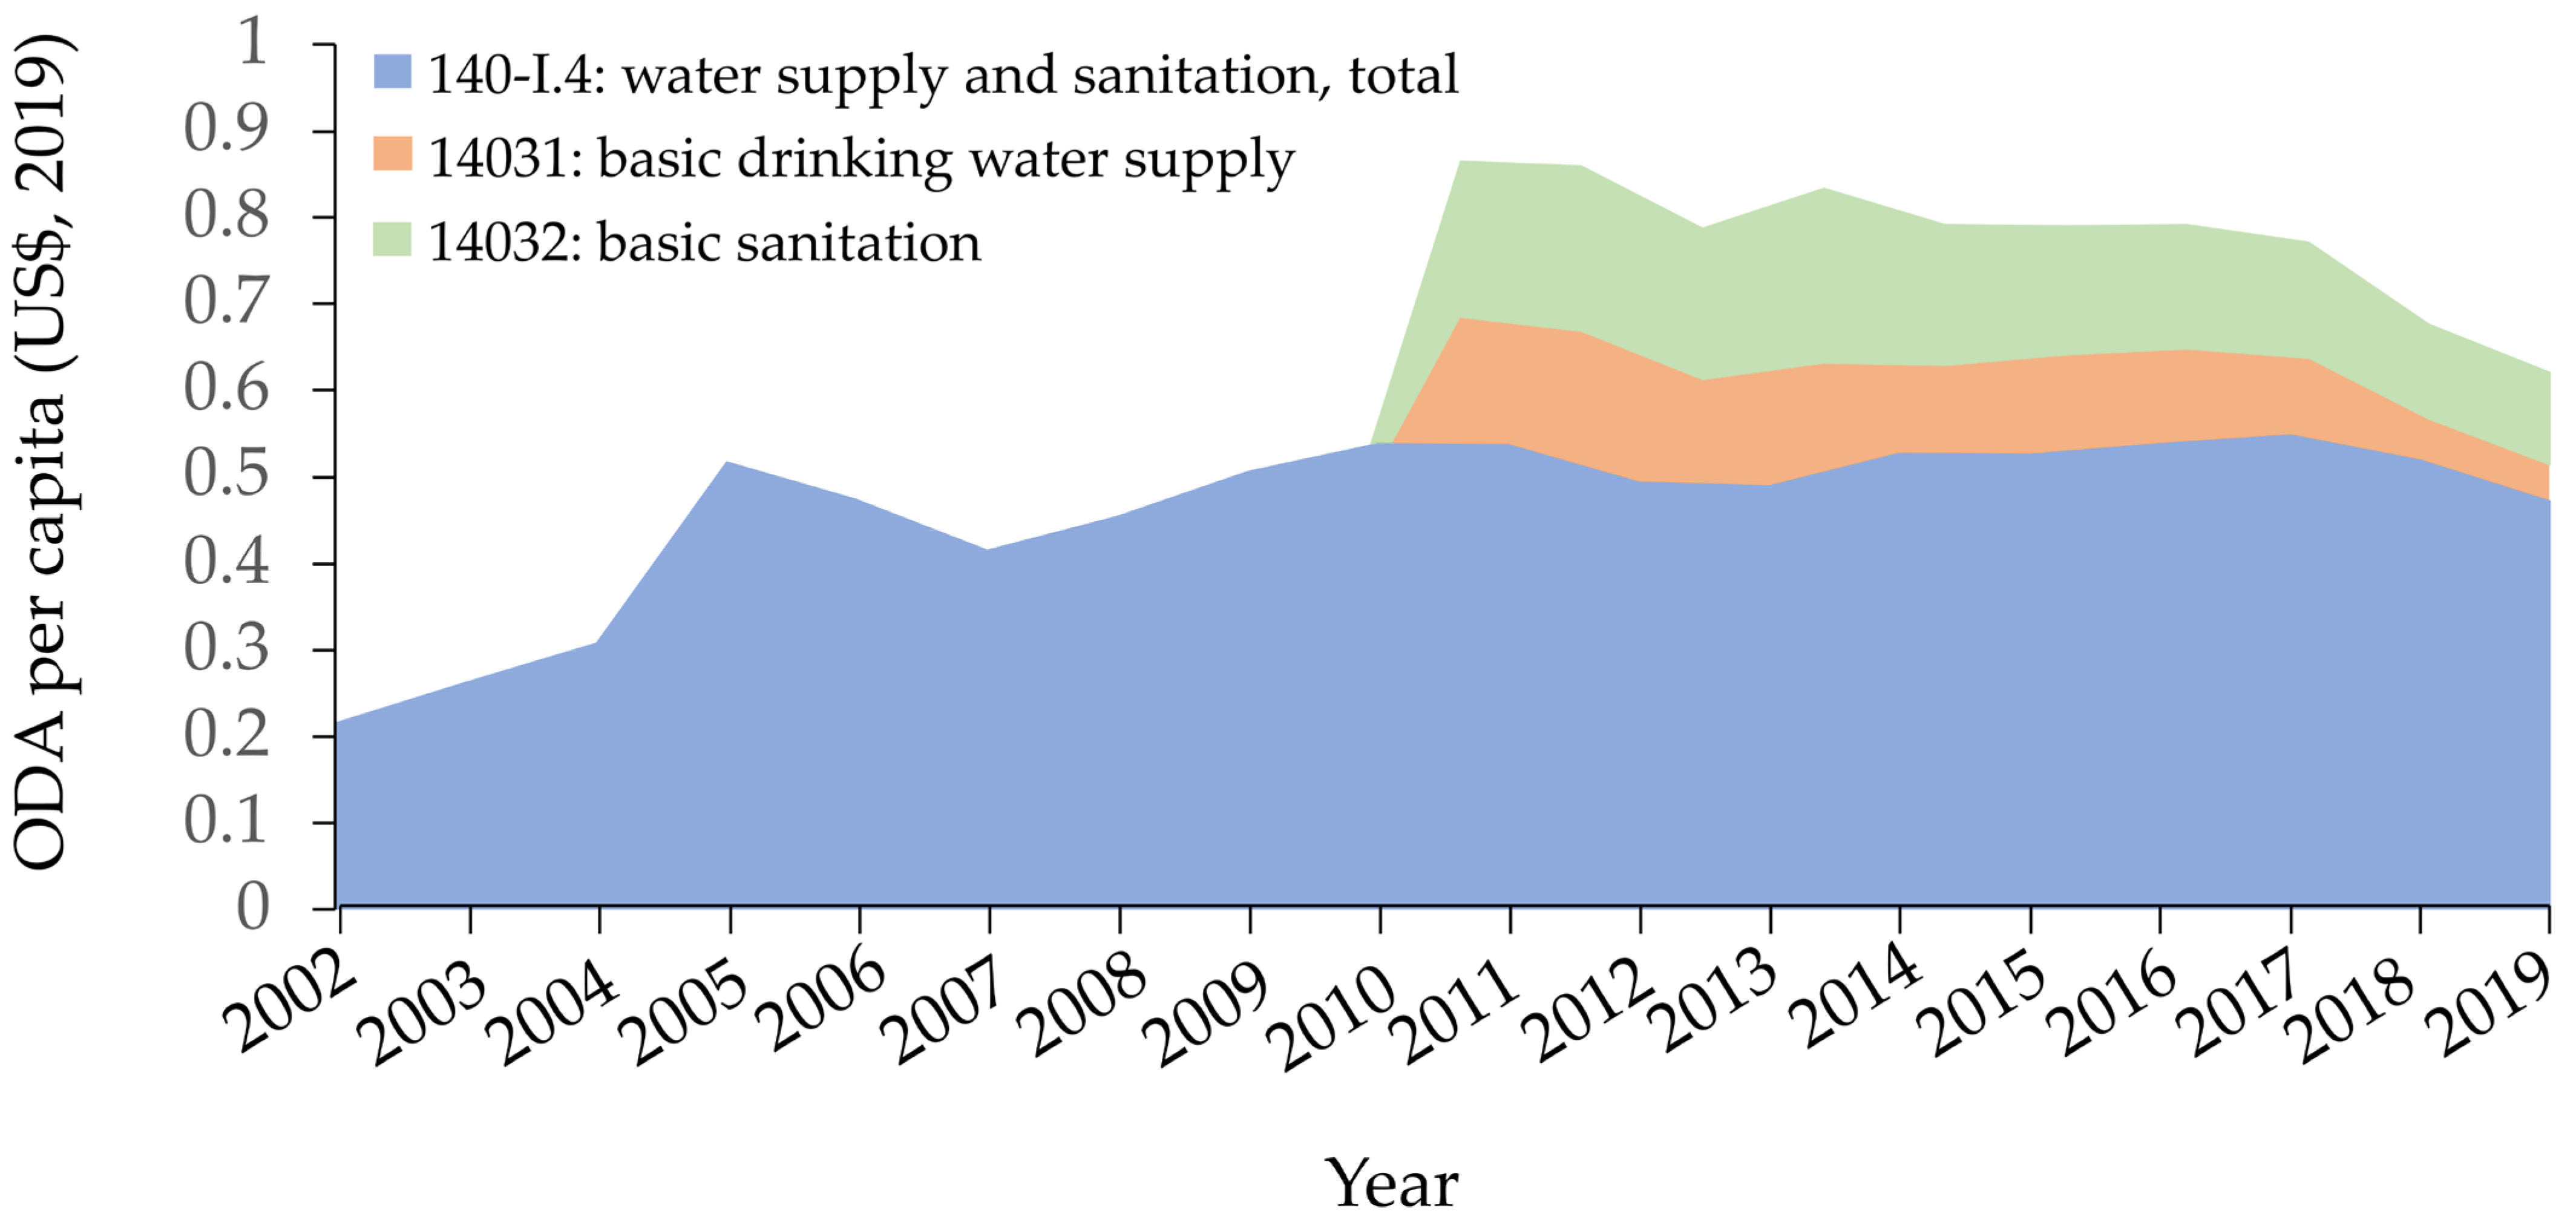
| ODA per capita for water supply and sanitation, total d | 0.216 | 0.263 | 0.309 | 0.517 | 0.475 | 0.416 | 0.455 | 0.507 | |||
| Annual growth rate (%) | 21.6 | 17.6 | 67.2 | −8.1 | −12.3 | 9.2 | 11.4 | ||||
| Year | 2010 | 2011 | 2012 | 2013 | 2014 | 2015 | 2016 | 2017 | 2018 | 2019 | |
| OECD CRS code | |||||||||||
| ODA for water supply and sanitation, total (CRS code:140-I.4) | 3990 | 4030 | 3790 | 3836 | 4125 | 4317 | 4336 | 4470 | 4349 | 3984 | |
| Annual growth rate (%) | 8.5 | 1.0 | −6.0 | 1.2 | 7.5 | 4.7 | 0.4 | 3.1 | −2.7 | −8.4 | |
| ODA per capita for water supply and sanitation, total | 0.539 | 0.538 | 0.496 | 0.490 | 0.529 | 0.527 | 0.539 | 0.550 | 0.520 | 0.473 | |
| Annual growth rate (%) | 6.3 | −0.2 | −7.7 | −1.1 | 7.8 | −0.2 | 2.2 | 2.0 | −5.4 | −9.0 | |
| ODA for basic drinking water supply (CRS code:14031) | 860 | 833 | 838 | 944 | 882 | 956 | 943 | 858 | 829 | 812 | |
| Annual growth rate (%) | −3.1 | 0.6 | 12.6 | −6.6 | 8.3 | −1.3 | −8.9 | −3.3 | −2.1 | ||
| ODA per capita for basic drinking water supply | 0.177 | 0.165 | 0.162 | 0.183 | 0.142 | 0.153 | 0.147 | 0.127 | 0.099 | 0.104 | |
| Annual growth rate (%) | −6.6 | −2.0 | 12.6 | −21.9 | 7.5 | −3.8 | −13.8 | −21.7 | 4.9 | ||
| ODA for basic sanitation (CRS code:14032) | 740 | 811 | 777 | 888 | 851 | 848 | 816 | 797 | 815 | 722 | |
| Annual growth rate (%) | 9.6 | −4.2 | 14.3 | −4.2 | −0.2 | −3.8 | −2.2 | 2.1 | −11.3 | ||
| ODA per capita for basic sanitation | 0.148 | 0.157 | 0.143 | 0.166 | 0.133 | 0.122 | 0.118 | 0.112 | 0.091 | 0.087 | |
| Annual growth rate (%) | 5.8 | −8.6 | 15.8 | −19.6 | −8.2 | −3.4 | −5.3 | −18.5 | −4.5 | ||
| Regression Model | |||||
|---|---|---|---|---|---|
| Dependent | Independent | Coefficient | 95% CI | p | R2 |
| ln (ODA per capita) | Water and sanitation coverage | ||||
| water and sanitation, 2002 | At least basic, 2002 | 0.003 | 0.001, 0.006 | 0.04 | 0.041 |
| water and sanitation, 2010 | At least basic, 2010 | 0.002 | −0.001, 0.005 | 0.12 | 0.028 |
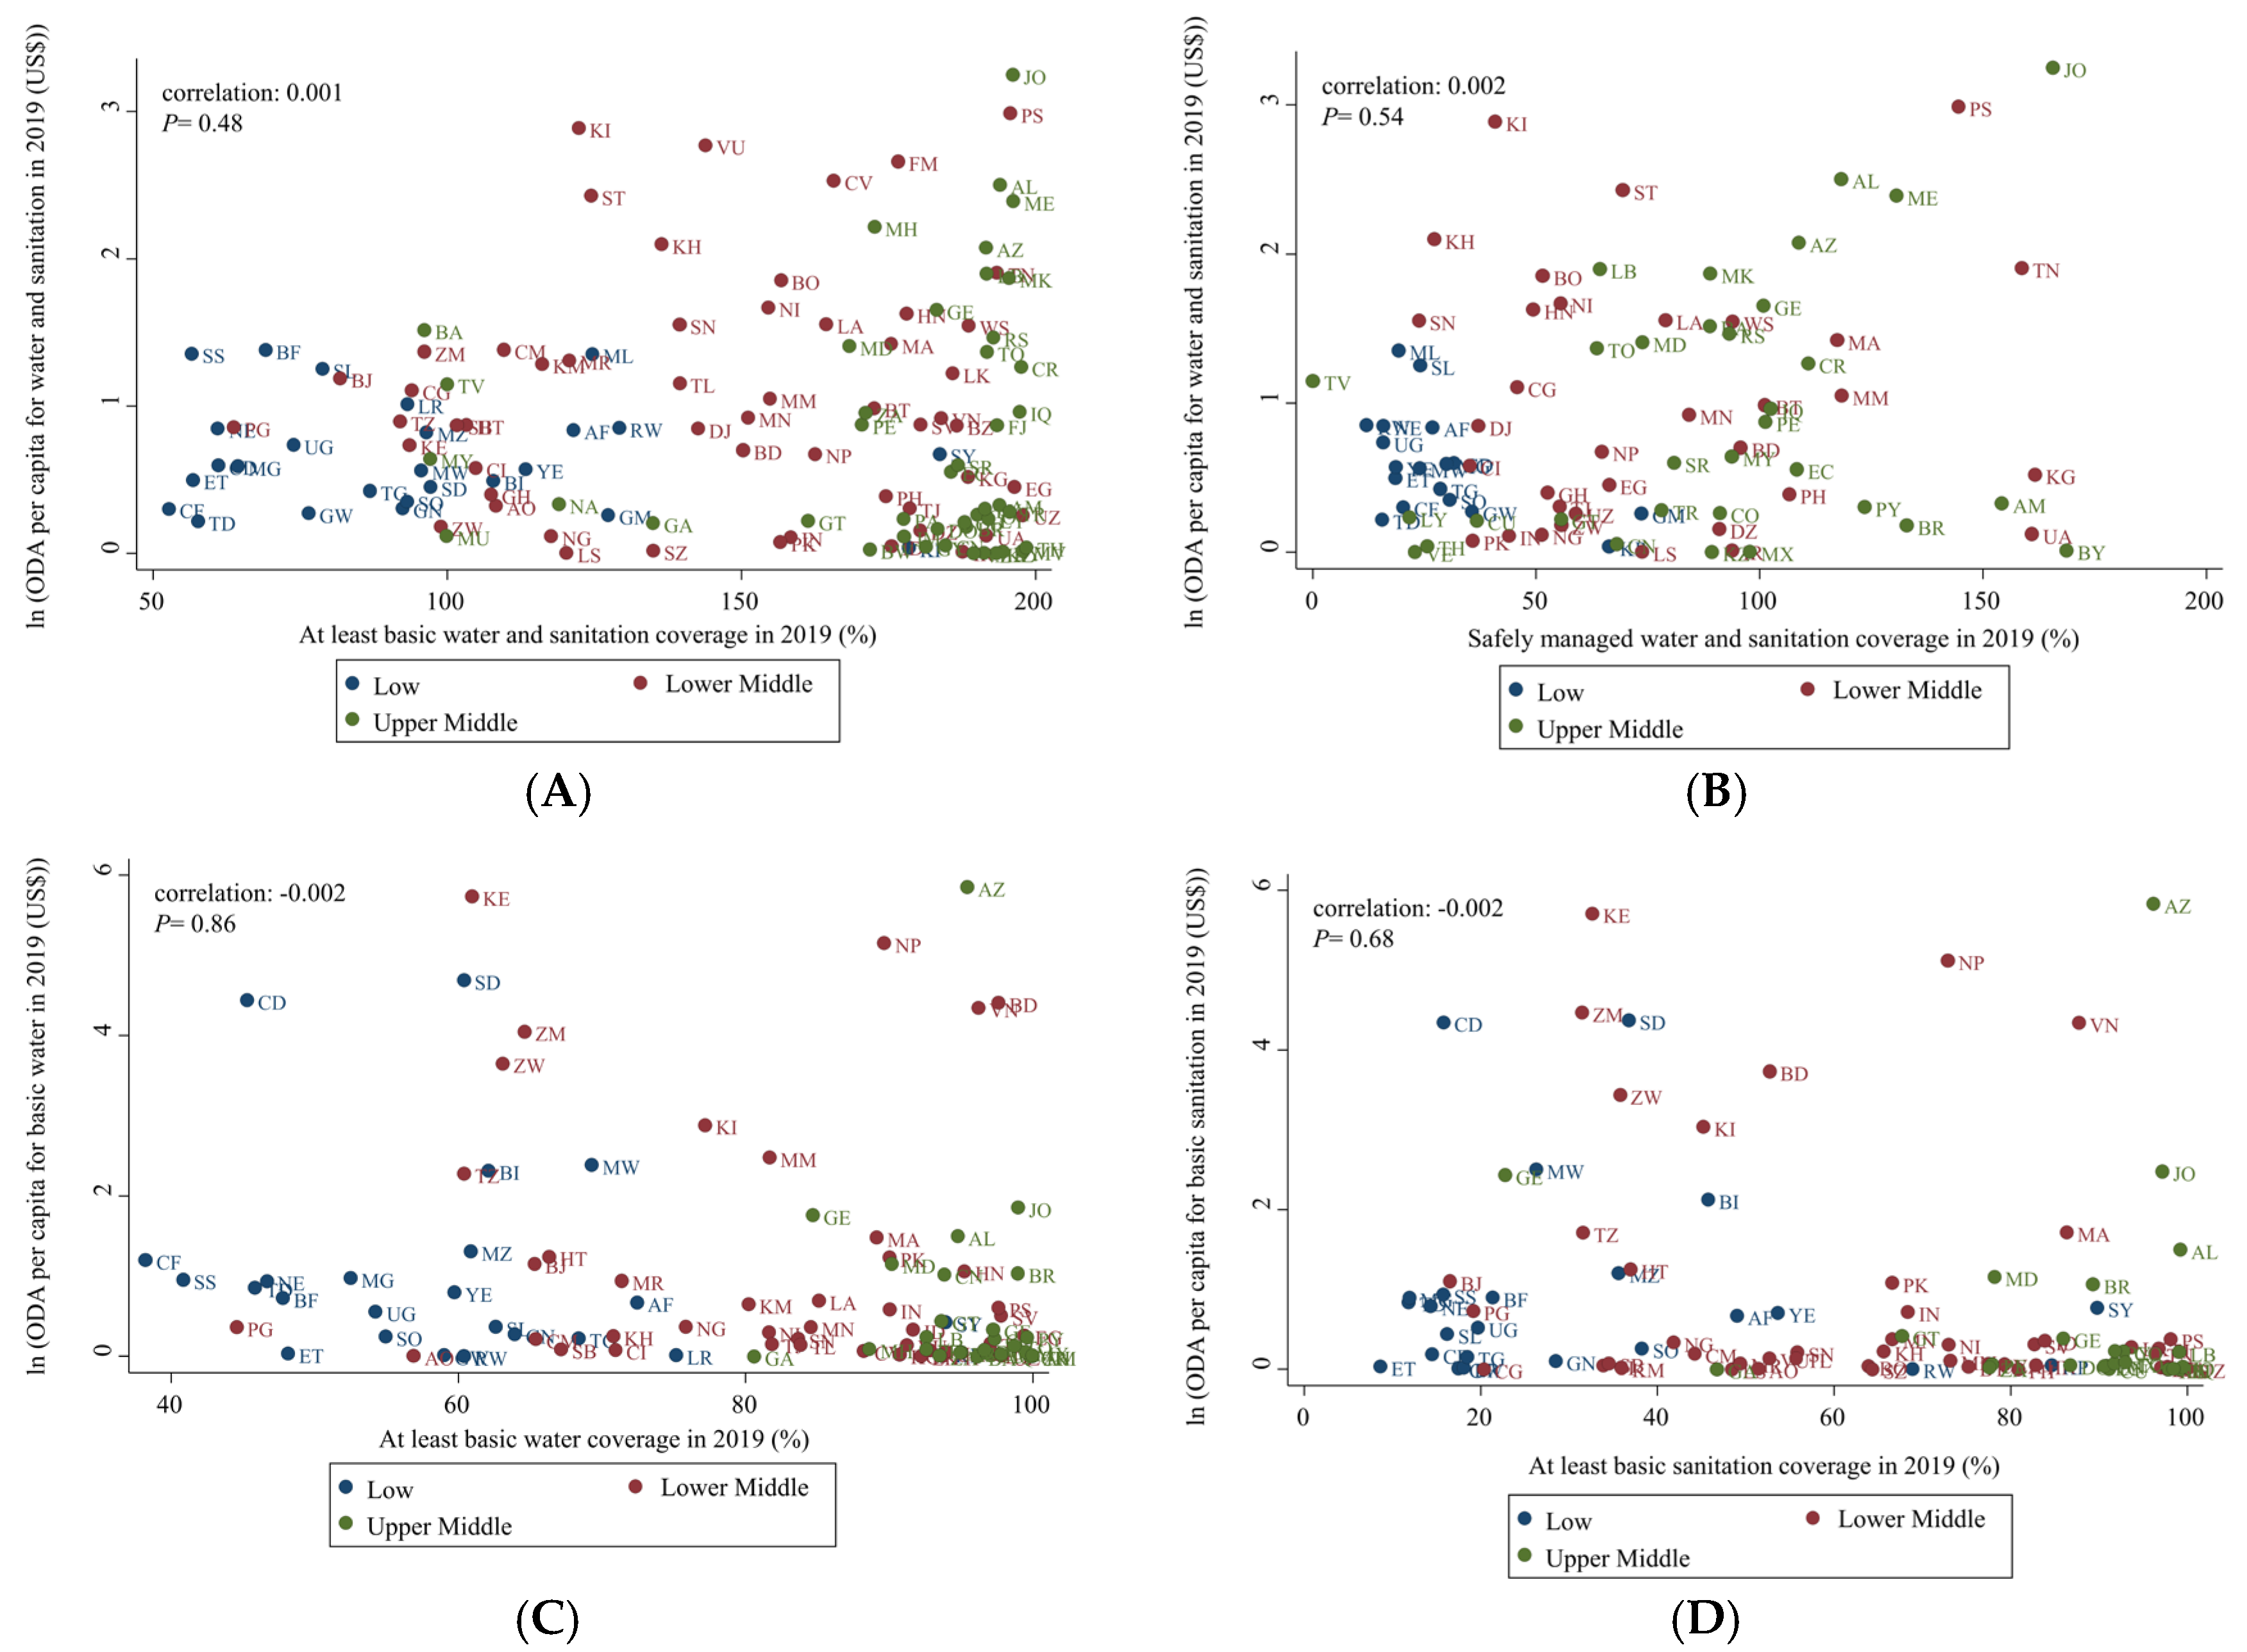
| water and sanitation, 2019 | At least basic, 2019 | 0.001 | −0.002, 0.005 | 0.48 | 0.025 |
| water and sanitation, 2002 | Safely managed, 2002 | 0.002 | −0.003, 0.006 | 0.52 | 0.012 |
| water and sanitation, 2010 | Safely managed, 2010 | 0.005 | 0.001, 0.009 | 0.03 | 0.063 |
| water and sanitation, 2019 | Safely managed, 2019 | 0.002 | −0.003, 0.007 | 0.54 | 0.085 |
| ln (ODA per capita, basic) | Water coverage | ||||
| basic water, 2010 | At least basic, 2010 | −0.001 | −0.016, 0.013 | 0.87 | 0.001 |
| basic water, 2019 | At least basic, 2019 | −0.002 | −0.025, 0.019 | 0.81 | 0.059 |
| basic water, 2010 | Safely managed, 2010 | −0.001 | −0.018, 0.017 | 0.96 | 0.001 |
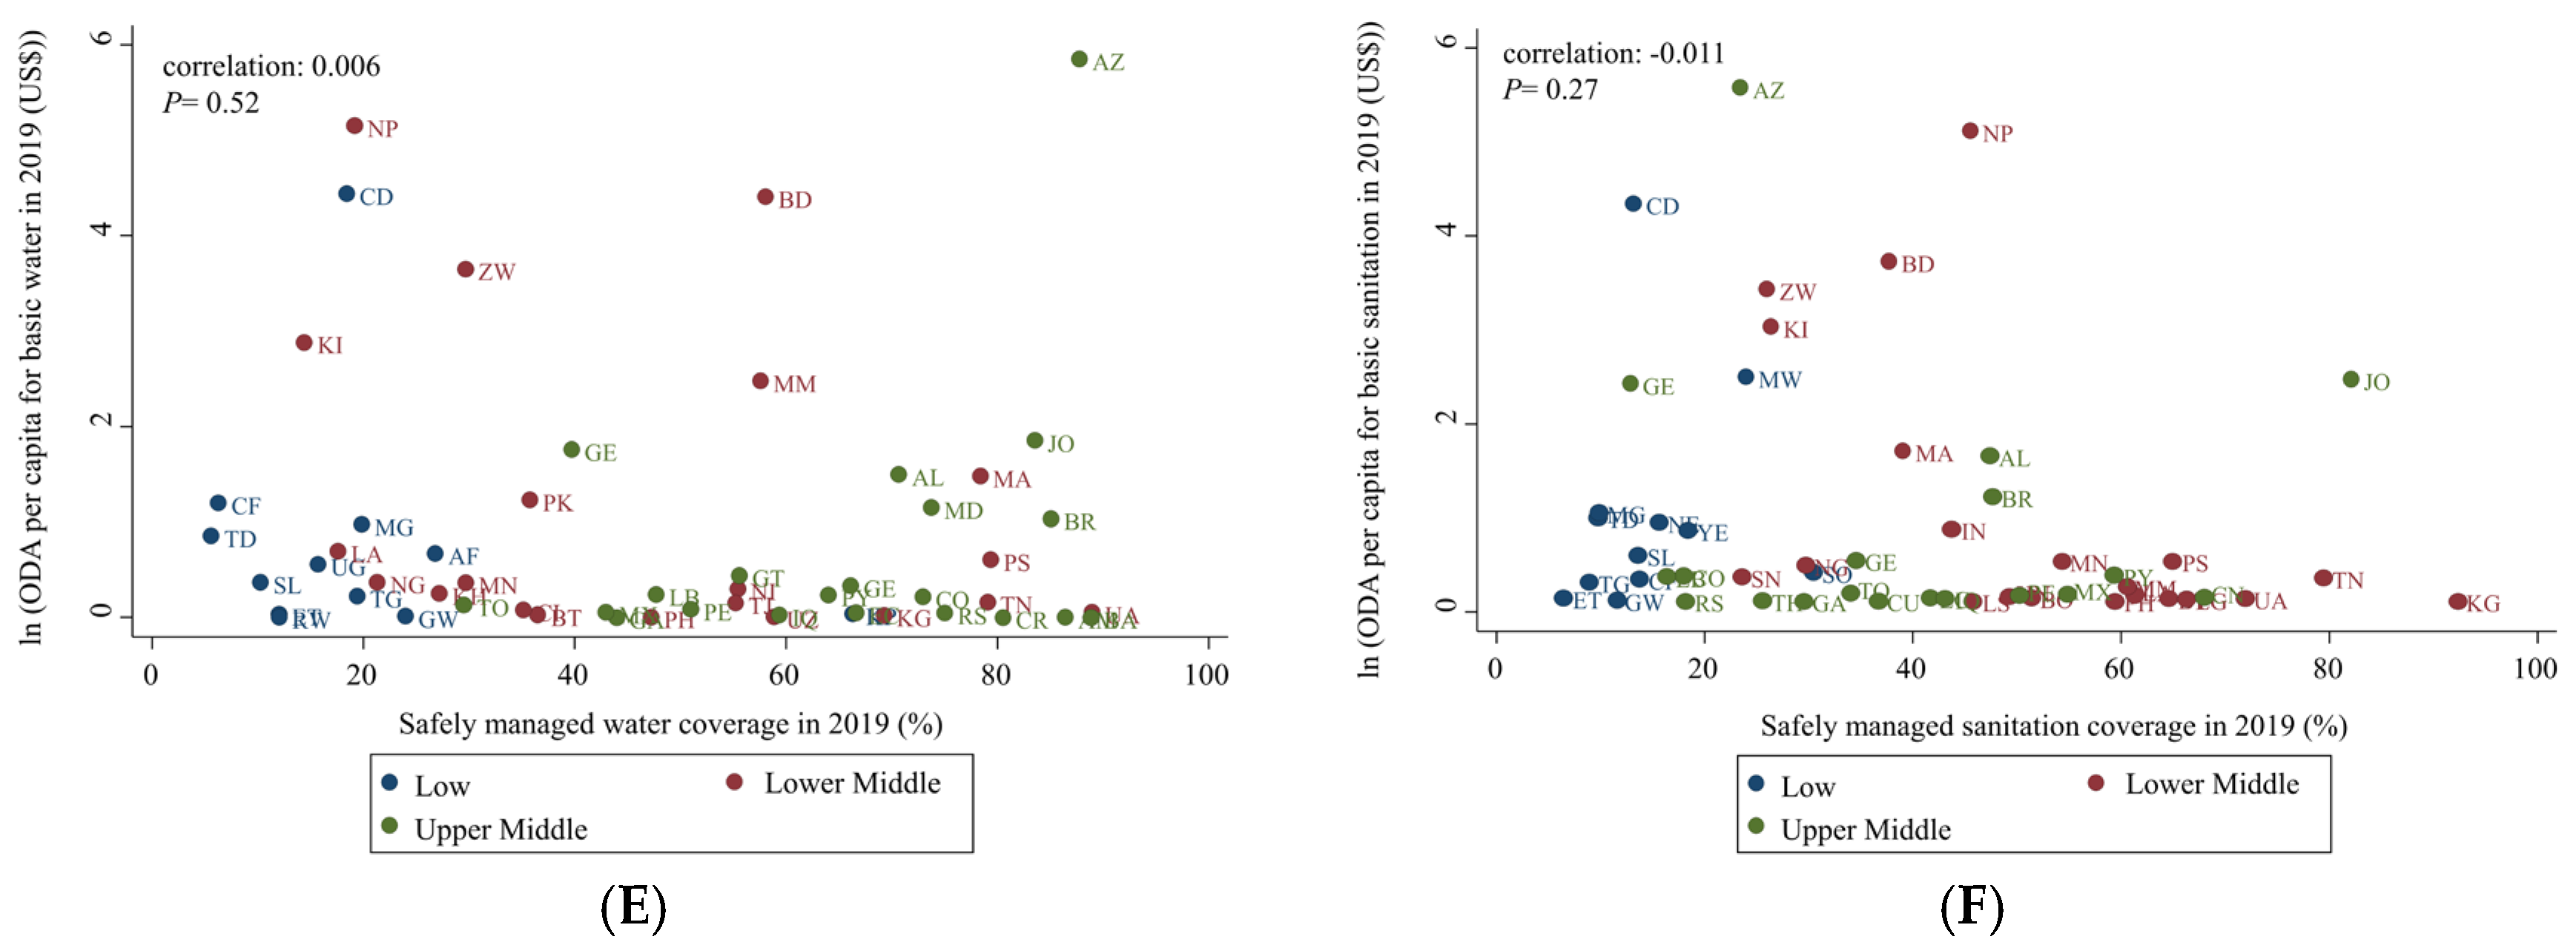
| basic water, 2019 | Safely managed, 2019 | 0.006 | −0.012, 0.024 | 0.53 | 0.052 |
| ln (ODA per capita, basic) | Sanitation coverage | ||||
| basic sanitation, 2010 | At least basic, 2010 | −0.005 | −0.015, 0.003 | 0.24 | 0.016 |
| basic sanitation, 2019 | At least basic, 2019 | −0.002 | −0.016, 0.011 | 0.68 | 0.041 |
| basic sanitation, 2010 | Safely managed, 2010 | 0.002 | −0.019, 0.024 | 0.79 | 0.002 |
| basic sanitation, 2019 | Safely managed, 2019 | −0.011 | −0.031, 0.008 | 0.28 | 0.061 |
| Covariate: GNI per capita; ODA = official development assistance | |||||
| ODA Targeting, MDGs to SDGs | |||||
|---|---|---|---|---|---|
| Dependent | Independent | Coefficient | 95% CI | P | R2 |
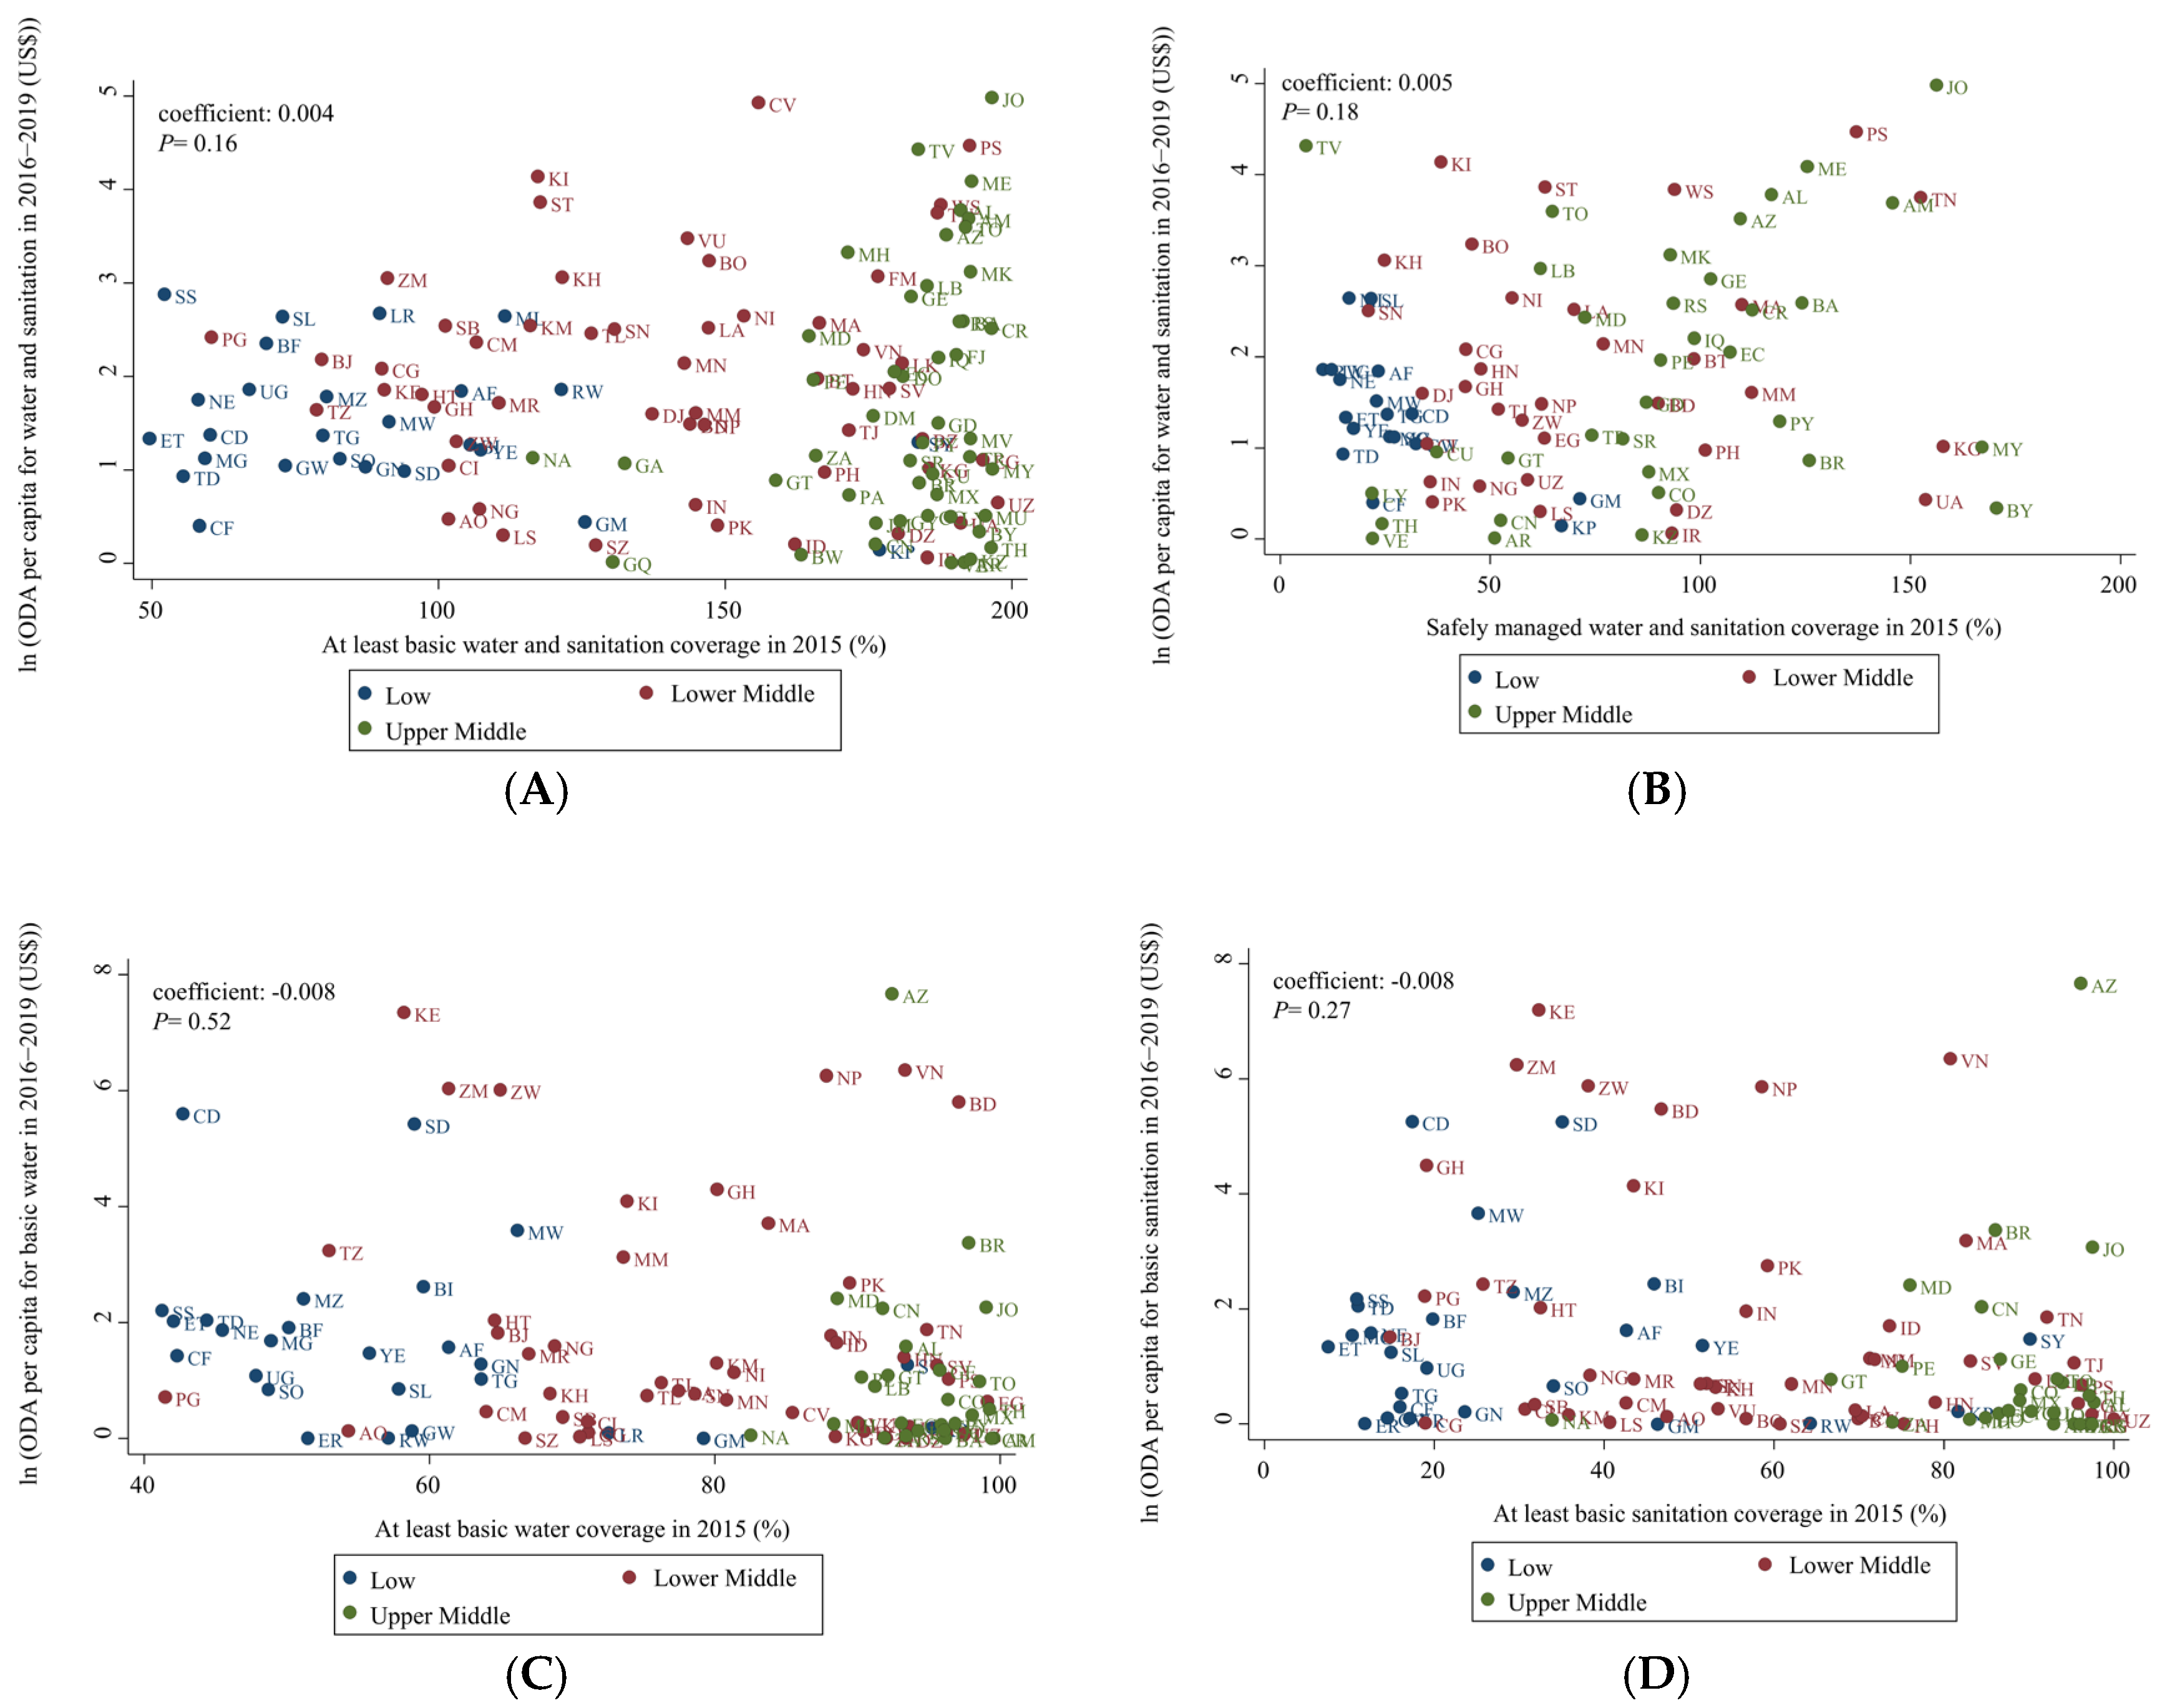
| ln (ODA per capita for water and sanitation), 2016–2019 | At least basic water and sanitation coverage, GNI per capita, 2015 | 0.004 | −0.001, 0.011 | 0.16 | 0.016 |
| ln (ODA per capita for water and sanitation), 2016–2019 | Safely managed water and sanitation coverage, GNI per capita, 2015 | 0.005 | −0.002, 0.012 | 0.18 | 0.025 |
| ln (ODA per capita for basic water), 2016–2019 | At least basic water coverage, GNI per capita, 2015 | −0.008 | −0.034, 0.017 | 0.53 | 0.053 |
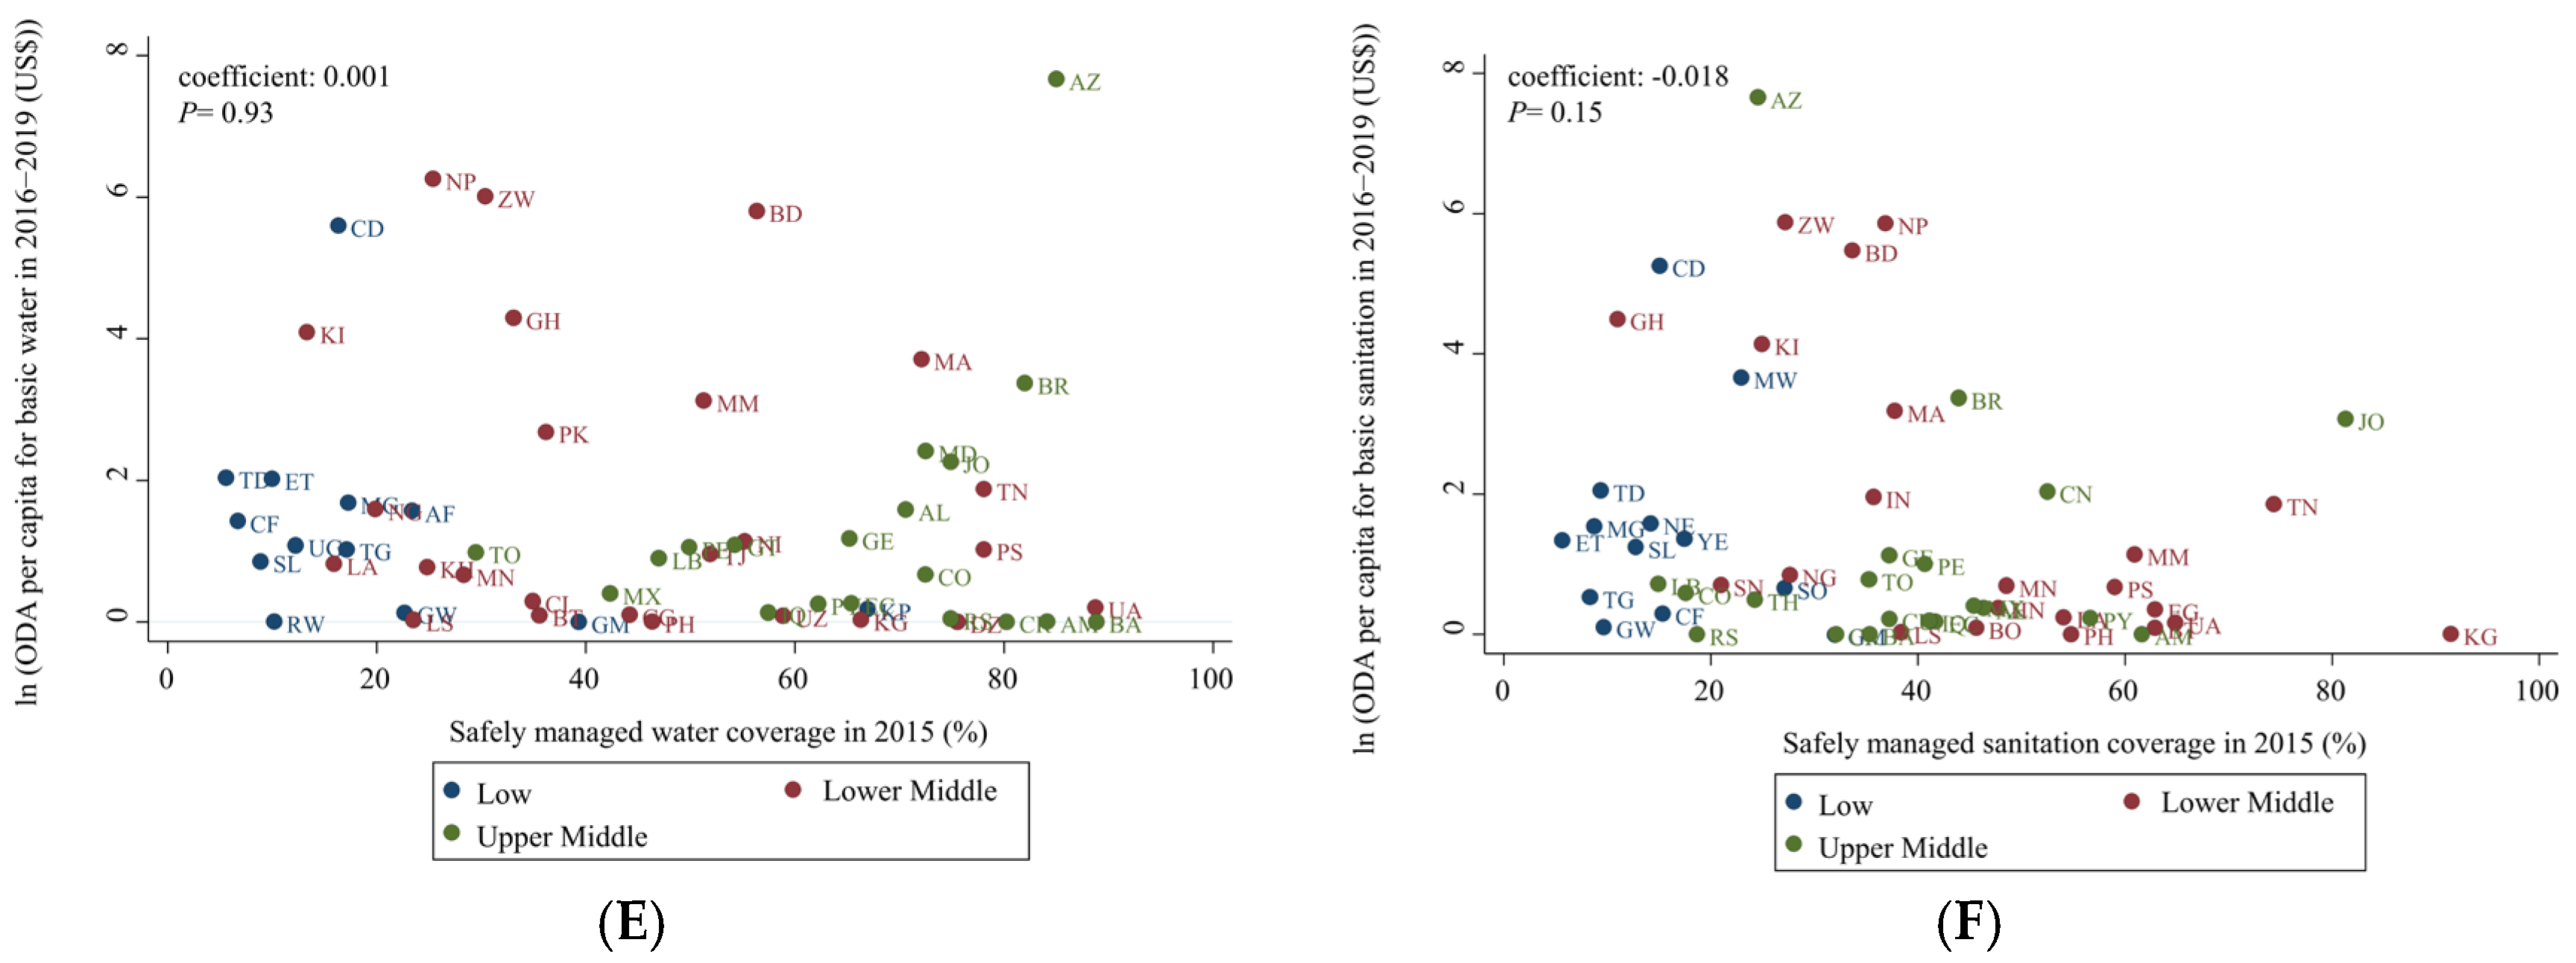
| ln (ODA per capita for basic water), 2016–2019 | Safely managed water coverage, GNI per capita, 2015 | 0.001 | −0.024, 0.026 | 0.93 | 0.018 |
| ln (ODA per capita for basic sanitation), 2016–2019 | At least basic sanitation coverage, GNI per capita, 2015 | −0.008 | −0.025, 0.007 | 0.27 | 0.046 |
| ln (ODA per capita for basic sanitation), 2016–2019 | Safely managed sanitation coverage, GNI per capita, 2015 | −0.018 | −0.043, 0.007 | 0.16 | 0.055 |
Publisher’s Note: MDPI stays neutral with regard to jurisdictional claims in published maps and institutional affiliations. |
© 2022 by the authors. Licensee MDPI, Basel, Switzerland. This article is an open access article distributed under the terms and conditions of the Creative Commons Attribution (CC BY) license (https://creativecommons.org/licenses/by/4.0/).
Share and Cite
Kim, S.; Cha, S.; Jin, Y. Association between Official Development Assistance for Water and Sanitation and Countries’ Needs from 2002 to 2019. Int. J. Environ. Res. Public Health 2022, 19, 11134. https://doi.org/10.3390/ijerph191711134
Kim S, Cha S, Jin Y. Association between Official Development Assistance for Water and Sanitation and Countries’ Needs from 2002 to 2019. International Journal of Environmental Research and Public Health. 2022; 19(17):11134. https://doi.org/10.3390/ijerph191711134
Chicago/Turabian StyleKim, Sumin, Seungman Cha, and Yan Jin. 2022. "Association between Official Development Assistance for Water and Sanitation and Countries’ Needs from 2002 to 2019" International Journal of Environmental Research and Public Health 19, no. 17: 11134. https://doi.org/10.3390/ijerph191711134