1. Introduction
One of the most important recent changes in the civil aviation industry is the imminent incorporation of unmanned aerial vehicles (UAVs) into operations, especially for transportation and logistics. The growing interest in UAVs (commonly referred to as drones) is due to their technical, operational and economic benefits such as last-mile transportation, quick medical deliveries to both urban and remote areas, and the important reduction in overall CO
2 footprint and local air quality emissions [
1,
2,
3].
However, whilst the broad range of potential applications of drone technologies could bring substantial benefits, they can also produce new and unconventional sources of environmental noise, which are likely to lead to significant challenges for the health, quality of life, and well-being of exposed communities. In addition, UAVs are expected to operate differently than the standard aircraft. UAVs will operate closer to ground level and in proximity to dwellings, especially during the last-mile manoeuvres such as take-off, landing and hovering. It is important to take care not only of the outdoors environmental drone noise distribution near the flight path but the noise levels on the façade and the noise levels transmitted inside the buildings [
4]. The literature on drone noise emission has reported that drone noise signature is highly influenced by the type of drone configuration, e.g., number of rotors in multi-copters, size and weight, flight manoeuvres [
5,
6,
7,
8], and also significantly influenced by the ambient weather conditions, most notably the wind [
9].
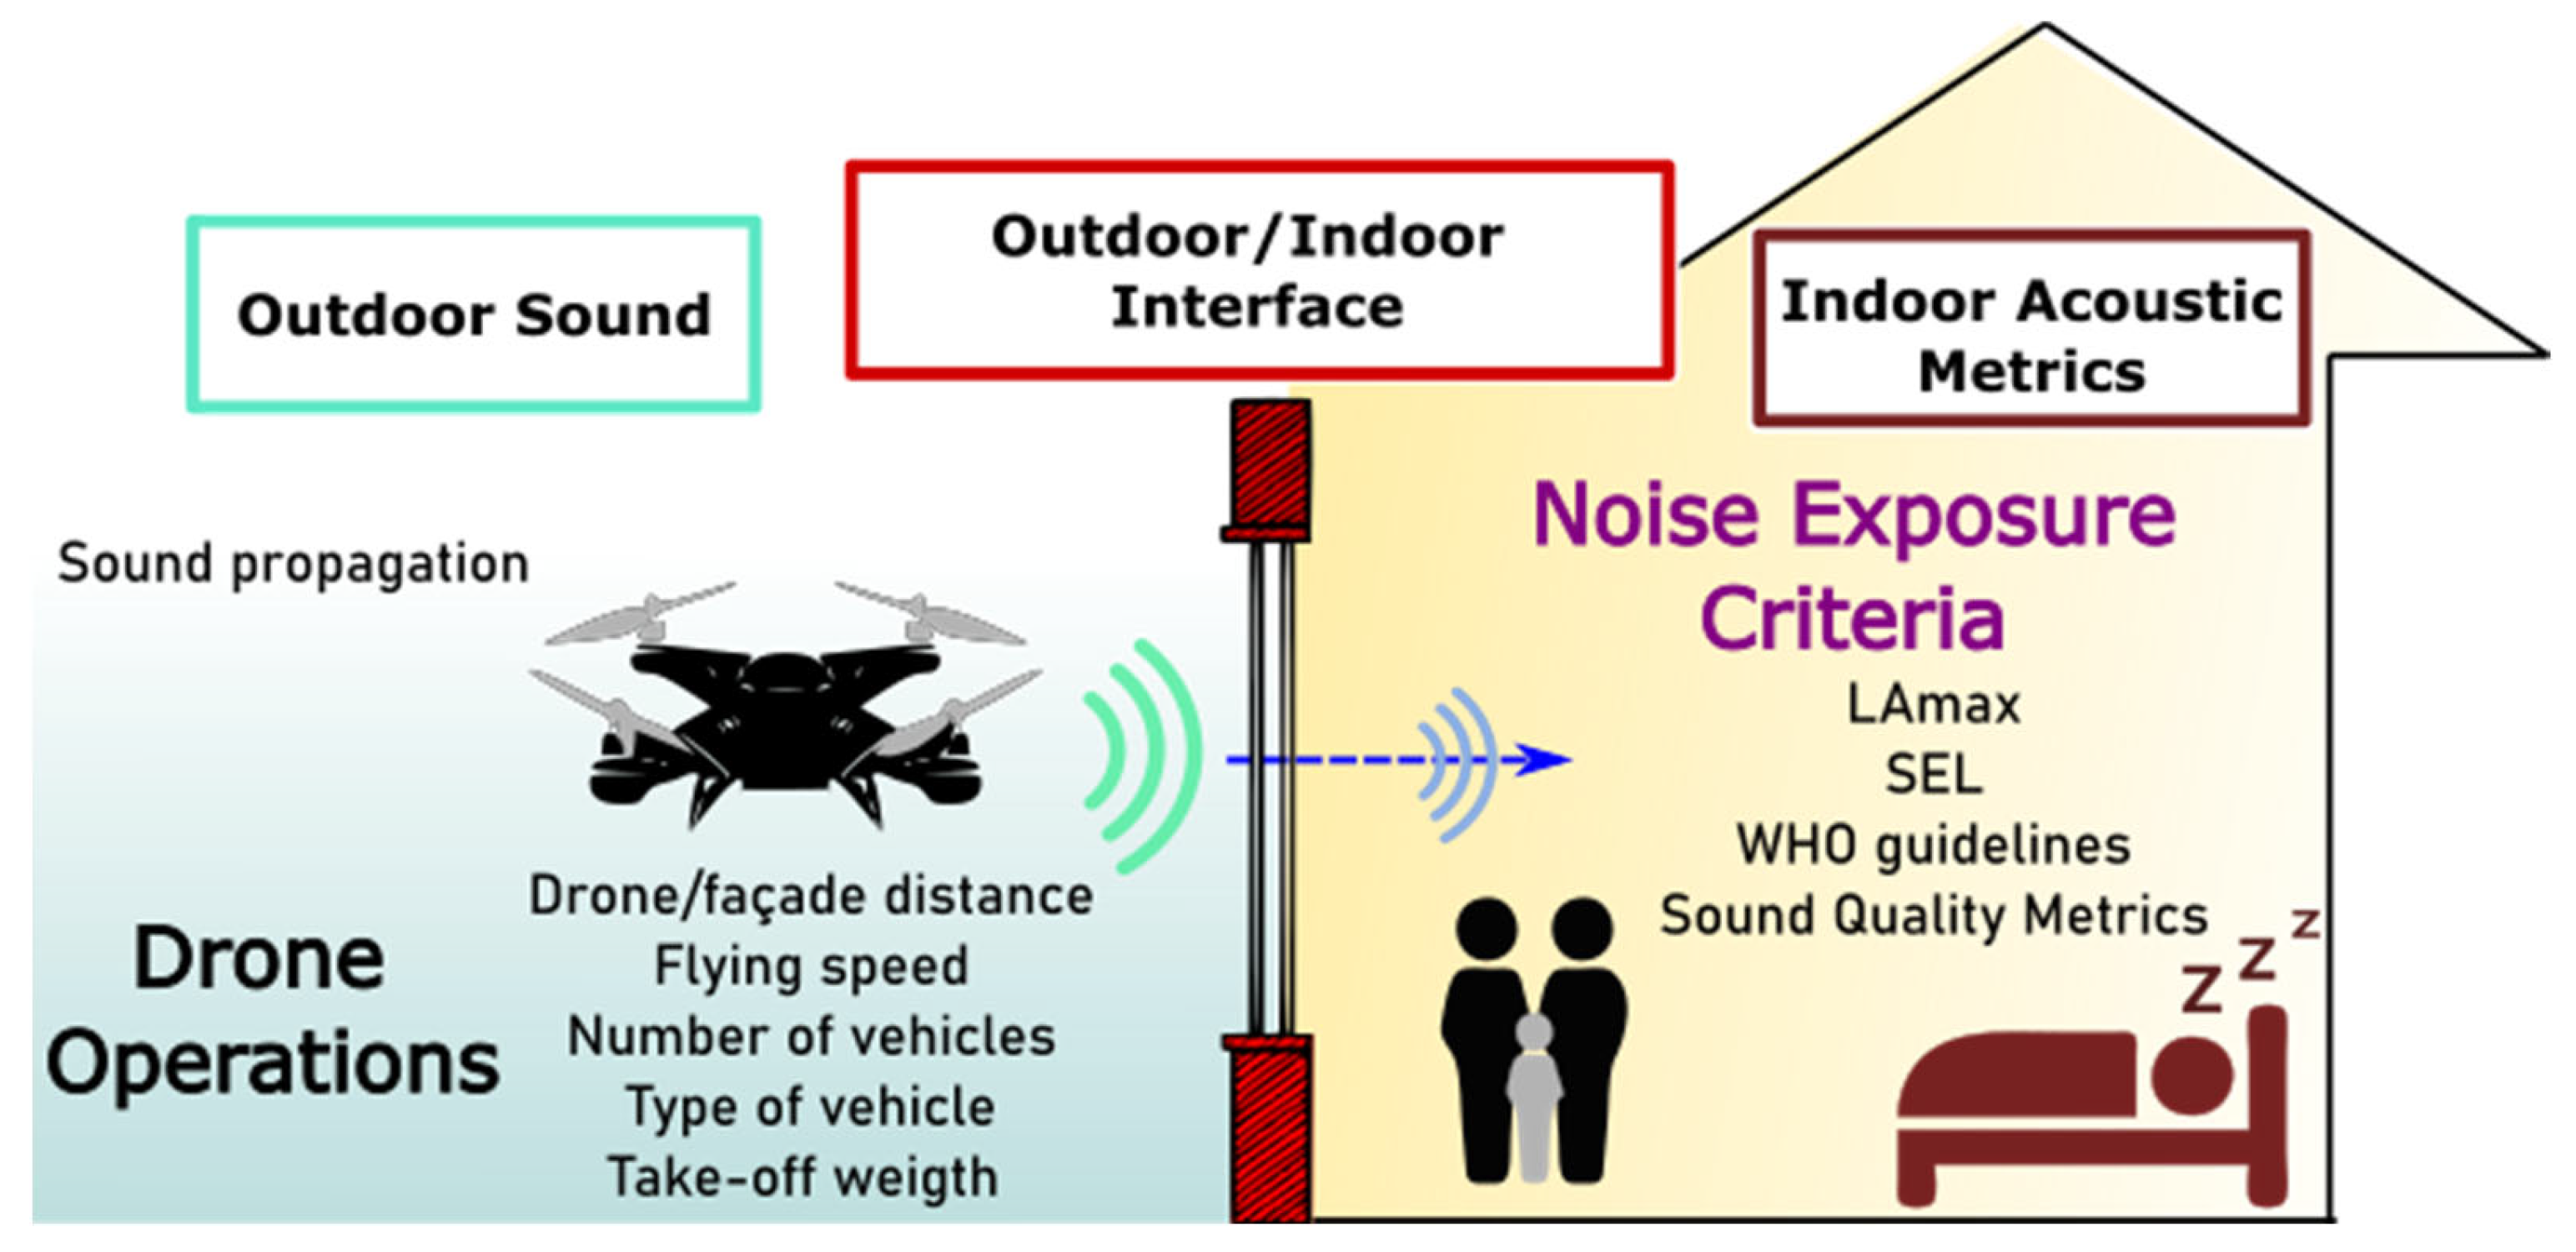
The main aim of this paper is to present a modelling framework for setting up best operational practices for drone manoeuvres to minimise the potential adverse impacts on receivers inside buildings. The importance of this framework is that the drone stakeholders can be informed of the specific requirements for distances from residential properties on the basis of noise metrics specified as guidelines for acoustic targets in the receiving environment, as depicted in
Figure 1. The design of the framework is presented in detail and illustrated with a case study which uses data from actual outdoor measurements and models the outdoor sound propagation and sound transmission façade features to predict noise exposure inside a sensitive room that can be compared against relevant noise criteria.
The noise emission of conventional aircraft noise sources is usually reported by maximum A-weighted sound pressure levels,
; sound exposure level,
; sound levels integrated over a day/period time such as
; and spectral analysis by 1/
n octave bands. However, these noise metrics have been found unable to account for the acoustic characteristics of drone noise due to their substantial content in complex tones and high-frequency broadband noise [
10,
11]. For instance, as described by Torija et. al. [
12], the tonal correction factor in the effective perceived noise level (EPNL) metric, used for aircraft noise assessment, might not be suitable for capturing the perceptual effect of complex tonality. To date, enough evidence has been found demonstrating that the noise produced by drones does not qualitatively or quantitatively resemble the noise produced by conventional aircraft [
12,
13,
14].
The inability of existing aircraft noise metrics for capturing drone noise perception might suggest that the current evidence for human responses to aircraft noise is not applicable for drone noise exposure. Sound quality metrics (SQM) could outperform traditional noise metrics in capturing the key psychoacoustic factors influencing perception of drone noise. This is discussed by Torija and Clark [
15], where the authors suggest that further research is needed to define metrics optimised for drone noise and also to define acceptable levels for drone noise emission. However, until enough robust evidence on the human response to drone noise exposure is gathered, existing noise metrics and recommended target could be used to inform regulation of operational procedures. This assumption is also supported by some recent research suggesting loudness-related metrics as the main drivers of noise annoyance for drone operations [
7,
16].
The modelling framework presented in this paper therefore relies on existing evidence for aircraft noise exposure (e.g., WHO guidelines for sleep disturbance and awakenings [
17]) and current aircraft noise metrics. However, other acoustics metrics have been developed, for example based on SQM, that have proven to be useful in the analysis of perceptions of drone noise and other conventional urban noise sources [
14].
The paper is organized as follows:
Section 2 describes the drone noise database used for the case studies;
Section 3 describes the modelling framework to set the distance requirements for drone operations;
Section 4 presents the results of the framework applied to three case studies;
Section 5 discusses the framework application and future work; and the main conclusions of this work follow in
Section 6.
2. Drone Sound Signals Database
The research presented in this paper relies on the analysis of an acoustics database, reported by Volpe [
18], that includes three types of multirotor and fixed-wing uncrewed aircraft on several flying operations (hovering, flyover, take-off, landing, and facilities inspection).
Table 1 presents the main design specifications of the tested multirotor aircraft. The list includes drones of different weights and dimensions and the aircraft ground speed of the flyover tests for each drone.
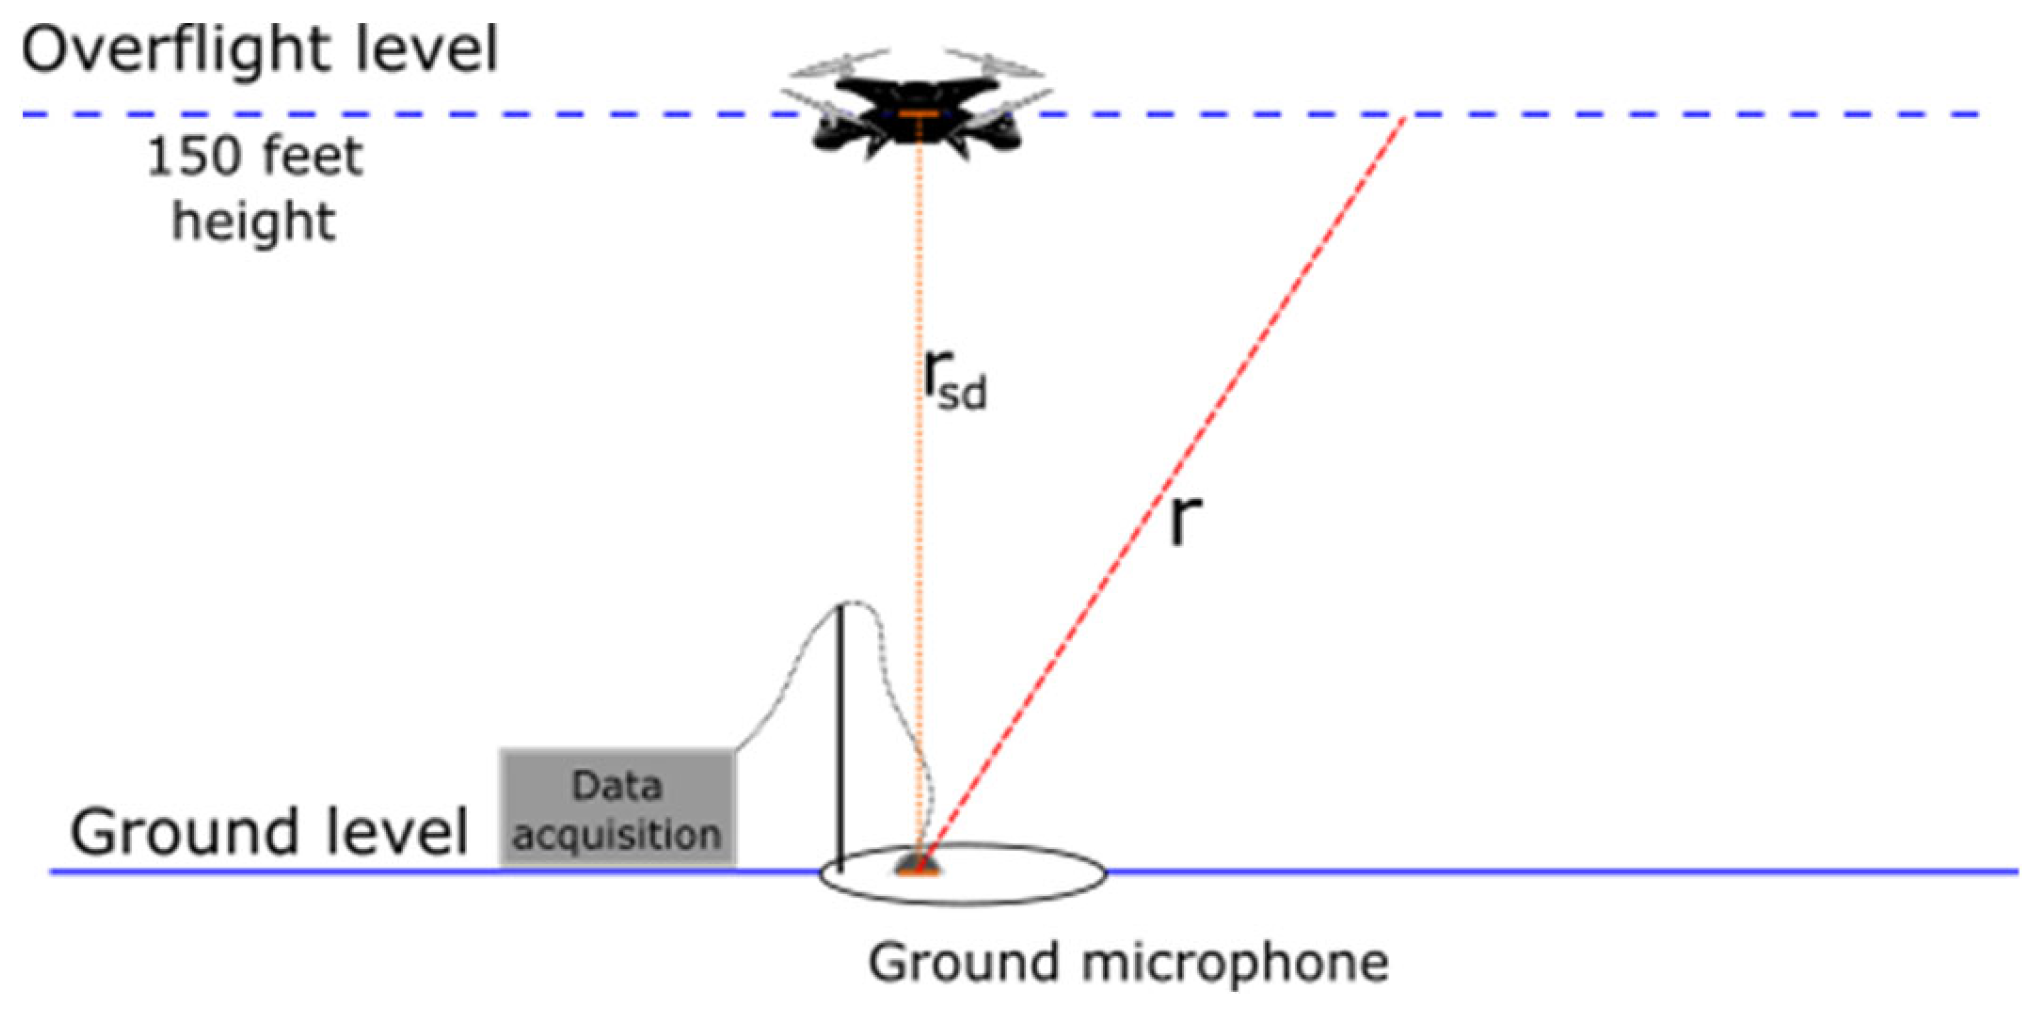
Figure 2 illustrates the setup used for measurements that have been analysed within the Volpe database with an inverted centreline ground (CLG) microphone below the drone flight path 150 feet above the ground (
m). The drone noise database provides the sound pressure levels only at distances
, equal to or longer than the slant distance
(shortest straight line between the microphone and the sound source equal to the height above ground).
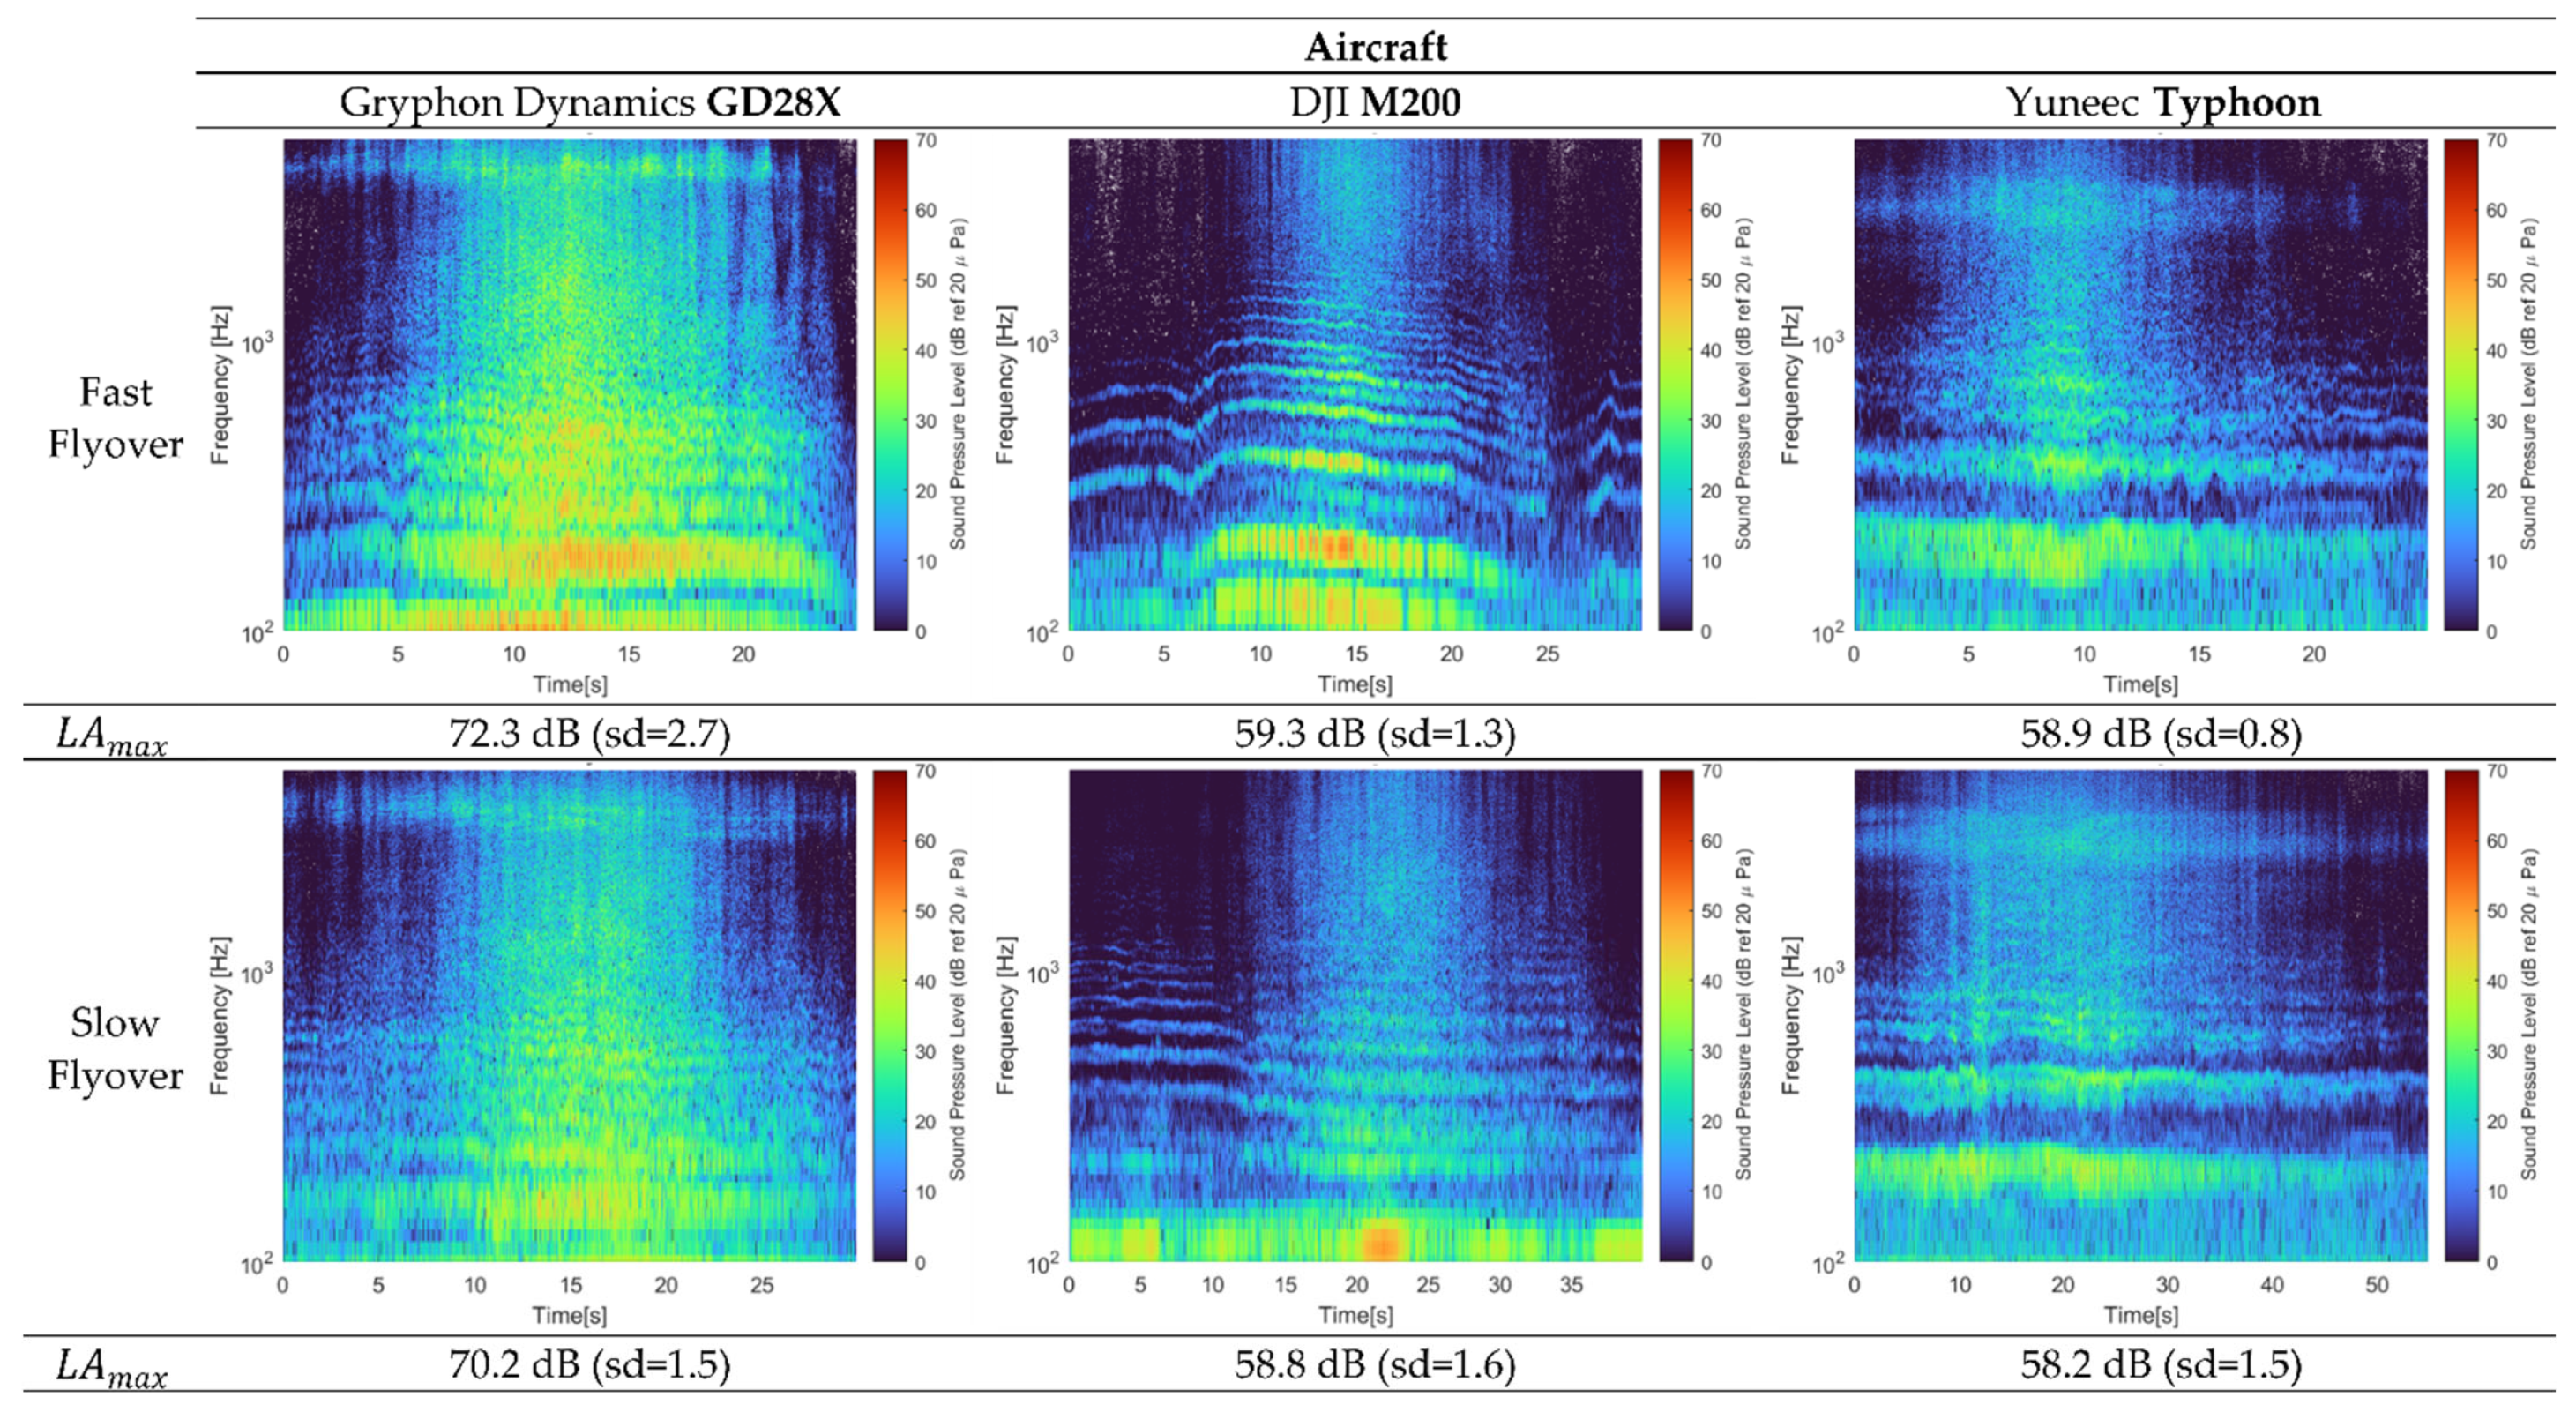
From the acoustic data and audio files provided within the acoustic measurement database for flyover operations at slow and fast speeds, it is possible to visualize the spectral content of the tested drones. The typical acoustic footprint of this type of vehicle is produced by the rotor and propellers [
19], and it is characterised by the tonal components, which include the effects of the rotors’ fundamental (low frequencies), the harmonics of the rotors’ fundamental frequencies (mid), and the electric motor noise component (high frequencies) [
20]; see
Figure 3. One interesting observation about the measured data is that the tonal components appear to be more significant in terms of amplitude when the drone is performing a fast flyover.
3. Framework for the Drone Operations Requirements
The gradual incorporation of drones into soundscapes near communities highlights the need to develop new policies and engineering tools to deal with the potential noise impacts of these new sound sources on exposed populations. In this regard, the drones’ sound emissions need to comply with environmental recommendations to minimise the potential health effects of noise. Several constraints for drone operations could be considered, i.e., distance from residential properties during drone flyover, along with speed and/or altitude.
Using the core process outlined in the flow chart in
Figure 4, indoor sound levels can be estimated from drone noise (generated outside during the flying operation) by simulating the typical transmission loss during the propagation from the drone to immediately outside the building façade and then the transmission through the façade into the receiver room. Once the sound levels indoors are estimated, the drones’ operational constraints can be set to comply with the guidelines of the acoustic objective on the receiver side.
In particular, this research paper provides the preliminary results of the application of the proposed framework to establish the minimum drone/façade distance
. This can be studied as an optimisation parameter on drone infrastructure path planning [
21]. If a minimum
parameter can be established, it can be controlled by the drone operator or pilot to minimize the noise impact inside the receiver room accordingly.
was calculated using current WHO night noise guidelines [
17]. The more recent WHO Environmental Noise Guidelines for the European Region are complimentary to the earlier WHO Noise Guidelines and do not include any updated recommendations for single noise events.
3.1. Outdoor Sound
The sound pressure level of an operative drone flying outdoors is a function of the environmental conditions and the flight manoeuvre variables. Therefore, the produced noise amplitude for specific drone models can be obtained by actual measurement campaigns either on field or in laboratory conditions. Acoustic propagation models can also be included in the analysis to report the likely effects of changes in environmental and operational conditions, such as the temperature, humidity, and source/target distance.
From the extensive field-based drone measurement campaign reported by [
18], it is possible to obtain the actual sound levels during the drone flyover at microphone distance
. The drones’ operations measured and presented within this campaign were flyover (both fast and slow), take-off, landing, hovering, and infrastructure inspections.
To obtain the sound pressure level at distances other than the measurement drone-receiver slant distance (
r), state-of-the-art sound propagation models can be applied to estimate the sound level at other distances under varying environmental conditions needed in the analysis. Previous research, identified during the literature review, recommended some approaches to outdoor drone noise propagation. The impact of drone noise during hovering operations in large outdoor urban environments has been explored using acoustic ray tracing. The ground reflection and acoustic refraction by an inhomogeneous atmosphere were included in the sound propagation model [
22].
Moreover, several parameters conform to a comprehensive model of sound propagation, included as modifying factors
in the generic expression of sound pressure Level,
, in terms of the sound power level,
(Equation (1)) [
23]. This approach has been implemented in commercial software for sound propagation according to methodology within the ISO 9613-2 standard [
24]:
Two main assumptions have been considered in this paper for the selection of the propagation modifying factors. Firstly, the drone is a single-point sound source propagating with spherical spreading characteristics [
19,
22], and the operation of the drone’s electric motors generates a significant noise with high-frequency components which, unlike the acoustic signature of typical aircraft noise, reach the receiver without significant attenuation due to drones operating at shorter source/receiver distances [
20]. The spherical sound field can be calculated from the sound power level of the source, considering the geometrical attenuation due to spherical spreading and the attenuation associated with atmospheric absorption [
25]. These two parameters are presented in Equation (2), with distance
and the atmospheric sound absorption coefficient
as the main modifying factors during the drone sound propagation effects:
The effect of the mentioned contributors at a reference distance
from the drone are included in the measurements of
, and the sound power
can be derived through the calculation of the contributors as presented in Equation (3):
Therefore, the sound pressure level at any distance
, which is obtained by Equation (4), is usually
to avoid the effects of the near field [
26]. The effects on the atmospheric modifying factor on sound level attenuation due to the atmospheric sound absorption are included in the term
, where
is the attenuation coefficient for air absorption in Equation (5) [
27,
28]:
Furthermore, if the estimation of the
is based on the maximum sound pressure level, i.e.,
the sound exposure level
can be obtained with an effective time
by Equation (6) [
27,
29]:
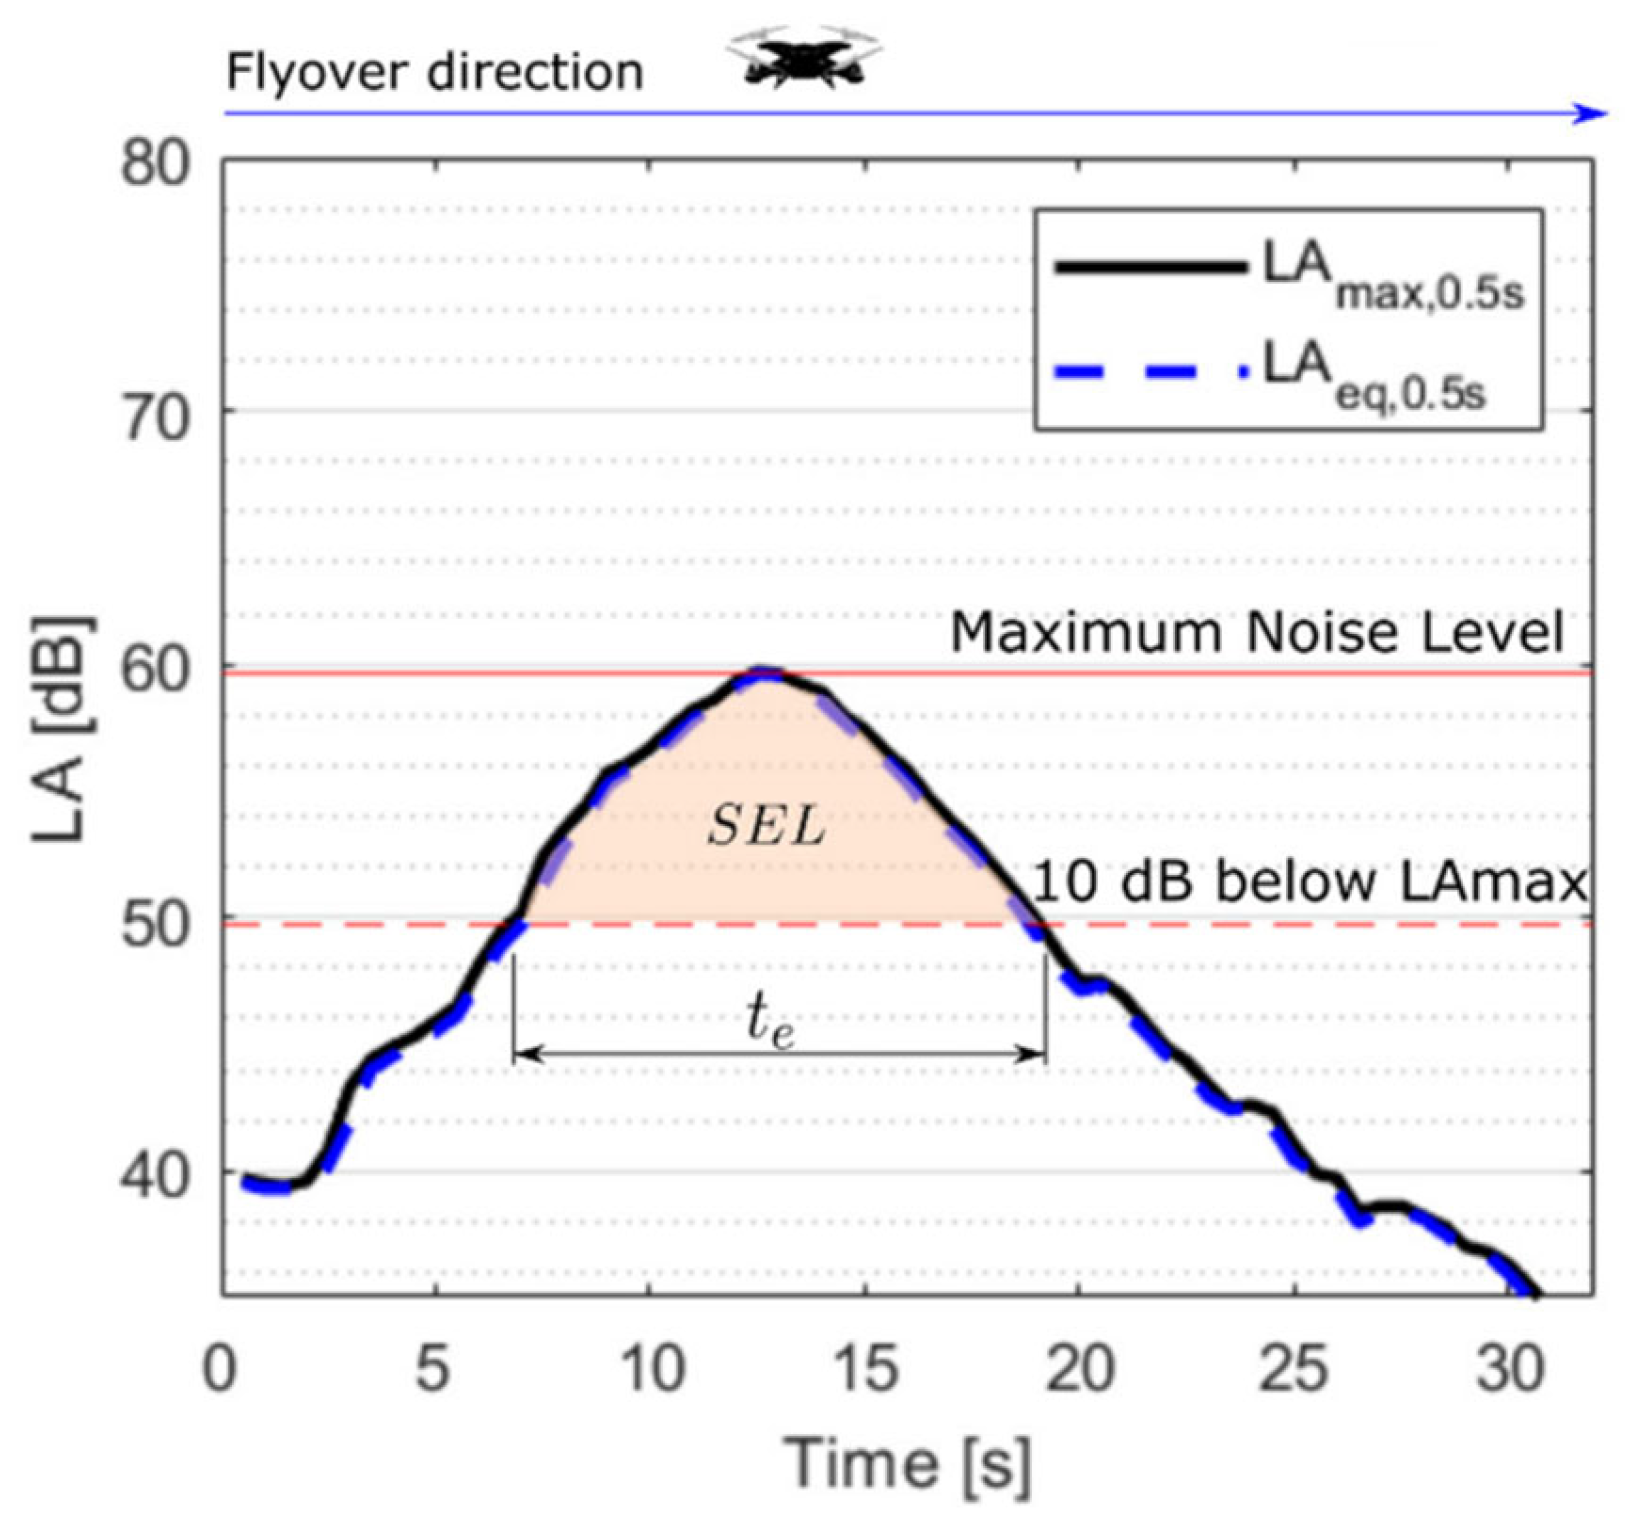
The sound signal on the time domain presented in
Figure 5 shows the amplitudes of
and
registered every 0.5 s [
18]. It is noted that the two values are almost equal during a fast flyover operation for each of the three drones that were measured. However, this condition may not be present for other drone manoeuvres. The accelerating and deaccelerating drones’ mechanisms are mainly related to the rotational speed and tilting rotor position but produce changes in the pitch of the emitted sound; therefore, the drone operations can cause both spectral content and time variations of sound with consequences in the drone acoustics noise impact [
30] and annoyance [
16].
3.2. Sound Transmission
The next step in the sound path from outdoors to the receiver environment is the effects of acoustic attenuation due to a building façade. The sound reduction properties of the façade can be obtained either through experimental measurement or modelling, although the sound reduction properties resulting from these two methods, even for the same building element, may differ significantly. The sound reduction index
is derived by measuring the difference between the sound levels at the source (
) and the receiver (
), which are separated by a partition element with surface area
. The equivalent sound absorption area provided by the receiving room
is considered in the calculation of
, as is presented in Equation (7) [
31]:
The experimental results of the measured sound reduction indexes depend strongly on the spectral content of the sound within the source room, building materials, glazing area, open-window condition, and receiver room measurement positions. The contribution of different sound wave paths (such as flanking transmission) can be measured during experimental façade testing. The cumulative sound reduction through all transmission paths can be expressed using the apparent sound reduction index
[
31,
32,
33,
34].
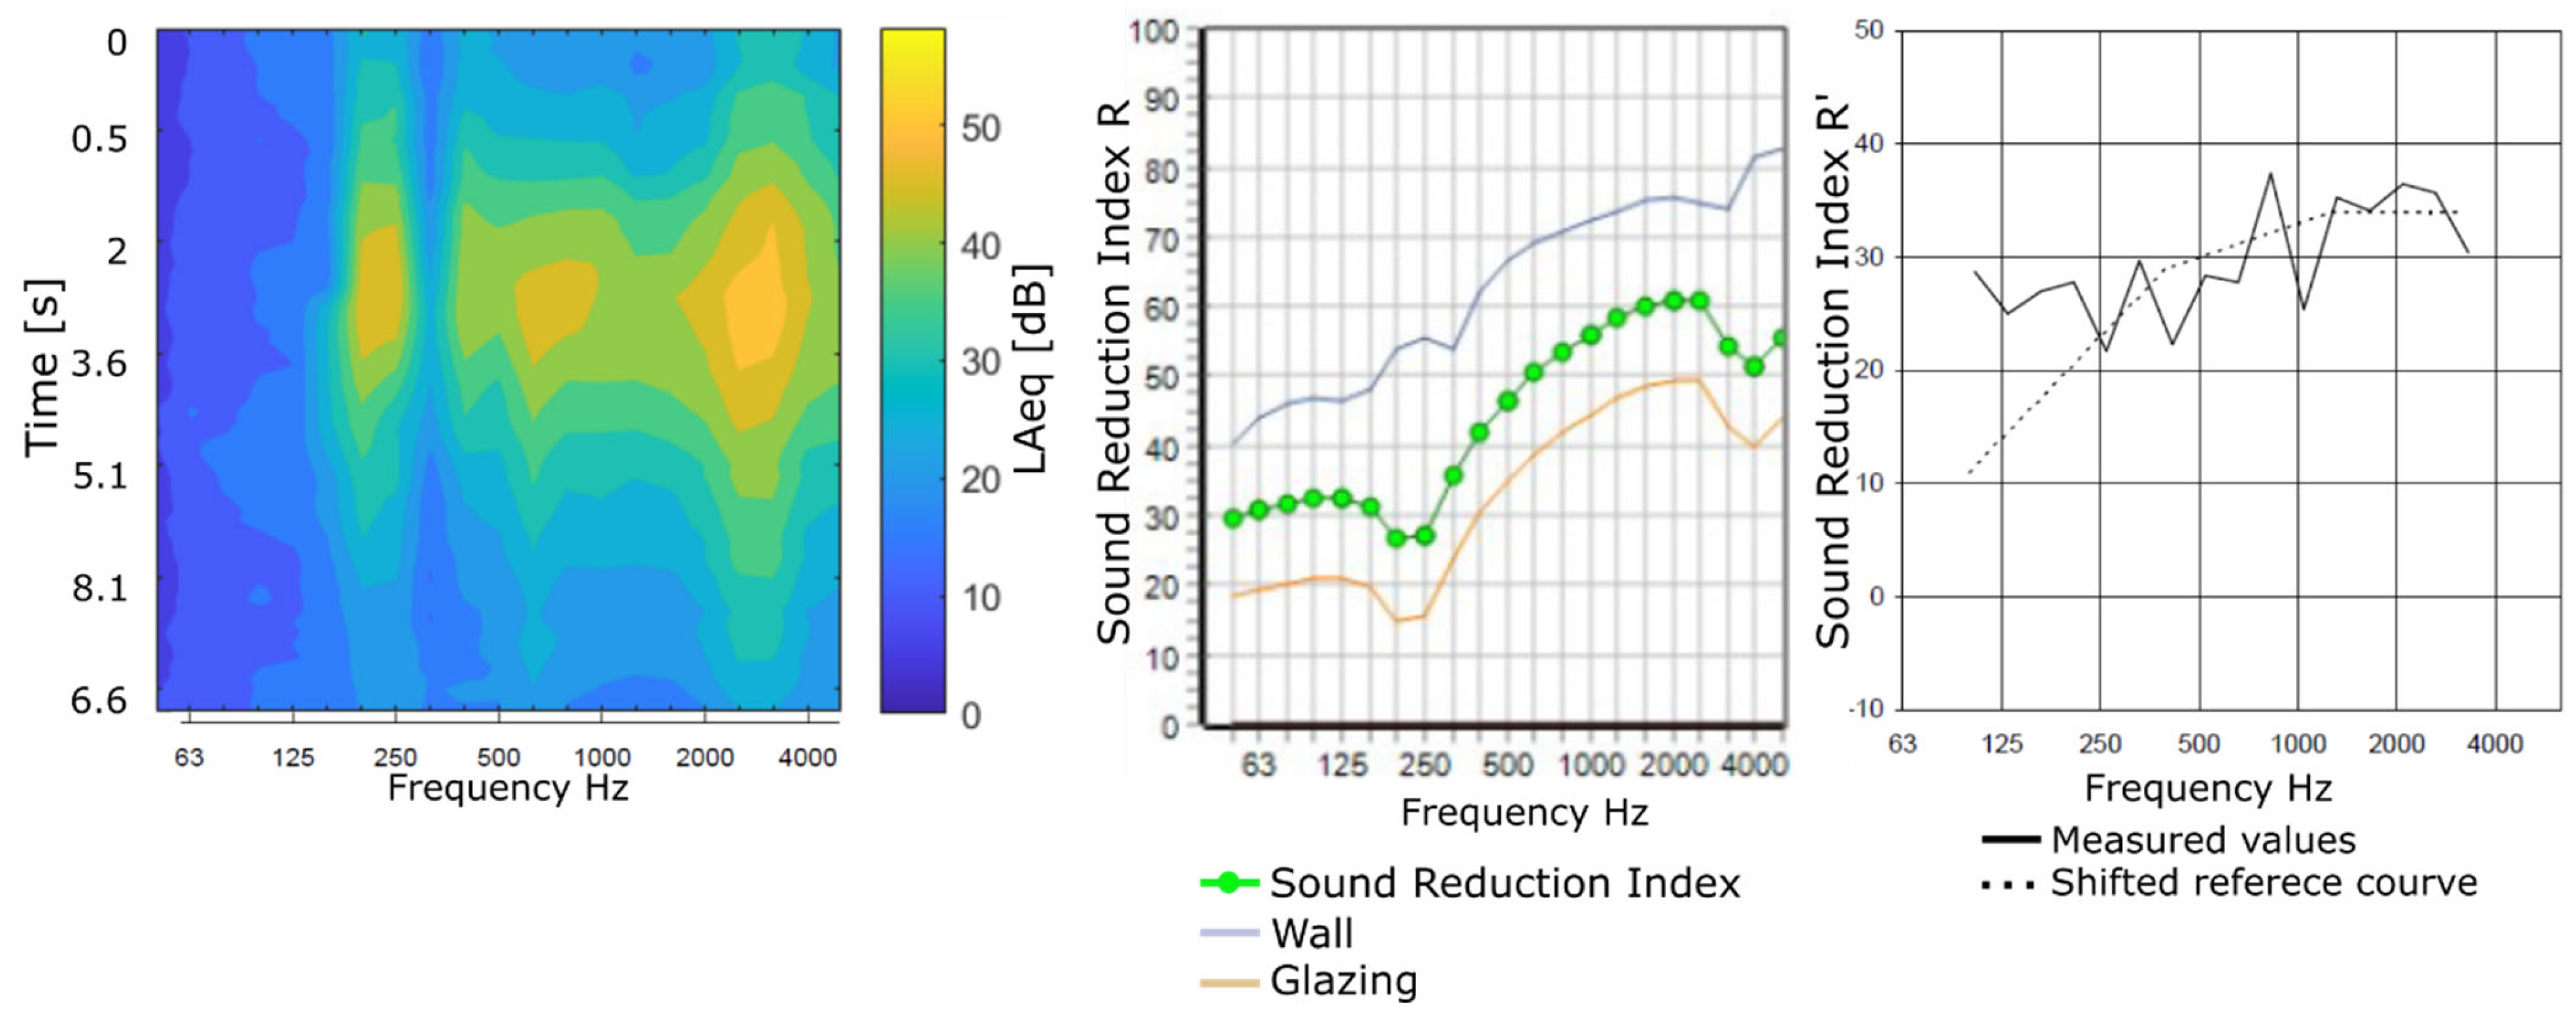
Based on the preliminary analysis of the drone sound database, this paper will focus on the outdoor flyover procedures at fast and slow speeds. From a noise perception point of view, the acoustic signatures of the recorded drones can be particularly interesting because the frequency bands with the highest amplitudes could potentially overlap with frequencies of reduced sound reduction performance as a result of the resonance or coincidence frequencies of the partition materials. The sound emission of drone flyover and both the modelled and measured sound reduction indices for a typical closed double-glazed residential window are presented in
Figure 6.
Bot, the experimentally reported apparent sound reduction index (R′) and commercial software prediction (sound reduction index R) for a typical double-glazing façade-window configuration [
32] decreases or dips in the sound reduction index at low-frequency (~250 Hz) and high-frequency bands (~3150 HZ) where the coincidence dip would be expected, whereas the
values of a flyover operation (Yuneec Typhoon) shows the highest amplitudes in these same frequency bands.
This overlap between the reduced noise attenuation provided by the window and the higher third-octave band amplitudes of the drone-source acoustic signature presents an interesting and potentially problematic unexplored area with relevant applications for the regulations and requirements regarding drones operating near to communities.
The expression in Equation (8) lets us estimate the sound pressure level in the receiver environment with volume
partition surface area
and reverberation time
, as described by Equation (4) of the standard BS EN ISO 12354-3:2017 [
31].
3.3. Indoor Sound
The impact of drone noise on indoor receivers is a current gap in the research because the techniques for noise evaluation applied for other noise sources (i.e., traffic noise and aircraft noise) are based on the overall emission levels, and the main amounts of energy in their sound signal are located in the low and middle broadband ranges. The special acoustics characteristics of drone noise signature; in particular, the pure tones and high-frequency broadband noise means that traditional sound level metrics may not sufficiently represent the acoustic signature of drones or effectively convey their noise impact.
However, acoustic screening based on the overall sound levels considered in the noise assessment guidelines is an important starting point to assess the possible negative effects that the drone noise source may have on an exposed community [
35]. For instance, the WHO guidelines for sleep quality effects can be used to set these acoustic requirements [
17]. These WHO guidelines set the threshold of the
at 42 dB for “Waking up at night and/or too early in the morning”. In addition, the number of drones in operation could be considered a variable to adjust to model recurrent flight events and predict the exposure to drone noise over an appropriate time period, e.g., 8 h at night.
This example maximum noise level criterion is helpful in determining a suitable minimum
during the night hours when sleep disturbance is an important factor for determining impact. However, this criterion alone does not provide any insight into the number of drone passbys that might be acceptable or provide any idea of acceptability during daytime hours. Currently in the UK, commercial aircraft noise is assessed based on government guidance about the lowest observable adverse effect level (LOAEL), quantified in terms of the
and
for day and night respectively, as calculated for a given airport over an “average summer day” (defined over a standardised 92-day period between 16th of June and 15th of September). The government guidance on the LOAEL values for day and night is informed by the 2014 Survey of Noise Attitudes (SONA), the results of which are published in CAP1506 [
36].
As discussed by Torija and Clark [
15], it is not clear whether or not current metrics or indeed criteria such as the LOAEL for commercial aircraft noise are suitable for assessing drone noise at residential receiver locations. However, the latest best practice for assessing commercial aircraft noise acknowledges that average noise metrics such as the
may not adequately represent what is actually perceived at receiver locations, particularly those close to an airport where the noise environment is punctuated by very loud individual flyover events rather than a continuous drone of distant aircraft noise.
In order to account for this, number above metrics such as the NA70 are often used as secondary metrics to help describe the number of times
exceeds a given level; in the case of NA70, this would be the number of events above 70 dB
at a given receiver location. It is noteworthy that NA70 has been used as a national indicator in Australia for potential speech intelligibility issues with respect to commercial aircraft noise on the basis of an assumed 70 dB
outside a residential location (as discussed in Appendix B of CAP1506 [
36]). In the absence of anything specifically derived for drone noise, a daytime maximum noise criterion of 70 dB
would be an appropriate starting point for deriving a minimum daytime
that might reasonably be expected to avoid speech intelligibility issues.
Further research is needed to be able to derive suitable limits for either the number of drone flyover events above a certain maximum level, or an average noise metric that can be shown to correlate with mean annoyance (as is the case for as discussed in CAP1506).
4. Results—Case Studies
In this paper, we report on the recommendations for drone/façade distance during flying operations based upon actual measurements of drones operating in an outdoor environment. In this case, the proposed framework establishes the receiver noise level criterion to comply with the WHO guidelines for sleep quality based upon .
The flying conditions remained stable during the whole exercise, i.e., flight path and speed of the drone. Firstly, the drone is considered a noise source operating outdoors. Then, the amplitude of the indoors sound was estimated from a façade configuration located at the source-receiving interface. Finally, the recommendations for
are based on the
. The developed modelling framework is illustrated considering the specific acoustic and operating conditions of three different drones listed in
Table 1 during fast and slow speed flyovers.
Figure 7 shows the amplitude of
as a function of the
in the receiver environment without (left) and with (right) the hypothetical installation of the partition with the window considering an open area, in this case,
.
Data for the assumed façade installation have been presented in third-octave band
, which is representative of a standard glazing element with a partially open window. The partition’s sound reduction performance (inward lateral rotation window with standard glazing type 4-16-4 mm) was measured under controlled conditions and reported by Waters-Fuller and Lurcock [
32]. The predicted sound signal at the receiver shows that the attenuation at high frequencies is not great considering the significant emission of the drone in this range of frequencies.
The waterfall diagrams in
Figure 7 present the sound amplitudes (
obtained at a distance
from the source, both by actual measurements (
) and extrapolated through predictions from modelled propagation (
). The shortest drone-sensor distance
is highlighted. Then, it is possible to obtain the broadband
through the signal amplitude on each frequency band.
Finally, the recommendations for the drone operations variables can be compared with the acoustic target, and it is possible to estimate the compliance conditions in the receiver environment.
The recommended was obtained from fitting curve modelling based on associated with different flyover operations, drone types, and closed-window configurations.
A fitting curve model (
Figure 8) was estimated to establish a recommended drone operation parameter. Therefore, it is possible to obtain a fitting curve specific to each combination of drone flyover operation and building façade configuration to achieve the indoor noise criterion/acoustic target.
Consequently, it is possible to find the recommended drone operational parameter to comply, for instance, with the sleep quality guidelines (42 dB
) or biological effects on EEG awakening (35 dB
) as reported by WHO [
17].
Next, some recommended values were obtained from the proposed modelling framework. The results let us compare the recommended by considering the type of drone, the speed of the flying operation, and the open/closed window configuration.
4.1. One Drone—Open Window Conditions–Fast/Slow Speed Flyover
The broadband sound emission of the contra-rotating octocopter GD28X was analysed as a function of the flyover speed. The recommended Drone/façade distance for both fast and slow flyovers is presented in
Table 2, where a partially open window (
) was considered for the glazing configuration. To comply with the acoustic guideline, the approximate increase of 5 m/s in the speed during flying over operations needs to consider an increment of
on 68.5 m if the receiver window is partially opened, as is depicted in
Figure 9. For this type of aircraft, the
greater than 110 m was recommended to ensure the acoustic objective of 42 dBA indoors during the studied overflights.
4.2. Three Drones—One Window Condition
Table 3 presents the drone/façade distance DFd recommendations for the three tested drones at their own fastest speed during flyover when the receiver window is closed. The indoor acoustic target would be achieved with distances less than 25 m for the aircrafts M200 and Typhoon, while distances higher than 60 m would need to be defined for the drone GD28X.
Although the available flyover speed data for each drone do not let us compare the operations at the same speed, the values of
from each drone at fast flyover speed would be a consequence of the construction characteristics of the drones, i.e., weight, size and number/type of rotors (see
Table 1).
From this preliminary observation, drones with smaller dimensions, lighter total take-off weight, and fewer rotors could operate closer to the community than drones with larger proportions and more motors to comply with the acoustic target indoors, as is depicted in
Figure 10.
4.3. Drone Fast Flyover Operation and Open Window Condition
When comparing the different open-window configurations during one drone overflight, the acoustic target indoors can be obtained by increasing the drone/façade distance DFd if the open window area is increased, as presented in
Table 4, where the results are based on the drone Typhoon operations. Furthermore, doubling the open area, the drone path should move away from the facade between 10 and 13 m to ensure the acoustic metric target at the receiver.
For this specific glazing configuration, the closed window can reduce the sound by 30 dB compared with the fully open window. Therefore, the distance at which the drone could operate to maintain the acoustic target (42 dBA) between the fully open and closed window conditions shows a difference of 115 m. See
Figure 11 (left).
The analysis with the same previous conditions of both flyover drone and window configurations can be depicted to compare the acoustic target based on
as is presented in
Figure 11 (right).
5. Discussion
The modelling framework presented in this paper can contribute to setting operational requirements for drone operations to protect communities exposed to their noise. The outcomes of this modelling framework could be used in multi-criteria decision-making for trajectory optimization [
37]. This allows components from the source to the propagation path for indoor sound transmission to be updated independently from one another. For instance, in the case studies presented in
Section 4, the source data are based on drone measurements outdoors. Instead, the source emission could be based on acoustic predictions or measurements carried out in anechoic chambers or wind tunnels. The sound propagation from source to building façade only accounts for spherical divergence and atmospheric absorption. However, the propagation model can be expanded to account for other propagation factors such as ground effects, reflection from surfaces, and screening by obstacles according to ISO 9613-2. The sound transmission through building partitions is based on data gathered in a comprehensive measurement campaign with actual glazing installations [
32]. However, input data from modelling software (e.g., INSUL) for sound transmission can be used to account for other building outdoor/indoor interfaces and window/façade configurations.
For a given drone model, the minimum drone–façade distance to meet the WHO recommendations can vary significantly depending on the glazing condition. This implies the need to accurately define the sound transmission indices for the most relevant glazing system including the window opening behaviour, which varies across individuals and also seasonally.
Neutral atmospheric conditions are considered in this paper; however, wind speed and direction can significantly influence both the sound emission [
27] and propagation to the receiver. Appropriately accounting for these factors is crucial for setting operational requirements representative for the area under study. Finally, the drone is assumed to be an omnidirectional source. This is unlikely, and therefore, the directionality of the drone sound emission should be considered.
The acoustic objectives used in this paper to set operational requirements are based on conventional noise metrics and existing evidence on human responses to aircraft noise. As discussed by Torija and Clark [
15], current noise metrics seem to be unable to account for the acoustic characteristics of drones (i.e., complex tonal content, substantial noise emission above 4 kHz), and it is not certain that existing evidence for aircraft noise and health effects can be directly applicable to drone noise. As evidence on human response to drone noise expands, new acoustic objectives can be used in the modelling framework to set requirements for drone operations.
The analysis in this paper is restricted to 1/3 octave banding. This limits the investigation of how the coincidence dips in glazing systems might influence the indoor transmission of the substantial high-frequency noise of drones. This issue can be addressed with more refined frequency analysis, but the lack of narrowband data for sound transmission coefficients is a limiting factor. Further work will be done to account for this limitation.
Due to the frequency content of drones, vibration-induced noise generating at a glazing system is not considered in this paper. However, further extension of the modelling framework for larger vehicles (e.g., urban air mobility vehicles) will consider this sound generation mechanism.
6. Conclusions
This paper presents a modelling framework for the estimation of indoor noise exposure due to drone operations. This modelling framework can be used to define operational restrictions (e.g., in the form of drone-façade distance) to meet recommended noise targets and avoid significant noise impacts on communities inside dwellings. The current version of the modelling framework is based on the measured drone sound signature and the sound propagation outdoors. The method also includes the effects of the sound attenuation provided by masonry and glazing elements during the sound transmission into the receiver room.
The application of this modelling framework is illustrated with case studies, where the minimum distance from a given drone to a typical residential building is defined to comply with the noise requirements to avoid sleep disturbance.
The results of the estimation of maximum A-weighted sound pressure levels and sound exposure levels as received in typical indoor environments are presented as case studies of drone/façade distance recommendations. To do this, a series of drone sounds recorded during outdoor flyover operations in free field and predicted amplitudes from sound propagation models were filtered to simulate the transmission loss through a standard façade configuration.
For a given drone (GD28X) operating near a window with an open area of 0.05 m2, the drone-façade distance to meet WHO recommendations for sleep quality: waking up in the night and/or too early in the morning ranges between 110.6 m (slow flyover) and 179.1 m (fast flyover). If one closed-window glazing configuration is considered, the minimum drone–façade distance ranges between 15.8 m (Typhoon) and 62.7 m (GD28X ) to meet the same acoustic target during fast flyovers. Finally, for the Typhoon drone operating at a fast flyover speed, the drone–façade distance ranges between 15.8 m (closed-window) and 131.6 m (fully open/window) to comply with the sleep quality WHO guidelines.
The practical and scalable capabilities of the modelling framework presented in this paper are part of a strategy to develop a set of tools for inferring and assessing the impact of drone noise through compliance with different regulations and guidelines. This methodological framework can be leveraged by stakeholders in the drone sector for trajectory optimisation for drone vehicles for applications such as parcel delivery. With further refinement, this type of modelling framework has the potential to significantly assist in developing noise metrics, regulations, and guidance specific to drone noise as well as in assessing the noise from future drone operations. In this paper, the objective of the modelling framework is to inform the distance requirements to operate drones avoiding issues due to community noise impact. Further work will expand the capabilities of this modelling framework to improve accuracy and so the framework outputs can be used for auralisation and psychoacoustic analysis.
Author Contributions
Conceptualization, C.R.-R., A.J.T. and C.C.; methodology, C.R.-R., N.G. and S.R.; formal analysis, C.R.-R., A.J.T., N.G., S.R. and C.C.; investigation, all authors; resources, A.J.T.; data curation, C.R.-R., N.G. and S.R.; writing—original draft preparation, C.R.-R.; writing—review and editing, N.G., A.J.T., S.R. and C.C.; visualization, C.R.-R.; supervision, A.J.T.; project administration, A.J.T.; funding acquisition, A.J.T. All authors have read and agreed to the published version of the manuscript.
Funding
Ramos-Romero, Green, and Torija Martinez would like to acknowledge the funding provided by the UK Engineering and Physical Sciences Research Council for the DroneNoise project (EP/V031848/1).
Data Availability Statement
Part of the audio recordings were obtained from John A. Volpe National Transportation Systems Center. Access to this data can be requested to David R. Read, Christopher Cutler and Juliet Page (John A. Volpe National Transportation Systems Center).
Acknowledgments
The authors would like to acknowledge the drone audio recordings provided by David R. Read, Christopher Cutler and Juliet Page (John A. Volpe National Transportation Systems Center), the Federal Aviation Administration and the Choctaw Nation of Oklahoma. C.R-R. would like to acknowledge the window/façade sound isolation charts provided by Professor Robin K. Mackenzie.
Conflicts of Interest
The authors declare no conflict of interest.
References
- Krawczyk, J. The Era of Unmanned Aerial Vehicles Is Coming; Przegląd Nauk o Obronności: Warsaw, Poland, 2020; pp. 1–9. [Google Scholar]
- Elsayed, M.; Mohamed, M. The Impact of Airspace Regulations on Unmanned Aerial Vehicles in Last-Mile Operation. Transp. Res. Part D Transp. Environ. 2020, 87, 102480. [Google Scholar] [CrossRef]
- Yoo, H.D.; Chankov, S.M. Drone-delivery using autonomous mobility: An innovative approach to future last-mile delivery problems. In Proceedings of the 2018 IEEE International Conference on Industrial Engineering and Engineering Management (IEEM), Bangkok, Thailand, 16–19 December 2018. [Google Scholar]
- Bian, H.; Tan, Q.; Zhong, S.; Zhang, X. Reprint of: Assessment of UAM and drone noise impact on the environment based on virtual flights. Aerosp. Sci. Technol. 2022, 125, 107547. [Google Scholar] [CrossRef]
- Koenig, R.; Fassnacht, J.; Albrecht, F.; Stumpf, E. Experimental Investigation on Acoustics and Efficiency of Ducted Electric Rotors. In QUIET DRONES International e-Symposium on UAV/UAS Noise; INCEEUROPE—Centre d’information sur le Bruit: Paris, France, 2020. [Google Scholar]
- McKay, R.S.; Kingan, M.J.; Go, S.T. Experimental Investigation of Contra-Rotating Multi Rotor UAV Propeller Noise. In QUIET DRONES International e-Symposium on UAV/UAS Noise; INCEEUROPE—Centre d’Information sur le Bruit: Paris, France, 2020. [Google Scholar]
- Hui, C.T.J.; Kingan, M.J.; Hioka, Y.; Schmid, G.; Dodd, G.; Dirks, K.N.; Edlin, S.; Mascarenhas, S.; Shim, Y.-M. Quantification of the Psychoacoustic Effect of Noise from Small Unmanned Aerial Vehicles. Int. J. Environ. Res. Public Health 2021, 18, 8893. [Google Scholar] [CrossRef] [PubMed]
- Lamotte, L.P.; Baron, V.; Bouley, S. UAV detection from acoustic signature: Requirements and state of the art. In QUIET DRONES International e-Symposium on UAV/UAS Nois; INCEEUROPE—Centre d’Information sur le Bruit: Paris, France, 2020. [Google Scholar]
- Alexander, W.N.; Whelchel, J.; Intaratep, N.; Trani, A. Predicting community noise of sUAS. In Proceedings of the 25th AIAA/CEAS Aeroacoustics Conference, Delft, The Netherlands, 20–23 May 2019. [Google Scholar]
- Schäffer, B.; Pieren, R.; Heutschi, K.; Wunderli, J.; Becker, S. Drone Noise Emission Characteristics and Noise Effects on Humans—A Systematic Review. Int. J. Environ. Res. Public Health 2021, 18, 5940. [Google Scholar] [CrossRef] [PubMed]
- Cussen, K.; Garruccio, S.; Kennedy, J. UAV Noise Emission—A Combined Experimental and Numerical Assessment. Acoustics 2022, 4, 297–312. [Google Scholar] [CrossRef]
- Torija, A.J.; Roberts, S.; Woodward, R.; Flindell, I.H.; McKenzie, A.R.; Self, R.H. On the assessment of subjective response to tonal content of contemporary aircraft noise. Appl. Acoust. 2019, 146, 190–203. [Google Scholar] [CrossRef] [Green Version]
- Gwak, D.Y.; Han, D.; Lee, S. Sound quality factors influencing annoyance from hovering UAV. J. Sound Vib. 2020, 489, 115651. [Google Scholar] [CrossRef]
- Christian, A.W.; Cabell, R. Initial investigation into the psychoacoustic properties of small unmanned aerial system noise. In Proceedings of the 23rd AIAA/CEAS Aeroacoustics Conference, Denver, CO, USA, 5–9 June 2017. [Google Scholar]
- Torija, A.J.; Clark, C. A psychoacoustic approach to building knowledge about human response to noise of unmanned aerial vehicles. Int. J. Environ. Res. Public Health 2021, 18, 682. [Google Scholar] [CrossRef] [PubMed]
- Torija, A.J.; Nicholls, R.K. Investigation of Metrics for Assessing Human Response to Drone Noise. Int. J. Environ. Res. Public Health 2022, 19, 3152. [Google Scholar] [CrossRef] [PubMed]
- WHO. Night Noise Guidelines for Europe; WHO Regional Office Europe: Charlotte, NC, USA, 2009. [Google Scholar]
- Read, D.R.; Senzig, D.A.; Cutler, C.J.; Elmore, E.; He, H. Noise Measurement Report: Unconventional Aircraft-Choctaw Nation of Oklahoma: July 2019; Volpe, J.A., Ed.; National Transportation Systems Center: Cambridge, MA, USA, 2020. [Google Scholar]
- Kloet, N.; Watkins, S.; Clothier, R. Acoustic signature measurement of small multi-rotor unmanned aircraft systems. Int. J. Micro Air Veh. 2017, 9, 3–14. [Google Scholar] [CrossRef]
- Torija, A.J.; Self, R.H.; Lawrence, J.L. Psychoacoustic characterisation of a small fixed-pitch quadcopter. In Proceedings of the INTER-NOISE and NOISE-CON Congress and Conference Proceedings, Madrid, Spain, 16–19 June 2019; Institute of Noise Control Engineering: Reston, VA, USA, 2019. [Google Scholar]
- Kloet, N.; Watkins, S.; Wang, X.; Prudden, S.; Clothier, R.; Palmer, J. Drone on: A preliminary investigation of the acoustic impact of unmanned aircraft systems (UAS). In Proceedings of the 24th International Congress on Sound and Vibration, London, UK, 23–27 July 2017. [Google Scholar]
- Bian, H.; Fattah, R.J.; Sun, Y.; Zhang, X. Noise prediction of drones in urban environments. In Proceedings of the 25th AIAA/CEAS Aeroacoustics Conference, Delft, The Netherlands, 20–23 May 2019. [Google Scholar]
- Kapoor, R.; Ramasamy, S.; Gardi, A.; Van Schyndel, R.; Sabatini, R. Acoustic Sensors for Air and Surface Navigation Applications. Sensors 2018, 18, 499. [Google Scholar] [CrossRef] [PubMed] [Green Version]
- ISO 9613-2:1996; Acoustics—Attenuation of Sound during Propagation Outdoors, in Part 2: General Method Calculation. International Standards Organization: Geneva, Switzerland, 1996.
- Salomons, E.M. Computational Atmospheric Acoustics; Springer Science & Business Media: Berlin/Heidelberg, Germany, 2001. [Google Scholar]
- Hansen, C.H. Fundamentals of Acoustics. In Occupational Exposure to Noise: Evaluation, Prevention and Control; World Health Organization: Geneva, Switzerland, 2001; pp. 23–52. [Google Scholar]
- Kapoor, R.; Kloet, N.; Gardi, A.; Mohamed, A.; Sabatini, R. Sound Propagation Modelling for Manned and Unmanned Aircraft Noise Assessment and Mitigation: A Review. Atmosphere 2021, 12, 1424. [Google Scholar] [CrossRef]
- Kinsler, L.E.; Frey, A.R.; Coppens, A.B.; Sanders, J.V. Fundamentals of Acoustics; John Wiley & Sons: Hoboken, NJ, USA, 2000. [Google Scholar]
- Min, S.; Lim, D.; Mavris, D.N. Aircraft Noise Reduction Technology and Airport Noise Analysis for General Aviation Revitalization. In Proceedings of the 15th AIAA Aviation Technology, Integration, and Operations Conference, Dallas, TX, USA, 22–26 June 2015. [Google Scholar]
- Beaulieu, G. Experimental Procedure for Measuring the Noise Annoyance from Multi-Rotor Maneuvers Using a UAV System [BR]-Integration Internship. Master’s Thesis, Université de Liège, Liège, Belgium, 2022. Master Thesis and Internship [BR]. [Google Scholar]
- BS EN ISO 12354-3:2017; Building Acoustics—Estimation of Acoustic Performance of Buildings from the Performance of Elements, in Part 3: Airborne Sound Insulation against Outdoor Sound. British Standard Institution: London, UK, 2017.
- Waters-Fuller, T.; Lurcock, D.; Mackenzie, R.; MacKenzie, R. NANR116: ‘Open/Closed Window Research’ Sound Insulation through Ventilated Domestic Windows; The Building Performance Centre, School of The Built Environment, Napier University: Edinburg, UK, 2007. [Google Scholar]
- Attenborough, K. Sound propagation in the atmosphere. In Springer Handbook of Acoustics; Springer: Berlin/Heidelberg, Germany, 2014; pp. 117–155. [Google Scholar]
- Asdrubali, F.; Desideri, U. Building Envelope. In Handbook of Energy Efficiency in Buildings; Asdrubali, F., Desideri, U., Eds.; Butterworth-Heinemann: Oxford, UK, 2019; pp. 295–439. [Google Scholar]
- Basner, M.; McGuire, S. WHO Environmental Noise Guidelines for the European Region: A Systematic Review on Environmental Noise and Effects on Sleep. Int. J. Environ. Res. Public Health 2018, 15, 519. [Google Scholar] [CrossRef] [PubMed] [Green Version]
- UK-CAA. Survey of Noise Attitudes 2014: Aircraft Noise and Annoyance, 2nd ed.; UK Civil Aviation Authority: Crawley, UK, 2021. [Google Scholar]
- Cavone, G.; Epicoco, N.; Carli, R.; Del Zotti, A.; Pereira, J.P.R.; Dotoli, M. Parcel Delivery with Drones: Multi-criteria Analysis of Trendy System Architectures. In Proceedings of the 2021 29th Mediterranean Conference on Control and Automation (MED), Puglia, Italy, 22–25 June 2021. [Google Scholar]
| Publisher’s Note: MDPI stays neutral with regard to jurisdictional claims in published maps and institutional affiliations. |
© 2022 by the authors. Licensee MDPI, Basel, Switzerland. This article is an open access article distributed under the terms and conditions of the Creative Commons Attribution (CC BY) license (https://creativecommons.org/licenses/by/4.0/).


 ,
, 


