
Downstream Transport of Geosmin Based on Harmful Cyanobacterial Outbreak Upstream in a Reservoir Cascade


Abstract
:1. Introduction
2. Materials and Methods
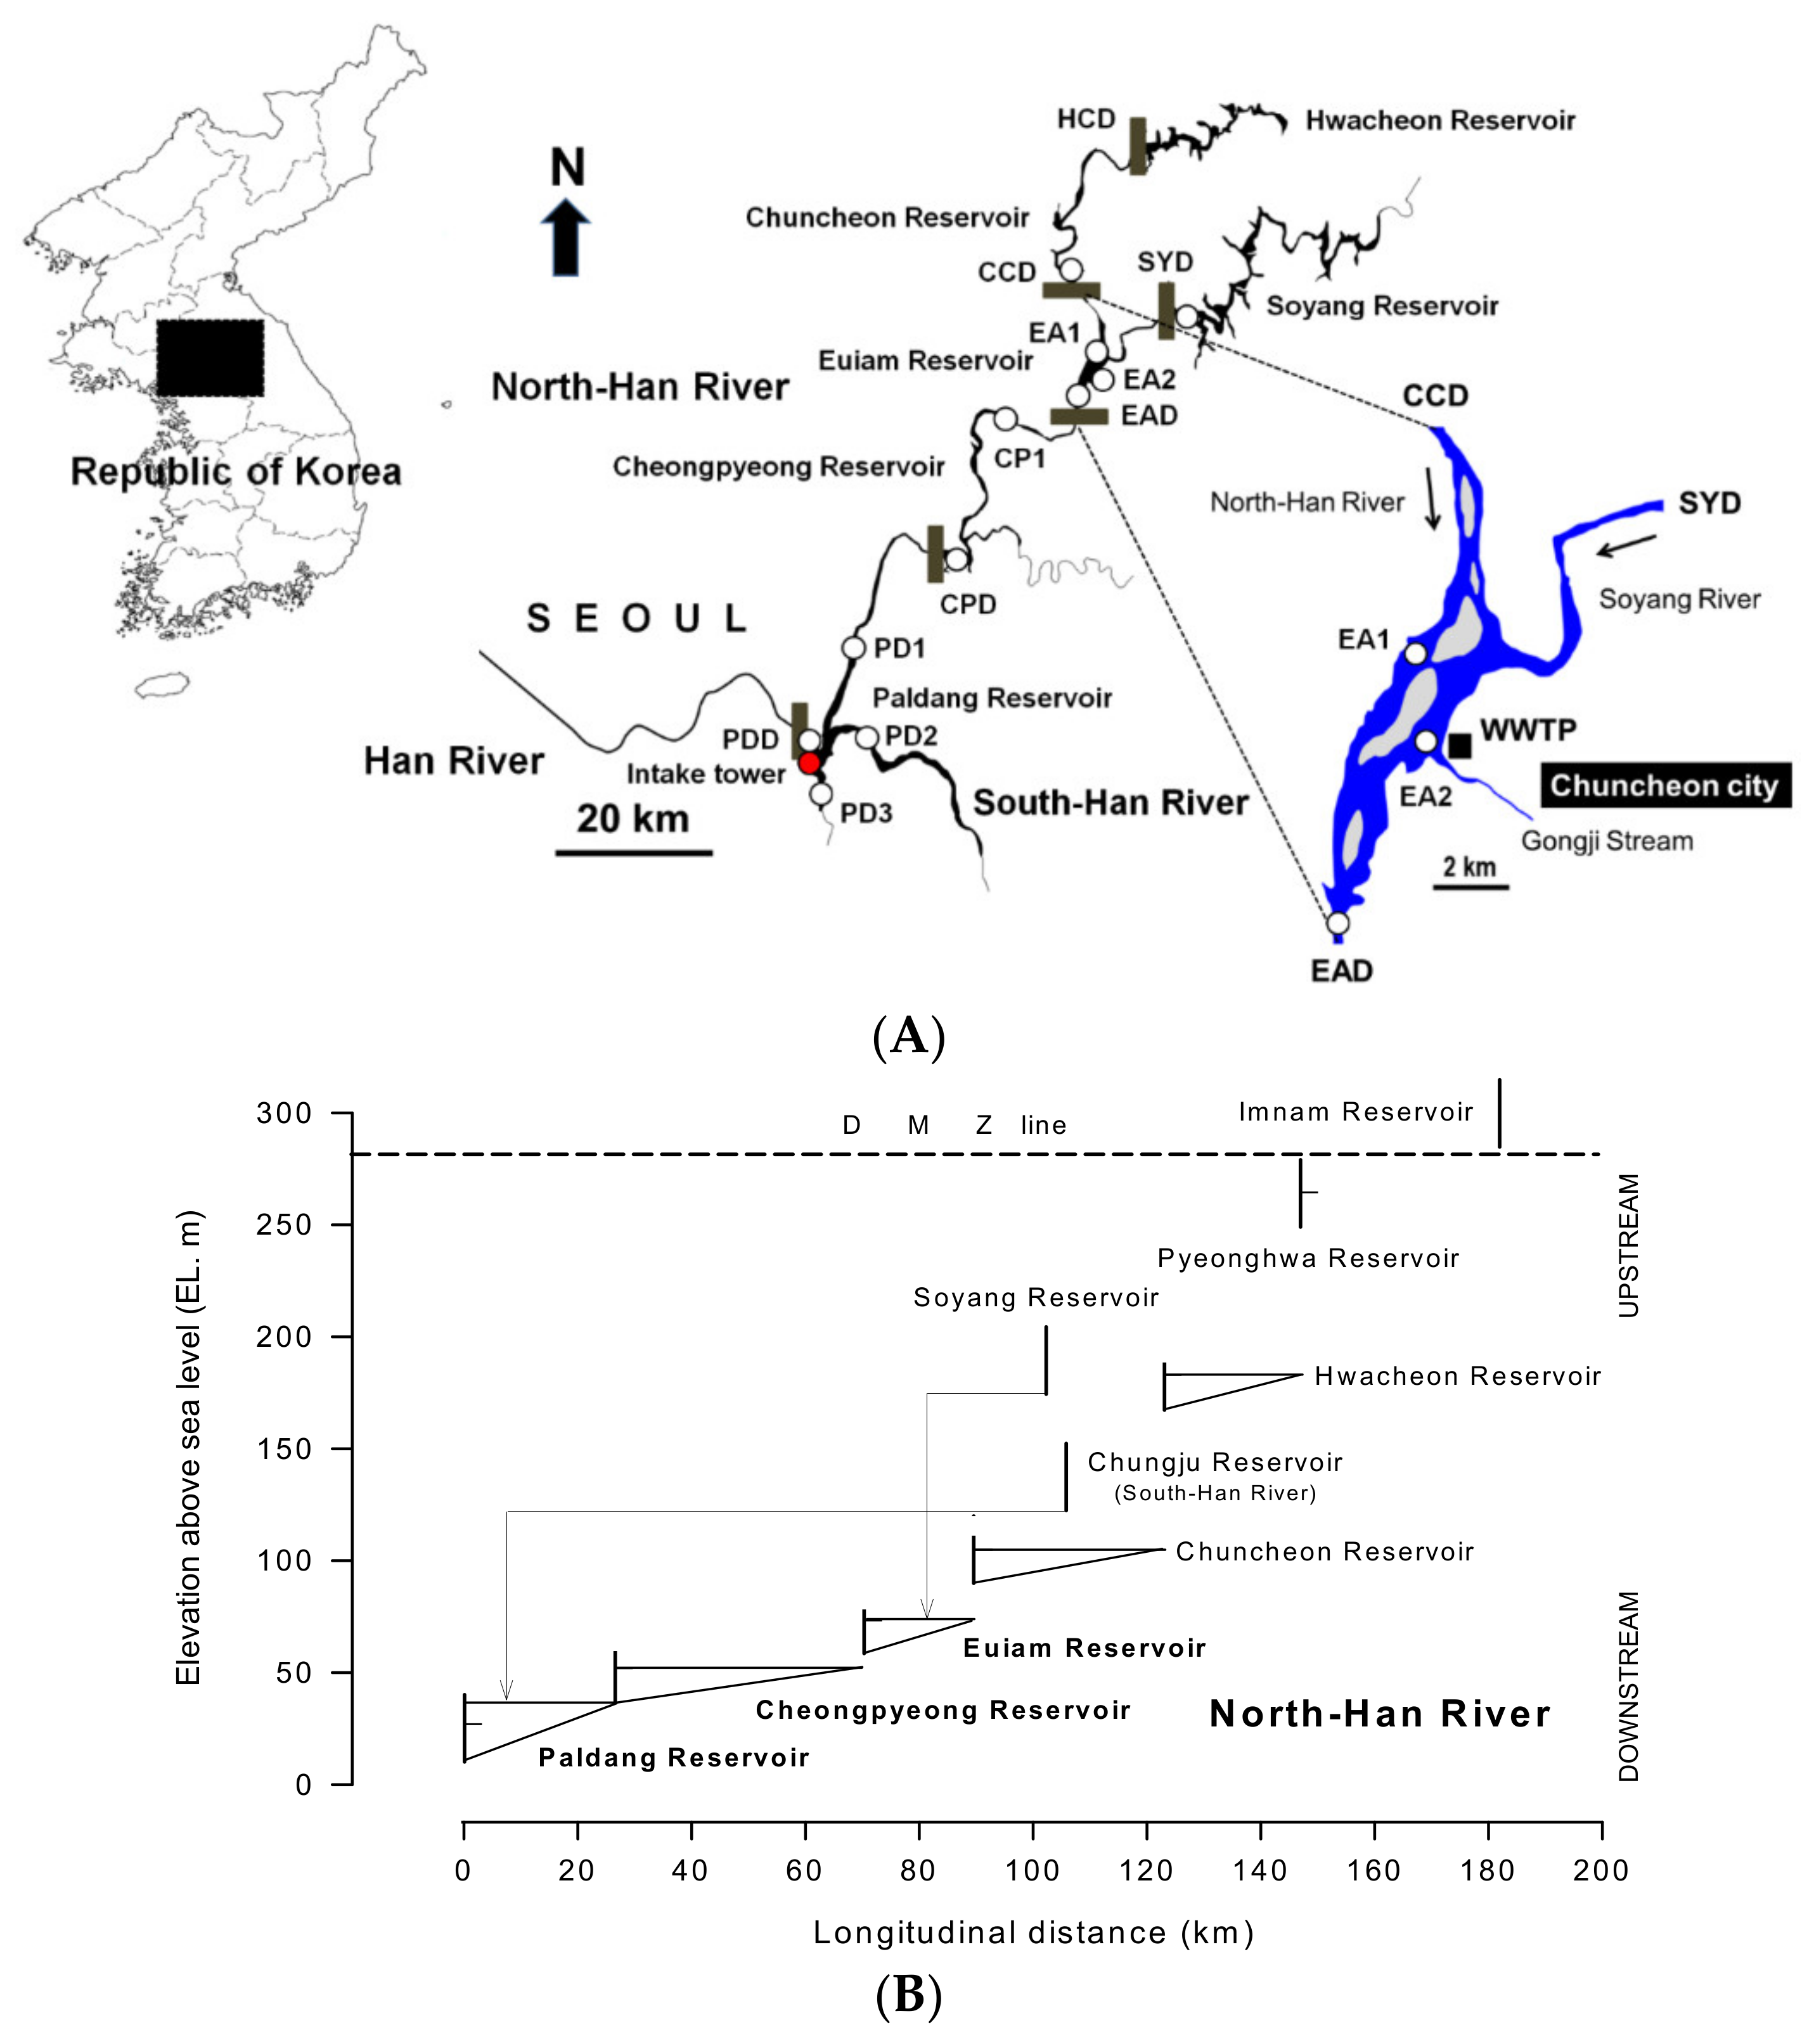
2.1. Description of the Study Site
2.2. Acquisition of Data on Rainfall, Hydrological Factors, and Water Quality
2.3. Field Survey and Water Quality Analysis
2.4. Descriptive Statistical Analysis
3. Results
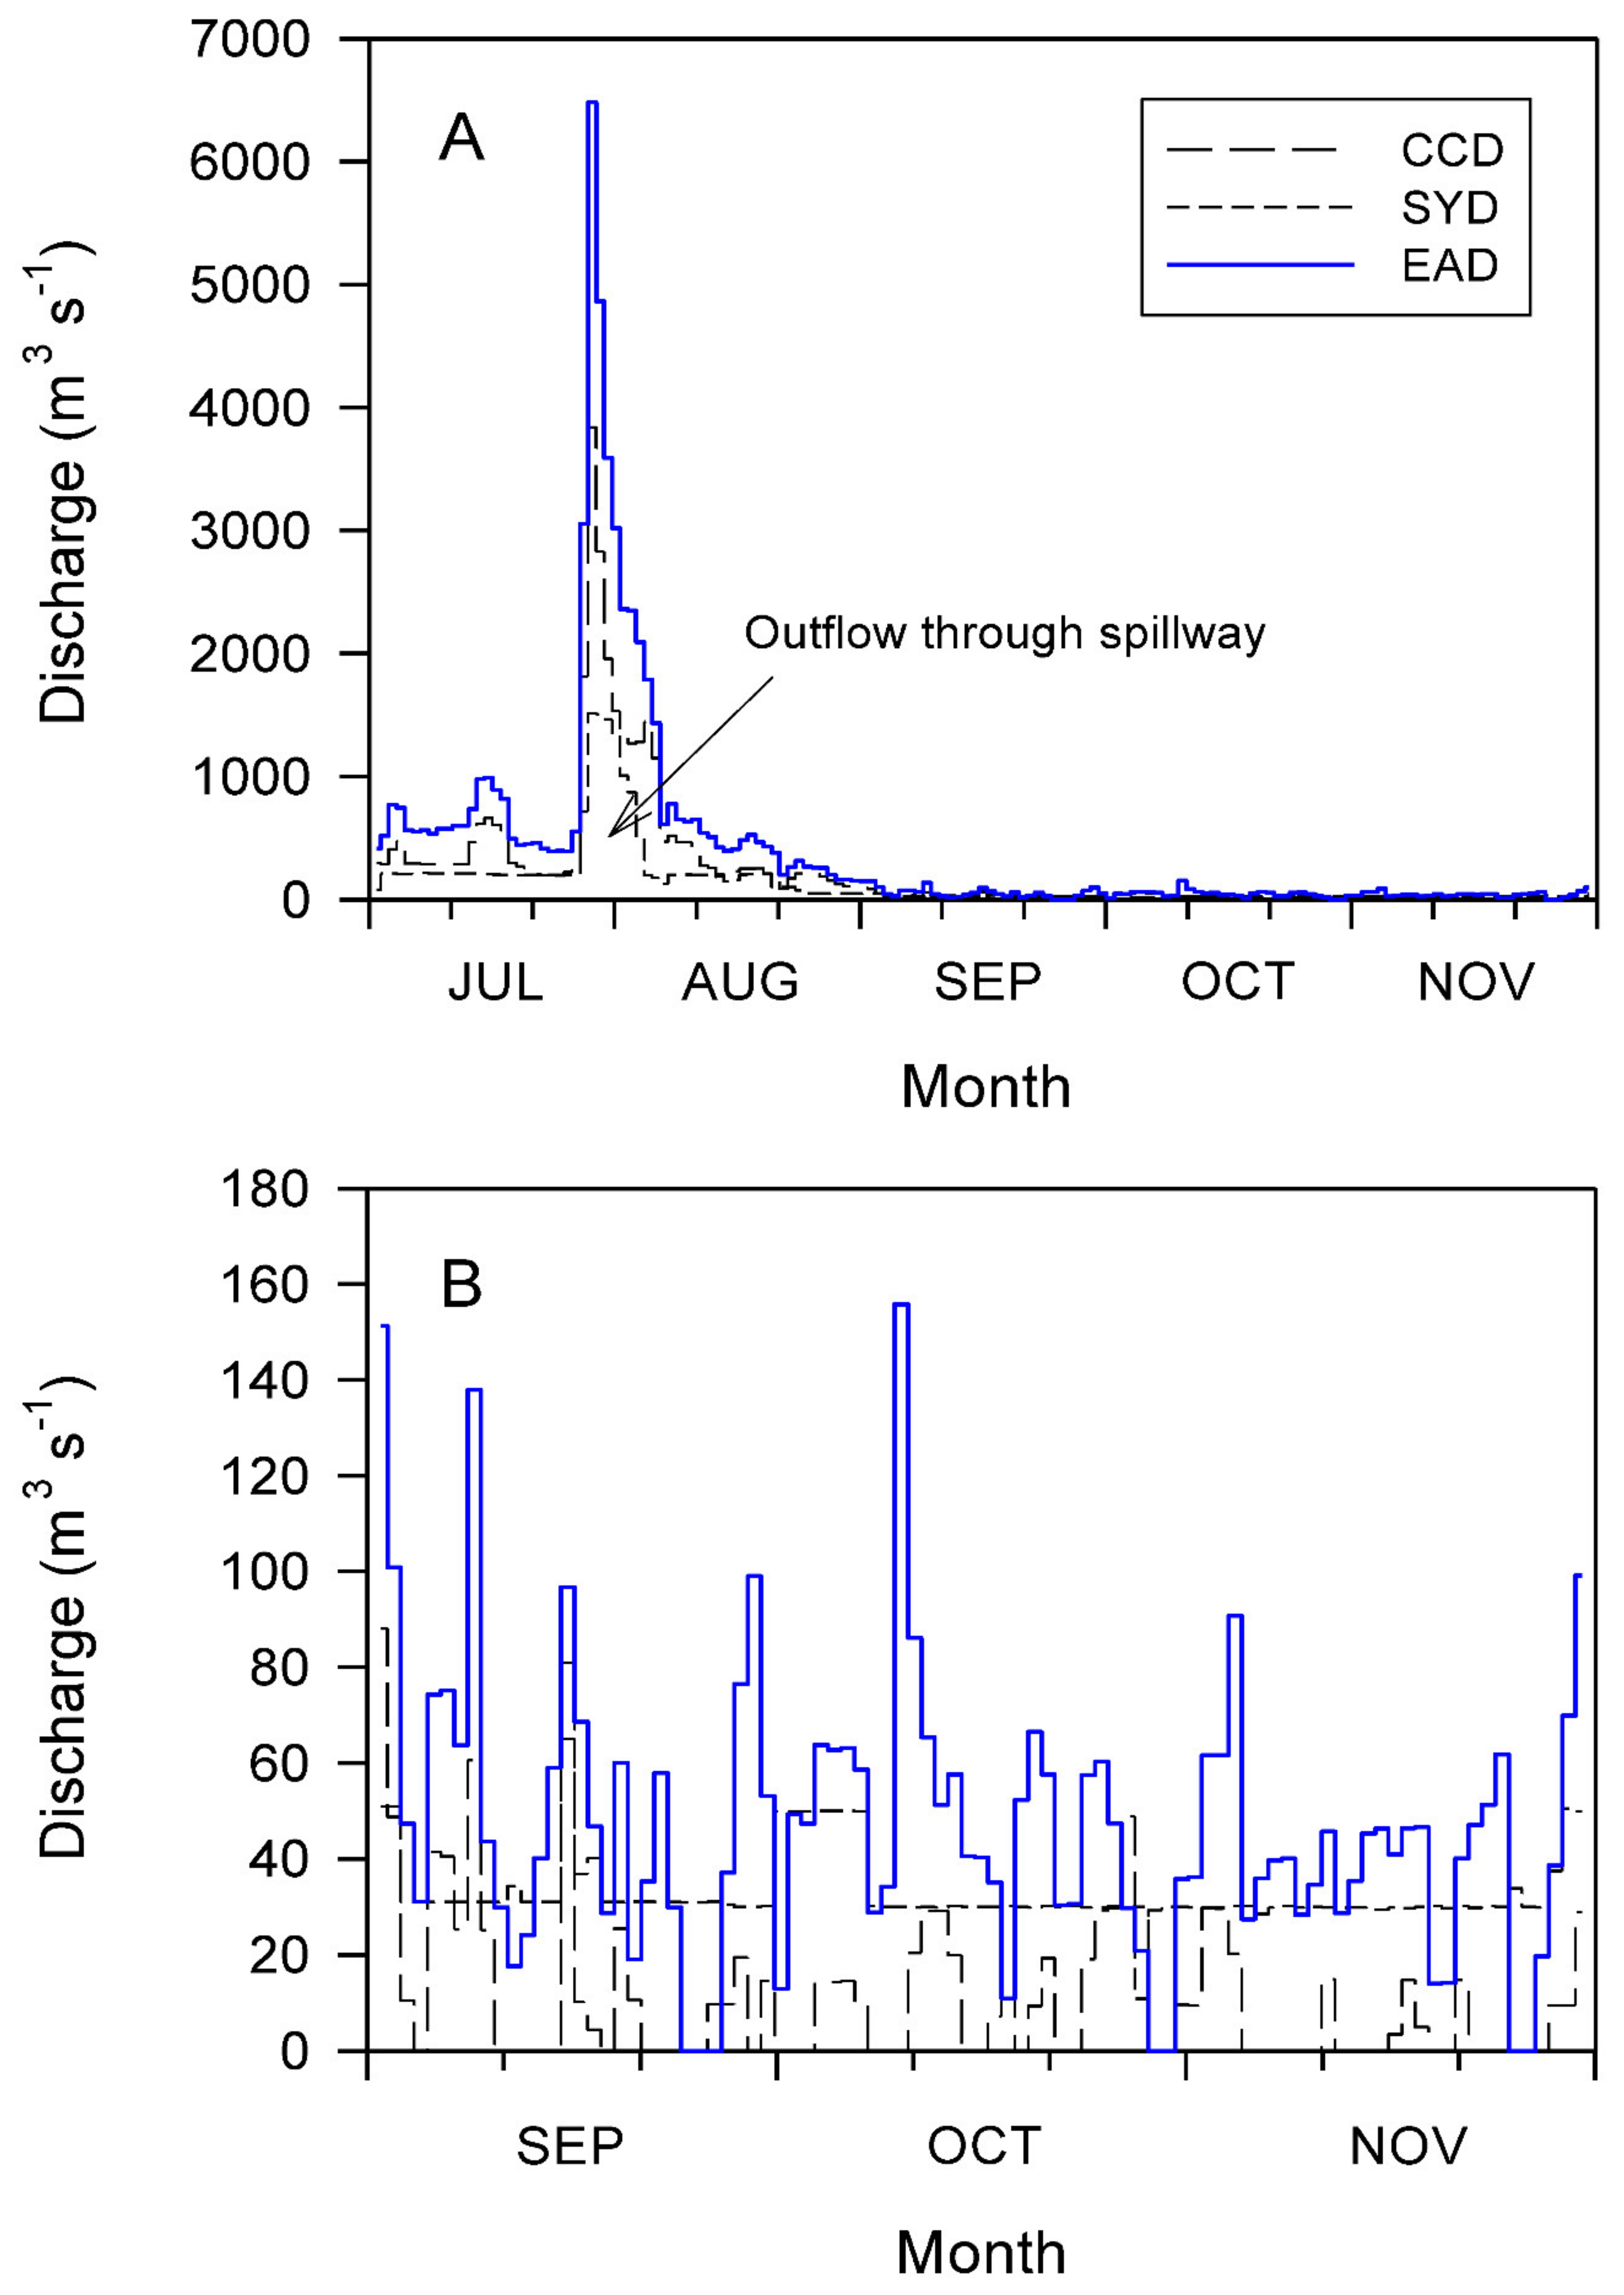
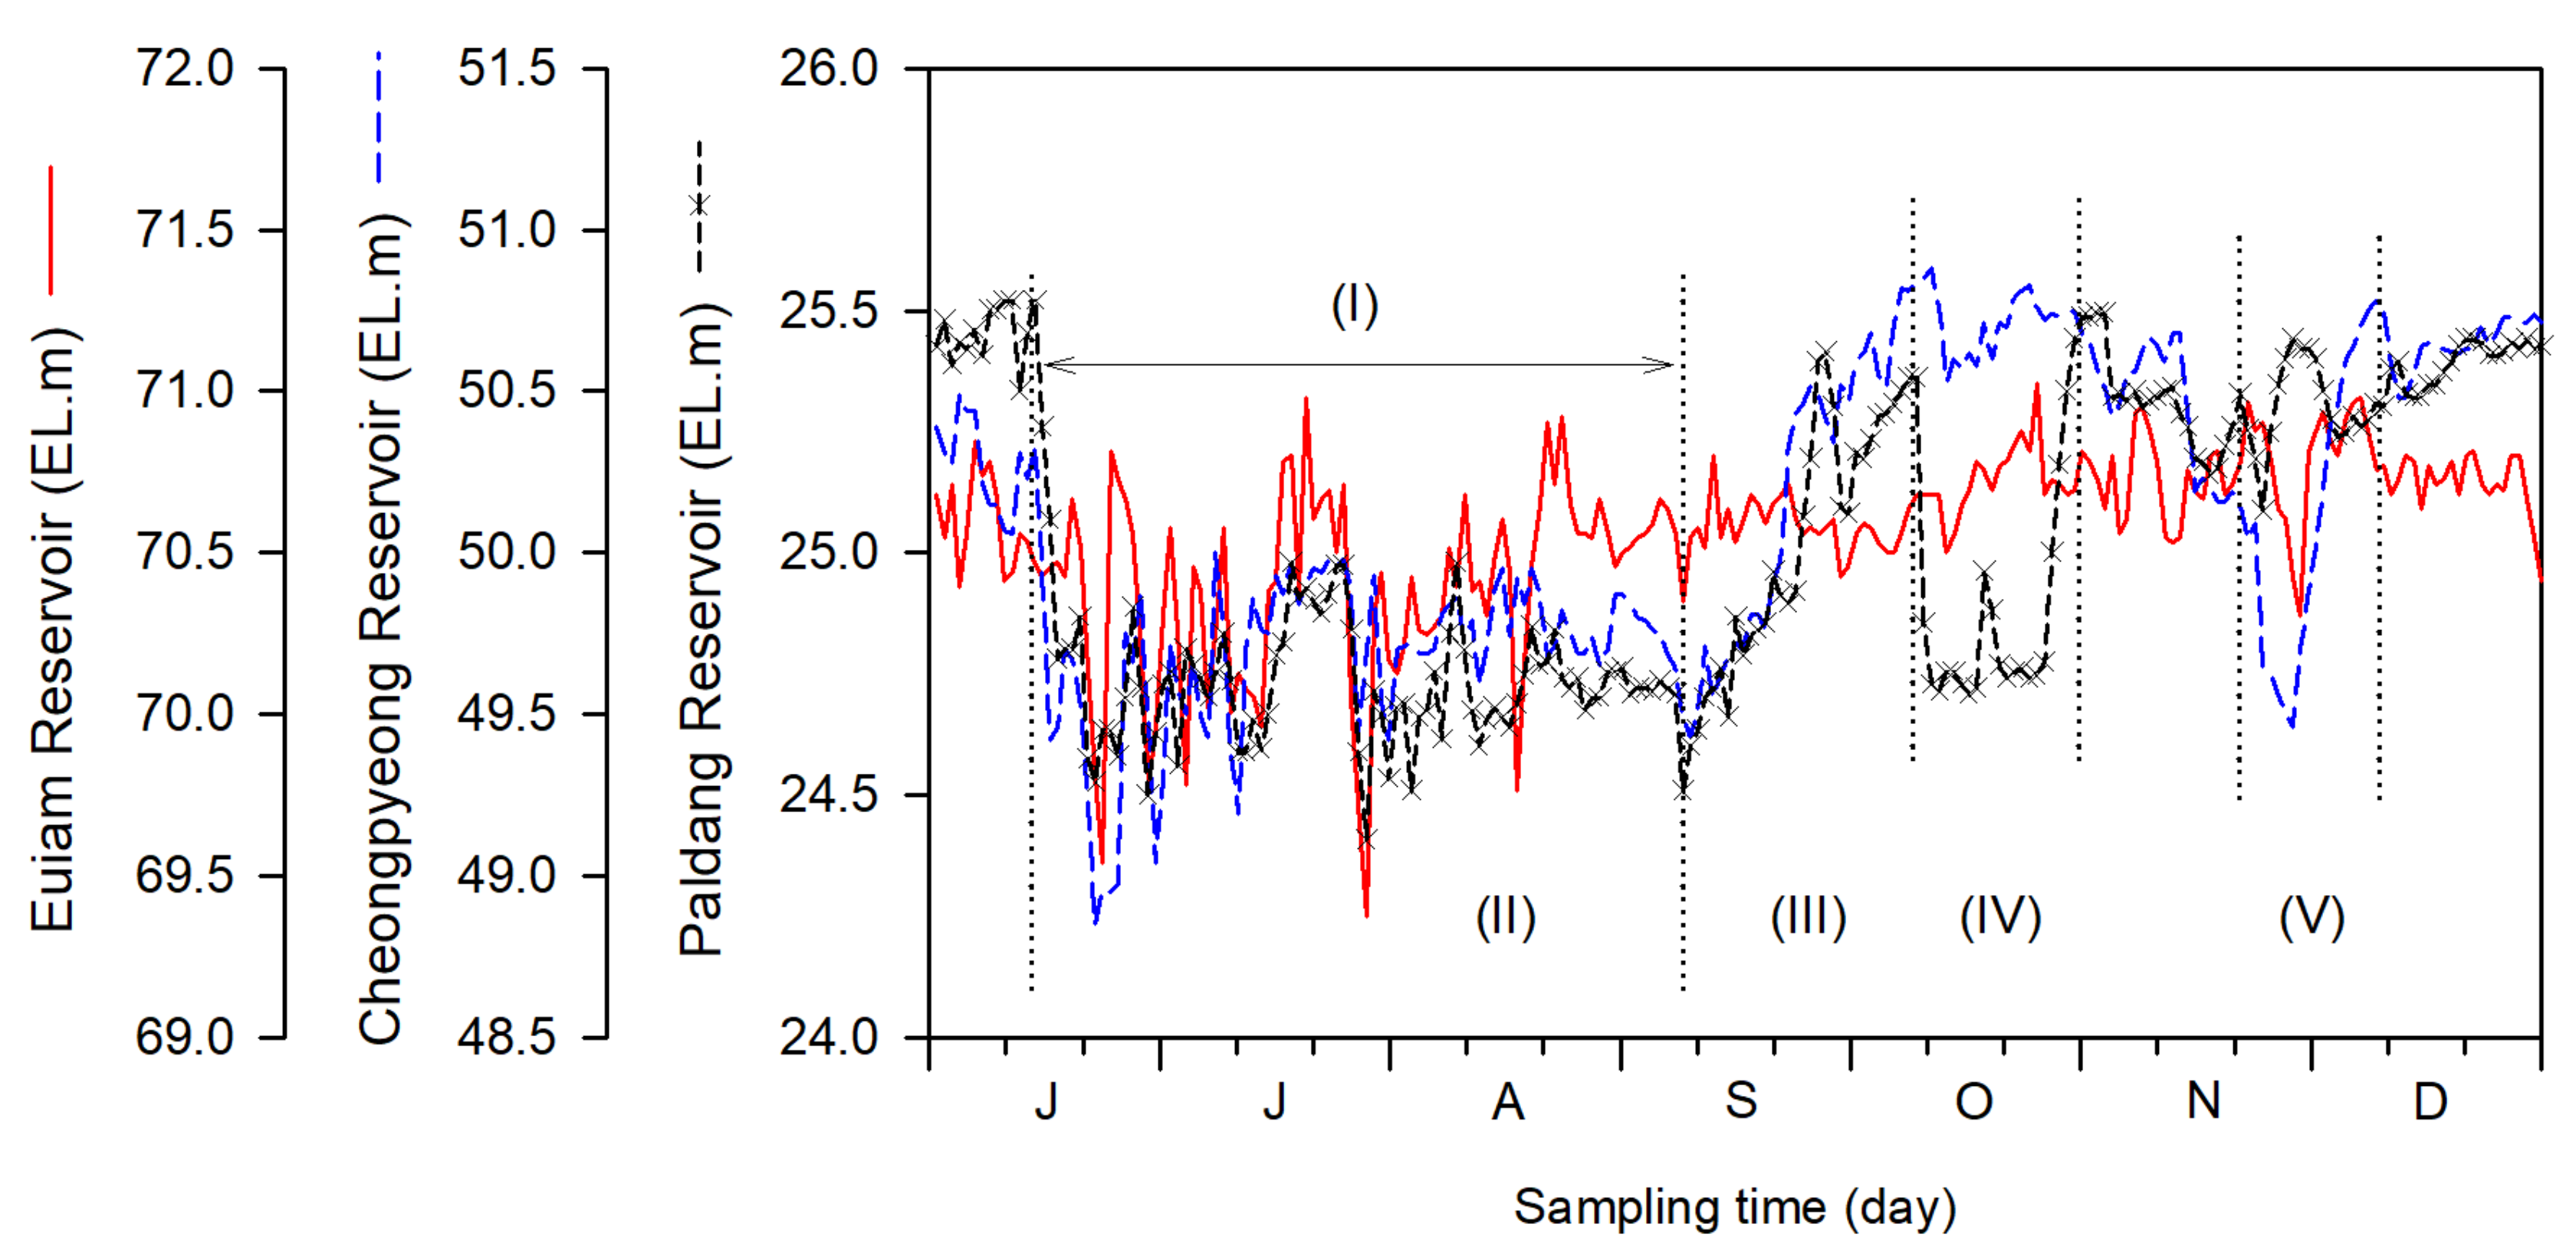
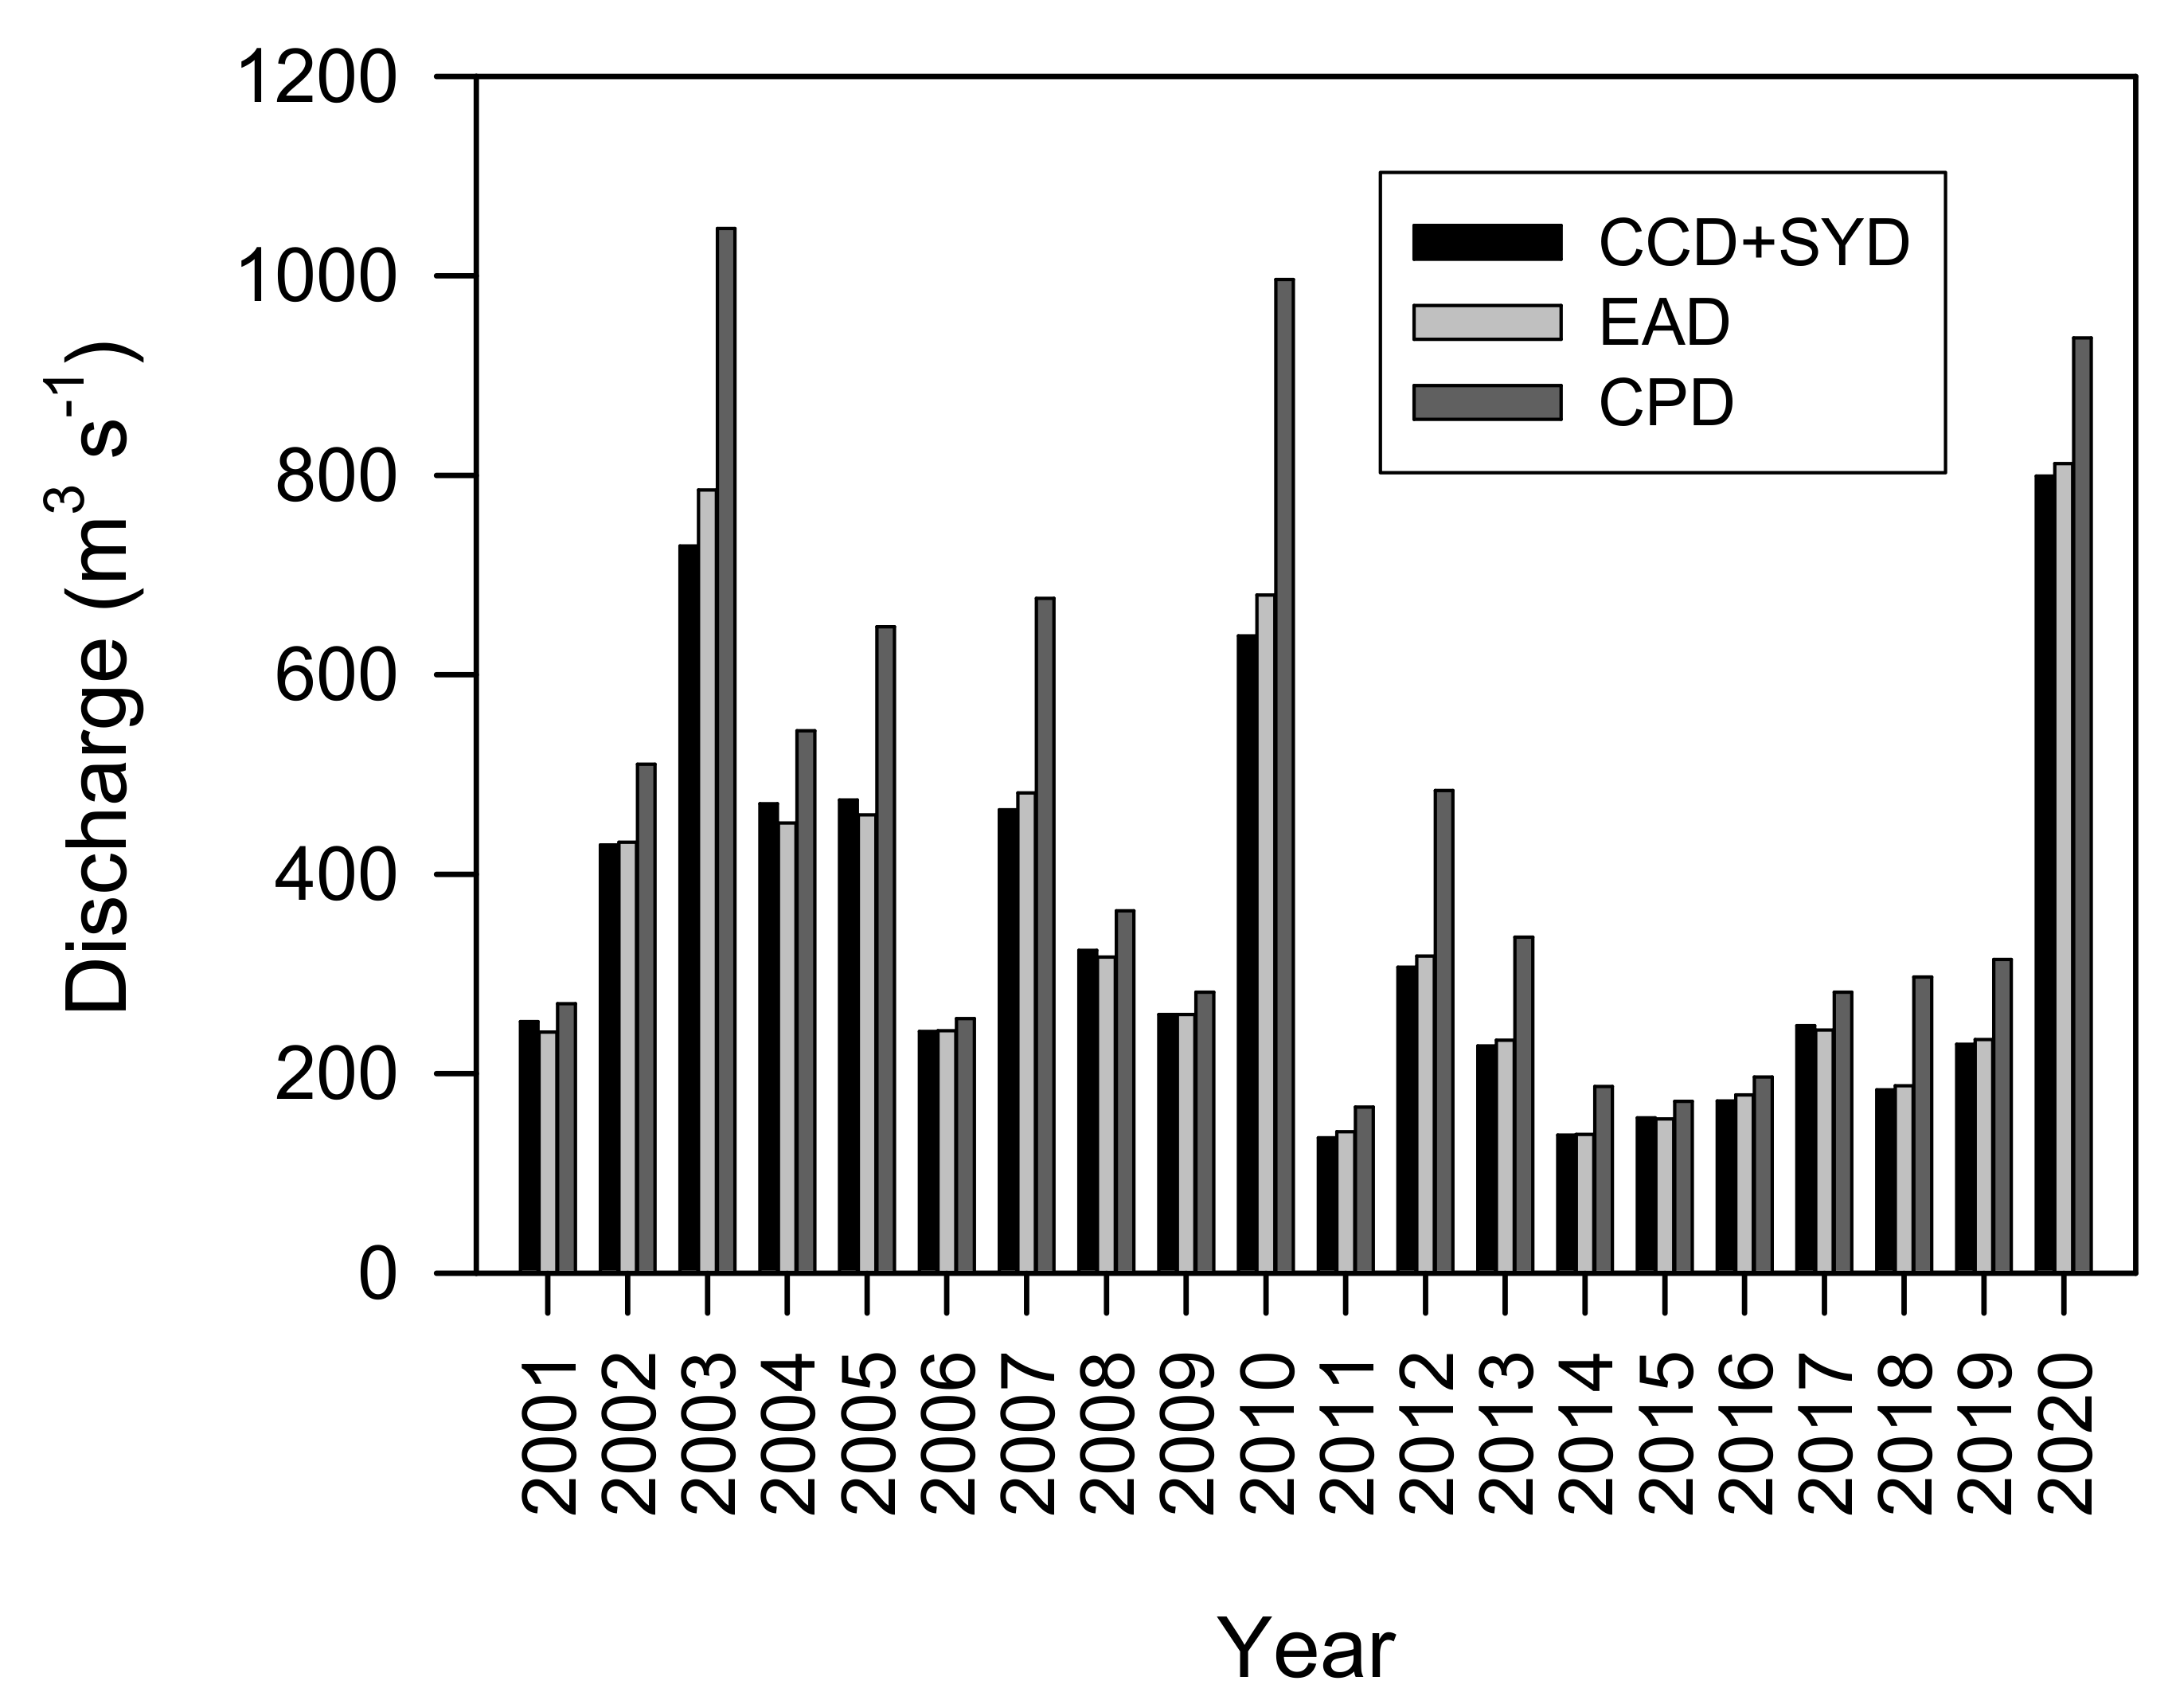
3.1. Characteristics of the Main Hydrometeorological Factors
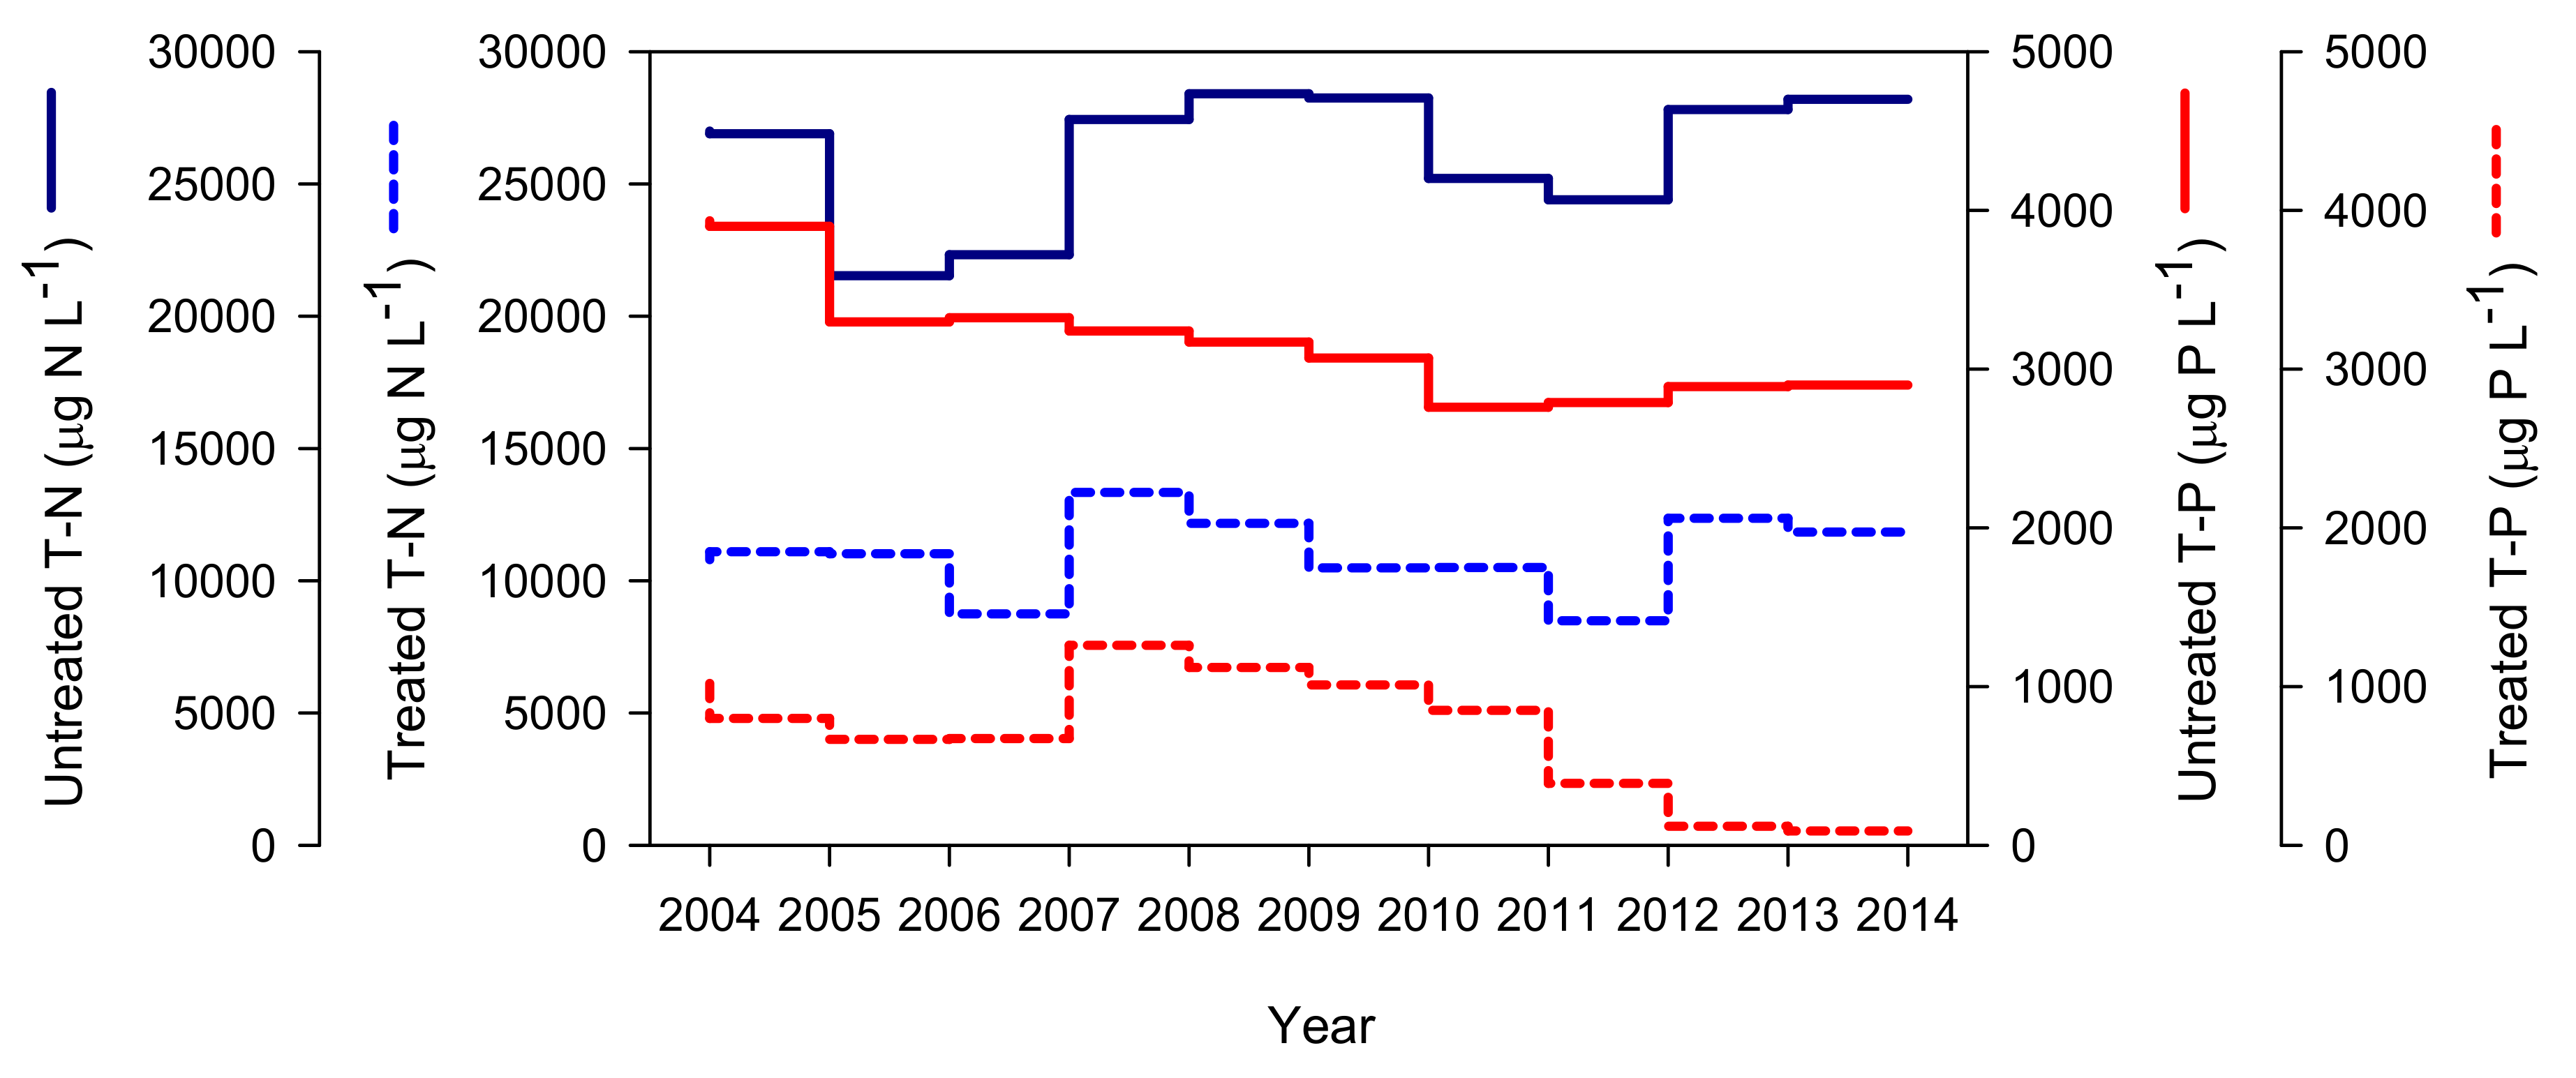
3.2. Annual Variations of TN and TP in Major Pollution Sources
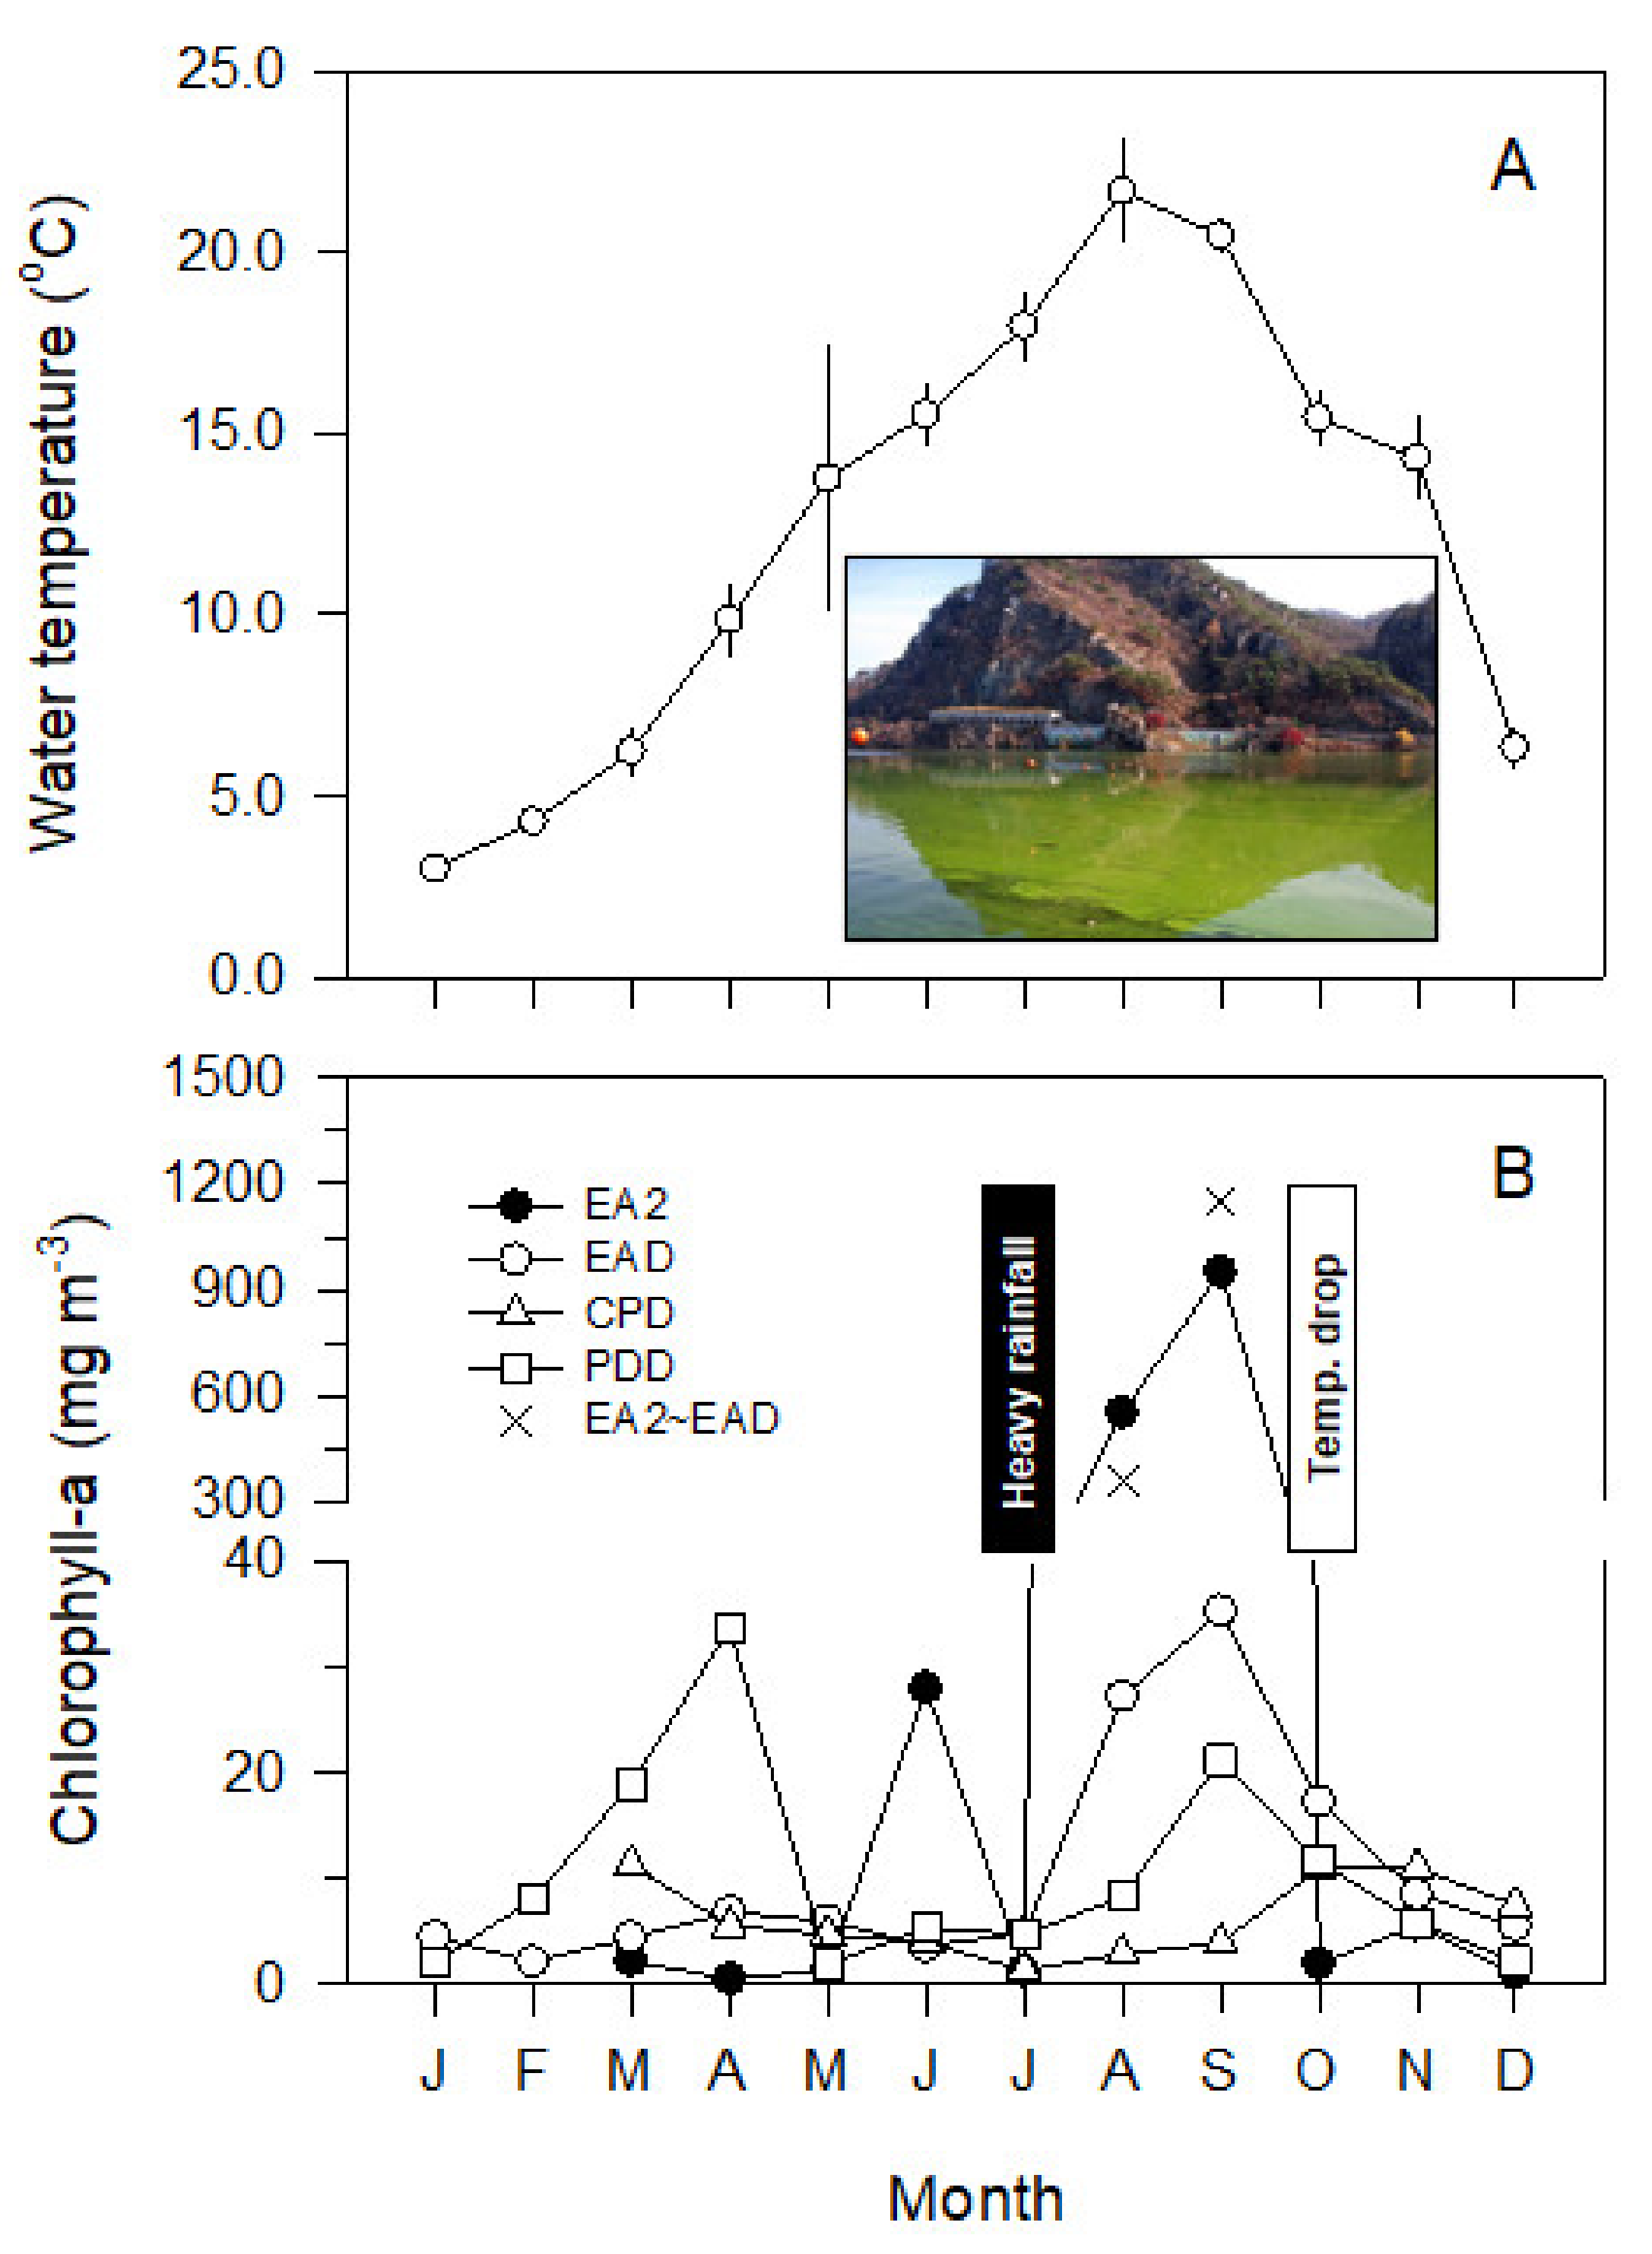
3.3. Monthly Variations of the Chl-a Concentration
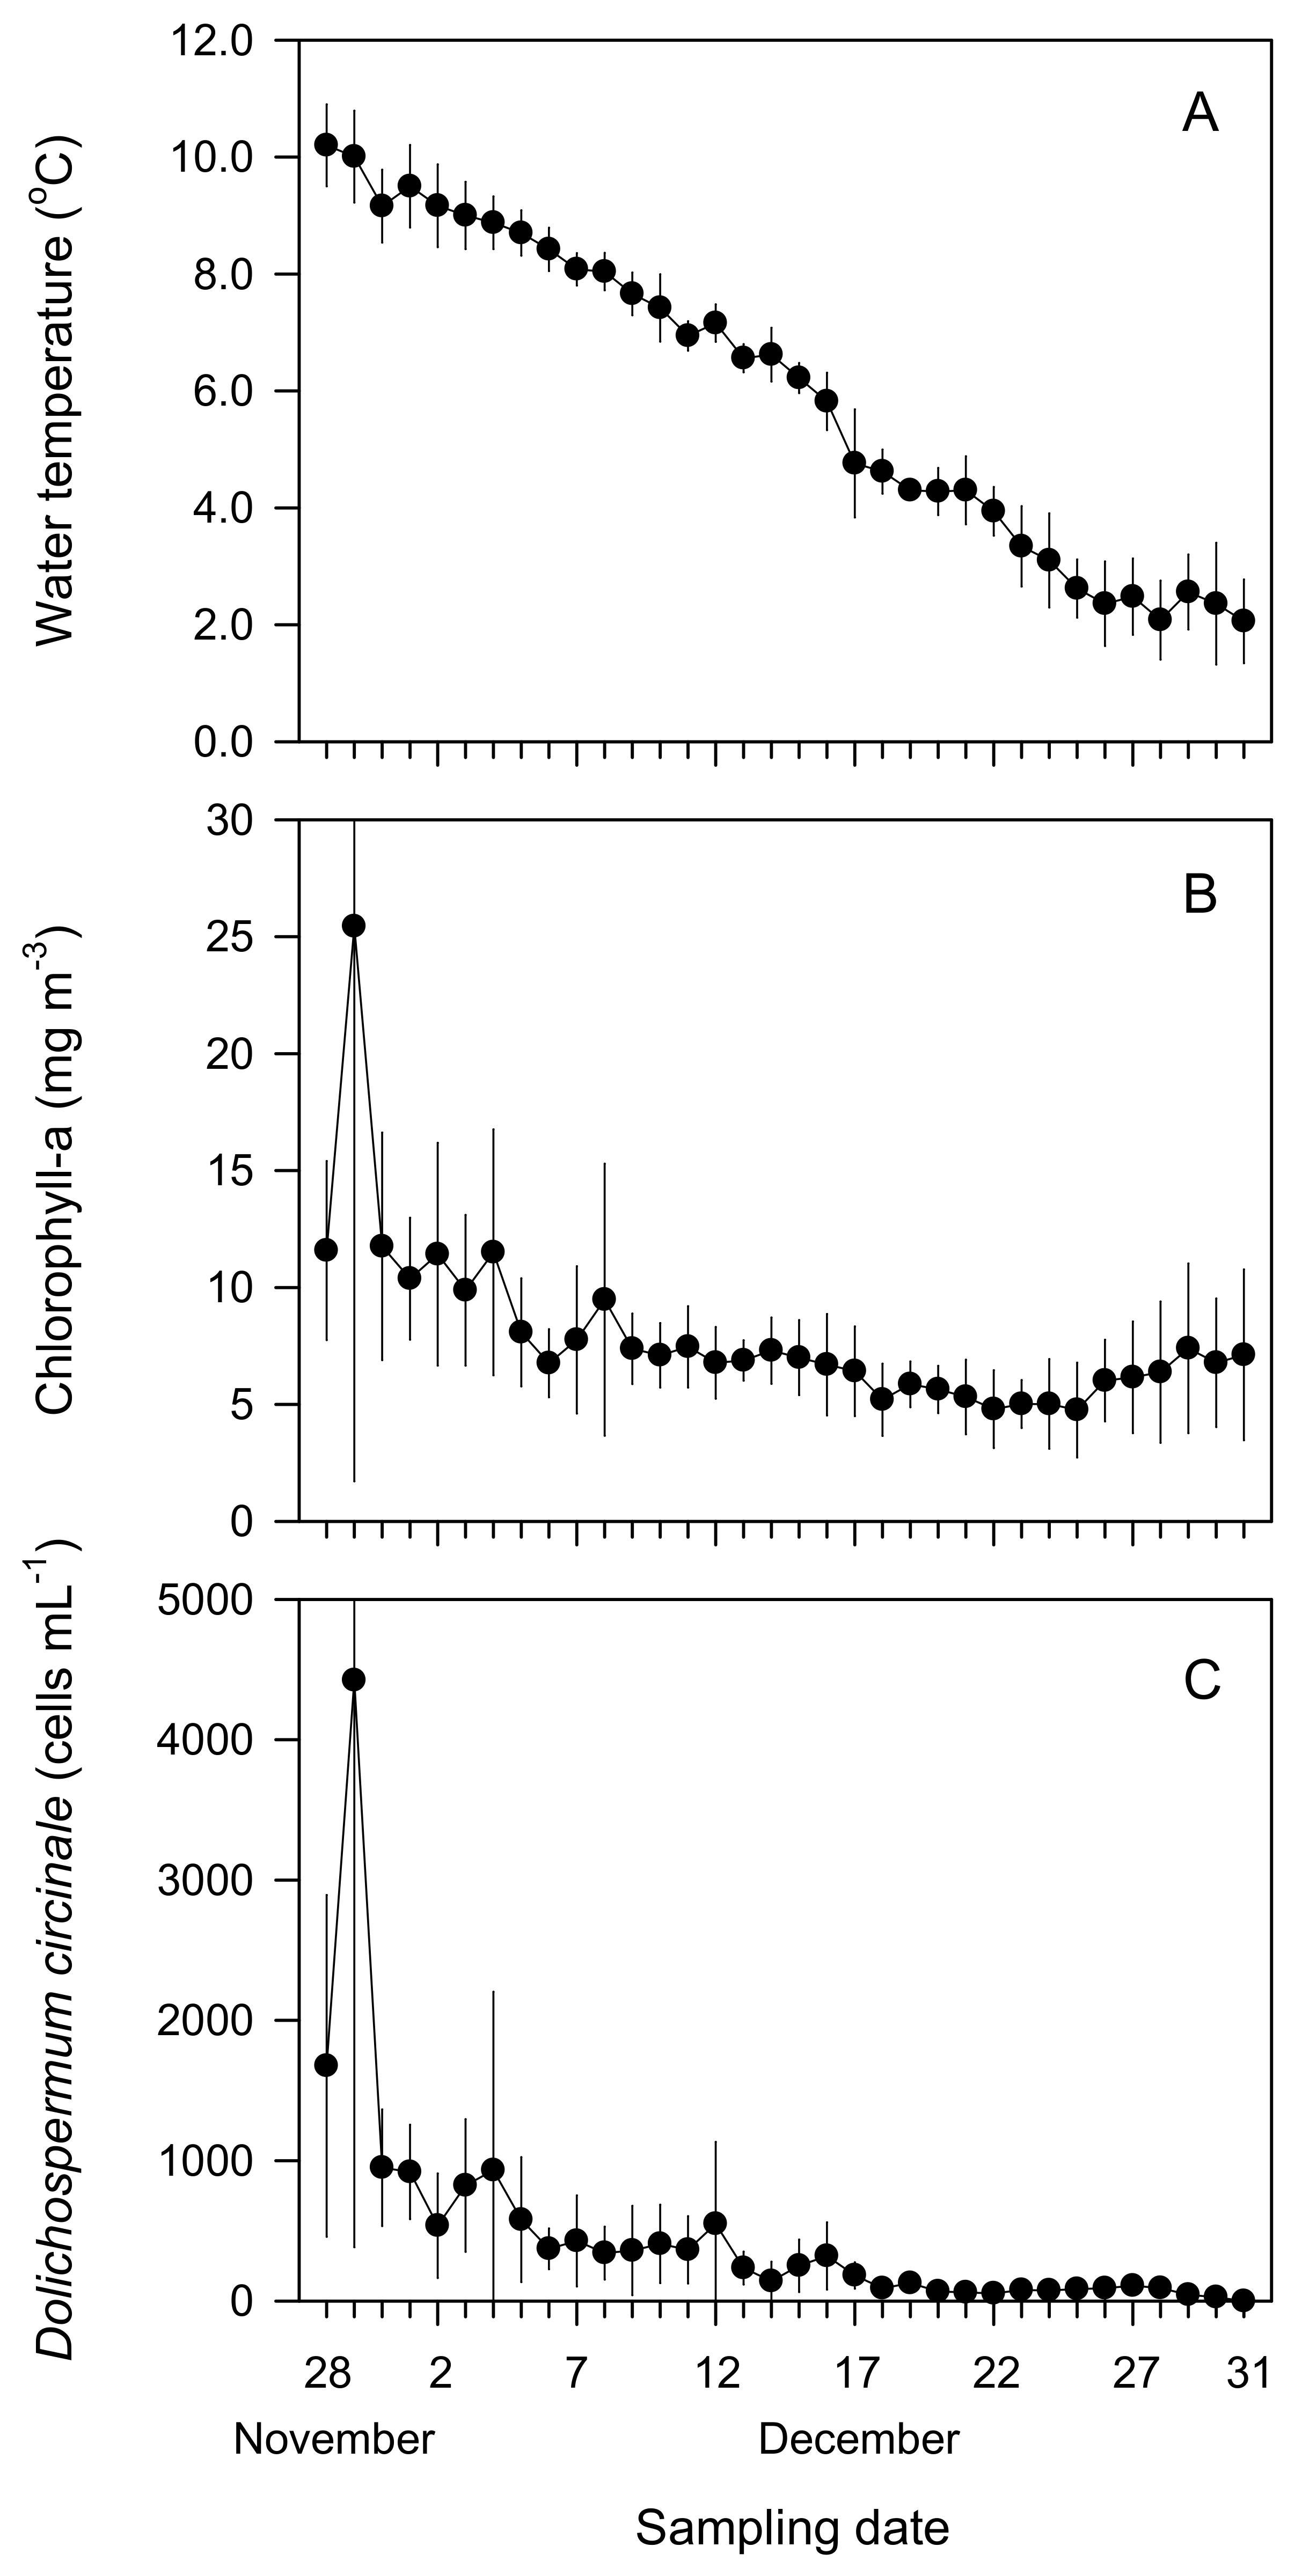
3.4. Short-Term Spatial and Temporal Distributions of Water Quality after the GSM Outbreak Event
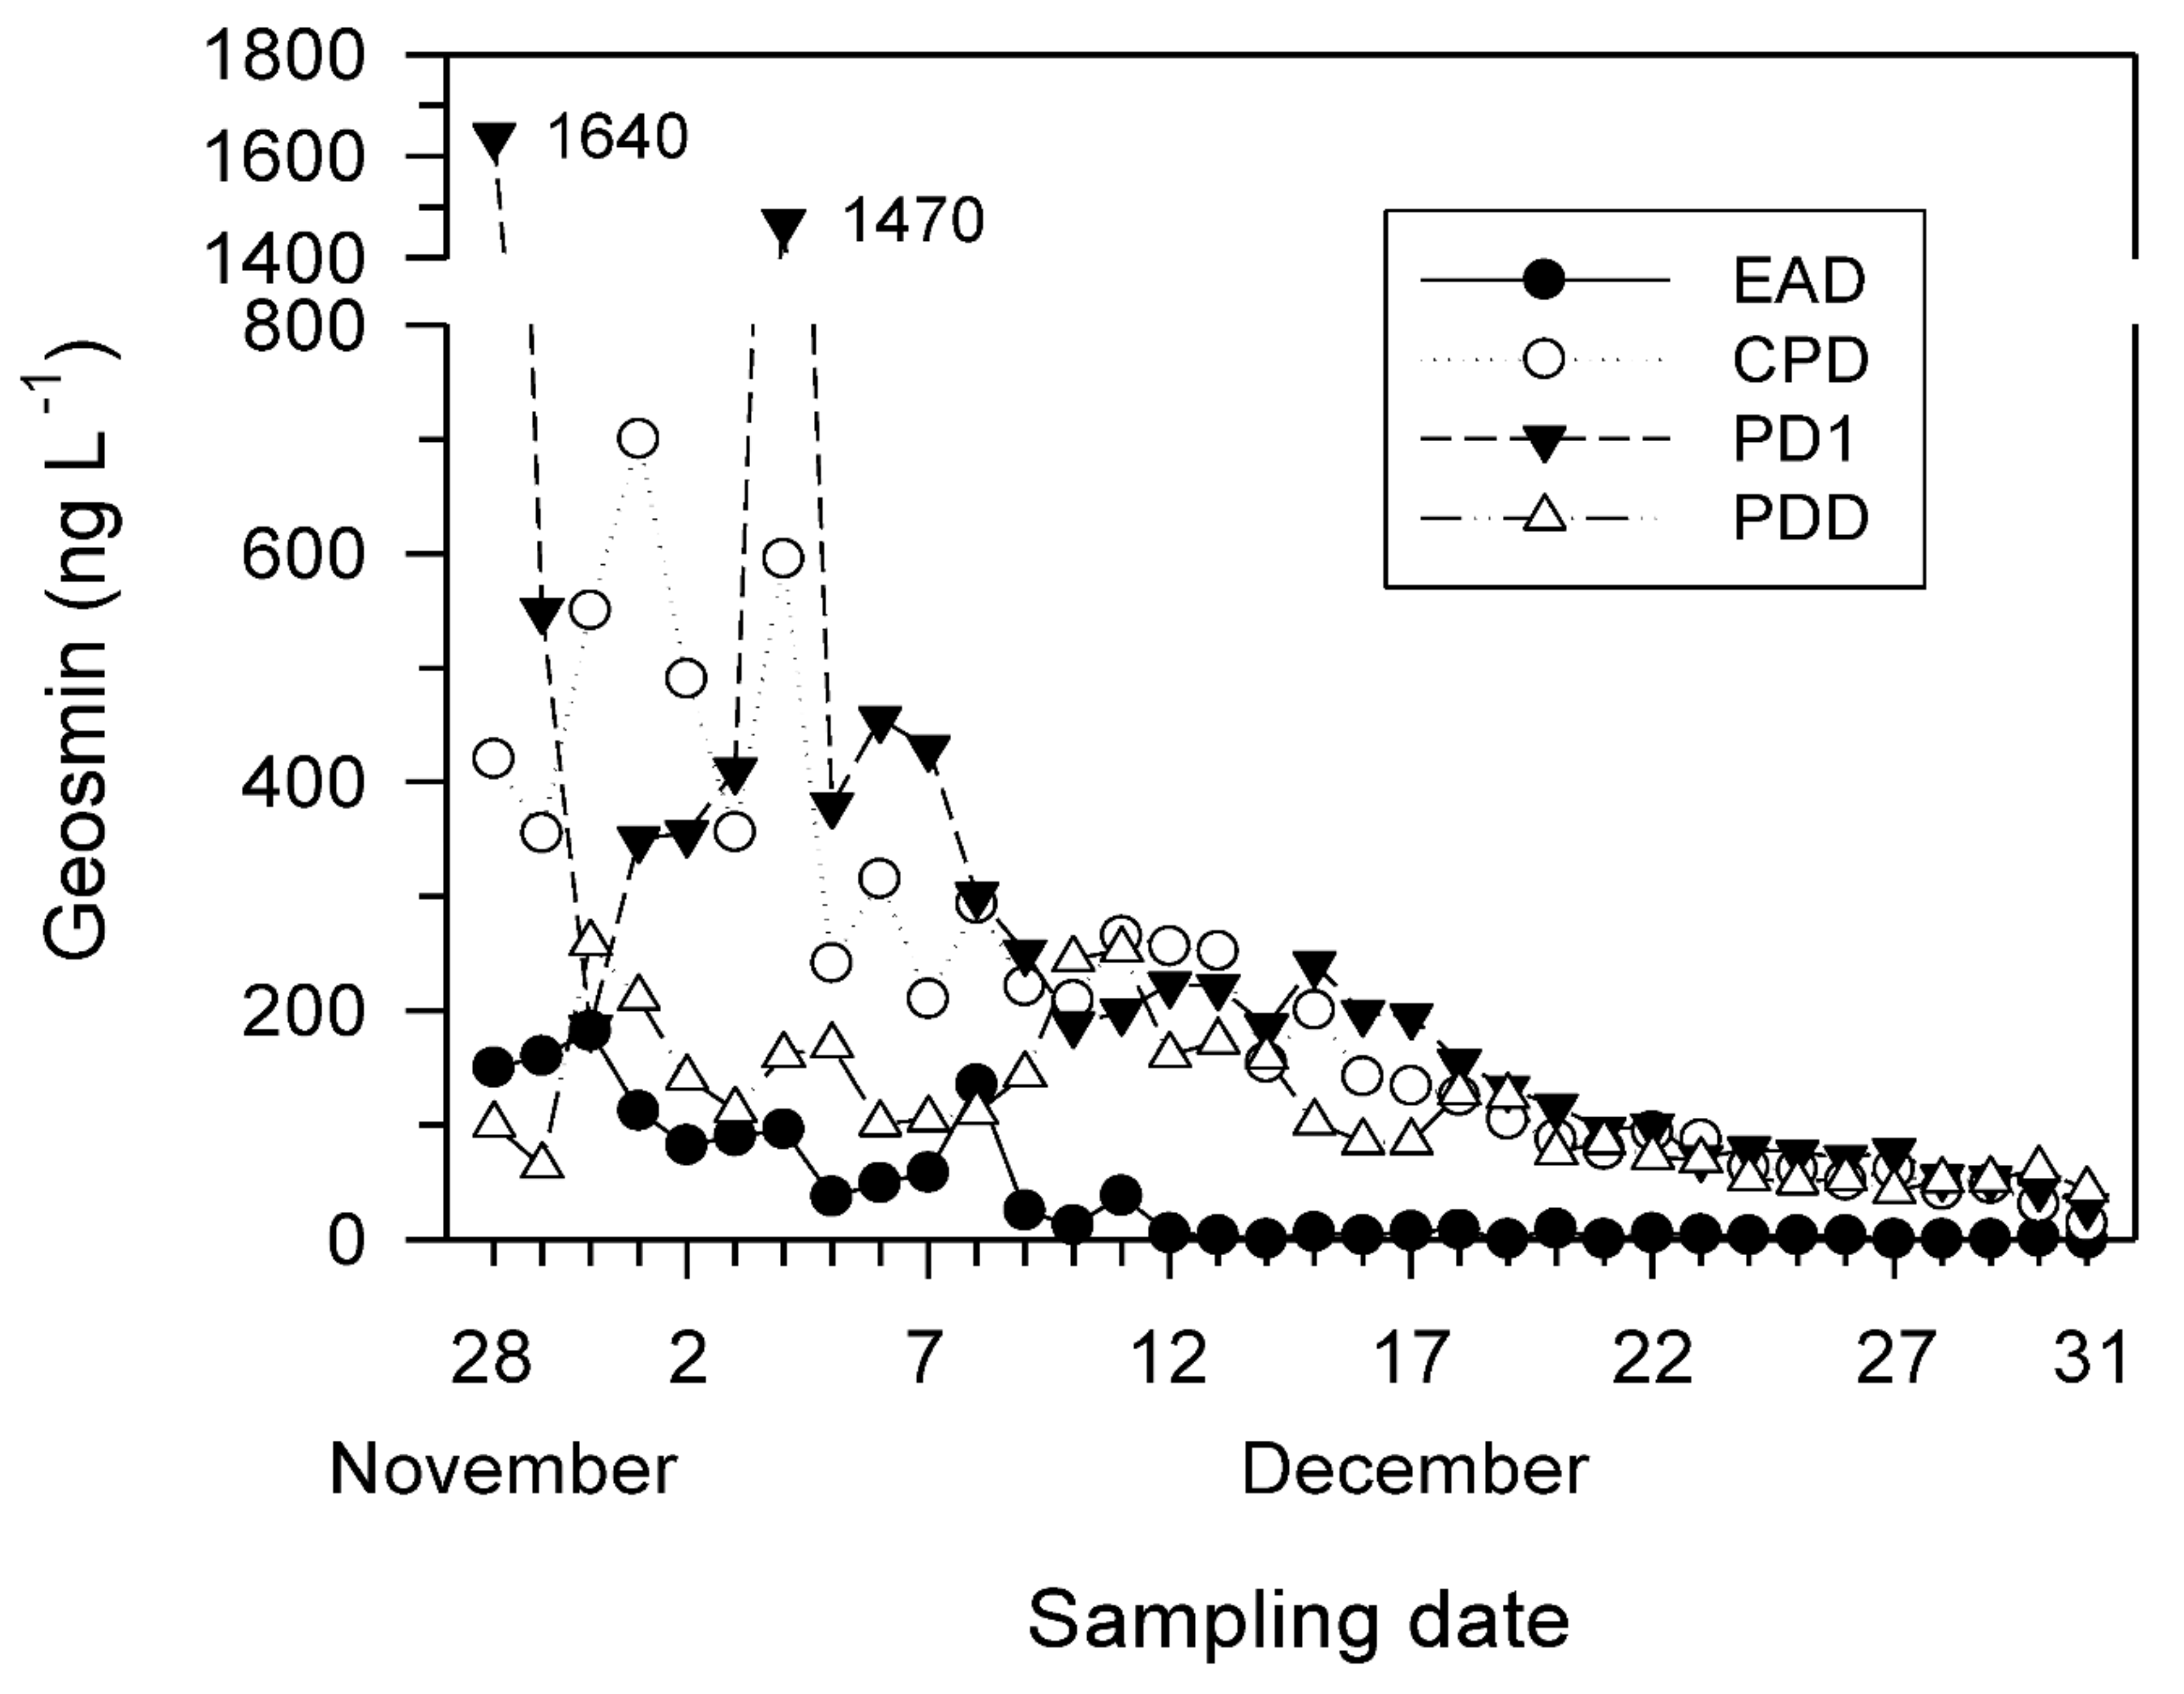
3.5. Short-Term Spatial and Temporal Distributions of the GSM Concentration after the GSM Outbreak Event
4. Discussion
4.1. Hydrological and Water Quality Characteristics in a Multiple-Reservoir Series
4.2. Source, Fate, and Effects of the Outbreak of a Harmful Cyanobacterial Bloom in an Upstream Reservoir
4.3. Fate and Transport of the Cyanobacterial Bloom and GSM in a Reservoir Cascade and Management Implications
5. Conclusions
Supplementary Materials
Author Contributions
Funding
Institutional Review Board Statement
Informed Consent Statement
Conflicts of Interest
Appendix A

| Country | Aquatic Ecosystems | Geosmin (ng L−1) | Dominant Species | Chlorophyll-a (mg m−3) | Standing crops (cells mL−1) | References |
|---|---|---|---|---|---|---|
| America | RI (St. Lawrence) | 5–20 | Periphyton | [23] | ||
| RE (Diamond Valley) | 750 | Ana. circinalis | – | – | [62] | |
| Australia | 4000 (0.01 pg cell−1) | – | – | – | [8] | |
| China | RE (Yanghe) | >7000 | Ana. spiroides | – | – | [89] |
| 7100 (0.1 pg cell−1) | Ana. spiroides | – | – | [9] | ||
| Japan | RE (Biwa) | 1050 | – | – | – | [90] |
| South Africa | 3170 | – | – | – | [11] | |
| Korea | RE (Paldang) | 1470–1640 | Ana. spiroides | – | 3185–3574 | [53] |
| 385 | Ana. circinalis | – | 2280 | [91] | ||
| RI (Geum) | 32–161 | – | – | – | [92] | |
| RE (Daecheong) | 5.3 | Ana. spiroides | 24.5 | 17,000 | [93] | |
| 11–303 | – | – | – | [92] | ||
| 21–963 | Anabaena sp. Aphanizomenon sp. Oscillatoria sp. | – | – | [94,95] | ||
| RI (Nakdong) | 4–24 | Microcystis sp. Aphanizomenon sp. | – | – | [96] | |
| RE (Dongbok) | 171 | Ana. macrospora | 30.5 | 373.7 (23,400 colony) | [97] |
References
- Graham, J.L.; Loftin, K.A.; Meyer, M.T.; Ziegler, A.C. Cyanotoxin mixtures and taste-and odor compounds in cyanobacterial blooms from the Midwestern United States. Environ. Sci. Technol. 2010, 44, 7361–7368. [Google Scholar] [CrossRef] [PubMed]
- Korth, W.; Ellis, J.; Bowmer, K. The stability of geosmin and MIB and their deuterated analogues in surface waters and organic solvents. Environ. Sci. Technol. 1992, 25, 115–122. [Google Scholar] [CrossRef]
- Persson, P.E. Off-flavours in aquatic ecosystems-An introduction. Water Sci. Technol. 1983, 15, 1–11. [Google Scholar] [CrossRef]
- Gerber, N.N. Volatile substances from Actinomycetes: Their role in the odor pollution of water. J. CRC Crit. Rev. Microbiol. 1979, 7, 191–214. [Google Scholar] [CrossRef] [PubMed]
- Persson, P.E. Cyanobacteria and off-flavours. Phycologia 1996, 35, 168–171. [Google Scholar] [CrossRef]
- Slater, G.P.; Blok, V.C. Volatile compounds of the cyanophyceae-A review. Water Sci. Technol. 1983, 15, 181–190. [Google Scholar] [CrossRef]
- Graham, J.L.; Ziegler, A.C.; Loving, B.L.; Loftin, K.L. Fate and Transport of Cyanobacteria and Associated Toxins and Taste-and-Odor Compounds from Upstream Reservoirs in the Kansas River, Kansas, September and October 2011; U.S. Geological Survey Scientific Investigations Report 2012-5129; US Department of the Interior, US Geological Survey: Reston, VA, USA, 2012; p. 65.
- Jones, G.J.; Korth, W. In Situ Production of Volatile Odour Compounds by River and Reservoir Phytoplankton in Australia. Water Sci. Technol. 1995, 31, 145–151. [Google Scholar] [CrossRef]
- Li, Z.; Yu, J.; Yang, M.; Zhang, J.; Burch, M.D.; Han, W. Cyanobacterial population and harmful metabolites dynamics during a bloom in Yanghe Reservoir, North China. Harmful Algae 2010, 9, 481–488. [Google Scholar] [CrossRef]
- Whelton, A.J.; Dietrich, A.M. Relationship between intensity, concentration, and temperature for drinking water odorants. Water Res. 2004, 38, 1604–1614. [Google Scholar] [CrossRef]
- Wnorowski, A.U.; Scott, W.E. Incidence of off-flavors in south African surface waters. Water Sci. Technol. 1992, 25, 225–232. [Google Scholar] [CrossRef]
- Tang, E.P.Y.; Tremblay, R.; Vincent, W.F. Cyanobacterial dominance of polar freshwater ecosystems: Are high-latitude mat-formers adapted to low temperature. J. Phycol. 1997, 33, 171–181. [Google Scholar] [CrossRef]
- Olsen, B.K.; Chislock, M.F.; Wilson, A.E. Eutrophication mediates a common off-flavor compound, 2-methylisoborneol, in a drinking water reservoir. Water Res. 2016, 92, 228–234. [Google Scholar] [CrossRef] [PubMed]
- Saadoun, I.M.K.; Schrader, K.K.; Blevins, W.T. Environmental and nutritional factors affecting geosmin synthesis by Anabaena sp. Water Res. 2001, 35, 1209–1218. [Google Scholar] [CrossRef]
- Joehnk, K.D.; Huisman, J.; Sharples, J.; Stroom, J. Summer heatwaves promote blooms of harmful cyanobacteria. Glob. Change Biol. 2007, 14, 485–512. [Google Scholar] [CrossRef] [Green Version]
- Sherman, B.S.; Webster, I.T.; Jones, G.J.; Oliver, R.L. Transitions between Aulacoseira and Anabaena dominance in a turbid river weir pool. Limnol. Oceanogr. 1998, 43, 1902–1915. [Google Scholar] [CrossRef]
- Malleivalle, J.; Suffet, I.H. Identification and Treatment of Tastes and Odors in Drinking Water; American Water Works Association Research Foundation: Denver, CO, USA, 1987; p. 292. [Google Scholar]
- Rosen, B.H.; MacLeod, B.W.; Simpson, M.R. Accumulation and release of geosmin during the growth phases of Dolichospermum circinale (Kutz.) Rabenhorst. Water Sci. Technol. 1992, 25, 185–190. [Google Scholar] [CrossRef] [Green Version]
- Suffet, I.H.; Mallevialle, J.; Kawczynski, E. Advances in Taste-and-Odor Treatment and Control; American Water Works Association: Denver, CO, USA, 1995; p. 385. [Google Scholar]
- Dzialowski, A.; Smith, V.H.; Huggins, D.G.; de Noyelles, F.; Lim, N.C.; Baker, D.S.; Beury, J.H. Development of predictive models for geosmin-related taste and odor in Kansas, USA, drinking water reservoirs. Water Res. 2009, 43, 2829–2840. [Google Scholar] [CrossRef]
- McGuire, M.J. Off-flavor as the consumer’s measure of drinking water safety. Water Sci. Technol. 1995, 31, 1–8. [Google Scholar] [CrossRef]
- Qin, B.; Zhu, G.; Gao, G.; Zhang, Y.; Li, W.; Paerl, H.W.; Carmichael, W.W. A drinking water crisis in Lake Taihu, China: Linkage to climate variability and lake management. Environ. Manag. 2010, 45, 105–112. [Google Scholar] [CrossRef]
- Ridal, J.J.; Brownlee, B.; Lean, D.R.S. Occurrence of the odor compounds, 2-methylisoborneol and geosmin in eastern Lake Ontario and the upper St. Lawrence River. J. Great Lakes Res. 1999, 25, 198–204. [Google Scholar] [CrossRef]
- Srinivasan, R.; Sorial, G.A. Treatment of taste and odor causing compounds 2-methylisoborneol and geosmin in drinking water: A critical review. J. Environ. Sci. 2011, 23, 1–13. [Google Scholar] [CrossRef]
- Van Breemen, L.W.C.A.; Dits, J.S.; Ketelaars, H.A.M. Production and reduction of geosmin and 2-methylisoborneol during storage of river water in deep reservoirs. Water Sci. Technol. 1992, 25, 233–240. [Google Scholar] [CrossRef]
- Wood, S.; Williams, S.T.; White, W.R.; Jones, F. Factors influencing geosmin production by a Streptomycete and their relevance to the occurrence of earthy taints in reservoirs. Water Sci. Technol. 1983, 15, 191–198. [Google Scholar] [CrossRef]
- Ashby, S. Impacts of hydrology and hydropower on water quality in reservoir tailwaters. Trans. Ecol. Environ. 2009, 124, 55–66. [Google Scholar]
- Baxter, R.M. Environmental effects of dams and impoundments. Annu. Rev. Ecol. Syst. 1977, 8, 255–283. [Google Scholar] [CrossRef]
- Thoronton, K.W.; Kimmel, B.L.; Payne, F.E. Reservoir Limnology: Ecological Perspectives; John Wiley & Sons, Inc.: New York, NY, USA, 1990; p. 246. [Google Scholar]
- Smith, V.H.; Sieber-Denlinger, J.; de Noyelles, F., Jr.; Campbell, S.; Pan, S.; Randtke, S.J.; Blain, G.T.; Strasser, V.A. Managing taste and odor problems in a eutrophic drinking water reservoir. Lake Reserv. Manag. 2002, 18, 319–323. [Google Scholar] [CrossRef] [Green Version]
- De Oliveria Naliato, D.A.; Nogueira, M.G.; Perbiche-Neves, G. Discharge pulses of hydroelectric dams and their effects in the downstream limnological conditions: A case study in a large tropical river (SE Brazil). Lakes Reserv. Res. Manag. 2009, 14, 301–314. [Google Scholar] [CrossRef]
- Pickett, J.R.; Harvey, R.M. Water quality gradients in the Santer-Cooper Lakes, South Carolina. Lakes Reserv. Manag. 1988, 4, 11–20. [Google Scholar] [CrossRef] [Green Version]
- Walker, W.W., Jr. (Ed.) Empirical Methods for Predicting Eutrophication in Impoundments. Phase Ⅰ: Data Base Development; Technical Report E-81-9; United States Army Engineer Waterways Experiment Station CE: Vicksburg, MS, USA, 1981.
- Carlson, R.E. A trophic state index for lakes. Limnol. Oceanogr. 1977, 22, 361–369. [Google Scholar] [CrossRef] [Green Version]
- Cho, K.S. A limnological study on three artificial reservoirs in the North Han River system. (Ⅰ) On the environmental factors and the plankton in Paro Lake, Chunchon Lake and Uiam Lake in spring season. Korean J. Limnol. 1968, 1, 25–32. (In Korean) [Google Scholar]
- Choe, S.H.; Park, H.K.; Park, J.H.; Kim, S.H.; Byeon, M.S.; Shin, K.S.; Lim, Y.T. Water-Environment of Artificial Lakes in Han River Watershed (2001); NIER No. 2001-44-636; National Institute of Environmental Research: Incheon, Korea, 2001; p. 124. (In Korean)
- Hwang, S.J.; Sim, Y.B.; Choi, B.G.; Kim, K.; Park, C.; Seo, W.; Park, M.H.; Lee, S.W.; Shin, J.K. Rainfall and hydrological comparative analysis of water quality variability in Euiam Reservoir, the North-Han River, Korea. Korean J. Ecol. Environ. 2017, 50, 29–45. (In Korean) [Google Scholar] [CrossRef]
- Kim, D. The Effect of Phosphorus Removal from Wastewater Using CE-QUAL-W2 in Lake Uiam, Korea. Master’s Thesis, Graduate School, Kangwon National University, Chuncheon, Korea, 2010; p. 103. (In Korean). [Google Scholar]
- Kim, J.M.; Noh, H.R.; Heo, S.N.; Yang, H.J.; Jeong, W.J.; Lee, I.S. A Study on the Dynamics and Sources of Natural Organic Matter in Han-River; NIER No. 2001-45-637; National Institute of Environmental Research: Incheon, Korea, 2001; p. 128. (In Korean)
- Hwang, S.J.; Kim, K.; Park, C.; Seo, W.; Choi, B.G.; Eum, H.S.; Park, M.H.; Noh, H.R.; Sim, Y.B.; Shin, J.K. Hydro-meteorological effects on water quality variability in Paldang Reservoir, confluent area of the South-Han River-North-Han River-Gyeongan Stream, Korea. Korean J. Ecol. Environ. 2016, 49, 354–374. (In Korean) [Google Scholar] [CrossRef]
- Han River Watershed Management Commission (HWMC). Investigation of Cause of Off-Flavor Materials Production by Harmful Algae and Management Strategy; Han-River Watershed Environment Office: Seoul, Korea, 2015; p. 753. (In Korean) [Google Scholar]
- Lee, B.C.; Lee, J.K.; Park, E.R.; Youn, S.J.; Kim, H.N.; Kim, Y.J.; Park, J.Y.; Yu, M.N.; Lim, B.J.; Lee, J.E.; et al. Research for Preventing Algal Blooms by Akinete Elimination in the Lake Uiam (Ⅰ); NIER-RP2015-358; National Institute of Environmental Research: Incheon, Korea, 2015; p. 51. (In Korean)
- Shin, J.K.; Hwang, S.J. Dynamics of phosphorus, turbid water outflow and limno-hydrological effects on hypolimnetic effluents discharging by hydropower electric generation in a large dam reservoir (Daecheong), Korea. Korean J. Ecol. Environ. 2017, 50, 1–15. (In Korean) [Google Scholar] [CrossRef]
- APHA; AWWA; WEF. Standard Methods for the Examination of Water and Wastewater, 18th ed; American Public Health Association: Washington, DC, USA, 1995. [Google Scholar]
- Rump, H.H.; Krist, H. Laboratory Manual for the Examination of Water, Wastewater and Soil; VCH Verlagsgesellschaft, Publication: New York, NY, USA, 1988; p. 190. [Google Scholar]
- Nusch, E.A. Comparison of different methods for chlorophyll and phaeo-pigment determination. Arch. Hydrobiol.–Beih. Ergeb. Limnol. 1980, 14, 14–36. [Google Scholar]
- Hirose, H.; Akiyama, M.; Hirano, M.; Imahori, K.; Iorita, T.; Kasaki, H.; Kobayashi, H.; Kumano, S.; Takahashi, E.; Tsumura, K.; et al. Illustrations of the Japanese Freshwater Algae; Uchida Rokakuhe Publisher: Tokyo, Japan, 1977; p. 933. [Google Scholar]
- Prescott, G.W. Algae of the Western Great Lakes Area with an Illustrated Key to the Genera of Desmids and Freshwater Diatoms; Otto Koeltz Science Publishers: Berlin, Germany, 1982; p. 977. [Google Scholar]
- Lloyd, S.W.; Lea, J.M.; Zimba, P.V.; Grimm, C.C. Rapid analysis of geosmin and 2-methylisoborneol in water using solid phase microextraction procedures. Water Res. 1998, 32, 2140–2146. [Google Scholar] [CrossRef]
- SPSS. SYSTAT® 8.0 Statistics; SPSS Inc.: Chigaco, IL, USA, 1998; p. 1086. [Google Scholar]
- Horne, A.J.; Goldman, C.R. Limnology; McGraw-Hill: Columbus, OH, USA, 1994; p. 480. [Google Scholar]
- Seo, W.; Lee, S.W.; Kim, K.; Park, C.; Choi, B.G.; Sim, Y.B.; Hwang, S.J.; Shin, J.K. Cyanobacterial bioassay (AGP test) on the water fertility of treated wastewater effluents discharged into Euiam and Paldang Reservoirs, Korea. Korean J. Ecol. Environ. 2017, 50, 79–95. (In Korean) [Google Scholar] [CrossRef]
- You, K.A.; Byeon, M.S.; Youn, S.J.; Hwang, S.J.; Rhew, D.H. Growth characteristics of blue-green algae (Dolichospermum spiroides) causing tastes and odors in the North-Han River, Korea. Korean J. Ecol. Environ. 2013, 46, 135–144. (In Korean) [Google Scholar] [CrossRef]
- Shin, J.K.; Kang, B.G.; Hwang, S.J. Water-blooms (green-tide) dynamics of algae alert system and rainfall-hydrological effects in Daecheong Reservoir, Korea. Korean J. Ecol. Environ. 2016, 49, 153–175. (In Korean) [Google Scholar] [CrossRef]
- Shin, J.K.; Kang, B.G.; Hwang, S.J. Limnological study on spring-bloom of a green algae, Eudorina elegans and weirwater pulsed-flows in the midstream (Seungchon weir pool) of the Yeongsan River, Korea. Korean J. Ecol. Environ. 2016, 49, 320–333. (In Korean) [Google Scholar] [CrossRef]
- Shin, J.K.; Kim, Y.; Noh, J.; Kim, J.; Hwang, S.J. Application testing and comparative effectiveness of green-tide mitigation technique in the lower part (Chusori) of the So-ok Stream (Daecheong Reservoir), Korea. Korean J. Ecol. Environ. 2016, 49, 258–270. (In Korean) [Google Scholar] [CrossRef]
- Jeong, D.; Cho, Y.; Choi, I.; Ahn, K.; Chung, H.; Kwon, O. A study on impact of public wastewater treatment works affecting water qualities of the Lake Uiam in Chuncheon city. J. Environ. Impact Assess. 2014, 23, 406–416. (In Korean) [Google Scholar] [CrossRef] [Green Version]
- Reynolds, C.S. Non-determinism to probability, or N:P in the community ecology of phytoplankton. Arch. Hydrobiol. 1999, 146, 23–35. [Google Scholar] [CrossRef]
- Reynolds, C.S.; Davies, P.S. Sources of bioavailability of phosphorus fractions in freshwaters: A british perspective. Biol. Rev. 2001, 76, 27–64. [Google Scholar] [CrossRef] [PubMed]
- Barbiero, R.P.; Kann, J. The Importance of Benthic Recruitment to the Population Development of Aphanizomenon flos-aquae and Internal Loading in a Shallow Lake. J. Plankton Res. 1994, 16, 1581–1588. [Google Scholar] [CrossRef]
- You, K.A.; Lee, J.K.; Hwang, M.Y.; Lee, B.C.; Lee, J.E.; Kim, Y.J.; Yu, M.N.; Shim, Y.B.; Baek, J.S.; Youn, S.J.; et al. Physiological and Ecological Characteristics of Algae in the Lake Paldang (Ⅱ); NIER-RP2015-359; National Institute of Environmental Research: Incheon, Korea, 2015; p. 56. (In Korean)
- Izaguirre, G.; Taylor, W.D. Geosmin and MIB events in a new reservoir in Southern California. Water Sci. Technol. 2007, 55, 9–14. [Google Scholar] [CrossRef] [PubMed]
- Graham, J.L.; Loftin, K.A.; Ziegler, A.C.; Meyer, M.T. Guidelines for Design and PD1pling for Cyanobacterial Toxin and Taste-and-Odor Studies in Lakes and Reservoirs; U.S. Geological Survey Scientific Investigations Report 2008-5038; U.S. Geological Survey: Reston, VA, USA, 2008; p. 39. 1p.
- Cook, P.L.M.; Jennings, M.; Holland, D.P.; Beardall, J.; Briles, C.; Zawadzki, A.; Doan, P.; Mills, K.; Gell, P. Blooms of cyanobacteria in a temperate Australian lagoon system post and prior to European settlement. Biogeosciences 2016, 13, 3677–3686. [Google Scholar] [CrossRef] [Green Version]
- Ishikawa, K.; Kumagai, M.; Vincent, W.F.; Tsujimura, S.; Nakahara, H. Transport and accumulation of bloom-forming cyanobacteria in a large, mid-latitude lake: The gyre-Microcystis hypothesis. Limnolgy 2002, 3, 87–96. [Google Scholar] [CrossRef]
- Hansson, L.A.; Rudstam, L.G.; Johnson, T.B.; Soranno, P.; Allen, Y. Patterns in algal recruitment from sediment to water in a dimictic, eutrophic lake. Can. J. Fish. Aquat. Sci. 1994, 51, 2825–2833. [Google Scholar] [CrossRef]
- Yang, J.; Lv, H.; Yang, J.; Liu, L.; Yu, X.; Chen, H. Decline in water level boosts cyanobacteria dominance in subtropical reservoirs. Sci. Total Environ. 2016, 557–558, 445–452. [Google Scholar] [CrossRef]
- Stahl-Delbanco, A.; Hansson, L.A.; Gyllstrom, M. Recruitment of resting stages may induce blooms of Microcystis at low N:P ratios. J. Plankton Res. 2003, 25, 1099–1106. [Google Scholar] [CrossRef]
- Wantzen, K.M.; Rothhaupt, K.O.; Mortl, M.; Cantonati, M.; Toth, L.G.; Fischer, P. Ecological effects of water-level fluctuations in lakes: An urgent issue. Hydrobiologia 2008, 613, 1–4. [Google Scholar] [CrossRef] [Green Version]
- De Domitrovic, Y.Z. Effect of fluctuations in water level on phytoplankton development in three lakes of the Parana River floodplain (Argentina). Hydrobiologia 2003, 510, 175–193. [Google Scholar] [CrossRef]
- Journey, C.A.; Arrington, J.M.; Beaulieu, K.M.; Graham, J.L.; Bradley, P.M. Limnological Conditions and Occurrence of Taste-and Odor Compounds in Lake William, C. Bowen and Municipal Reservoir #1, Spartanburg County, South Carolina, 2006–2009; U.S. Geological Survey Scientific Investigations Report 2011-5060; U.S. Geological Survey: Reston, VA, USA, 2011; p. 30.
- Journey, C.A.; Beaulieu, K.M.; Bradley, P.M. Environmental Factors that Influence Cyanobacteria and Geosmin Occurrence in Reservoirs. In Current Perspectives in Contaminant Hydrology and Water Resources Sustainability; Bradly, P.M., Ed.; InTech: Rijeka, Croatia, 2013; pp. 27–55. [Google Scholar]
- Rashash, D.M.C.; Hoehn, R.C.; Dietrich, A.M.; Grizzard, T.J.; Parker, B.C. Identification and Control of Odorous Algal Metabolites; AWWA Research Foundation and American Water Works Association Report 0-89867-855-2; American Water Works Association: Denver, CO, USA, 1996; p. 172. [Google Scholar]
- Paerl, H.W.; Millie, D.F. Physiological ecology of toxic aquatic cyanobacteria. Phycologia 1996, 35, 160–167. [Google Scholar] [CrossRef]
- Watson, S.B. Cyanobacterial and eukaryotic algal odour compounds: Signals or by-products? A review of their biological activity. Phycologia 2003, 42, 332–350. [Google Scholar] [CrossRef]
- Mckay, R.M.L.; Tuttle, T.; Reitz, L.A.; Bullerjahn, G.S.; Cody, W.R.; Mcdowell, A.J.; Davis, T.W. Early onset of a microcystin-producing cyanobacterial bloom in an agriculturally-influenced Great Lakes tributary. J. Oceanol. Limnol. 2018, 36, 1112–1125. [Google Scholar] [CrossRef]
- Matson, P.G.; Boyer, G.L.; Bridgeman, T.B.; Bullerjahn, G.S.; Kane, D.D.; Mckay, R.M.L.; McKindles, K.M.; Raymond, H.A.; Snyder, B.K.; Stumpf, R.P.; et al. Physical drivers facilitating a toxigenic cyanobacterial bloom in a major Great Lakes tributary. Limnol. Oceanogr. 2020, 65, 2866–2882. [Google Scholar] [CrossRef]
- Shin, J.K.; Cho, K.J. The impact on water quality from blue-green algae Microcystis of natural phytoplankton by algal assay. J. Korean Environ. Sci. Soc. 2000, 9, 267–273. (In Korean) [Google Scholar]
- Ministry of Environment (MOE). A White-Paper of Environment; Ministry of Environment: Seoul, Korea, 2011. (In Korean)
- Korea Water Resources Corporation (K-Water). A Study on the Development Mechanisms and Reduction Technology of Water-Bloom in the River-Reservoir System; Interim Report No. KIWE-WERC-2007-03; K-water: Daejeon, Korea, 2007; p. 101. (In Korean) [Google Scholar]
- Wu, J.T.; Juttner, F. Effect of environmental factors on geosmin production by Fischerella muscicola. Water Sci. Technol. 1988, 20, 143–148. [Google Scholar] [CrossRef]
- Li, L.; Wan, N.; Gan, N.Q.; Xia, B.D.; Song, L.R. Annual dynamics and origins of the odorous compounds in the pilot experimental area of Lake Dianchi, China. Water Sci. Technol. 2007, 55, 43–50. [Google Scholar] [CrossRef]
- Westerhoff, P.; Rodriguez-Hernandez, M.; Baker, L.; Sommerfeld, M. Seasonal occurrence and degradation of 2-methylisoborneol in water supply reservoirs. Water Res. 2005, 39, 4899–4912. [Google Scholar] [CrossRef]
- Bae, B.U.; Lee, Y.J.; Lim, M.G. Comparison of taste and odor in raw water from the main Daecheong Reservoir and its regulating reservoir downstream. J. Korean Soc. Water Qual. 2008, 24, 598–602. (In Korean) [Google Scholar]
- Harris, T.D.; Graham, J.L. Predicting cyanobacterial abundance, microcystin, and geosmin in a eutrophic drinking-water reservoir using a 14-year dataset. Lake Reserv. Manag. 2017, 33, 32–48. [Google Scholar] [CrossRef]
- Min, J.H.; Kim, D.W.; Kang, M.; Park, M.; Rhew, D.H.; Kim, K.; Ryu, I.; Na, E.H.; Park, S.; Jin, Y.H.; et al. A Spatially Distributed Modeling Study on the Algal Dynamics in the Middle-Upper Reaches of the North Han River, Korea (Ⅰ); NIER-RP2013-303; National Institute of Environmental Research: Incheon, Korea, 2013; p. 33. (In Korean)
- Min, J.H.; Choi, J.; Kim, D.W.; Park, S.; Lee, H.; Mun, H.; Shin, C.; Kim, K.; Ryu, I.; Kang, Y.H. A Spatially Distributed Modeling Study on the Algal Dynamics in the Middle-Upper Reaches of the North Han River, Korea (Ⅱ); NIER-RP2014-196; National Institute of Environmental Research: Incheon, Korea, 2014; p. 48. (In Korean)
- Lee, B.C.; Lee, J.K.; Park, E.R.; Kim, Y.J.; Youn, S.J.; Kim, H.N.; Jin, Y.H.; Lee, J.E.; Hwang, M.Y.; You, K.A.; et al. Physiological and Ecological Characteristics of Algae in the Lake Paldang (Ⅰ); NIER-RP2014-266; National Institute of Environmental Research: Incheon, Korea, 2014; p. 62. (In Korean)
- Yu, J.W.; Zhao, Y.M.; Yang, M.; Lin, T.F.; Guo, Z.H.; Gu, J.N.; Li, S.; Han, W. Occurrence of odour-causing compounds in different source waters of China. J. Water Supply Res. Technol. 2009, 58, 587–594. [Google Scholar] [CrossRef] [Green Version]
- Yagi, M. Musty odour problems in Lake Biwa 1982–1987. Water Sci. Technol. 1988, 20, 133–142. [Google Scholar] [CrossRef]
- Byun, J.H.; Hwang, S.J.; Kim, B.H.; Park, J.R.; Lee, J.K.; Lim, B.J. Relationship between a dense population of cyanobacteria and odorous compounds in the North Han River systems in 2014 and 2015. Korean J. Ecol. Environ. 2015, 48, 263–271. (In Korean) [Google Scholar] [CrossRef]
- Geum River Environment Research Center (GRERC). Occurrence and Management of Odor Compounds Produced by Algae in the Geum River; NIER No. NIER-RP2012-314; National Institute of Environmental Research: Okcheon, Korea, 2012; p. 50. (In Korean)
- Park, D.K.; Maeng, J.; Ahn, C.Y.; Chung, A.S.; Lee, J.H.; Oh, H.M. Geosmin concentration and its relation to environmental factors in Daechung Reservoir, Korea. Korean J. Limnol. 2001, 34, 319–326. [Google Scholar]
- Kim, K.Y. Temporal and Spatial Distribution of Geosmin and 2-MIB in the Daecheong Reservoir. Master’s Thesis, Graduate School, Chungbuk National University, Cheongju, Korea, 2014; p. 74. (In Korean). [Google Scholar]
- Kim, K.Y.; Khan, J.B.; Choi, I.C.; Hong, S.H.; Lee, J.B.; Lee, S.H.; Lee, J.J. Temporal and spatial distribution of geosmin and 2-MIB in the Daecheong Reservoir. Korean J. Environ. Agric. 2015, 34, 20–26. (In Korean) [Google Scholar] [CrossRef] [Green Version]
- Lee, I.; Lee, K.L.; Lim, T.H.; Park, J.J.; Cheon, S. Determination of geosmin and 2-MIB in Nakdong River using headspace solid phase microextraction and GC-MS. Anal. Sci. Technol. 2013, 26, 326–332. (In Korean) [Google Scholar] [CrossRef] [Green Version]
- Bae, S.J.; Cho, Y.G.; Lee, J.J.; Lee, J.J. Studies on algae causing tastes and odors in the Dongbok Reservoir: Detection of taste and odor substances in culture fluids and natural waters. J. Korean Soc. Water Qual. 1998, 14, 229–236. (In Korean) [Google Scholar]


| Factors\Reservoirs | Hwacheon | Chuncheon | Soyang | Euiam | Cheongpyeong | Paldang | p |
|---|---|---|---|---|---|---|---|
| Daily rainfall (mm) | - | - | 9.7 ± 19.9 (0.1–155.4) | - | - | - | - |
| Total inflow (m3 s−1) | 86.9 ± 267.5 a (0.0–2814.4) | 128.6 ± 338.4 a,b (0.0–3721.7) | 105.5 ± 291.7 a (0.0–3042.2) | 252.7 ± 565.2 a,b,c (23.5–6442.2) | 329.0 ± 776.3 c (5.9–8757.9) | 877.4 ± 1670.1 d (60.0–13239.6) | 0.001 |
| Total outflow (m3 s−1) | 92.1 ± 242.3 a (0.0–2492.6) | 128.6 ± 339.8 a (0.0–3839.0) | 105.9 ± 170.2 a (1.9–1513.7) | 252.7 ± 566.1 a,b (0.0–6482.1) | 328.7 ± 777.3 b (0.0–8710.3) | 877.6 ± 1670.6 c (124.5–13,317.4) | 0.001 |
| Spillway outflow (m3 s−1) | - | - | 886.4 ± 462.8 (32.8–1318.2) | - | - | - | - |
| Hydropower release (m3 s−1) | - | - | 85.3 ± 57.2 (0.0–232.7) | - | - | - | - |
| Water level (EL.m) | 170.3 ± 3.5 e (158.7–178.5) | 102.2 ± 0.5 d (100.6–102.7) | 179.6 ± 7.3 f (164.3–193.3) | 70.7 ± 0.5 c (69.6–71.3) | 50.2 ± 0.4 b (48.9–50.9) | 25.1 ± 0.2 a (24.3–25.4) | 0.001 |
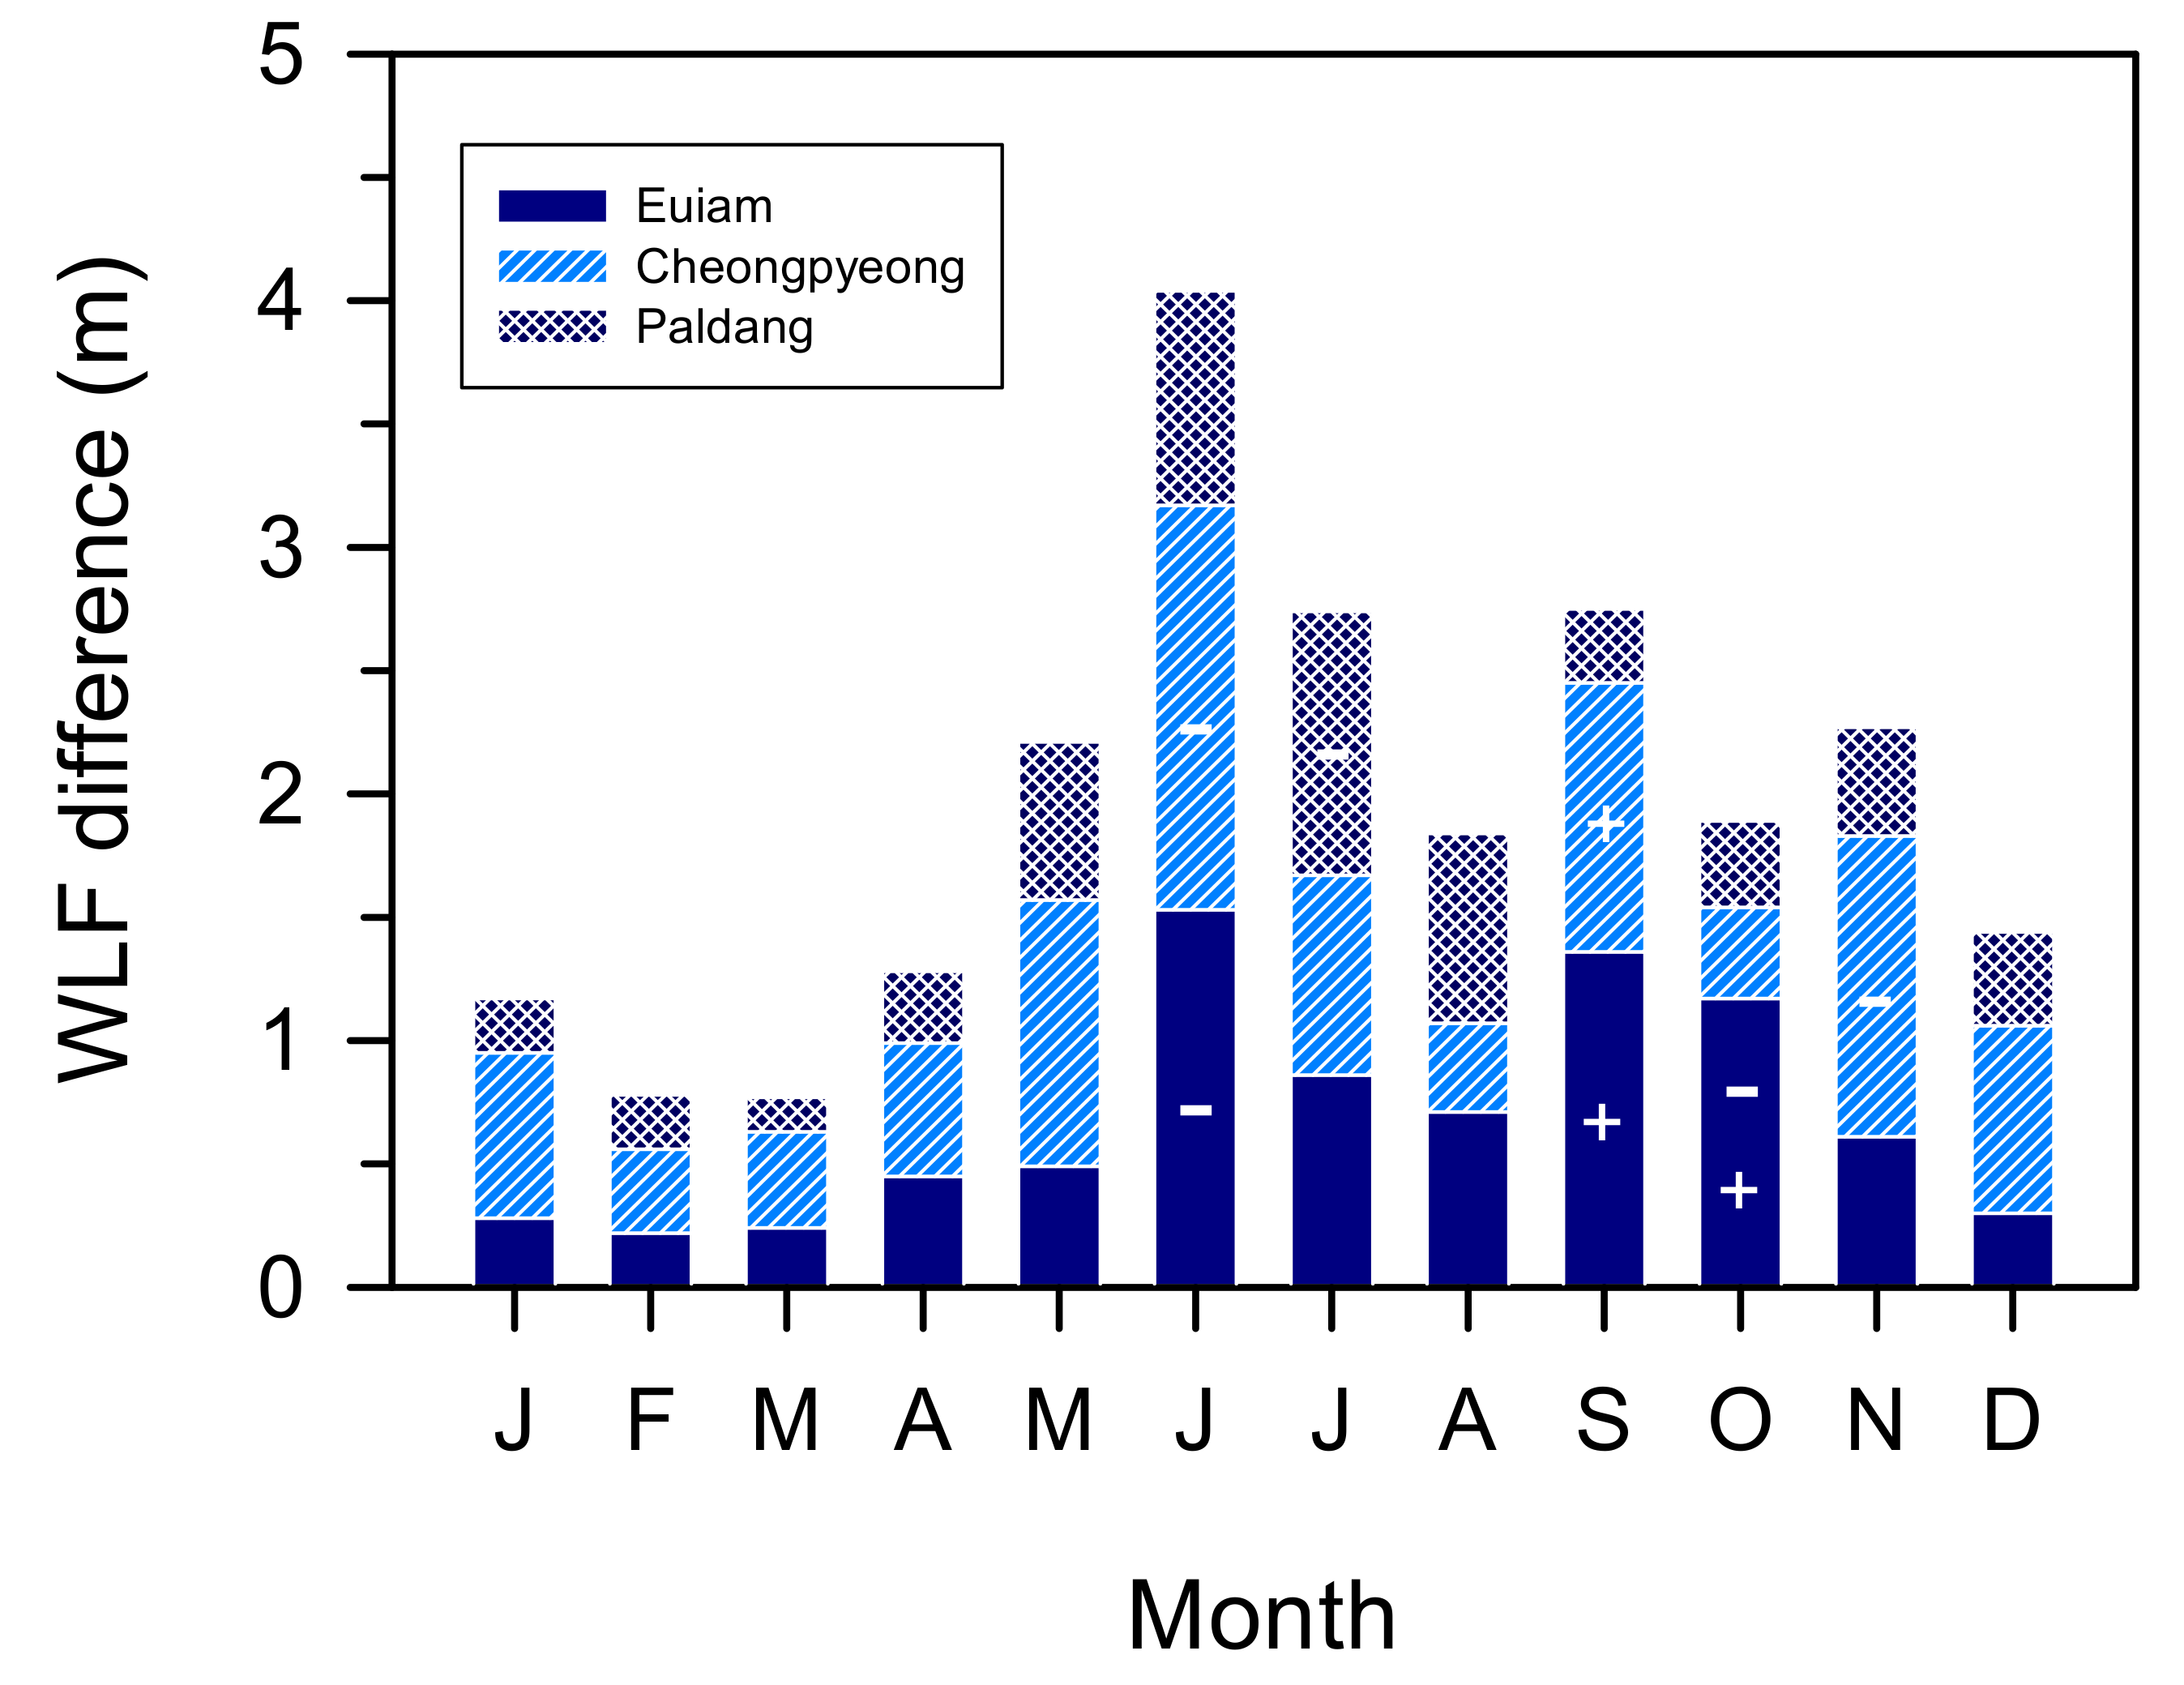
| Annual WLF (m) | 19.8 | 2.1 | 29.0 | 1.7 | 2.0 | 1.1 | - |
| Factors/Stations | Euiam Reservoir | Cheongpyeong Reservoir | Paldang Reservoir | p | ||||||
|---|---|---|---|---|---|---|---|---|---|---|
| EA1 | EA2 | EAD | CP1 | CPD | PD1 | PD2 | PD3 | PDD | ||
| Temperature (°C) | 14.6 ± 5.5 (6.0–22.0) | 14.0 ± 5.5 (7.0–23.0) | 12.2 ± 6.4 (3.0–20.4) | 14.6 ± 6.6 (4.0–24.1) | 15.4 ± 5.7 (5.7–23.3) | 12.3 ± 7.5 (1.0–22.3) | 11.8 ± 7.6 (1.0–22.0) | 13.5 ± 8.9 (1.0–23.8) | 12.0 ± 7.5 (1.0–22.0) | 0.920 |
| DO (mg O2 L−1) | 13.2 ± 0.9 (9.5–16.7) | 12.1 ± 2.7 (7.9–16.8) | 12.5 ± 1.8 (8.9–14.7) | 11.1 ± 2.1 (8.9–15.5) | 11.1 ± 1.6 (8.8–13.6) | 12.2 ± 1.8 (10.3–16.1) | 12.1 ± 1.4 (10.2–14.3) | 12.2 ± 2.2 (9.1–15.7) | 12.1 ± 1.6 (10.1–15.3) | 0.454 |
| pH | 7.8 ± 0.5 (7.0–9.0) | 7.7 ± 0.7 (6.4–9.0) | 7.8 ± 0.3 (7.3–8.3) | 7.8 ± 0.3 (7.3–8.3) | 7.8 ± 0.4 (7.3–8.7) | 8.0 ± 0.4 (7.5–9.2) | 7.8 ± 0.4 (7.2–8.3) | 8.0 ± 0.6 (7.2–9.2) | 8.0 ± 0.4 (7.5–9.1) | 0.707 |
| Conductivity (μS cm−1) | 102.1 ± 32.1 a (66.0–149.0) | 97.5 ± 30.5 a (60.0–151.0) | 87.1 ± 10.3 a (74.0–109.0) | 83.7 ± 13.2 a (60.0–105.0) | 84.4 ± 12.1 a (71.0–105.0) | 210.6 ± 34.0 b (146.0–248.0) | 107.0 ± 25.2 a (74.0–149.0) | 194.2 ± 59.9 b,c (107.0–300.0) | 210.8 ± 32.6 c (148.0–247.0) | 0.001 |
| TSS (mg dw L−1) | 3.5 ± 2.3 (0.4–6.9) | 3.6 ± 2.5 (0.5–7.9) | 5.3 ± 4.8 (1.1–18.9) | 4.6 ± 2.3 (2.0–9.8) | 5.3 ± 3.2 (2.2–13.0) | 32.0 ± 49.3 (2.6–146.4) | 4.7 ± 2.8 (2.5–11.8) | 13.6 ± 23.3 (1.7–86.5) | 28.6 ± 46.8 (3.3–162.6) | 0.043 |
| BOD5 (mg O2 L−1) | 0.8 ± 0.9 a (0.2–3.2) | 0.8 ± 0.5 a (0.3–1.7) | 0.7 ± 0.3 a (0.2–1.3) | 1.1 ± 0.5 a (0.5–1.8) | 0.9 ± 0.3 a (0.5–1.2) | 1.3 ± 0.9 a (0.5–3.6) | 1.0 ± 0.3 a (0.5–1.5) | 2.0 ± 1.1 b (1.0–4.2) | 1.2 ± 0.9 a,b (0.5–3.2) | 0.001 |
| CODMn (mg O2 L−1) | 3.3 ± 1.2 a (2.3–6.3) | 3.0 ± 1.0 a (2.2–5.6) | 3.1 ± 0.5 a (2.6–4.3) | 3.1 ± 0.5 a (2.2–3.7) | 2.9 ± 0.4 a (2.3–3.6) | 4.2 ± 1.8 a,b (2.2–8.0) | 3.3 ± 0.4 a,b (2.7–4.1) | 4.5 ± 1.1 b (2.9–6.1) | 4.1 ± 1.7 a,b (2.6–7.8) | 0.001 |
| T–N (μg N L−1) | 2743.8 ± 1025.6 b,c (1417.0–4657.0) | 2976.3 ± 913.9 c (1646.0–4284.0) | 2565.4 ± 801.6 a,b,c (1610.0–3903.0) | 1775.5 ± 384.0 a (1383.0–2656.0) | 1788.3 ± 319.7 a (1494.0–2464.0) | 2759.8 ± 355.0 a,b,c (2284.0–3503.0) | 1919.7 ± 260.8 a,b (1615.0–2503.0) | 2794.8 ± 740.7 c (1783.0–3995.0) | 2731.7 ± 334.5 b,c (2339.0–3231.0) | 0.001 |
| DTN (μg N L−1) | 2118.4 ± 765.7 a,b,c (1323.0–3494.0) | 2247.3 ± 764.4 a,b,c (1,372.0–3,406.0) | 1951.3 ± 553.9 a,b (1401.0–3452.0) | 1708.0 ± 359.1 a (1367.0–2540.0) | 1731.3 ± 303.4 a (1385.0–2362.0) | 2660.2 ± 359.1 a,b,c (2209.0–3454.0) | 1868.8 ± 259.3 a (1575.0–2445.0) | 2687.3 ± 687.8 c (1751.0–3774.0) | 2640.5 ± 341.6 b,c (2173.0–3146.0) | 0.001 |
| Ammonium (μg N L−1) | 103.2 ± 163.5 (0.0–467.0) | 40.0 ± 43.8 (0.0–107.0) | 54.6 ± 30.8 (21.0–114.0) | 22.6 ± 10.9 (6.0–38.0) | 19.5 ± 9.7 (8.0–41.0) | 66.9 ± 61.8 (15.0–195.0) | 32.2 ± 20.2 (8.0–80.0) | 72.5 ± 44.9 (12.0–157.0) | 86.2 ± 99.1 (19.0–330.0) | 0.050 |
| Nitrate (μg N L−1) | 1399.8 ± 544.8 a (125.0–1907.0) | 1413.8 ± 576.5 a (233.0–2478.0) | 1489.5 ± 1508.0 a (1120.0–1962.0) | 1423.7 ± 279.9 a (843.0–1864.0) | 1443.5 ± 214.2 a (1192.0–1836.0) | 2,151.5 ± 312.3 a,b (1644.0–2677.0) | 1521.3 ± 280.8 a (1261.0–2127.0) | 2120.2 ± 660.5 b (1358.0–3461.0) | 2133.7 ± 290.8 b (1719.0–2607.0) | 0.001 |
| T–P (μg P L−1) | 38.1 ± 41.6 a,b (5.0–145.0) | 48.3 ± 34.3 a,b (18.0–123.0) | 42.8 ± 27.3 a,b (20.0–99.0) | 25.7 ± 10.2 a (8.0–44.0) | 39.4 ± 24.6 a,b (14.0–77.0) | 67.7 ± 44.2 a,b (33.0–161.0) | 24.4 ± 9.7 a (14.0–43.0) | 49.8 ± 24.8 a,b (13.0–100.0) | 70.8 ± 51.7 b (34.0–183.0) | 0.022 |
| DTP (μg P L−1) | 21.1 ± 29.4 (1.0–91.0) | 23.3 ± 15.8 (7.0–56.0) | 24.0 ± 19.9 (8.0–81.0) | 22.5 ± 9.4 (4.0–35.0) | 32.6 ± 22.7 (11.0–72.0) | 29.9 ± 12.9 (13.0–55.0) | 12.1 ± 5.4 (5.0–21.0) | 23.8 ± 12.4 (5.0–44.0) | 31.7 ± 14.7 (13.0–57.0) | 0.167 |
| SRP (μg P L−1) | 14.3 ± 27.9 a,b (0.0–84.0) | 6.4 ± 5.9 a,b (0.0–20.0) | 5.9 ± 2.1 a,b (2.0–9.0) | 8.0 ± 5.2 a,b (2.0–19.0) | 14.3 ± 15.7 a,b (3.0–48.0) | 19.7 ± 14.7 a,b (2.0–47.0) | 3.8 ± 3.7 a (0.0–12.0) | 12.3 ± 12.7 a,b (2.0–35.0) | 21.4 ± 13.5 b (1.0–46.0) | 0.030 |
| Chl-a (mg m−3) | 5.5 ± 7.9 (0.1–20.9) | 154.3 ± 328.3 (0.5–950.8) | 10.5 ± 10.6 (2.1–35.3) | 6.9 ± 4.5 (1.3–15.5) | 6.3 ± 3.7 (1.3–11.3) | 14.0 ± 13.6 (1.8–40.8) | 11.0 ± 5.8 (1.9–19.6) | 16.2 ± 9.4 (4.7–34.4) | 10.3 ± 9.7 (1.9–33.7) | 0.166 |
| Factors/Stations | Euiam Reservoir | Cheongpyeong Reservoir | Paldang Reservoir | p | ||||
|---|---|---|---|---|---|---|---|---|
| EAD | CP1 | CPD | PD1 | PD2 | PD3 | PDD | ||
| Temperature (°C) | 6.1 ± 2.4 b (2.6–9.8) | 5.3 ± 2.5 b (1.6–9.7) | 6.2 ± 2.7 b (2.3–11.3) | 5.7 ± 2.9 b (1.3–10.7) | 4.9 ± 3.0 b (0.5–9.6) | 1.6 ± 0.5 a (1.1–2.6) | 5.6 ± 2.9 b (1.1–10.3) | 0.001 |
| Conductivity (μS cm−1) | 83.8 ± 6.9 a (72.0–101.0) | 83.8 ± 5.2 a (76.0–99.0) | 93.6 ± 8.1 a,b (80.0–107.0) | 105.1 ± 8.3 b (97.0–136.0) | 230.6 ± 14.0 d (199.0–268.0) | 283.3 ± 29.7 e (217.0–320.0) | 172.7 ± 21.9 c (130.0–211.0) | 0.001 |
| T–N (μg N L−1) | 1887.1 ± 201.2 a,b (1600.0–2300.0) | 1835.7 ± 144.6 a (1600.0–2300.0) | 2041.9 ± 189.3 b,c (1800.0–2500.0) | 2196.6 ± 195.5 c (1800.0–2700.0) | 2945.2 ± 244.7 e (2200.0–3300.0) | 4368.4 ± 547.8 f (3400.0–5600.0) | 2554.8 ± 207.9 d (2000.0–2800.0) | 0.001 |
| T–P (μg P L−1) | 29.5 ± 7.4 a (17.0–45.0) | 26.0 ± 6.3 a (17.0–45.0) | 21.5 ± 3.4 a (16.0–29.0) | 22.0 ± 3.3 a (17.0–28.0) | 50.8 ± 27.4 b (29.0–100.0) | 57.2 ± 30.1 b (31.0–100.0) | 33.5 ± 13.9 a (20.0–100.0) | 0.001 |
| SRP (μg P L−1) | 5.0 ± 4.1 a,b (0.0–16.0) | 3.3 ± 2.9 a,b (0.0–13.0) | 0.9 ± 0.9 a (0.0–3.0) | 1.6 ± 1.6 a (0.0–6.0) | 19.8 ± 9.1 d (7.0–42.0) | 11.5 ± 14.8 c (0.0–46.0) | 7.1 ± 3.8 b,c (2.0–16.0) | 0.001 |
| Chl-a (mg m−3) | 8.3 ± 6.0 b (2.1–30.3) | 7.1 ± 3.3 a,b (3.1–16.6) | 8.4 ± 2.0 b (4.5–13.0) | 6.7 ± 2.0 a,b (4.5–12.4) | 3.6 ± 1.8 a (1.5–11.4) | 23.7 ± 10.2 c (10.9–38.7) | 8.0 ± 10.4 a,b (4.4–65.0) | 0.001 |
| Algal standing crops (cells mL−1) | 1652 ± 202 a (610–6616) | 1266 ± 547 a (640–3186) | 1402 ± 832 a (616–4344) | 1782 ± 1338 a (582–6480) | 1,069 ± 359 a (670–2061) | 9601 ± 5925 b (1,291–20,267) | 2017 ± 2600 a (692–15665) | 0.001 |
| Cyanobacterial density (cells mL−1) | 696 ± 1210 (21–4576) | 449 ± 450 (47–1466) | 459 ± 474 (36–1874) | 627 ± 927 (27–3574) | 110 ± 46 (59–150) | 58 ± 13 (49–67) | 898 ± 2288 (52–11325) | 0.859 |
| Geosmin (ng L−1) | 44.0 ± 57.7 a (2.0–182.0) | 125.0 (only) | 198.6 ± 163.6 b,c (14.0–700.0) | 233.2 ± 295.9 c (29.0–1640.0) | 10.1 ± 17.7 a (2.0–68.0) | 61.0 ± 17.5 a,b (38.0–91.0) | 115.4 ± 61.0 a,b,c (42.0–259.0) | 0.001 |
Publisher’s Note: MDPI stays neutral with regard to jurisdictional claims in published maps and institutional affiliations. |
© 2022 by the authors. Licensee MDPI, Basel, Switzerland. This article is an open access article distributed under the terms and conditions of the Creative Commons Attribution (CC BY) license (https://creativecommons.org/licenses/by/4.0/).
Share and Cite
Shin, J.-K.; Park, Y.; Kim, N.-Y.; Hwang, S.-J. Downstream Transport of Geosmin Based on Harmful Cyanobacterial Outbreak Upstream in a Reservoir Cascade. Int. J. Environ. Res. Public Health 2022, 19, 9294. https://doi.org/10.3390/ijerph19159294
Shin J-K, Park Y, Kim N-Y, Hwang S-J. Downstream Transport of Geosmin Based on Harmful Cyanobacterial Outbreak Upstream in a Reservoir Cascade. International Journal of Environmental Research and Public Health. 2022; 19(15):9294. https://doi.org/10.3390/ijerph19159294
Chicago/Turabian StyleShin, Jae-Ki, Yongeun Park, Nan-Young Kim, and Soon-Jin Hwang. 2022. "Downstream Transport of Geosmin Based on Harmful Cyanobacterial Outbreak Upstream in a Reservoir Cascade" International Journal of Environmental Research and Public Health 19, no. 15: 9294. https://doi.org/10.3390/ijerph19159294