
Monitoring Accumulated Training and Match Load in Football: A Systematic Review

 ,
,  ,
,  , , , , and
Abstract
:1. Introduction
2. Materials and Methods
2.1. Literature Search Strategy
2.2. Selection Criteria
2.3. Quality Assessment
2.4. Study Coding and Data Extraction
3. Results
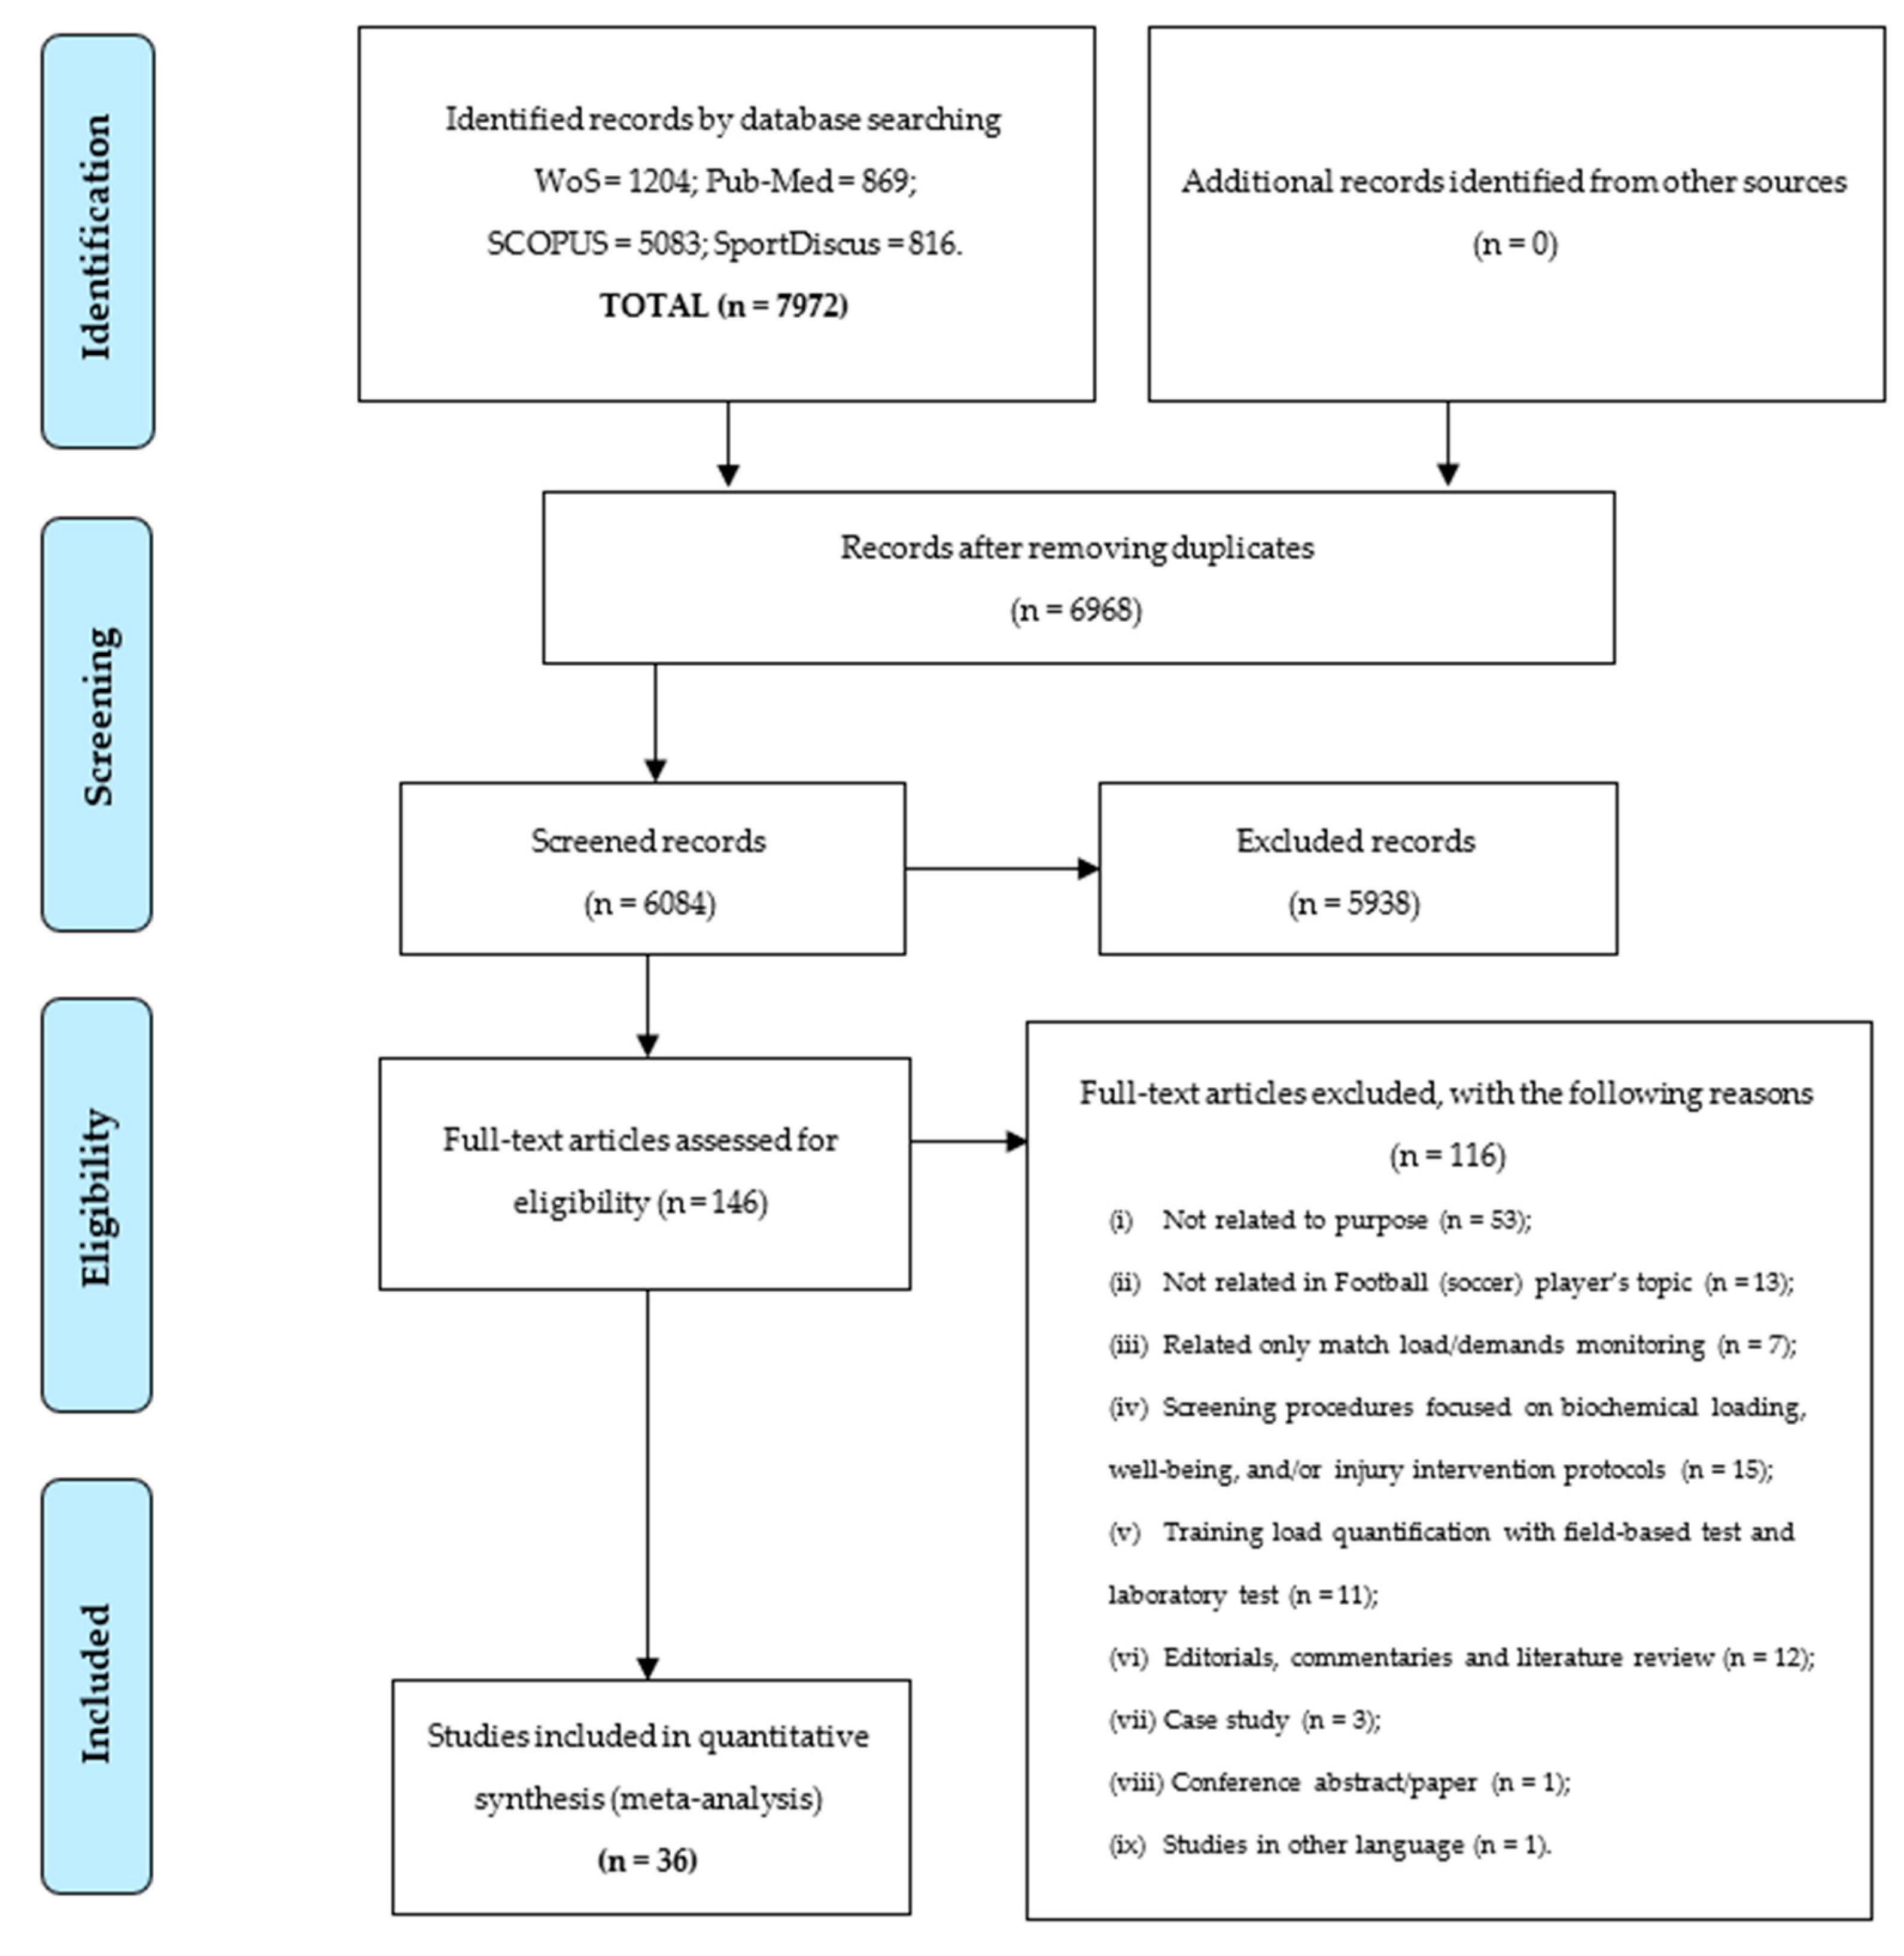
3.1. Search Results and Study Selection
3.2. Participant Characteristics
3.3. Quality Assessment
3.4. Data Organization
3.5. Weekly Training Load Distribution Analysis
3.6. Weekly Training Load and Match Load Distribution Analysis
3.7. Relationships between Weekly Internal and External Load
4. Discussion
4.1. Weekly Training Load Distribution Analysis
4.2. Weekly Training Load and Match Load Distribution Analysis
4.3. Relationships between Weekly Internal and External Load
4.4. Study Limitations and Future Directions
5. Conclusions
Author Contributions
Funding
Institutional Review Board Statement
Informed Consent Statement
Data Availability Statement
Acknowledgments
Conflicts of Interest
References
- Bangsbo, J.; Mohr, M.; Krustrup, P. Physical and metabolic demands of training and match-play in the elite football player. J. Sports Sci. 2006, 24, 665–674. [Google Scholar] [CrossRef]
- Stølen, T.; Chamari, K.; Castagna, C.; Wisløff, U. Physiology of soccer: An update. Sports Med. 2005, 35, 501–536. [Google Scholar] [CrossRef]
- Coutts, A.; Kempton, T.; Crowcroft, S.; Coutts, A.J.; Crowcroft, S.; Kempton, T. Developing athlete monitoring systems: Theoretical basis and practical applications. In Sport, Recovery and Performance: Interdisciplinary Insights; Kellmann, M., Beckmann, J., Eds.; Routledge: Abingdon, UK, 2018; pp. 19–32. [Google Scholar]
- Impellizzeri, F.M.; Rampinini, E.; Marcora, S.M. Physiological assessment of aerobic training in soccer. J. Sports Sci. 2005, 23, 583–592. [Google Scholar] [CrossRef]
- Bourdon, P.C.; Cardinale, M.; Murray, A.; Gastin, P.; Kellmann, M.; Varley, M.C.; Gabbett, T.J.; Coutts, A.J.; Burgess, D.J.; Gregson, W.; et al. Monitoring athlete training loads: Consensus statement. Int. J. Sports Physiol. Perform. 2017, 12, S2–S161. [Google Scholar] [CrossRef]
- Reilly, T. The Science of Training Soccer: A Scientific Approach to Developing Strength, Speed and Endurance; Routledge: London, UK, 2006. [Google Scholar]
- Impellizzeri, F.M.; Marcora, S.M.; Coutts, A.J. Internal and external training load: 15 years on. Int. J. Sports Physiol. Perform. 2019, 14, 270–273. [Google Scholar] [CrossRef]
- Cummins, C.; McLean, B.; Halaki, M.; Orr, R. Positional differences in external on-field load during specific drill classifications over a professional rugby league preseason. Int. J. Sports Physiol. Perform. 2017, 12, 764–776. [Google Scholar] [CrossRef]
- Gómez-Carmona, C.D.; Pino-Ortega, J.; Sánchez-Ureña, B.; Ibáñez, S.J.; Rojas-Valverde, D. Accelerometry-based external load indicators in sport: Too many options, same practical outcome? Int. J. Environ. Res. Public Health 2019, 16, 5101. [Google Scholar] [CrossRef] [PubMed] [Green Version]
- Buchheit, M.; Allen, A.; Poon, T.K.; Modonutti, M.; Gregson, W.; Di Salvo, V. Integrating different tracking systems in football: Multiple camera semi-automatic system, local position measurement and GPS technologies. J. Sports Sci. 2014, 32, 1844–1857. [Google Scholar] [CrossRef] [PubMed]
- Djaoui, L.; Haddad, M.; Chamari, K.; Dellal, A. Monitoring training load and fatigue in soccer players with physiological markers. Physiol. Behav. 2017, 181, 86–94. [Google Scholar] [CrossRef] [PubMed]
- Borresen, J.; Lambert, M.I. The quantification of training load, the training response and the effect on performance. Sports Med. 2009, 39, 779–795. [Google Scholar] [CrossRef] [PubMed]
- Branquinho, L.; Ferraz, R.; Travassos, B.; Marinho, D.A.; Marques, M.C. Effects of Different Recovery Times on Internal and External Load during Small-Sided Games in Soccer. Sports Health 2021. [Google Scholar] [CrossRef]
- Mujika, I.; Halson, S.; Burke, L.M.; Balagué, G.; Farrow, D. An integrated, multifactorial approach to periodization for optimal performance in individual and team sports. Int. J. Sports Physiol. Perform. 2018, 13, 538–561. [Google Scholar] [CrossRef] [PubMed]
- Akubat, I.; Barrett, S.; Abt, G. Integrating the internal and external training loads in soccer. Int. J. Sports Physiol. Perform. 2014, 9, 457–462. [Google Scholar] [CrossRef]
- Akenhead, R.; Nassis, G.P. Training load and player monitoring in high-level football: Current practice and perceptions. Int. J. Sports Physiol. Perform. 2016, 11, 587–593. [Google Scholar] [CrossRef] [PubMed]
- Halson, S.L. Monitoring training load to understand fatigue in athletes. Sports Med. 2014, 44, 139–147. [Google Scholar] [CrossRef] [PubMed] [Green Version]
- Vanrenterghem, J.; Nedergaard, N.J.; Robinson, M.A.; Drust, B. Training load monitoring in team sports: A novel framework separating physiological and biomechanical load-adaptation pathways. Sports Med. 2017, 47, 2135–2142. [Google Scholar] [CrossRef]
- Fox, J.L.; Stanton, R.; Sargent, C.; Wintour, S.-A.; Scanlan, A.T. The association between training load and performance in team sports: A systematic review. Sports Med. 2018, 48, 2743–2774. [Google Scholar] [CrossRef]
- McLaren, S.J.; Macpherson, T.W.; Coutts, A.J.; Hurst, C.; Spears, I.R.; Weston, M. The relationships between internal and external measures of training load and intensity in team sports: A meta-analysis. Sports Med. 2018, 48, 641–658. [Google Scholar] [CrossRef] [Green Version]
- Jaspers, A.; Brink, M.S.; Probst, S.G.M.; Frencken, W.G.P.; Helsen, W.F. Relationships between training load indicators and training outcomes in professional soccer. Sports Med. 2017, 47, 533–544. [Google Scholar] [CrossRef] [PubMed]
- Silva, J.R.; Rumpf, M.C.; Hertzog, M.; Castagna, C.; Farooq, A.; Girard, O.; Hader, K. Acute and residual soccer match-related fatigue: A systematic review and meta-analysis. Sports Med. 2018, 48, 539–583. [Google Scholar] [CrossRef] [PubMed]
- Hader, K.; Rumpf, M.C.; Hertzog, M.; Kilduff, L.P.; Girard, O.; Silva, J.R. Monitoring the athlete match response: Can external load variables predict post-match acute and residual fatigue in soccer? A systematic review with meta-analysis. Sports Med. 2019, 5, 48. [Google Scholar] [CrossRef]
- Drew, M.K.; Finch, C.F. The relationship between training load and injury, illness and soreness: A systematic and literature review. Sports Med. 2016, 46, 861–883. [Google Scholar] [CrossRef] [PubMed]
- Whitehead, S.; Till, K.; Weaving, D.; Jones, B. The use of microtechnology to quantify the peak match demands of the football codes: A systematic review. Sports Med. 2018, 48, 2549–2575. [Google Scholar] [CrossRef] [Green Version]
- Dellaserra, C.L.; Gao, Y.; Ransdell, L. Use of integrated technology in team sports: A review of opportunities, challenges, and future directions for athletes. J. Strength Cond Res. 2014, 28, 556–573. [Google Scholar] [CrossRef] [PubMed]
- Rago, V.; Brito, J.; Figueiredo, P.; Costa, J.; Barreira, D.; Krustrup, P.; Rebelo, A. Methods to collect and interpret external training load using microtechnology incorporating GPS in professional football: A systematic review. Res. Sports Med. 2020, 28, 437–458. [Google Scholar] [CrossRef] [PubMed]
- Palucci Vieira, L.H.; Carling, C.; Barbieri, F.A.; Aquino, R.; Santiago, P.R.P. Match running performance in young soccer players: A systematic review. Sports Med. 2019, 49, 289–318. [Google Scholar] [CrossRef] [PubMed]
- Jones, C.M.; Griffiths, P.C.; Mellalieu, S.D. Training load and fatigue marker associations with injury and illness: A systematic review of longitudinal studies. Sports Med. 2017, 47, 943–974. [Google Scholar] [CrossRef] [PubMed] [Green Version]
- Rampinini, E.; Coutts, A.J.; Castagna, C.; Sassi, R.; Impellizzeri, F.M. Variation in top level soccer match performance. Int. J. Sports Med. 2007, 28, 1018–1024. [Google Scholar] [CrossRef] [PubMed] [Green Version]
- Bradley, P.S.; Carling, C.; Gomez Diaz, A.; Hood, P.; Barnes, C.; Ade, J.; Boddy, M.; Krustrup, P.; Mohri, M. Match performance and physical capacity of players in the top three competitive standards of English professional soccer. Hum. Mov. Sci. 2013, 32, 808–821. [Google Scholar] [CrossRef] [PubMed]
- Mohr, M.; Krustrup, P.; Bangsbo, J. Match performance of high-standard soccer players with special reference to development of fatigue. J. Sports Sci. 2003, 21, 519–528. [Google Scholar] [CrossRef] [Green Version]
- Di Salvo, V.; Baron, R.; Tschan, H.; Calderon Montero, F.J.; Bachl, N.; Pigozzi, F. Performance characteristics according to playing position in elite soccer. Int. J. Sports Med. 2007, 28, 222–227. [Google Scholar] [CrossRef] [PubMed]
- Rebelo, A.; Brito, J.; Seabra, A.; Oliveira, J.; Drust, B.; Krustrup, P. A new tool to measure training load in soccer training and match play. Int. J. Sports Med. 2012, 33, 297–304. [Google Scholar] [CrossRef] [PubMed] [Green Version]
- Issurin, V.B. New horizons for the methodology and physiology of training periodization. Sports Med. 2010, 40, 189–206. [Google Scholar] [CrossRef] [PubMed]
- Kiely, J. Periodization paradigms in the 21st century: Evidence-led or tradition-driven? Int. J. Sports Physiol. Perform. 2012, 7, 242–250. [Google Scholar] [CrossRef] [Green Version]
- Castagna, C.; Varley, M.; Póvoas, S.C.A.; D’Ottavio, S. Evaluation of the match external load in soccer: Methods comparison. Int. J. Sports Physiol. Perform. 2017, 12, 490–495. [Google Scholar] [CrossRef] [PubMed]
- Hill-Haas, S.V.; Dawson, B.; Impellizzeri, F.M.; Coutts, A.J. Physiology of small-sided games training in football. Sports Med. 2011, 41, 199–220. [Google Scholar] [CrossRef] [PubMed]
- Engel, F.A.; Ackermann, A.; Chtourou, H.; Sperlich, B. High-intensity interval training performed by young athletes: A systematic review and meta-analysis. Front Physiol. 2018, 27, 1012. [Google Scholar] [CrossRef] [PubMed] [Green Version]
- Bradley, P.S.; Sheldon, W.; Wooster, B.; Olsen, P.; Boanas, P.; Krustrup, P. High-intensity running in English FA Premier League soccer matches. J. Sports Sci. 2009, 27, 159–168. [Google Scholar] [CrossRef] [PubMed]
- Elkins, M.R.; Herbert, R.D.; Moseley, A.M.; Sherrington, C.; Maher, C. Rating the quality of trials in systematic reviews of physical therapy interventions. Cardiopulm. Phys. Ther. J. 2010, 21, 20–26. [Google Scholar] [CrossRef] [PubMed]
- Moher, D.; Liberati, A.; Tetzlaff, J.; Altman, D.G. Preferred reporting items for systematic reviews and meta-analyses: The PRISMA statement. BMJ 2009, 339, b2535. [Google Scholar] [CrossRef] [Green Version]
- Vandenbroucke, J.P.; von Elm, E.; Altman, D.G.; Gøtzsche, P.C.; Mulrow, C.D.; Pocock, S.J.; Poole, C.; Schlesselman, J.J.; Egger, M.; STROBE Initiative. Strengthening the reporting of observational studies in epidemiology (STROBE): Explanation and elaboration. Int. J. Surg. 2014, 12, 1500–1524. [Google Scholar] [CrossRef] [Green Version]
- Von Elm, E.; Altman, D.G.; Egger, M.; Pocock, S.J.; Gøtzsche, P.C.; Vandenbroucke, J.P. The strengthening the reporting of observational studies in epidemiology (STROBE) statement: Guidelines for reporting observational studies. Lancet 2007, 370, 1453–1457. [Google Scholar] [CrossRef]
- Falck, R.S.; Davis, J.C.; Liu-Ambrose, T. What is the association between sedentary behaviour and cognitive function? A systematic review. Br. J. Sports Med. 2017, 51, 800–811. [Google Scholar] [CrossRef] [PubMed] [Green Version]
- Silva, A.F.; Conte, D.; Clemente, F.M. Decision-Making in Youth Team-Sports Players: A Systematic Review. Int. J. Environ. Res. Public Helath 2020, 17, 3803. [Google Scholar] [CrossRef] [PubMed]
- Abade, E.A.; Gonçalves, B.V.; Leite, N.M.; Sampaio, J.E. Time-motion and physiological profile of football training sessions performed by under-15, under-17 and under-19 elite Portuguese players. Int. J. Sports Physiol. Perform. 2014, 9, 463–470. [Google Scholar] [CrossRef]
- Coutinho, D.; Gonçalves, B.; Figueira, B.; Abade, E.; Marcelino, R.; Sampaio, J. Typical weekly workload of under 15, under 17, and under 19 elite Portuguese football players. J. Sports Sci. 2015, 33, 1229–1237. [Google Scholar] [CrossRef]
- Gore, C. Physiological Tests for Elite Athletes; Human Kinetics: Champaign, IL, USA, 2000. [Google Scholar]
- Campos-Vazquez, M.A.; Toscano-Bendala, F.J.; Mora-Ferrera, J.C.; Suarez-Arrones, L.J. Relationship between internal load indicators and changes on intermittent performance after the preseason in professional soccer players. J. Strength Cond. Res. 2017, 31, 1477–1485. [Google Scholar] [CrossRef]
- Stagno, K.M.; Thatcher, R.; van Someren, K.A. A modified TRIMP to quantify the in-season training load of team sport players. J. Sports Sci. 2007, 25, 629–634. [Google Scholar] [CrossRef] [PubMed]
- Alexiou, H.; Coutts, A.J. A comparison of methods used for quantifying internal training load in women soccer players. Int. J. Sports Physiol. Perform. 2008, 3, 320–330. [Google Scholar] [CrossRef] [Green Version]
- Akenhead, R.; Harley, J.A.; Tweddle, S.P. Examining the external training load of an English premier league football team with special reference to acceleration. J. Strength Cond. Res. 2016, 30, 2424–2432. [Google Scholar] [CrossRef] [PubMed]
- Impellizzeri, F.M.; Rampinini, E.; Coutts, A.J.; Sassi, A.; Marcora, S.M. Use of RPE-based training load in soccer. Med. Sci. Sports Exerc. 2004, 36, 1042–1047. [Google Scholar] [CrossRef]
- Jeong, T.-S.; Reilly, T.; Morton, J.; Bae, S.-W.; Drust, B. Quantification of the physiological loading of one week of ‘pre-season’ and one week of ‘in-season’ training in professional soccer players. J. Sports Sci. 2011, 29, 1161–1166. [Google Scholar] [CrossRef]
- Malone, J.J.; Di Michele, R.; Morgans, R.; Burgess, D.; Morton, J.P.; Drust, B. Seasonal training-load quantification in elite English Premier League soccer players. Int. J. Sports Physiol. Perform. 2015, 10, 489–497. [Google Scholar] [CrossRef] [Green Version]
- Scott, B.R.; Lockie, R.G.; Knight, T.J.; Clark, A.C.; Janse de Jonge, X.A. A comparison of methods to quantify the in-season training load of professional soccer players. Int. J. Sports Physiol. Perform. 2013, 8, 195–202. [Google Scholar] [CrossRef] [PubMed] [Green Version]
- Vahia, D.; Kelly, A.; Knapman, H.; Williams, C.A. Variation in the correlation between heart rate and session rating of perceived exertion-based estimations of internal training load in youth soccer players. Pediatr. Exerc. Sci. 2019, 31, 91–98. [Google Scholar] [CrossRef] [PubMed]
- Dalen, T.; Lorås, H. Monitoring Training and Match Physical Load in Junior Soccer Players: Starters versus Substitutes. Sports 2019, 7, 70. [Google Scholar] [CrossRef] [PubMed] [Green Version]
- Wrigley, R.; Drust, B.; Stratton, G.; Scott, M.; Gregson, W. Quantification of the typical weekly in-season training load in elite junior soccer players. J. Sports Sci. 2012, 30, 1573–1580. [Google Scholar] [CrossRef] [PubMed]
- Rago, V.; Rebelo, A.; Krustrup, P.; Mohr, M. Contextual Variables and Training Load Throughout a Competitive Period in a Top-Level Male Soccer Team. J. Strength Cond. Res. 2019. [Google Scholar] [CrossRef] [PubMed]
- Bangsbo, J.; Iaia, F.M.; Krustrup, P. The Yo-Yo intermittent recovery test: A useful tool for evaluation of physical performance in intermittent sports. Sports Med. 2008, 38, 37–51. [Google Scholar] [CrossRef] [PubMed]
- Banister, E. Modeling elite athletic performance. In Physiological Testing of Elite Athletes; Green, H.J., McDougal, J.D., Wegner, H.A., Eds.; Human Kinetics: Champaign, IL, USA, 1991; pp. 403–424. [Google Scholar]
- Foster, C.; Florhaug, J.A.; Franklin, J.; Gottschall, L.; Hrovatin, L.A.; Parker, S.; Doleshal, P.; Dodge, C. A new approach to monitoring exercise training. J. Strength Cond. Res. 2001, 15, 109–115. [Google Scholar] [PubMed]
- Kelly, D.M.; Strudwick, A.J.; Atkinson, G.; Drust, B.; Gregson, W. The within-participant correlation between perception of effort and heart rate-based estimations of training load in elite soccer players. J. Sports Sci. 2016, 34, 1328–1332. [Google Scholar] [CrossRef]
- Edwards, S. High performance training and racing. In The Heart Rate Monitor Book; Edward, S., Ed.; Feet Fleet Press: Sacramento, CA, USA, 1993; pp. 113–123. [Google Scholar]
- Lucia, A.; Hoyos, J.; Santalla, A.; Earnest, C.; Chicharro, J.L. Tour de France versus Vuelta a España: Which is harder? Med. Sci. Sports Exerc. 2003, 35, 872–878. [Google Scholar]
- Hoff, J.; Wisløff, U.; Engen, L.C.; Kemi, O.J.; Helgerud, J. Soccer specific aerobic endurance training. Br. J. Sports Med. 2002, 36, 218–221. [Google Scholar] [CrossRef]
- Brito, J.; Hertzog, M.; Nassis, G.P. Do match-related contextual variables influence training load in highly trained soccer players? J. Strength Cond. Res. 2016, 30, 393–399. [Google Scholar] [CrossRef] [PubMed]
- Kelly, D.M.; Strudwick, A.J.; Atkinson, G.; Drust, B.; Gregson, W. Quantification of training and match-load distribution across a season in elite English Premier League soccer players. Sci. Med. Footb. 2019, 4, 59–67. [Google Scholar] [CrossRef]
- Los Arcos, A.; Mendez-Villanueva, A.; Martínez-Santos, R. In-season training periodization of professional soccer players. Biol. Sport. 2017, 34, 149–155. [Google Scholar] [CrossRef] [PubMed]
- Oliveira, R.; Brito, J.P.; Martins, A.; Mendes, B.; Marinho, D.A.; Ferraz, R.; Marques, M.C. In-season internal and external training load quantification of an elite European soccer team. PLoS ONE 2019, 14, e0209393. [Google Scholar] [CrossRef] [PubMed] [Green Version]
- Borg, G.; Hassmén, P.; Lagerström, M. Perceived exertion related to heart rate and blood lactate during arm and leg exercise. Eur. J. Appl. Physiol. Occup. Physiol. 1987, 56, 679–685. [Google Scholar] [CrossRef]
- Foster, C. Monitoring training in athletes with reference to overtraining syndrome. Med. Sci. Sports Exerc. 1998, 30, 1164–1168. [Google Scholar] [CrossRef] [PubMed]
- Haddad, M.; Stylianides, G.; Djaoui, L.; Dellal, A.; Chamari, K. Session-RPE method for training load monitoring: Validity, ecological usefulness, and influencing factors. Front. Neurosci. 2017, 11, 612. [Google Scholar] [CrossRef]
- Los Arcos, A.; Méndez-Villanueva, A.; Yanci, J.; Martínez-Santos, R. Respiratory and muscular perceived exertion during official games in professional soccer players. Int. J. Sports Physiol. Perform. 2016, 11, 301–304. [Google Scholar] [CrossRef]
- Los Arcos, A.; Yanci, J.; Mendiguchia, J.; Gorostiaga, E.M. Rating of muscular and respiratory perceived exertion in professional soccer players. J. Strength Cond. Res. 2014, 28, 3280–3288. [Google Scholar] [CrossRef]
- Chatard, J.-C.; Atlaoui, D.; Pichot, V.; Gourné, C.; Duclos, M.; Guezennec, Y.-C. Training follow up by questionnaire fatigue, hormones and heart rate variability measurements. Sci. Sports 2003, 18, 302–304. [Google Scholar] [CrossRef]
- Hooper, S.L.; Mackinnon, L.T. Monitoring overtraining in athletes. Sports Med. 1995, 20, 321–327. [Google Scholar] [CrossRef] [PubMed]
- Aguiar, M.V.; Botelho, G.M.; Gonçalves, B.S.; Sampaio, J.E. Physiological responses and activity profiles of football small-sided games. J. Strength Cond. Res. 2013, 27, 1287–1294. [Google Scholar] [CrossRef]
- Hill-Haas, S.; Rowsell, G.; Coutts, A.; Dawson, B. The reproducibility of physiological responses and performance profiles of youth soccer players in small-sided games. Int. J. Sports Physiol. Perform. 2008, 3, 393–396. [Google Scholar] [CrossRef] [PubMed] [Green Version]
- Martin-Garcia, A.S.; Diaz, A.G.; Bradley, P.S.; Morera, F.; Casamichana, D. Quantification of a professional football team’s external load using a microcycle structure. J. Strength Cond. Res. 2018, 32, 3511–3518. [Google Scholar] [CrossRef] [PubMed] [Green Version]
- Stevens, T.G.; de Ruiter, C.J.; Twisk, J.W.R.; Savelsbergh, G.J.P.; Beek, P.J. Quantification of in-season training load relative to match load in professional Dutch Eredivisie football players. Sci. Med. Football. 2017, 1, 117–125. [Google Scholar] [CrossRef]
- Minetti, A.E.; Gaudino, P.; Seminati, E.; Cazzola, D. The cost of transport of human running is not affected, as in walking, by wide acceleration/deceleration cycles. J. Appl. Physiol. 2013, 114, 498–503. [Google Scholar] [CrossRef] [PubMed] [Green Version]
- Osgnach, C.; Poser, S.; Bernardini, R.; Rinaldo, R.; Di Prampero, P.E. Energy cost and metabolic power in elite soccer: A new match analysis approach. Med. Sci. Sports Exerc. 2010, 42, 170–178. [Google Scholar] [CrossRef]
- Rampinini, E.; Alberti, G.; Fiorenza, M.; Riggio, M.; Sassi, R.; Borges, T.O.; Coutts, A.J. Accuracy of GPS devices for measuring high-intensity running in field-based team sports. Int. J. Sports Med. 2015, 36, 49–53. [Google Scholar] [CrossRef] [PubMed] [Green Version]
- Anderson, L.; Orme, P.; Di Michele, R.; Close, G.L.; Morgans, R.; Drust, B.; Morton, J.P. Quantification of training load during one-, two- and three-game week schedules in professional soccer players from the English Premier League: Implications for carbohydrate periodisation. J. Sports Sci. 2016, 34, 1250–1259. [Google Scholar] [CrossRef] [PubMed] [Green Version]
- Clemente, F.M.; Seerden, G.; van der Linden, C.M. Quantifying the physical loading of five weeks of pre-season training in professional soccer teams from Dutch and Portuguese leagues. Physiol. Behav. 2019, 209, 112588. [Google Scholar] [CrossRef]
- Clemente, F.M.; Owen, A.; Serra-Olivares, J.; Nikolaidis, P.T.; van der Linden, C.M.I.; Mendes, B. Characterization of the weekly external load profile of professional soccer teams from Portugal and The Netherlands. J. Hum. Kinet. 2019, 66, 155–164. [Google Scholar] [CrossRef] [Green Version]
- Gaudino, P.; Iaia, F.M.; Alberti, G.; Strudwick, A.J.; Atkinson, G.; Gregson, W. Monitoring training in elite soccer players: Systematic bias between running speed and metabolic power data. Int. J. Sports Med. 2013, 34, 963–968. [Google Scholar] [CrossRef]
- Sanchez-Sanchez, J.; Hernández, D.; Martin, V.; Sanchez, M.; Casamichana, D.; Rodriguez-Fernandez, A.; Ramirez-Campillo, R.; Nakamura, F.Y. Assessment of the external load of amateur soccer players during four consecutive training microcycles in relation to the external load during the official match. Mot. Rev. Educ. Física 2019, 25, e101938. [Google Scholar] [CrossRef] [Green Version]
- Di Salvo, V.; Gregson, W.; Atkinson, G.; Tordoff, P.; Drust, B. Analysis of high intensity activity in Premier League soccer. Int. J. Sports Med. 2009, 30, 205–212. [Google Scholar] [CrossRef] [PubMed]
- Bradley, P.S.; Di Mascio, M.; Peart, D.; Olsen, P.; Sheldon, B. High-intensity activity profiles of elite soccer players at different performance levels. J. Strength Cond. Res. 2010, 24, 2343–2351. [Google Scholar] [CrossRef]
- Gregson, W.; Drust, B.; Atkinson, G.; Salvo, V. Match-to-match variability of high-speed activities in Premier League soccer. Int. J. Sports Med. 2010, 31, 237–242. [Google Scholar] [CrossRef] [Green Version]
- Clemente, F.M.; Rabbani, A.; Conte, D.; Castillo, D.; Afonso, J.; Truman Clark, C.C.; Nikolaidis, P.T.; Rosemann, T.; Knechtle, B. Training/match external load ratios in professional soccer players: A full-season study. Int. J. Environ. Res. Public Health 2019, 16, 3057. [Google Scholar] [CrossRef] [PubMed] [Green Version]
- Dwyer, D.B.; Gabbett, T.J. Global positioning system data analysis: Velocity ranges and a new definition of sprinting for field sport athletes. J. Strength Cond. Res. 2012, 26, 818–824. [Google Scholar] [CrossRef] [PubMed]
- Baptista, I.; Johansen, D.; Figueiredo, P.; Rebelo, A.; Pettersen, S.A. Positional Differences in Peak- and Accumulated- Training Load Relative to Match Load in Elite Football. Sports 2020, 8, 1. [Google Scholar] [CrossRef] [Green Version]
- Marynowicz, J.; Kikut, K.; Lango, M.; Horna, D.; Andrzejewski, M. Relationship between the Session-RPE and External Measures of Training Load in Youth Soccer Training. J. Strength Cond. Res. 2020, 34, 2800–2804. [Google Scholar] [CrossRef] [PubMed]
- Owen, A.L.; Djaoui, L.; Newton, M.; Malone, S.; Mendes, B. A contemporary multi-modal mechanical approach to training monitoring in elite professional soccer. Sci. Med. Footb. 2017, 1, 216–221. [Google Scholar] [CrossRef]
- Dellal, A.; Chamari, K.; Wong, D.P.; Ahmaidi, S.; Keller, D.; Barros, R.; Bisciotti, G.N.; Carling, C. Comparison of physical and technical performance in European soccer match-play: FA Premier League and La Liga. Eur. J. Sport Sci. 2011, 11, 51–59. [Google Scholar] [CrossRef]
- Rampinini, E.; Bosio, A.; Ferraresi, I.; Petruolo, A.; Morelli, A.; Sassi, A. Match-related fatigue in soccer players. Med. Sci. Sports Exerc. 2011, 43, 2161–2170. [Google Scholar] [CrossRef] [PubMed]
- Dalen, T.; Ingebrigtsen, J.; Ettema, G.; Hjelde, G.H.; Wisløff, U. Player Load, Acceleration, and Deceleration During Forty-Five Competitive Matches of Elite Soccer. J. Strength Cond. Res. 2016, 30, 351–359. [Google Scholar] [CrossRef]
- Ingebrigtsen, J.; Dalen, T.; Hjelde, G.H.; Drust, B.; Wisløff, U. Acceleration and sprint profiles of a professional elite football team in match play. Eur. J. Sport Sci. 2015, 15, 101–110. [Google Scholar] [CrossRef] [PubMed]
- Beato, M.; Devereux, G.; Stiff, A. Validity and reliability of global positioning system units (STATSports Viper) for measuring distance and peak speed in sports. J. Strength Cond. Res. 2018, 32, 2831–2837. [Google Scholar] [CrossRef]
- Clemente, F.M.; Silva, R.; Castillo, D.; Los Arcos, A.; Mendes, B.; Afonso, J. Weekly Load Variations of Distance-Based Variables in Professional Soccer Players: A Full-Season Study. Int. J. Environ. Res. Public Health 2020, 17, 3300. [Google Scholar] [CrossRef] [PubMed]
- Anderson, L.; Orme, P.; Di Michele, R.; Close, G.L.; Milsom, J.; Morgans, R.; Drust, B.; Morton, J.P. Quantification of seasonal-long physical load in soccer players with different starting status from the English Premier League: Implications for maintaining squad physical fitness. Int. J. Sports Physiol. Perform. 2016, 11, 1038–1046. [Google Scholar] [CrossRef] [Green Version]
- Rago, V.; Brito, J.; Figueiredo, P.; Krustrup, P.; Rebelo, A. Relationship between external load and perceptual responses to training in professional football: Effects of quantification method. Sports 2019, 7, 68. [Google Scholar] [CrossRef] [PubMed] [Green Version]
- Owen, A.L.; Lago-Peñas, C.; Gómez, M.-Á.; Mendes, B.; Dellal, A. Analysis of a training mesocycle and positional quantification in elite European soccer players. Int. J. Sports Sci. Coach. 2017, 12, 665–676. [Google Scholar] [CrossRef]
- Di Salvo, V.; Adam, C.; Barry, M.; Marco, C. Validation of Prozone®: A new video-based performance analysis system. Int. J. Perform. Anal. Sport 2006, 6, 108–119. [Google Scholar]
- Swallow, W.E.; Skidmore, N.; Page, R.M.; Malone, J.J. An examination of in-season external training load in semi-professional soccer players: Considerations of one and two match weekly microcycles. Int. J. Sports Sci. Coach. 2020. [Google Scholar] [CrossRef]
- Johnston, R.J.; Watsford, M.L.; Pine, M.J.; Spurrs, R.W. Standardisation of acceleration zones in professional field sport athletes. Int. J. Sports Sci. Coach. 2014, 9, 1161–1168. [Google Scholar] [CrossRef]
- Malone, J.J.; Lovell, R.; Varley, M.C.; Coutts, A.J. Unpacking the Black Box: Applications and Considerations for Using GPS Devices in Sport. Int. J. Sports Physiol. Perform. 2017, 12 (Suppl. 2), S218–S226. [Google Scholar] [CrossRef] [PubMed] [Green Version]
- McLellan, C.P.; Lovell, D.I.; Gass, G.C. biochemical and endocrine responses to impact and collision during elite rugby league match play. J. Strength Cond. Res. 2011, 25, 1553–1562. [Google Scholar] [CrossRef]
- Lovell, T.W.J.; Sirotic, A.C.; Impellizzeri, F.M.; Coutts, A.J. Factors affecting perception of effort (session rating of perceived exertion) during rugby league training. Int. J. Sports Physiol. Perform. 2013, 8, 62–69. [Google Scholar] [CrossRef] [PubMed] [Green Version]
- Casamichana, D.; Castellano, J.; Calleja-Gonzalez, J.; San Román, J.; Castagna, C. Relationship between indicators of training load in soccer players. J. Strength Cond. Res. 2013, 27, 369–374. [Google Scholar] [CrossRef] [PubMed]
- Nikolaidis, P.T.; Clemente, F.M.; van der Linden, C.M.I.; Rosemann, T.; Knechtle, B. Validity and reliability of 10-Hz global positioning system to assess in-line movement and change of direction. Front. Physiol. 2018, 9, 228. [Google Scholar] [CrossRef] [PubMed] [Green Version]
- Boyd, L.J.; Ball, K.; Aughey, R.J. The reliability of MinimaxX accelerometers for measuring physical activity in Australian football. Int. J. Sports Physiol. Perform. 2011, 6, 311–321. [Google Scholar] [CrossRef] [PubMed]
- Gaudino, P.; Iaia, F.M.; Strudwick, A.J.; Hawkins, R.D.; Alberti, G.; Atkinson, G.; Gregson, W. Factors influencing perception of effort (session rating of perceived exertion) during elite soccer training. Int. J. Sports Physiol. Perform. 2015, 10, 860–864. [Google Scholar] [CrossRef] [Green Version]
- Cunniffe, B.; Proctor, W.; Baker, J.S.; Davies, B. An evaluation of the physiological demands of elite rugby union using global positioning system tracking software. J. Strength Cond. Res. 2009, 23, 1195–1203. [Google Scholar] [CrossRef] [PubMed] [Green Version]
- Di Prampero, P.E.; Fusi, S.; Sepulcri, L.; Morin, J.B.; Belli, A.; Antonutto, G. Sprint running: A new energetic approach. J. Exp. Biol. 2005, 208, 2809–2816. [Google Scholar] [CrossRef] [PubMed] [Green Version]
- Lago, C. The influence of match location, quality of opposition, and match status on possession strategies in professional association football. J. Sports Sci. 2009, 27, 1463–1469. [Google Scholar] [CrossRef]
- Lago, C.; Casais, L.; Dominguez, E.; Sampaio, J. The effects of situational variables on distance covered at various speeds in elite soccer. Eur. J. Sport Sci. 2010, 10, 103–109. [Google Scholar] [CrossRef]
- Carling, C.; Gregson, W.; McCall, A.; Moreira, A.; Wong, D.P.; Bradley, P.S. Match running performance during fixture congestion in elite soccer: Research issues and future directions. Sports Med. 2015, 45, 605–613. [Google Scholar] [CrossRef] [Green Version]
- Malone, J.J.; Jaspers, A.; Helsen, W.; Merks, B.; Frencken, W.G.; Brink, M.S. Seasonal training load and wellness monitoring in a professional soccer goalkeeper. Int. J. Sports Physiol. Perform. 2018, 13, 672–675. [Google Scholar] [CrossRef]
- Johnston, R.J.; Watsford, M.L.; Kelly, S.J.; Pine, M.J.; Spurrs, R.W. Validity and interunit reliability of 10 Hz and 15 Hz GPS units for assessing athlete movement demands. J. Strength Cond. Res. 2014, 28, 1649–1655. [Google Scholar] [CrossRef]
- Scott, M.T.; Scott, T.J.; Kelly, V.G. The validity and reliability of global positioning systems in team sport: A brief review. J. Strength Cond. Res. 2016, 30, 1470–1490. [Google Scholar] [CrossRef] [PubMed]
- Kempton, T.; Sullivan, C.; Bilsborough, J.C.; Cordy, J.; Coutts, A.J. Match-to-match variation in physical activity and technical skill measures in professional Australian Football. J. Sci. Med. Sport 2015, 18, 109–113. [Google Scholar] [CrossRef] [PubMed]
- Peeters, A.; Carling, C.; Piscione, J.; Lacome, M. In-Match physical performance fluctuations in international rugby sevens competition. J. Sports Sci. Med. 2019, 18, 419–426. [Google Scholar] [PubMed]
- Sweeting, A.J.; Aughey, R.J.; Cormack, S.J.; Morgan, S. Discovering frequently recurring movement sequences in team-sport athlete spatiotemporal data. J. Sports Sci. 2017, 35, 2439–2445. [Google Scholar] [CrossRef] [Green Version]
- Lloyd, R.S.; Oliver, J.L. The youth physical development model: A new approach to long-term athletic development. Strength Cond. J. 2012, 34, 61–72. [Google Scholar] [CrossRef] [Green Version]
- Harper, D.J.; Carling, C.; Kiely, J. High-intensity acceleration and deceleration demands in elite team sports competitive match play: A systematic review and meta-analysis of observational studies. Sports Med. 2019, 49, 1923–1947. [Google Scholar] [CrossRef] [PubMed] [Green Version]


| Search Term | Keywords | |
|---|---|---|
| Football (population) | 1 | (“football” OR “soccer” OR “association football”) |
| Training load (dependent variable) | 2 | (“training load” OR “external training load” OR “workload” OR “internal training load” OR “external load” OR “internal load”) |
| Periodization (independent variables) | 3 | (“periodization” OR “schedule” OR “distribution” OR “week” OR “microcycle” OR “mesocycle” OR “season phase”) AND (“in-season” OR “pre-season” OR “preparation” OR “off-season” OR “post-season”) |
| Boolean search phrase (final search) | 4 | 1 AND (2 OR 3) |
| Construct | Measure | Measurement | Thresholds and/or Metric Formula | Reference | Further Reading |
|---|---|---|---|---|---|
| Internal Load | Heart Rate | % HRmax | Zone 1: ≤75% HRmax; zone 2: 75–84.9% HRmax; zone 3: 85–89.9% HRmax; zone 4: ≥90% HRmax. | [47,48] | [49] |
| Zone 1: ≤75% HRmax; zone 2: 75–84.9% HRmax; zone 3: 85–89.9% HRmax; zone 4: ≥90% HRmax. | [50] | [51] | |||
| Zone 1: 50–60% HRmax; zone 2: 60–70% HRmax; zone 3: 70–80% HRmax; zone 4: 80–90% HRmax; zone 5: 90–100% HRmax. | [52,53,54,55,56,57,58,59,60,61] | [62,63,64] | |||
| LTzone | zone 1: <LT; zone 2: between LT and AT; zone 3: >AT (k = 1 for zone 1; k = 2 for zone 2, and k = 3 for zone 3) | [52,54] | [63] | ||
| Bannister TRIMP | D × (∆HRratio) × (0.64 × e b × HRB) (D = (∆HRratio) [(HRTS– HRB)/(HRmax– HRB)]) weighting factor (k) = 1.62 (females);1.92 (males) | [50,52,54,57,58] | [63] | ||
| Edward’s TL | D (zone 1) × 1+ D (zone 2) × 2 + D (zone 3) × 3+ D (zone 4) × 4 + D (zone 5) × 5 | [52,54,57,65] | [66] | ||
| Lucia’s TL/LTzone TL | D (zone 1) × 1+ D (zone 2) × 2 + D (zone 3) × 3 | [52,54] | [66,67] | ||
| Stagno TL/TRIMPMOD | [(HRTS − HRB)/(HRmax − HRB)]) weighting factor = 0.1225e3.9434x | [50] | [51] | ||
| HR-TL | ∑ (time (min) spent in zone × numerical factor of zone) | [56] | [68] | ||
| Perceived Exertion | sRPE | RPE × D | [52,54,55,56,57,58,59,69,70,71,72] | [64,73,74,75] | |
| sRPEresp TL/sRPEmusc TL | sRPE × D | [71] | [76,77] | ||
| Fatigue score | Seven-point scale: training exertion, sleep quality, muscle soreness, infection/illness, concentration, training efficiency, anxiety/irritability, and general stress. | [69] | [78] | ||
| HI | Fatigue, stress muscle soreness, and quality sleep. | [72] | [79] | ||
| External load | Distance and speed | Speed zones/ thresholds | Zone 1: 0–6.9 km× h−1; zone 2: 7.0–9.9 km × h−1; zone 3: 10.0–12.9 km × h−1; zone 4: 13–15.9 km × h−1; zone 5: 16–17.9 km × h−1; and zone 6: ≥18.0 km × h−1 (sprints). | [47,48] | [80,81] |
| Walking/jogging: <10.8 km × h−1; HSR: ≥20.9 km × h−1; SPR: >24.1 km × h−1. | [53,82,83] | [32,40,84,85,86] | |||
| Standing: 0–0.6 km × h−1; walking: 0.7–7.1 km × h−1; jogging: 7.2–14.3 km × h−1; running: 14.4–19.7 km × h−1; HSR: 19.8–25.1 km × h−1; SPR: >25.1 km × h−1. | [87,88,89,90,91] | [92,93] | |||
| Running: 11.4–18.9 km × h−1; HSR: 15.0–18.9 km × h−1; SPR: >19.0 km × h−1. | [58] | [94] | |||
| Walking: 0–6.9 km × h−1; jogging: 7.0–13.9 km × h−1; Running: 14.0–20.0 km × h−1; SPR: >20.0 km × h−1. | [88,89,95] | [96] | |||
| Low-speed running: <14.4 km × h−1; HSR: >19.8; SPR: >25.2 km × h−1. | [57,70,91,97,98,99] | [11,100,101,102,103,104] | |||
| Low-speed running: <14 km × h−1; HSR: 14.4 km × h−1; HSR: 19.8–25.2 km × h−1 | [102,105] | [104] | |||
| HSR: >19 km × h−1. | [72] | [104] | |||
| HSR: >16 km × h−1. | [61] | [85] | |||
| Standing/walking: 0–7.2 km × h−1; low intensity running: 7.3–14.3 km × h−1; moderate intensity running: 14.4–21.5 km × h−1; HSR: 19.8–25.1 km × h−1; very HSR > 25.1 km × h−1. | [106,107,108] | [30,40,109] | |||
| Acceleration | Acceleration zones/ thresholds | Low: 1–2 m × s−2; Moderate: 2–3 m × s−2; High: >3 m × s−2. | [53] | [85] | |
| ACC: >2.5 m × s−2; DEC: <2.5 m × s−2. | [91] | [40] | |||
| ACC: >2 m × s−2. | [99,110] | [111] | |||
| ACC/DEC: >3 m × s−2. | [61,82,98] | [86] | |||
| ACC: >4 m × s−2. | [108] | [100] | |||
| ACC: medium (1.5–3.0 m × s−2); high (>3.0 m × s−2). DEC: medium (−1.5 to −3.0 m × s−2); high (<−3.0 m × s−2). | [82] | [102,111] | |||
| Accelerometry | Body impacts/body load | Zone 1: 5.0–6.0 g; zone 2: 6.1–6.5 g; zone 3: 6.5–7.0 g; zone 4: 7.1–8.0 g; zone 5: 8.1–10.0 g; zone 6: ≥10.1 g. | [47,48,98,99] | [112,113,114] | |
| Player load | [53,88,89,115] | [10,116] | |||
| Player load | [57] | [117] | |||
| Dynamic-stress load | ∑ (body load for each zone × body mass) | [118] | [119] | ||
| Ratios/ scores | Ratio/scores (Weekly TL) | Work: rest ratio | High to very high: >16 km × h−1; moderate: 10.0–15.9 km × h−1; low intensity: 7.0–9.9 km × h−1; very low intensities: 0–6.9 km × h−1 (normalized for each 100 m). | [47] | [80] |
| Work: rest ratio | WRR: distance covered at a speed ≥ 4 km × h−1 period of activity or work divided by the distance covered at a speed <3.9 km × h−1; period of recovery or rest); FEHS ≥ 18 km × h−1; FESS ≥ 21 km × h−1. | [115] | [119] | ||
| THIA (%) | ∑ (MSR, HSR and SPR) | [107] | originally proposed by Rago et al. [107] | ||
| Ratio/scores (Weekly TL and ML) | TMr | (Weekly load)/(Match load) | [95] | originally proposed by Clemente et al. [95] | |
| Session volume score | [97] | originally proposed by Owen et al. [97] | |||
| Session intensity score | [97] | originally proposed by Owen et al. [97] | |||
| Energy cost and metabolic power | Equivalent- estimation | EC | EC = 155.4 × 155.4 × ES4 × 155.4 × ES3 × 155.4 × ES2 × 155.4 × ES × EM × KT | [90] | [84,85] |
| Pmet | HP: 20–35 W× kg−1; EP: 35–55 W × kg−1;: >55 W × kg. | [82,83,118] | [84,85] |
| Reference (Year) | Study Design | Population | Competitive Level, Country | Sample (N) | Sex | Age (y) | Stature | Body Mass (kg) | QS |
|---|---|---|---|---|---|---|---|---|---|
| Abade et al. [47] | Prospective Cohort | Youth | Elite, Portugal | 151 | Male | U15 (n = 56): 14.0 ± 0.2 U17 (n = 66): 15.8 ± 0.4 U19 (n = 29): 17.8 ± 0.6 | U15 (n = 56): 1.71 ± 0.07 U17 (n = 66): 1.76 ± 0.06 U19 (n = 29): 1.77 ± 0.07 | U15 (n = 56): 60.1 ± 6.3 U17 (n = 66): 65.8 ± 5.5 U19 (n = 29): 70.0 ± 5.6 | 0.78 |
| Akenhead et al. [53] | Prospective Cohort | Adult | Elite, UK | 33 | Male | 24.0 ± 4.0 | 1.83 ± 0.05 | 82 ± 8.0 | 0.87 |
| Alexiou and Coutts [52] | Prospective cohort | Adult | Elite, Portugal | 15 | Female | 19.3 ± 2.0 | 1.69 ± 0.05 | 64.8 ± 7.7 | 0.83 |
| Anderson et al. [87] | Prospective Cohort | Adult | Elite, UK | 12 | Male | 25.0 ± 5.0 | 1.80 ± 0.05 | 81.5 ± 7.5 | 0.78 |
| Anderson et al. [106] | Prospective Cohort | Youth | Elite, UK | 19 | Male | 25.0 ± 4.0 | 1.78 ± 0.06 | 80.6 ± 8.3 | 0.74 |
| Baptista et al. [97] | Prospective Cohort | Adult | Elite, Norway | 18 | Male | ND | ND | ND | 0.74 |
| Brito et al. [69] | Prospective Cohort | Adult | Elite, France | 13 | Male | 18.6 ± 0.5 | 1.77 ± 0.05 | 70.0 ± 7.3 | 0.78 |
| Campos-Vazquez et al. [50] | Prospective Cohort | Adult | Elite, Spain | 9 | Male | 26.7 ± 4.5 | 1.77 ± 0.07 | 74.5 ± 5.7 | 0.74 |
| Casamichana et al. [115] | Prospective Cohort | Adult | Elite, Spain | 28 | Male | 22.9 ± 4.2 | 1.77 ± 0.05 | 73.6 ± 4.4 | 0.87 |
| Clemente et al. [89] | Prospective Cohort | Adult | Elite, Portugal and The Netherlands | 29 | Male | PT (n = 14): 19.21 ± 1.05 NL (n = 15): 25.14 ± 3.90 | PT (n = 14): 1.80 ± 0.06 NL (n = 15): 1.79 ± 0.06 | PT (n = 14): 74.07 ± 6.21 NL (n = 15): 73.21 ± 6.46 | 0.74 |
| Clemente et al. [95] | Prospective Cohort | Adult | Elite, Portugal | 27 | Male | 24.9 ± 3.5 | 1.69 ± 0.41 | 71.6 ± 18.7 | 0.83 |
| Clemente et al. [88] | Prospective Cohort | Youth | Elite, Portugal and The Netherlands | 89 | Male | NL1 (n = 18): 25.39 ± 4.82 NL2 (n = 24): 21.46 ± 2.50 NL3 (n = 23): 23.00 ± 3.70 PT (n = 24): 24.70 ± 2.92 | NL1 (n =18):1.84 ± 0.05 NL2 (n = 24):1.80 ± 0.08 NL3 (n = 23):1.84 ± 0.06 PT (n = 24): 1.81 ± 0.06 | NL1 (n = 18): 77.29 ± 4.73 NL2 (n = 24): 71.73 ± 8.61 NL3 (n = 23): 74.50 ± 6.90 PT (n = 24): 77.48 ± 6.80 | 0.87 |
| Clemente et al. [105] | Prospective Cohort | Adult | Elite, Europe * | 19 | Male | 26.5 ± 4.3 | 1.80 ± 7.3 | 75.6 ± 9.6 | 0.83 |
| Coutinho et al. [47] | Prospective Cohort | Adult | Elite, Portugal | 151 | Male | U15 (n = 2 56): 14.0 ± 0.2 U17 (n = 66): 15.8 ± 0.4 U19 (n = 29): 17.8 ± 0.6 | U15 (n = 56): 1.71 ± 0.07 U17 (n = 66): 1.76 ± 0.06 U19 (n = 29): 1.77 ± 0.07 | NL1 (n = 18): 77.29 ± 4.73 NL2 (n = 24): 71.73 ± 8.61 NL3 (n = 23): 74.50 ± 6.90 PT (n = 24): 77.48 ± 6.80 | 0.74 |
| Dalen et Lorås [102] | Prospective Cohort | Youth | Pre-Elite, Norway | 18 | Male | 15.7 ± 0.5 | 1.78 ± 4.6 | 67.1 ± 5.5 | 0.83 |
| Gaudino et al. [90] | Prospective Cohort | Adult | Elite, UK | 26 | Male | 26.0 ± 5.0 | 1.82 ± 0.07 | 79.0 ± 5.0 | 0.78 |
| Gaudino et al. [118] | Prospective Cohort | Youth | Elite, UK | 22 | Male | 26.0 ± 6.0 | 1.82 ± 0.07 | 79.0 ± 7.0 | 0.74 |
| Impellizzeri et al. [54] | Prospective Cohort | Adult | ND | 19 | Male | 17.6 ± 0.7 | 1.79 ± 0.05 | 70.2 ± 4.7 | 0.87 |
| Jeong et al. [55] | Prospective Cohort | Adult | Elite, Korea | 20 | Male | 24.0 ± 3.0 | 1.78 ± 0.06 | 73.0 ± 4.0 | 0.78 |
| Kelly et al. [70] | Prospective Cohort | Adult | Elite, UK | 111 | Male | 27.0 ± 5.4 | 1.81 ± 0.07 | 77.0 ± 6.6 | 0.78 |
| Kelly et al. [65] | Prospective Cohort | Youth | Elite, UK | 26 | Male | 27.0 ± 5.4 | 1.81 ± 0.07 | 77.0 ± 6.6 | 0.83 |
| Los Arcos et al. [71] | Prospective Cohort | Adult | Elite, Spain | 24 | Male | 20.3 ± 2.0 | 1.79 ± 0.05 | 73.0 ± 5.6 | 0.74 |
| Malone et al. [56] | Prospective Cohort | Adult | Elite, UK | 30 | Male | 25.0 ± 5.0 | 1.83 ± 0.07 | 80.5 ± 7.4 | 0.70 |
| Martin-Garcia et al. [82] | Prospective Cohort | Adult | Elite, Spain | 24 | Male | 20.0 ± 2.0 | 1.78 ± 0.64 | 70.2 ± 6.1 | 0.78 |
| Marynowicz et al. [98] | Prospective Cohort | Youth | Elite, ND | 18 | Male | 17.1 ± 0.96 | 1.79 ± 4.77 | 70.9 ± 4.7 | 0.83 |
| Oliveira et al. [72] | Prospective Cohort | Adult | Elite, ND | 19 | Male | 26.3 ± 4.3 | 1.84 ± 0.07 | 78.5 ± 6.8 | 0.89 |
| Owen et al. [108] | Prospective Cohort | Adult | Elite, ND | 16 | Male | 26.7 ± 4.07 | 1.83 ± 0.06 | 78.4 ± 8.03 | 0.74 |
| Owen et al. [99] | Prospective Cohort | Adult | Elite, Swiss | 29 | Male | 26.7 ± 4.0 | 1.83 ± 0.06 | 78.4 ± 8.0 | 0.83 |
| Rago et al. [107] | Prospective Cohort | Adult | Elite, Italy | 13 | Male | 25.8 ± 3.5 | 1.82 ± 0.06 | 78.3 ± 5.9 | 0.87 |
| Rago et al. [61] | Prospective Cohort | Adult | Elite, Spain | 23 | Male | 27.8 ± 3.9 | 1.78 ± 6.4 | 72.7 ± 11.9 | 0.87 |
| Sanchez-Sanchez et al. [91] | Prospective Cohort | Adult | Amateur, Brazil | 160 | Male | 20.8 ± 1.7 | 1.76 ± 0.04 | 69.7 ± 2.9 | 0.65 |
| Scott et al. [57] | Prospective Cohort | Adult | Elite, Australian | 15 | Male | 24.9 ± 5.4 | 1.81 ± 0.07 | 77.6 ± 7.5 | 0.74 |
| Swallow et al. [110] | Prospective Cohort | Adult | Pre-Elite, UK | 24 | Male | 26.0 ± 6.0 | 1.81 ± 8.0 | 79.7 ± 7.8 | 0.74 |
| Stevens et al. [83] | Prospective Cohort | Youth | Elite, The Netherlands | 28 | Male | 21.9 ± 3.2 | 1.82 ± 0.07 | 76 ± 7.0 | 0.83 |
| Vahia et al. [58] | Prospective Cohort | Youth | Elite, UK | 15 | Male | 16.7 ± 1.0 | 1.76 ± 0.05 | 69.9 ± 6.9 | 0.74 |
| Wrigley et al. [60] | Prospective Cohort | Youth | Elite, UK | 24 | Male | U14 (n = 8): 13.0 ± 1.0 U16 (n = 8): 15.0 ± 1.0 U18 (n = 8): 17.0 ± 1.0 | U14 (n = 8): 1.61 ± 0.06 U16 (n = 8): 1.74 ± 0.07 U18 (n = 8): 1.79 ± 0.05 | U14 (n = 8): 48.0 ± 10.3 U17 (n = 66): 67.3 ± 8.1 U19 (n = 29): 73.5 ± 4.4 | 0.78 |
| Reference (Year) | Observations Sample | Training Load Measures/Metrics | Device Specification (Manufacturer Model and Specs) | ||||||
|---|---|---|---|---|---|---|---|---|---|
| Monitoring Period | Training Sessions | TS/Week | Sets | Match-Play | Internal Load | External Load | Internal Load | External Load | |
| Abade et al. [47] | 9 weeks | 38 TS | 4 TS/wk (~90 min) | 612 | ND | HR: %HRmax | Distance and speed: TD covered (m); relative distance or pace (m × min−1); D in different speed zone (km × h−1); and sprints (number and time interval). Accelerometry: absolute and relative body impacts (g). | 5 Hz short-range telemetry system (Polar Team System, Kempele, Finland). | 15 Hz GPS and 100-Hz MEMS (SPI-Pro X II, GPSports, Canberra, Australia). |
| Akenhead et al. [53] | 12 weeks | 48 TS | 5 TS/wk | 295 | 1 MP/wk (90 min) | HR: %HRmax | Distance and speed: TD covered (m); HSR (km × h−1); and SPR (km × h−1). Acceleration: ACCTOTAL (m × s−2) and DECTOTAL (m × s−2). Accelerometry: PL (g). | 1 Hz short-range telemetry system (Team 2, Polar Electro, Kempele, Finland). | 10 Hz GPS and 100-Hz MEMS (Catapult MiniMaxx S4, Firmware 6.7, Melbourne, Australia). |
| Alexiou and Coutts [52] | 16 weeks | 623 TS | ND | ND | 623 MP | HR: Bannister TL, Edward’s TL and LTzone TL. | ND | 1 Hz short-range telemetry system Polar NV, Polar Electro, Kempele, Finland). | ND |
| Anderson et al. [87] | 3 weeks | 10 TS | 5 TS/wk | 145 | 6 MP | ND | Distance and speed: TS duration (min); TD covered (m); AvS (m × min−1); and D in different speed zones (km × h−1). | ND | 10 Hz GPS (Viper pod 2, STATSports®, Newry, Northern Ireland) and semi-automatic multiple-camera system (Prozone Sports Ltd., Leeds, United Kingdom). |
| Anderson et al. [106] | 39 weeks | 181 TS | ND | 2182 | 7 MP | ND | Distance and speed: TS duration (min); TD covered (m); and D in different speed zones (km × h−1). | ND | 10 Hz GPS (Viper pod 2, STATSports, Northern Ireland) and semi-automatic multiple-camera system (Prozone Sports Ltd.®, Leeds, United Kingdom). |
| Baptista et al. [97] | 11 weeks | 537 | 4 TS/wk | 630 | 15 M | ND | Distance and speed: TD covered (m); HSRpeak (km × h−1); and SPRpeak (km × h−1). Acceleration: ACCpeak (m × s−2) and DECpeak (m × s−2). | ND | Stationary radio-based tracking system (ZXY Sport Tracking System, Trondheim, Norway) |
| Brito et al. [69] | 36 weeks | 2591 TS | 5–11 TS/wk | ND | ND | Perceived Exertion: RPE, sRPE, and perceived fatigue. | ND | CR10 and fatigue questionnaire. | ND |
| Campos-Vazquez et al. [50] | ND | ND | 5 TS/wk (~90 min) | ND | ND | HR: Edwards TL and Stagno TL/TRIMPMOD. Perceived Exertion: RPE and sRPE. | ND | CR10 and 1 Hz short-range telemetry system (Team 2, Polar Electro, Kempele, Finland). | ND |
| Casamichana et al. [115] | ND | 44 TS | 2/3 TS/wk (~90 min) | ND | ND | ND | Distance and speed: TD covered (m); DHS (km × h−1); and DSS (km × h−1). Accelerometry: PL (g). Ratios/scores: WRR (km × h−1); FEHS (km × h−1); and DHS (km × h−1). | ND | 10 Hz GPS and 100-Hz MEMS (Catapult MinimaxX Team Sport 4.0, Melbourne, Australia). |
| Clemente et al. [89] | ND | 44 TS | 3 TS/wk (~90 min) | ND | ND | ND | Distance and speed: TD covered (m); relative distance covered or pace (m/min); D in different speed zones; maximum speed (km × h−1); and number of sprints per minute (n × min−1). Accelerometry: PL (g). | ND | 10 Hz GPS and 100-Hz MEMS (JOHAN Sports, Noordwijk, The Netherlands). |
| Clemente et al. [95] | 5 weeks | ND | 5 TS/wk | ND | ND | ND | Distance and speed: TD covered (m); relative distance covered or pace (m/min); D in different speed zones; maximum speed (km × h−1); and number of sprints per minute (n × min−1). Acceleration: ACC (m × s−2) and DEC (m × s−2). Accelerometry: PL (g). Ratios/scores: TMr. | ND | 10 Hz GPS and 100-Hz MEMS (JOHAN Sports, Noordwijk, The Netherlands). |
| Clemente et al. [88] | 7 weeks | ND | 5–6 TS/wk | ND | ND | ND | Distance and speed: TD covered (m); relative distance covered or pace (m/min), D in different speed zones; maximum speed (km × h−1); and number of sprints per minute (n × min−1). Accelerometry: PL (g). | ND | 10 Hz GPS and 100-Hz MEMS (JOHAN Sports, Noordwijk, The Netherlands). |
| Clemente et al. [105] | 45 weeks | 197 TS | ND | ND | 44 MP | ND | Distance and speed: TD covered (m); relative distance covered or pace (m × min−1), D in different speed zones; maximum speed (km × h−1); and number of sprints per minute (n × min−1). | ND | 18-Hz MEMS and 100-Hz tri-axial accelerometer (STATSports, Apex, Newry, Northern Ireland). |
| Coutinho et al. [47] | 22 weeks | ND | 3–4 TS/wk | ND | ND | HR: %HRmax | Distance and Speed: TD covered (m); relative distance or pace (m × min−1); D in different speed zone (km × h−1); and sprints (number and time interval). Accelerometry: Absolute and relative body impacts (g). | 5 Hz short-range telemetry system (Polar Team System, Polar, Kempele, Finland). | 15 Hz GPS and 100-Hz MEMS (SPI-Pro X II, GPSports, Canberra, Australia) |
| Dalen et Lorås [102] | 10 weeks | 38 TS | 4 TS/wk | ND | 10 MP | HR: Banister TL | Distance and speed: TD covered (m); relative distance covered or pace (m × min−1); D in different speed zones; and maximum speed (km × h−1). Acceleration: ACC (m × s−2) and DEC (m × s−2). | 5 Hz short-range telemetry system (Polar Team System, Polar, Kempele, Finland) | 10 Hz and 100-Hz MEMS (Polar Team System, Polar, Kempele, Finland). |
| Gaudino et al. [90] | 10 weeks | 628 TS | 24 TS/player | ND | ND | ND | Distance and speed: D in different speed zone (km × h−1). Energy and metabolic power: Pmet (W × kg−1) and metabolic load distance (W × kg−1). | ND | 15 Hz GPS and 100-Hz MEMS (SPI-Pro X II, GPSports, Canberra, Australia). |
| Gaudino et al. [118] | 38 weeks | 1892 TS | 3–4 TS/wk (~60 min) | ND | ND | Perceived Exertion: RPE and sRPE. | Distance and speed: D in different speed zone (km × h−1). Energy and metabolic power: Pmet (W × kg−1) and metabolic load distance (W × kg−1). Accelerometry: dynamic-stress load (AU). | CR10 | 10 Hz GPS and 100-Hz MEMS (Viper Pod, STATSports, Newry, Northern Ireland) |
| Impellizzeri et al. [54] | 9 weeks | 479 TS | 3–4 TS/wk (~60 min) | ND | ND | HR: Edwards TL, Banister TL, and Lucia TL. Perceived Exertion: RPE and sRPE. | ND | CR10 and 5 Hz short-range telemetry system (VantageNV, Polar Electro, Kempele, Finland). | ND |
| Jeong et al. [55] | 10 weeks | 628 TS | 24 TS/players (~60 min) | ND | 6 MP | HR: %HRmax. Perceived Exertion: RPE and sRPE | ND | CR10 and 5 Hz short-range telemetry system (Polar Team System, Polar, Kempele, Finland). | ND |
| Kelly et al. [70] | 36 weeks | ND | ND TS/wk (~60 min) | ND | 49 MP | Perceived Exertion: RPE and sRPE | Distance and speed: TD covered (m); and D in different speed zones (km × h−1). | CR 10 | 10 Hz GPS (SPI-Pro X II, GPSports, Canberra, Australia) and semi-automatic multiple-camera system (Prozone Sports Ltd.®, Leeds, United Kingdom). |
| Kelly et al. [65] | 43 weeks | 1010 TS | 55 TS/player | ND | ND | HR: %HRmax. Perceived Exertion: RPE and sRPE | ND | CR 10 | ND |
| Los Arcos et al. [71] | 35 weeks | ND | 4–5 TS/wk (~90–104 min) | ND | ND | Perceived Exertion: sRPEres-TL and sRPEmus-TL | ND | CR 10 | ND |
| Malone et al. [56] | 7 weeks | 27 TS | 3–4 TS/wk | ND | ND | HR: %HRmax Perceived Exertion: RPE and sRPE | ND | CR10 and Portable team-based HR receiver (Acentas GmBH®, Freising, Germany; Firstbeat Sports, Jyväskylä, Finland) | 15 Hz GPS and 100-Hz MEMS (SPI-Pro X II, GPSports, Canberra, Australia) |
| Martin-Garcia et al. [82] | 12 weeks | 17 TS | 5 TS/wk (~83–92 min) | ND | ND | ND | Distance and speed: TS duration (min); TD covered (m); and D in different speed zones (km × h−1). Acceleration: ACC (m × s−2) and DEC (m × s−2). Metabolic power: AMP power per second and kg (W × kg−1); and metabolic load distance (W × kg−1). | ND | 10 Hz GPS (Viper Pod, STATSports, Canberra, Australia) |
| Marynowicz et al. [98] | 18 weeks | 12–76 TS/player | ND | 804 | ND | Perceived Exertion: RPE and sRPE | Distance and speed: TD covered (m); relative distance covered or pace (m × min−1); D in different speed zones. Acceleration: ACC (m × s−2) and DEC (m × s−2). Accelerometry: PL (g). | CR 10 | 10 Hz GPS and 400 Hz tri-axial accelerometer (Player TekTM, Catapult, Melbourne, Australia). |
| Oliveira et al. [72] | 45 weeks | 111 TS | 4 TS/wk | ND | 1 MP/wk (90 min) | Perceived Exertion: RPE, sRPE, and HI. | Distance and speed: TS duration (min); TD covered (m); D in different speed zones (km × h−1); AvS (m × min−1). Acceleration: ACC (m × s−2) and DEC (m × s−2) Accelerometry: PL (g) and number of impacts. | CR10 | 10 Hz GPS (Viper pod 2, STATSports, Newry, Northern Ireland) |
| Owen et al. [108] | 39 weeks | 2981 TS | 16–20 TS/M | ND | 50 MP/season | ND | Distance and speed: TD covered (m) and D in different speed zones (km × h−1). Acceleration: ACC (m × s−2) and DEC (m × s−2). Ratios/Scores: session volume and intensity. | ND | 10-Hz GPS (Viper, Statsport, Newry, Northern Ireland) |
| Owen et al. [99] | 42 weeks | 490 TS | 5 TS/wk (~61–74 min) | ND | 37 MP | Perceived Exertion: RPE, CR10, and sRPE | Distance and speed: TD covered (m); relative distance covered or pace (m × min−1), D in different speed zones (km × h−1); maximum speed (km × h−1); and number of sprints per minute (n × min−1). | CR10 | 10 Hz GPS (Catapult Innovations, Melbourne, Australia). |
| Rago et al. [107] | 6 weeks | 24 TS | 4 TS/wk | ND | ND | Perceived Exertion: RPE and sRPE | Distance and speed: TD covered (m); D in different speed zones (km × h−1); and THIA (%). Acceleration: ACC (m × s−2) and DEC (m × s−2). | CR 10 | 10-Hz GPS (BT-Q1000 Ex, QStarz, Taipei, Taiwan) |
| Rago et al. [61] | ~13 weeks | 67 TS | ND | 828 | 15 MP | HR: %HRmax. | Distance and speed: TD covered (m) and D in different speed zones (km × h−1) Acceleration: ACC (m × s−2) and DEC (m × s−2). | 5 Hz short-range telemetry system (WIMU PRO; RealTrack Systems SL, Almería, España). | 10-Hz GPS with Triaxial accelerometer (WIMU PRO; RealTrack Systems SL, Almería, España) |
| Sanchez-Sanchez et al. [91] | 8 weeks | 42 TS | 5 TS/wk (~75–120 min) | ND | ND | ND | Distance and speed: TS duration (min); TD covered (m); and D in different speed zones (km × h−1). Acceleration: ACC (m × s−2) and DEC (m × s−2). | ND | 10 Hz GPS (K-GPS, Montelabbate, Italy) |
| Scott et al. [57] | 20 weeks | 97 TS | 4 TS/wk | ND | 1 MP/wk (90 min) | HR: Edwards and Banister TL Perceived Exertion: RPE, CR10, and sRPE. | Distance and speed: TD covered (m) and D in different speed zones (km × h−1). Accelerometry: PL (g). | CR10 and 5 Hz short-range telemetry system (Polar Team System, Polar, Kempele, Finland). | 5 Hz GPS (Catapult Firmware 6.59, Innovations, Scoresby, Australia) and tri-axial accelerometer (Kionix: KXP94) |
| Swallow et al. [110] | ND | 1029 TS | ND | ND | 3–55 MP | ND | Distance and speed: TS duration (min); TD covered (m); and D in different speed zones (km × h−1). Acceleration: ACC (m × s−2) and DEC (m × s−2). Accelerometry: PL (g). | ND | 5 Hz GPS and 100 Hz tri-axial accelerometer (Player TekTM, Catapult Cloud, Catapult Sports Group, Australia). |
| Stevens et al. [83] | 33 weeks | ND | 3 TS/wk | 536 | 1/2 MP/wk | HR: %HRmax. | Distance and speed: TD covered (m) and D in different speed zones (km × h−1). Acceleration: ACC (m × s−2). Accelerometry: PL (g) | LPM-integrated Polar Wearlink® technology (Polar Electro Oy, Kempele, Finland). | LPM system (version 05.91 T; Inmotiotec GmbH, Regau, Austria). |
| Vahia et al. [58] | ~30 weeks | 1029 TS | 4 TS/wk | ND | 3 MP | HR: Edwards and Banister TL. Perceived Exertion: RPE, sRPE. | ND | CR10 and 1 Hz short-range telemetry system (Team 2, Polar Electro, Kempele, Finland). | ND |
| Wrigley et al. [60] | ~30 weeks | 160 TS | 7 TS/wk | 612 | 1 MP/wk | HR: %HRmax. Perceived Exertion: RPE and sRPE. | ND | CR10 and 1 Hz short-range telemetry system (Team 2, Polar Electro Oy, Kempele, Finland). | ND |
| Reference (Year) | Study Purpose | Periodization Structure | Independent Variable | Main Findings | Practical Applications |
|---|---|---|---|---|---|
| Abade et al. [47] | Described time–motion and physiological profile of regular training sessions. | ND | Age of players | Distance and speed: TD were higher in U17 (F = 45.84, p < 0.001). High- and very-high intensity activity were less in U19 (F = 11.8, p > 0.001). The number of sprints performed were different between U17 and U19 (F = −7.2, p < 0.001) Accelerometry: Total and relative body impacts were lower in U15 (F = 7.3, p < 0.01). HR: HR values showed significant effects of zone (F = 575.7, p < 0.001) and interaction with age group (F = −7.2, p < 0.001). | High variability between elite team TSs. Constrained SSG to develop basic tactical principles and technical skill may promote low physio local demands. |
| Akenhead et al. [53] | Described the distribution of external load during in-season 1-game weeks in in-season. Examined inter-day and interposition variation within microcycle (focus on acceleration). | Weekly microcycle (1-game week) with “match day minus” format: MD-5, MD-4, MD-3, MD-2, MD-2, MD-1, MD. | Training day and playing position | Distance and speed: Highest total weekly load (%) occurred on MD-4, with the lowest values on MD-1. CM covered ∼8–16% greater TD than other playing positions (excluding WM) and covered ∼17% greater distance accelerating than CD (p = 0.03, d = 0.7). There are associations between AvS (m × s−2) and the rate of accumulation for HSR, SPD, >1TOTAL, and >3TOTAL. Acceleration: ACC/DEC did not differ across days with the greatest variation tending to be in MD-1. No interaction between day and playing positional were found. | Monitoring only speed-based locomotor variables may not provide sufficient information about training demands. Quantification acceleration variables may add additional information. |
| Brito et al. [69] | Analyzed the influence of match-related contextual variables on TL and fatigue. Concomitantly, investigated if there were variations throughout the season. | Four different season phases: preparation I (3 weeks), competition I (18 weeks), preparation II (8 weeks, winter break) and competition II (12 weeks). | Contextual variables (e.g., result of previous MP, MP location, and quality of opposition). | Distance and speed: Weekly TLs were higher after playing a defeat or draw (p ≤ 0.05; d = 0.30–0.45) and after an away MP (p ≤ 0.05; d = 0.23). Weekly TL decreased as the season progressed (p < 0.001). Perceived Exertion: Internal load variation ranged 5 to 72% throughout the season (29–49% to weekly TL; 18–44% to fatigue scores). | Internal load variability within a season may need a more individualized approach to prepare initial and subsequent match conditions. Adding that variability together relatively stable fatigue scores may modulate pace during training. |
| Clemente et al. [89] | Analyzed intra-week variations during a typical weekly external load and compared variance in four professional teams. | Weekly microcycle (1-game week) with “match day minus” format: MD+1, MD + 2, MD-5, MD-4, MD-3, MD-2, MD-2, MD-1, MD. | Training day | Distance and speed: MD-1 had significantly less training while other days were more intense (p = 0.001). Portuguese team showing significantly higher intensity (SPR distance) and volume (total distance) in all days with exception of MD-1 than the Dutch team (p < 0.05). Accelerometry: Dutch team had significantly greater value of PL in MD-3 (p = 0.005; d = 1.18) and Portuguese team had higher PL in the MD+2 (p = 0.005; d = 1.78). | The training TL and tapering strategies were different between teams in different countries. However, both teams applied a significant tapering phase in the last two days before the competition in an attempt to reduce residual fatigue accumulation. |
| Clemente et al. [88] | Quantified weekly external load and intra-week variations during a pre-season training and compared variance in two professional teams. | Weekly microcycle (1-game week) with “match day minus” format: MD-5, MD-4, MD-3, MD-2, MD-2, MD-1, MD. | Training day | Distance and speed: Weekly TL presented significant differences between TS considering the duration (p = 0.011), walking distance (p = 0.017), running distance (p = 0.004), and number of sprints (p = 0.006). Variations between weeks were small and intra-week variations in the measures associated with great volume and lower intensity. Accelerometry: Weekly TL also presented significant differences between TS considering PL (p = 0.040). | Intra-week TL is not linear or standardized during in-season competition and monitoring weekly variance for the same type of day provided a useful strategy to control training adaptations. |
| Coutinho et al. [47] | Described the time–motion and physiological performance profiles during a typical weekly microcycle. | Weekly microcycle (1-game week) divided into: post-match (session after the match), pre-match (session before the match), and middle week (average of remaining sessions). | Age of players and weekly microcycle division (pre-match, mid-week, and post-match). | Distance and Speed: U15 Mid-week showed a higher number of sprints, distance covered in intermediate speed zones, and time spent above 90% HRmax. Pre-match presented a higher distance covered above 18 km × h−1 and time spent below 75% HRmax. U17 Pre-match and post-match presented lower distance covered values than mid-week. U19 Post-match showed higher distance covered above 13 km × h−1, body impacts (>10 g), and time spent above 85% HRmax. Accelerometry: U15 body impacts showed significant differences across all TSs. U17 pre-match and post-match presented moderate differences in body impacts. U19 middle-week showed higher values in body impacts and pre-match presented less values than the middle-week (35% to 100%). | Appropriate physical and physiological load during middle-week TSs should be ensured. Understanding the weekly training and match load variations can contribute to optimizing short- and mid-term planning during different developmental stages. |
| Jeong et al. [55] | Quantified and compared TL during a preseason and in-season training process. | Season phases divided into preseason and in-season. Training mode subdivided into physical training, technical/tactical training, and physical and technical/tactical training. | Training mode/type or sub-components and season phase. | HR and Perceived Exertion: Preseason load was higher than in-season load (p < 0.05). Time spent in 80–100% maximum heart rate zones greater proportion in preseason and in-season, while technical/tactical sessions had higher intensities in the pre-season (p < 0.05). | Preseason is more intense than in-season training. Emphasis on higher intensities and time spent in technical/tactical specific TSs may provide the necessary physiological conditioning. |
| Malone et al. [56] | Quantified the seasonal TL, including both the preseason and in-season phase. | Season phases divided into preseason and in-season. Mesocycle ranged from 1 to 6 weeks (week blocks) and weekly microcycle (1-game week) with “match day minus” format: MD-5, MD-4, MD-3, MD-2, MD-2, MD-1, MD. | Season phase, mesocycle, training day and playing position. | HR and Perceived Exertion: typical daily TL did not differ during each week of the preseason. Daily TD covered was greater in the 1st mesocycle than in the 6th. %HRmax values were also greater in the 3rd mesocycle than in the 1st. TL was lower on MD-1 (regardless mesocycle) and no differences were found in other days (MD-2 to MD-5). Positional differences were found during both preseason and in-season phases. In total, CM and WD covered the highest TD. Defenders (CD and WD) displayed higher %HRmax values. | Quantify TL using different measures can provide physiological patterns across a full competitive season. First and last TSs optimized recovery and prevent fatigue accumulation. Positional differences should also be considered in the loading analysis. |
| Oliveira et al. [72] | Quantified TL using s-RPE and HI across mesocycles during an in-season comparing player positions. | Mesocycle (one month) and weekly microcycle (1-game week) with “Match day minus” format: MD-5, MD-4, MD-3, MD-2, MD-2, MD-1, MD. | Mesocycle, training day, and playing position. | Distance and speed: Daily TD covered was higher at the start (M1 and M3) compared to the final mesocycle (M10) of season. HSR distance was greater in M1 than M5. CM covered more distance and WM cover more distance at HSR. Acceleration and accelerometry: All TL variables expressed significant lower values to other days prior to a MP and no difference between player positions (p < 0.01). Perceived Exertion: Perceptual response was higher in M1 in comparison to the last mesocycle. sRPE presented a non-perfect pattern by decreasing values until MD-1: MD-5 < MD-4 < MD-3 > MD-2 > MD-1. HI showed minor variations across mesocycles and in days before MP. | Combination of different TL measures could provide evidence to fully evaluate the patterns observe across the in-season. MD-1 presented a reduction of external load (regardless of mesocycle) and HI did not change, except for MD+1. |
| Owen et al. [108] | Analyzed a training mesocycle whilst quantifying TL across playing position and examined the effect of match location, match status, and age of players. | Mesocycle (6 × 1-week block) and weekly microcycle (1-game week) with “match day minus” format: MD-4, MD-3, MD-2, MD-2, MD-1, MD. | Mesocycle, training day, contextual variables (match location and match status), age of players, and playing position. | Distance and speed: Typical daily TL did not differ throughout each week of the mesocycle in-season period. TL were significantly lower on MD-1 (p < 0.05). Lower AvSs were reported in training post-successful MP compared to defeats (p < 0.05), and more specifically when a MP was played away compared to home fixtures (p < 0.05). Acceleration and accelerometry: Significant differences in physical outputs were also found between MD-2, MD-3 and MD-4 (p < 0.05). | Analysis of training mesocycle and microcycle positional demands may provide useful information to training program design and tactical strategy. Physical outputs on MD-2, MD-3, and MD-4 highlighting a structured periodized tapered approach. |
| Rago et al. [61] | Quantified the weekly TL according to different match-related contextual factors. | Training structure included speed endurance training (e.g., repeated sprint activity) and aerobic high-intensity training (e.g., interval training). The remaining TS mainly concerned ball-possession games and team/opponent tactics. Individual/reconditioning sessions were excluded from the analysis. The periodization structure has not been described. | Contextual variables (opponent standard, match location, and match outcome). | Distance and speed: TD covered and HSR during training were higher in the week after playing against a bottom-level or top-level opponent compared to a medium-level opponent (p < 0.05). TD covered and HSR was higher in the week following a draw or a win, and higher before a loss compared to a draw (p < 0.05). Acceleration: The decrease in training volume (e.g., TD) and mechanical work (accelerations and decelerations) performed throughout the season may have been related to changes in training activities prescribed by the technical staff as a consequence of cumulative seasonal TL (p < 0.05). | Weekly TL seems to be slightly affected by match-related contextual variables, with special emphasis on the opponent standard and match outcome. Higher training volume was observed before and after playing against a top-level opponent, and after losing a match, whereas the volume of high-intensity training seems to be higher when preparing for a game against a top-level opponent. |
| Reference (Year) | Study Purpose | Periodization Structure | Independent Variable | Main Findings | Practical Applications |
|---|---|---|---|---|---|
| Anderson et al. [87] | Quantified training load during a one-, two-, and three-game week schedule. | Three different weeks: one-, two- and three-game week schedule. 1-game week: 2 days of and 4 training days before MP; 2-game week: 1 day off after 1st MP and 4 training days before second MP; 3-game week: 1 day off and training day before 1st match and the same schedule within 2nd and 3rd MP. | Weekly microcycle type | Distance and speed: 1-game week TL was progressively decreased in 3 days prior to MD (p < 0.05). Daily TL and periodization were similar in the one- and two-game weeks. 2-game week total accumulative distance (inclusive of both MP and TL) was higher than 1-game week. 3-game week daily training TD was lower compared to 1-and 2-game weeks, though accumulative weekly distance was highest in this week and more time was spent in speed zones > 14.4 km × h−1 (p < 0.05). | Quantify daily training and accumulative weekly load (match load includeed) can be a support CHO periodization. Muscle glycogen is the predominant energy source and high levels of muscle glycogen may attenuate training adaptations. |
| Anderson et al. [106] | Quantified training load and match load during a season within starting status (starters, non-starters, and fringe). | Mesocycle (5 different in-season periods): 4 × 8-weeks (periods 1–4) and 1 × 7-weeks (period 5). | Player’s starting status (starters, non-starters, or fringe) | Distance and speed: Starters completed more moderate intensity running, HSR, and SPR than non-states (p < 0.01). Starters also completed more SPR than fringe players (p < 0.01). | Seasonal volume and intensity training are dependent on player’s match starting status and must be considered for training program design. |
| Baptista et al. [97] | Quantified the most demanding passages of play in training sessions and matches (5-min peaks); and evaluated the accumulated load of typical microcycles and official matches, according to playing position. | Weekly microcycle (1-game week) with “match day minus” format: MD+1C, MD+1R, MD-4, MD-3, MD-2, MD-2, MD-1, MD | Playing position and weekly microcycle. | Distance and speed: Training values for SPR and HSR distance were lower (36–61% and 57–71%) than for acceleration variables. The highest difference was verified on the 5-min peaks for SPRpeak, with FB achieving during the microcycle only 64%, while CB, CM, and FW levelled and overperformed the match values (107%, 100%, and 107%, respectively). Acceleration: Correlations match demands were overperformed for ACC counts (131–166%) and DEC counts (108–134%), according all position. Training values were higher than SPR and HSR distance. | Differences observed across playing positions in matches and microcycles underline the lack of position specificity of common training drills/sessions. Coaches and practitioners must keep in mind that the absolute TL accumulated by players of different positions, so analyzing the relative TL (according to the match demands) may be a much better and more valuable way of managing and evaluating the players periodization. |
| Dalen et Lorås [102] | Analyzed physical (locomotor activities) and physiological (Banister’s training impulse) in-season training load between starters and substitutes. | ND | Player’s starting status (starters and non-starters) | Distance and speed: Starting players demonstrated significantly higher average weekly physical load compared to the non-starters for all variables: TD, running, HSR, and SPR (p < 0.001), number of ACC and SPR (p < 0.001). Similarly, Banister’s TL (p < 0.001) was significantly higher within week than starters than non-starters. | The weekly accumulated high-speed running and sprint distances were largely related to match playing time. Therefore, weekly fitness-related adaptations in running at high speeds seem to favor the starters in a soccer team. |
| Clemente et al. [95] | Described the training/match ratios and variations between different weekly microcycle type. Investigated relationship within weekly accumulated TL and match load. | Three different weekly microcycle: week with 5 TSs (5 dW), 4 TSs (4 dW) or 3 TSs (3 dW). | Weekly microcycle type | Distance and speed: TDr, HSRr, and SPRr were significantly greater in 5 dW (p < 0.001). Acceleration and accelerometry: Correlations between the weekly TL and the match load of the same week were small for PL (r = 0.25 (0.13; 0.36)), ACC (r = 0.29 (0.17; 0.40)) and DEC (r = 0.23 (0.11; 0.35)). | Additional TSs, it may be necessary to promote differences between weekly accumulated TL and the load imposed in a single MP. Relationship between weekly accumulated TL and weekly MP are dynamic and unpredictable which may be impossible for accumulated weekly TL and their variations to be adjusted according to match loads. |
| Clemente et al. [105] | Analyzed the variations of acute load, training monotony, and training strain among pre-season, mid-season and end-season according playing position. | Mesocycle (5 different in-season periods): (i) pre-season (week 1 to week 6); mid-season or first half of the season (week 6 to week 33); and end-season or second half of the season (week 34 to week 45). | Season phase | Distance and speed: Training monotony and training strain for HSR were meaningfully greater in pre-season than in the mid-season and greater than the end-season (p < 0.001). The training monotony for the sprints was meaningfully greater in pre-season than in the mid-season and greater than the end-season (p < 0.001). Comparisons between playing positions revealed small-to-moderate effect size differences mainly for the number of sprints in acute load, training monotony, and training strain. | Acute load, training monotony, and training strain occurred in the pre-season and progressively decreased across the season. Moreover, external defenders and wingers were subjected to meaningfully greater acute load and training strain for HSR and number sprints during the season compared to the remaining positions. |
| Kelly et al. [70] | Analyzed TL and match load across a full season. | Mesocycle ranged from 6 to 9 weeks. | Mesocycle and playing position | Distance and speed: Daily TDs were higher during the early stages (M1 and M2) of the competition period. Overall, high-speed activity was similar between mesocycles. Weekly TL was greater on MD and lower MD-1 (p < 0.001). TD progressively decreased over the MD-3 (p < 0.001). High-speed distance was greater MD-3 while very high-speed distance was greater on MD-3 and MD-2 than MD-1 (p < 0.001). Perceived Exertion: Daily sRPE was also higher across early season stages. sRPE progressively decreased over the MD-3 (p < 0.001) as well as TD (p < 0.001). | Limited TL variation across mesocycles suggests that training schedules employed a highly repetitive likely reflecting the nature of the competition demands. TL periodization included a three-day period leading into competition. |
| Los Arcos et al. [71] | Quantified and compared the respiratory and muscular perceived TL accumulation depending on the player participation. | Mesocycle ranged from 6 to 8 weeks (week blocks) and weekly microcycle (1-game week) with “match day minus” format: MD-5, MD-4, MD-3, MD-2, MD-2, MD-1, MD. | Player’s starting status (starters or non-starters), mesocycle and training day. | Perceived Exertion: Weekly TL variation across the in-season blocks was trivial-small (except between block 2-block3). Substantial TL differences were found between training days. Weekly TL was a progressive increase up to MD-3 followed by a decrease until MD-1. sRPEres/sRPEmus-TL reported during MD was very similar between starters and non-starters. | Perceived TL across the season displayed limited variation. Highest weekly TL was applied to 72 h before the MD to progressively between MD-3 and MD. |
| Martin-Garcia et al. [82] | Determined the external load across playing position and relative for a structured microcycle. Examined TL and variation the day after competition for players with or without MP time. | Weekly microcycle (1-game week) with “match day minus” format: MD+1C, MD+1R, MD-4, MD-3, MD-2, MD-2, MD-1, MD. | Playing position and training day. | Distance and speed: TL declined as competition approached (MD-4 > MD-3 > MD-2 > MD-1; p < 0.05). MD+1C by players with game time was higher than MD+1R (p < 0.05). FB performed more high-speed running and SPR than other positions at MD-3 and MD-4 (p < 0.05; (0.8–1.7)). Weekly TL variation was ~40% for MD-3 and MD-4 to ~80% for MD+1R. Acceleration: ACC/DEC represented 50% of that performed in competition for MD+1C (80–86%), MD-4 (71–72%), MD-3 (62–69%), and MD-2 (56–61%). Metabolic power: MD+1C demonstrated greater HLMD and AMP than MD+1R (p < 0.05; (1.4–1.6)). TL declined as competition approached (MD-4 to MD-1) as well as HMLD and AMP (p < 0.05; ES: 1.5–3.0). | Quantifying TL should consider the relative competition demands and position-specific loads. MD+1 can be used to compensate for the reduced competition load in player with limited playing time. MD-4 and MD-3 could be employed to elevated training stimulus. |
| Owen et al. [99] | Investigated multi-metric monitoring method highlighting TL and its relationship to MP. | Weekly microcycle (1-game week) with “match day minus” format: MD-5, MD-4, MD-3, MD-2, MD-2, MD-1, MD. | Training day | Distance and speed: Significant differences between daily TL and competitive TL. Additionally, significant differences between training days for both volume- and intensity session scores (p < 0.05). No differences were found between MD-1 and MD-2 session scores. | Specific multi-modal approach may combine key mechanical volume and intensity metrics to player monitoring strategies and tapering approaches. The TL and match load relationships could provide a better understanding to the need for prepare players individually in line with MP demands. |
| Sanchez-Sanchez et al. [91] | Quantified the external load during in-season training microcycles and examined its relationship to the competition demands. | Weekly microcycle (1-game week) with “match day minus” format: MD-5, MD-4, MD-3, MD-2, MD-2, MD-1, MD. | Training day | Distance and speed: External load variables were similar between the four microcycles. MD-2 presented highest TL on time, TD, HSR and SPR compared MD+1, MD-3 and MD-1 (p < 0.01). Acceleration: Aside from training duration, all external loads variables were lower during training sessions compared to official matches (p < 0.05). | Absolute and relative external load values allow to more accurately know the load applied. MP constitutes the highest load during a typical competitive microcycle and MD-2 contain the weekly peak load. |
| Swallow et al. [110] | Quantified the external TL across both training and competitive matches during the season. Examined the influence of one and two match weekly microcycles on the external TL. | Weekly microcycle (1-game week) with “match day minus” format: MD-5, MD-4, MD-3, MD-2, MD-2, MD-1, MD. | Distance and speed: TD and HSR were higher on MD and MD-5. MD-4 displayed significantly higher values compared to MD-1 and MD-2. The 2-game week presented a TD higher on MD-1 when compared to 1-game week. However, lower values were observed for duration and HSR on MD-2 and MD-4 during the 2-game week compared to the 1-game week. Acceleration: Higher values recorded on MD for number of ACC. ACC data were influenced for the different game week schedule. Accelerometry: PL was also higher on MD and MD-5. The 2-game week presented a higher PL on MD-1 than 1-game week. | Progressive reduction in TD, PL, HSR, and ACC leading into competitive matches based on MD- analysis. However, some variability exists in TL prescription as a result of different 1-game week schedules (i.e., 1-game week vs. 2-game week). | |
| Stevens et al. [80] | Quantified and compared the TL of training days and MP. Compared training of nonstarters the day after the match with regular training of starters and non-starters. | Weekly microcycle (1-game week) with “match day minus” format: MD-5, MD-4, MD-3, MD-2, MD-2, MD-1, MD. | Player’s starting status (starters or non-starters) | Distance and speed: TL was lower when training approached MD. Training values for running and HSR were lower than for TD, and all considerably lower than MD values. Non-starters training was lower loading than regular training for almost all variables on MD-4 and several high-intensity variables on MD-3 and MD. Acceleration and metabolic power: Medium and high accelerations and decelerations during training were more similar to match values. MD-4 was the greatest TL, including acceleration and metabolic variables. | Acceleration load on the most intense training day in MD-4. Non-starters training showed in a more general load than regular training, especially on MD-4, contributing to a considerably lower total weekly TL for non-starters. There is a challenge to improve sufficiently load in non-starters, especially in terms of running and HSR. |
| Wrigley et al. [60] | Quantified typical weekly TL during the in-season competitive period. | Weekly microcycle (1-game week): Monday, Tuesday, Wednesday, Thursday, and Saturday or Sunday (MD). | Age of players, training day and training mode/type or sub-components | HR and Perceived Exertion: Total weekly TL (training and match) increased with (p < 0.05). Differences in the daily TL across the training week were also evident in the older age group (U18). The amount of time engaged in low (<50% HRmax) and high (>90% HRmax) intensity activity during training and match-play was significantly lower and higher respectively in the U18 compared to the U14 group (p < 0.05). When comparing activity, the intensity (% HRmax) of field training was significantly lower compared to MP across all age groups (p < 0.05). | Age-related increases reflect increases in the intensity and a greater extent of the training volume. Weekly periodization in an older player may adopt an exponential tapering focused on competition. |
| Reference (Year) | Study Purpose | Periodization Structure | Independent Variable | Main Findings | Practical Applications |
|---|---|---|---|---|---|
| Alexiou and Coutts [52] | Compared the sRPE method for quantifying internal load with various HR-based TL quantification (Bannister’s TRIMP, LTzone TL and Edward’s TL) in different training modes. | Weekly microcycle (1-game week): 3 TSs technical/tactical, 2 TSs high-intensity resistance, 1 TS aerobic conditioning, 1 TS core stability, 1TS pool “recovery” and 1 MP. | Training mode/type or sub-components | RPE vs. HR: Correlation for RPE and method for quantifying internal load were: Bannister’s TRIMP (r = 0.84); LT zone (r = 0.83); Edwards TL (r = 0.85). There are differences between training mode (p < 0.001); strongest correlations were reported for technical (r = 0.68 to 0.82), conditioning (r = 0.60 to 0.70) and speed (r = 0.61 to 0.79) sessions. | sRPE method was a valuable tool to internal load quantification that can measure both psychological and physiological factors. Therefore, sRPE seems to be a more global indication of the internal stress. |
| Campos-Vazquez et al. [50] | Described internal load performed during a typical week and determined the relationship between different internal load measures. | ND | Training mode/type or sub-components | RPE vs. HR: Higher internal load during skills drills/circuit training and small sided games than in tactical training and pre-match activation. Large relationships were found between HRmax > 80% HRmax and R > 90% HRmax vs. sRPE (r = 0.61 to 0.68). Very large relationships were found between Edwards TL and sRPE and between TRIMPMOD and sRPE (r = 0.73 to 0.87). | Internal load variables relationships differ according training mode/type. For this reason, caution should be applied when using RPE- or HR-derived measures to quantify training or exercise intensity. |
| Casamichana et al. [115] | Examined the relationship between internal and external load indicators used to quantify TL. | ND | TL indicators (external and internal load) | PL vs. HR and RPE: Very-large association for PL with Edward’s TL (r = 0.72, p < 0.01) and sRPE (r = 0.76, p < 0.01). TD vs. PL and RPE: Large to very-large association between TD and PL (r = 0.70, p < 0.01), sRPE (r = 0.74, p < 0.01) and (r = 0.72, p < 0.01). | sRPE was a global indicator to measure internal training response. Very large association between PL and internal load measures expresses the interest of accelerations monitoring. TL analysts should take advantage using GPS technology and sRPE or Edwards methods for post-hoc TL monitoring. |
| Gaudino et al. [90] | Compared measurements of high-intensity activity during field-based TS in different playing positions. TD covered at >14.4 km × h−1) and TP (>20 W × kg−1). | ND | Playing position | TD vs. TP: Difference within TD covered at >14.4 km × h−1 and TP was greater for central defenders (~85%) than WD and attackers (~60%, p < 0.05). Differential between methods also decreased as the proportion of high-intensity distance within a training session increased (R2 = 0.43, p < 0.001). | Metabolic power may provide better examination for high-intensity component of training which typically represents the most physically demanding elements. Including metabolic power analysis can minimize underestimation on external load quantification using traditional monitoring approach. |
| Gaudino et al. [118] | Identified the external load measures that are most influential on perceptual response during training sessions. | ND | TL indicators (RPE) | RPE vs. HSR: Perceptual responses provided within-individual correlations with HSR (p < 0.001). RPE vs. body impacts: RPE within correlated with the number of impacts (p < 0.001). RPE vs. ACC: Within-individual correlations with ACC (p < 0.001). | HSR, the number of impacts and accelerations are the best external load measures to predict perceptual response during training process. Understanding the influence of characteristics affecting RPE may help in enhance training design and athlete monitoring. |
| Impellizzeri et al. [54] | Quantified internal load using sRPE and assessed correlations within HR-based methods (Edwards, Banister, and Lucia TL). | Weekly microcycle (1-game week): Monday, Tuesday, Wednesday, Thursday, and Saturday (MP). Sunday and Friday are days ff. Typical training program was: heaviest aerobic training (Monday), speed developing through sprint and plyometric (Tuesday), running interval training (2 times week), and MP (Saturday). | Training day | RPE vs. HR: Mean sRPE reported to field-based training was: Monday (32%), Tuesday (27.8%), Wednesday (22.8%), and Thursday (17.3%). Match load corresponded to 24% of the total weekly TL. Peak internal load was reached the first day of the training week (after a day of total recovery). Individual TS showed some variability on peak internal TL sessions within the week. All individual correlations between various HR-based TL and sRPE were statistically significant (r = 0.50 to 0.85, p < 0.01). | sRPE can be considered a good indicator to global internal load and has potential to TL quantification. The moderate correlation cannot support this method as a HR-based methods substitute, as only about 50% of variance in HR was explained by sRPE. |
| Kelly et al. [65] | Quantified the within-participant correlations between variability in sRPE and HR-derived measures. | ND | Playing positions | RPE vs. HR: The correlation between changes in sRPE and Edwards TL (r = 0.75). These correlations across playing position: WD (r = 0.81); CD (r = 0.74); WD (r = 0.70); CM (r = 0.70); ST (r = 0.84) (p < 0.001). | sRPE was a simple and practical global indicator of individual TL in elite-level soccer player regardless the playing position. |
| Marynowicz et al. [98] | Examined the relationship between the external TL markers and the RPE and session-RPE (sRPE), thereby identifying those that are most influential. | ND | TL indicators (external and internal load) | RPE vs. sRPE: Large, positive within-individual correlations (r = 0.62, p < 0.001). RPE vs. TD: Large, positive within-individual correlations (r = 0.70, p < 0.001). RPE vs. HSR: Moderate within-individual correlation (r = 0.39, p < 0.001). RPE vs. ACC: Large, positive within-individual correlations (r = 0.64, p < 0.001). RPE vs. PL: Large, positive within-individual correlations (r = 0.70, p < 0.001). | The findings demonstrate that RPE does not reflect the intensity of a training session and that sRPE can be a useful, simple, and cost-effective tool for monitoring TL. Determining which external load markers have the most influence on the perception of effort enables coaches to better monitor athletes and as a consequence both reduce the risk of injury and improve physical performance. |
| Rago et al. [107] | Examined the within-player correlation between perceptual responses (RPE) and external load (high-speed running using arbitrary and individualized speed zones). | Weekly microcycle (1-game week): “match day minus” format: MD-5, MD-4, MD-3, MD-2, MD-2, MD-1, MD. Day after MP was day-off. | Training day | RPE vs. HSR and SPR: Moderate correlation for perceptual responses within MSR and HSR quantified using the arbitrary method (r = 0.53 to 0.59; p < 0.05). The magnitude of correlations tended to increase when the individualized method was used (r = 0.58 to 0.67; p < 0.05). Correlation to SPR was moderate only when the individualized method was used (0.55 (0.05; 0.83) and 0.53 (0.02; 0.82), p < 0.05). RPE vs. HSR and SPR: Perceptual responses were largely correlated to TD within all three speed running zones, independently quantification method (r = 0.58 to 0.68; p < 0.05). No significant correlations were observed when external load was measured with percentage (p > 0.05). | Adjusted values of distances covered within the TSs for individual speed being more representative of perceptual responses to training, rather than percentage of TD. Instead, splitting values of distances covered can provide better information about individual perceptual responses to the training process. |
| Scott et al. [57] | Compared various measures of training load derived from physiological and physical data during in-season field-based training. | ND | TL indicators (external and internal load) | HR and RPE vs. TD, PL and HSR/SPR: Large correlation for TD, LSA volume, and PL with HR-based and sRPE-based methods (r = 0.71 to 0.84; p < 0.01) correlations. Moderate to large correlation for HSR volume and very HSR with measures of internal load (r = 0.40 to 0.67; p < 0.01). | TD, LSA, and PL can be useful external load indicators to field-based training. Physical activity measures such HSR and very HSR may provide additional information not reflected in perceptual and physiological methods. |
| Vahia et al. [57] | Analyzed the in-season variation in correlation between HR-based method and perceptual response (sRPE). | Weekly microcycle (1-game week): Monday, Tuesday, Wednesday, Thursday, and Saturday (MP). Sunday is a day off. Typical training program was: 2 technical sessions (Monday), strength training (Tuesday), resistance training (Wednesday), 1 speed and technical session (Thursday), match preparation (Friday), and MP (Saturday). | Months of the season (mesocycle) | RPE vs. HR: The monthly correlations ranged from r = 0.60 to 0.73 (p < 0.05) and the overall correlation was r = 0.64 (0.60–0.68; p < 0.001). The changes in HRTL and sRPE showed large correlations over months (r = 0.64 [0.60–0.68]; p < 0.001) | sRPE was a reliable measure to measure internal load during the entire season. This method presented small variations and little bias when compared to HR-derived methods. |
Publisher’s Note: MDPI stays neutral with regard to jurisdictional claims in published maps and institutional affiliations. |
© 2021 by the authors. Licensee MDPI, Basel, Switzerland. This article is an open access article distributed under the terms and conditions of the Creative Commons Attribution (CC BY) license (https://creativecommons.org/licenses/by/4.0/).
Share and Cite
Teixeira, J.E.; Forte, P.; Ferraz, R.; Leal, M.; Ribeiro, J.; Silva, A.J.; Barbosa, T.M.; Monteiro, A.M. Monitoring Accumulated Training and Match Load in Football: A Systematic Review. Int. J. Environ. Res. Public Health 2021, 18, 3906. https://doi.org/10.3390/ijerph18083906
Teixeira JE, Forte P, Ferraz R, Leal M, Ribeiro J, Silva AJ, Barbosa TM, Monteiro AM. Monitoring Accumulated Training and Match Load in Football: A Systematic Review. International Journal of Environmental Research and Public Health. 2021; 18(8):3906. https://doi.org/10.3390/ijerph18083906
Chicago/Turabian StyleTeixeira, José E., Pedro Forte, Ricardo Ferraz, Miguel Leal, Joana Ribeiro, António J. Silva, Tiago M. Barbosa, and António M. Monteiro. 2021. "Monitoring Accumulated Training and Match Load in Football: A Systematic Review" International Journal of Environmental Research and Public Health 18, no. 8: 3906. https://doi.org/10.3390/ijerph18083906