
Sociodemographic and Service Use Characteristics of Abortion Fund Cases from Six States in the U.S. Southeast

 , ,
, ,
Abstract
:1. Introduction
2. Materials and Methods
2.1. Study Population
2.2. Data Source
2.3. Analyses
3. Results
4. Discussion
Limitations
5. Conclusions
Author Contributions
Funding
Institutional Review Board Statement
Informed Consent Statement
Data Availability Statement
Acknowledgments
Conflicts of Interest
References
- Guttmacher Institute. Last Five Years Account for More Than One-quarter of All Abortion Restrictions Enacted Since Roe. Available online: https://www.guttmacher.org/article/2016/01/last-five-years-account-more-one-quarter-all-abortion-restrictions-enacted-roe (accessed on 5 October 2020).
- Redd, S.H.; Aswani, K.S.; Wingate, M.; Sen, B.; Rice, W.S. Variation in Restrictive Abortion Policies and Infant Health in the United States from 2005 to 2015. Ph.D. Thesis, Emory University, Atlanta, GA, USA, 2020. [Google Scholar]
- Lai, K.K.R. Abortion Bans: 9 States Have Passed Bills to Limit the Procedure This Year. New York Times 2019. Available online: https://www.nytimes.com/interactive/2019/us/abortion-laws-states.html (accessed on 5 October 2020).
- Ollstein, A.M. How the Supreme Court could now limit abortion rights. Politico 2020. Available online: https://www.politico.com/news/2020/09/19/how-the-supreme-court-could-now-limit-abortion-rights-418466 (accessed on 6 October 2020).
- Center for Reproductive Rights. What If Roe Fell? Available online: https://maps.reproductiverights.org/what-if-roe-fell (accessed on 14 December 2020).
- Okeowo, A. Fighting for Abortion Access in the South. New Yorker 2019. Available online: https://www.newyorker.com/magazine/2019/10/14/fighting-for-abortion-access-in-the-south (accessed on 6 October 2020).
- Scott, K.A.; Bray, S.; McLemore, M.R. First, Do No Harm: Why Philanthropy Needs to Re-Examine Its Role in Reproductive Equity and Racial Justice. Health Equity 2020, 4, 17–22. [Google Scholar] [CrossRef] [Green Version]
- Kramer, M.R.; Black, N.C.; Matthews, S.A.; James, S.A. The legacy of slavery and contemporary declines in heart disease mortality in the U.S. South. Ssm Popul Health 2017, 3, 609–617. [Google Scholar] [CrossRef]
- Prather, C.; Fuller, T.R.; Jeffries, W.L.t.; Marshall, K.J.; Howell, A.V.; Belyue-Umole, A.; King, W. Racism, African American Women, and Their Sexual and Reproductive Health: A Review of Historical and Contemporary Evidence and Implications for Health Equity. Health Equity 2018, 2, 249–259. [Google Scholar] [CrossRef]
- Adimora, A.A.; Ramirez, C.; Schoenbach, V.J.; Cohen, M.S. Policies and politics that promote HIV infection in the Southern United States. AIDS 2014, 28, 1393–1397. [Google Scholar] [CrossRef] [Green Version]
- Krieger, N.; Chen, J.T.; Coull, B.; Waterman, P.D.; Beckfield, J. The unique impact of abolition of Jim Crow laws on reducing inequities in infant death rates and implications for choice of comparison groups in analyzing societal determinants of health. Am. J. Public Health 2013, 103, 2234–2244. [Google Scholar] [CrossRef]
- Evans, D.P.; Narasimhan, S. A narrative analysis of anti-abortion testimony and legislative debate related to Georgia’s fetal “heartbeat” abortion ban. Sex. Reprod. Health Matters 2020, 28, 1686201. [Google Scholar] [CrossRef] [Green Version]
- Sudhinaraset, M.; Vilda, D.; Gipson, J.D.; Bornstein, M.; Wallace, M.E. Women’s Reproductive Rights Policies and Adverse Birth Outcomes: A State-Level Analysis to Assess the Role of Race and Nativity Status. Am. J. Prev. Med. 2020, 59, 787–795. [Google Scholar] [CrossRef] [PubMed]
- Pabayo, R.; Ehntholt, A.; Cook, D.M.; Reynolds, M.; Muennig, P.; Liu, S.Y. Laws Restricting Access to Abortion Services and Infant Mortality Risk in the United States. Int. J. Environ. Res. Public Health 2020, 17, 3773. [Google Scholar] [CrossRef]
- Ibis Reproductive Health and Center for Reproductive Rights. Evaluating Priorities. In Evaluating Abortion Restrictions and Supportive Policy Across the United States; Ibis Reproductive Health: New York, NY, USA, 2017. [Google Scholar]
- White, K.; Turan, J.M.; Grossman, D. Travel for Abortion Services in Alabama and Delays Obtaining Care. Womens Health Issues 2017, 27, 523–529. [Google Scholar] [CrossRef] [PubMed]
- Carroll, E.; White, K. Abortion patients’ preferences for care and experiences accessing services in Louisiana. Contracept. X 2020, 2, 100016. [Google Scholar] [CrossRef] [PubMed]
- Roberts, S.C.M.; Johns, N.E.; Williams, V.; Wingo, E.; Upadhyay, U.D. Estimating the proportion of Medicaid-eligible pregnant women in Louisiana who do not get abortions when Medicaid does not cover abortion. BMC Womens Health 2019, 19, 78. [Google Scholar] [CrossRef]
- Roberts, S.C.; Gould, H.; Kimport, K.; Weitz, T.A.; Foster, D.G. Out-of-pocket costs and insurance coverage for abortion in the United States. Womens Health Issues 2014, 24, e211–e218. [Google Scholar] [CrossRef] [PubMed]
- National Network of Abortion Funds. Common Questions About Abortion Funds. Available online: https://abortionfunds.org/common-questions/ (accessed on 6 October 2020).
- National Network of Abortion Funds. About National Network of Abortion Funds. Available online: https://abortionfunds.org/about/ (accessed on 5 October 2020).
- Cook, P.J.; Parnell, A.M.; Moore, M.J.; Pagnini, D. The effects of short-term variation in abortion funding on pregnancy outcomes. J. Health Econ. 1999, 18, 241–257. [Google Scholar] [CrossRef] [Green Version]
- Morgan, S.P.; Parnell, A.M. Effects on pregnancy outcomes of changes in the North Carolina State Abortion Fund. Popul. Res. Policy Rev. 2002, 21, 319–338. [Google Scholar] [CrossRef]
- Bessett, D.; Gorski, K.; Jinadasa, D.; Ostrow, M.; Peterson, M.J. Out of time and out of pocket: Experiences of women seeking state-subsidized insurance for abortion care in Massachusetts. Womens Health Issues 2011, 21, S21–S25. [Google Scholar] [CrossRef]
- Ely, G.E.; Hales, T.; Jackson, D.L.; Maguin, E.; Hamilton, G. The undue burden of paying for abortion: An exploration of abortion fund cases. Soc. Work Health Care 2017, 56, 99–114. [Google Scholar] [CrossRef] [PubMed]
- Ely, G.E.; Hales, T.W.; Jackson, D.L.; Maguin, E.; Hamilton, G. Where are They from and How Far Must They Go? Examining Location and Travel Distance in U.S. Abortion Fund Patients. Int. J. Sex. Health 2017, 29, 313–324. [Google Scholar] [CrossRef]
- Ely, G.E.; Hales, T.W.; Jackson, D.L.; Kotting, J.; Agbemenu, K. Access to choice: Examining differences between adolescent and adult abortion fund service recipients. Health Soc. Care Community 2018, 26, 695–704. [Google Scholar] [CrossRef]
- Ely, G.E.; Hales, T.W.; Jackson, D.L. A cross-cultural exploration of abortion fund patients in the USA and the Republic of Ireland, Northern Ireland and the Isle of Man. Cult. Health Sex. 2018, 20, 560–573. [Google Scholar] [CrossRef]
- Ely, G.E.; Hales, T.W.; Agbemenu, K. An Exploration of the Experiences of Florida Abortion Fund Service Recipients. Health Soc. Work 2020, 45, 186–194. [Google Scholar] [CrossRef] [PubMed]
- Leyser-Whalen, O.; Zareei Chaleshtori, S.; Monteblanco, A. Another disaster: Access to abortion after Hurricane Harvey. Health Care Women Int. 2020, 41, 1111–1127. [Google Scholar] [CrossRef]
- Giraud, T.; Cura, R.; Viry, M.; Lovelace, R. Interface Between R and the OpenStreetMap-Based Routing Service OSRM; 3.4.0; CRAN, 2020; Available online: https://rdrr.io/cran/osrm/ (accessed on 17 February 2021).
- Yellowhammer Fund. Available online: https://yellowhammerfund.org/ (accessed on 1 February 2021).
- Jones, R.K.; Witwer, E.; Jerman, J. Abortion Incidence and Service Availability in the United States, 2017; Guttmacher Institute: New York, NY, USA, 2019. [Google Scholar]
- National Network of Abortion Funds. Find a Local Fund. Available online: https://abortionfunds.org/funds/ (accessed on 17 March 2021).
- Gampa, V.; Bernard, K.; Oldani, M.J. Medicine and society racialization as a barrier to achieving health equity for native americans. Ama J. Ethics 2020, 22, E874–E881. [Google Scholar] [CrossRef]
- Rice, W.S.; Goldfarb, S.S.; Brisendine, A.E.; Burrows, S.; Wingate, M.S. Disparities in Infant Mortality by Race Among Hispanic and Non-Hispanic Infants. Matern Child Health J. 2017, 21, 1581–1588. [Google Scholar] [CrossRef] [PubMed]
- Chakkalakal, R.J.; Green, J.C.; Krumholz, H.M.; Nallamothu, B.K. Standardized Data Collection Practices and the Racial/Ethnic Distribution of Hospitalized Patients. Med. Care 2015, 53, 666–672. [Google Scholar] [CrossRef] [PubMed] [Green Version]
- Carlisle, S.K. Disaggregating race and ethnicity in chronic health conditions: Implications for public health social work. Soc. Work Public Health 2014, 29, 616–628. [Google Scholar] [CrossRef] [PubMed]
- Kotting, J.; Ely, G.E. The Undue Burden of Paying for Abortion: An Examination of Abortion Fund Cases; National Network of Abortion Funds: Chicago, IL, USA, 2017. [Google Scholar]
- Kortsmit, K.; Jatlaoui, T.C.; Mandel, M.G.; Reeves, J.A.; Oduyebo, T.; Petersen, E.; Whiteman, M.K. Abortion Surveillance United States, 2018. MMWR Surveill. Summ. 2020, 69, 1–29. [Google Scholar] [CrossRef] [PubMed]
- Cotterell, B. Florida governor signs new abortion restrictions. Reuters 2014. Available online: https://www.reuters.com/article/us-usa-florida-abortion-idUSKBN0EO2L520140613 (accessed on 17 February 2021).
- Hall, K.S.; Redd, S.; Narasimhan, S.; Mosley, E.A.; Hartwig, S.A.; Lemon, E.; Berry, E.; Lathrop, E.; Haddad, L.B.; Rochat, R.; et al. Abortion Trends in Georgia Following Enactment of the 22-Week Gestational Age Limit, 2007–2017. Am. J. Public Health 2020, e1–e5. [Google Scholar] [CrossRef] [PubMed]
- South Carolina Code of Laws. Title 44-Health Chapter 41-Abortions, Section 44-41-430. Definitions. 2016. Available online: https://law.justia.com/codes/south-carolina/2016/title-44/chapter-41/section-44-41-430/ (accessed on 15 February 2021).
- US Code and Statutes. 2014 Mississippi Code—Title 41—Public Health Chapter 41—Surgical or Medical Procedures; Consents, Women’s Health Protection and Preborn Pain, Act 41-44-133-Definitions. 2014. Available online: https://law.justia.com/codes/mississippi/2014/title-41/chapter-41/women-s-health-protection-and-preborn-pain-act/section-41-41-133/ (accessed on 17 February 2021).
- Finer, L.B.; Frohwirth, L.F.; Dauphinee, L.A.; Singh, S.; Moore, A.M. Timing of steps and reasons for delays in obtaining abortions in the United States. Contraception 2006, 74, 334–344. [Google Scholar] [CrossRef] [PubMed] [Green Version]
- Upadhyay, U.D.; Weitz, T.A.; Jones, R.K.; Barar, R.E.; Foster, D.G. Denial of abortion because of provider gestational age limits in the United States. Am. J. Public Health 2014, 104, 1687–1694. [Google Scholar] [CrossRef] [PubMed]
- Guttmacher Institute. Medication Abortion. 2021. Available online: https://www.guttmacher.org/state-policy/explore/medication-abortion (accessed on 17 February 2021).
- Guttmacher Institute. An Overview of Abortion Laws. 2020. Available online: https://www.guttmacher.org/state-policy/explore/overview-abortion-laws (accessed on 17 February 2021).


| Categorized Race and Ethnicity | Self-Identified Race and Ethnicity |
|---|---|
| Asian or Pacific Islander | Asian Indian/Indian (Asia), Asian Indian/Indian (Asia)/African American, Asian Indian/Indian (Asia)/African American/Hispanic/Puerto Rican, Asian Indian/Indian (Asia)/African American/White/Caucasian, Asian Indian/Indian (Asia)/Black, Asian Indian/Indian (Asia)/Black/White/Caucasian/“Mixed”, Asian Indian/Indian (Asia)/Hispanic, Asian Indian/Indian (Asia)/White/Caucasian, Asian Indian/Indian (Asia)/White/Caucasian/“Mixed”, Asian or Pacific Islander, Asian or Pacific Islander/African American, Asian or Pacific Islander/Asian Indian/Indian (Asia)/White/Caucasian, Asian or Pacific Islander/Hispanic, Asian or Pacific Islander/White/Caucasian |
| Hispanic | Hispanic, Hispanic/“Mixed”, Hispanic/“Mixed”/Native American, Hispanic/American/United States/Mexican, Hispanic/Colombian/Dominican, Hispanic/Filipino/Philippine, Hispanic/Guatemalan, Hispanic/Honduran, Hispanic/Mexican, Hispanic/Puerto Rican, Hispanic/White/Caucasian, Hispanic/White/Caucasian/“Mixed”, Hispanic/White/Caucasian/Other |
| Indigenous American | Native American/Egyptian, Native American, White Mountain Apache |
| Non-Hispanic Black | African American, African America/“Mixed”, African American/Amerindian/Indigene/Indio, African American/Black, African American/Black/“Mixed”, African American/Black/Hispanic, African American/Cherokee/Irish, African American/Creole, African American/German, African American/Haitian/Mexican, African American/Hispanic, African American/Hispanic/“Mixed”, African American/Italian/Native American, African American/Other, African American/White/Caucasian, African American/White/Caucasian/“Mixed”, African American/White/Caucasian/Hawaiian/Native Hawaiian/Native American, African American/White/Caucasian/Korean, African American/White/Caucasian/Mexican, African American/White/Caucasian/Mexican/Native American, Black, Black/“Mixed”, Black/“Mixed”/East Indian/Italian, Black/“Mixed”/Vietnamese, Black/American/United States, Black/American/United States/Ibo/Igbo/Nigerian, Black/Dominican, Black/Haitian, Black/Hispanic, Black/Hispanic/White/Caucasian, Black/Italian, Black/Jamaican, Black/Jamaican/West Indian, Black/Korean, Black/Mexican, Black/Native American, Black/Nigerian, Black/Other, Black/Puerto Rican, Black/Spaniard/Spanish, Black/Trinidadian/Tobagonian, Black/Vietnamese, Black/White/Caucasian, Black/White/Caucasian/“Mixed”, Black/White/Caucasian/Cherokee |
| Non-Hispanic White | White/Caucasian, White/Caucasian/“Mixed”, White/Caucasian/“Mixed”/Chinese, White/Caucasian/“Mixed”/Puerto Rican, White/Caucasian/Cheyenne, White/Caucasian/Native American, White/Caucasian/Other |
| Missing | Decline to State, Unknown, “Mixed”, Other, Race not specified (American/United States, American/United States/Cuban, Amerindian/Indigene/Indio, Arab/Arabic, Bangladeshi, Brazilian, Chinese, Colombian, Creole, Egyptian, English, Ethiopian, German/Puerto Rican, Haitian, Hawaiian/Native Hawaiian/Spaniard/Spanish, Honduran, Indonesian, Irish, Italian, Jamaican, Jewish/Jew, Kenyan, Lao/Laotian/Portuguese, Latin American Indian, Liberian, Mexican, Nigerian, Other/Nigerian, Pakistani, Persian, Portuguese, Romanian, Thai, Vietnamese, West Indian) |
| Categorized Country of Birth | Self-Identified Country of Birth |
|---|---|
| International | Afghanistan, Antigua and Barbuda, The Bahamas, Benin, Bhutan, Bosnia and Herzegovina, Brazil, Burundi, Cambodia, Cameroon, Canada, Chile, China, Colombia, Democratic Republic of the Congo, Cuba, Dominican Republic, El Salvador, Eritrea, Ethiopia, France, Georgia, Germany, Ghana, Guatemala, Guinea, Guyana, Haiti, Honduras, India, Iran, Italy, Jamaica, Jordan, Kenya, South Korea, Kuwait, Liberia, Mexico, Morocco, Namibia, Nicaragua, Nigeria, Pakistan, Panama, Peru, Philippines, Rwanda, Saint Kitts and Nevis, Saint Lucia, Samoa, Senegal, Seychelles, Sierra Leone, Somalia, South Africa, Spain, Thailand, Trinidad and Tobago, Turkey, Ukraine, United Kingdom, Vanuatu, Venezuela, Vietnam, Zambia |
| United States | United States |
| n (Column %) 3 | Overall (n = 9585) | Alabama (n = 1421) | Florida (n = 715) | Georgia (n = 4637) | Mississippi (n = 1206) | South Carolina (n = 423) | Tennessee (n = 1183) |
|---|---|---|---|---|---|---|---|
| Year | |||||||
| 2017 | 1766 (18%) | 402 (28%) | 106 (15%) | 824 (18%) | 89 (7%) | 67 (16%) | 278 (23%) |
| 2018 | 2534 (27%) | 519 (37%) | 175 (24%) | 1279 (27%) | 239 (20%) | 77 (18%) | 245 (21%) |
| 2019 | 5285 (55%) | 500 (35%) | 434 (61%) | 2534 (55%) | 878 (73%) | 279 (66%) | 660 (56%) |
| Race/Ethnicity 4 | |||||||
| Asian or Pacific Islander | 47 (1%) | ---- | ---- | 28 (1%) | ---- | ---- | ---- |
| Hispanic | 257 (4%) | 18 (2%) | 46 (9%) | 150 (4%) | ---- | ---- | 28 (3%) |
| Indigenous American | 15 (<1%) | ---- | ---- | ---- | ---- | ---- | ---- |
| Non-Hispanic Black | 5856 (81%) | 873 (80%) | 379 (72%) | 2907 (84%) | 754 (88%) | 239 (76%) | 704 (75%) |
| Non-Hispanic White | 1033 (14%) | 195 (18%) | 100 (19%) | 387 (11%) | 90 (11%) | 63 (20%) | 198 (21%) |
| Missing | 2377 | 331 | 185 | 1157 | 350 | 110 | 244 |
| Age Category, Years | |||||||
| <18 | 185 (2%) | 24 (2%) | 16 (2%) | 70 (2%) | 35 (3%) | ---- | 30 (2%) |
| 18–24 | 2504 (27%) | 402 (28%) | 199 (28%) | 1232 (27%) | 333 (27%) | 109 (26%) | 266 (23%) |
| 25–29 | 3299 (35%) | 483 (34%) | 221 (31%) | 1588 (34%) | 411 (34%) | 166 (39%) | 430 (36%) |
| 30–34 | 2225 (23%) | 313 (22%) | 190 (27%) | 1044 (23%) | 293 (24%) | 93 (22%) | 292 (25%) |
| 35–39 | 977 (10%) | 137 (10%) | 73 (10%) | 497 (10%) | 114 (10%) | 34 (8%) | 122 (10%) |
| 40+ | 342 (3%) | 58 (4%) | 16 (2%) | 197 (4%) | 19 (2%) | ---- | 41 (4%) |
| Missing | 16 | 4 | 0 | 9 | 1 | 0 | 2 |
| Insurance Payor | |||||||
| Private | 954 (13%) | 156 (14%) | 67 (12%) | 417 (11%) | 118 (14%) | 36 (11%) | 160 (17%) |
| Public | 3251 (43%) | 500 (44%) | 270 (49%) | 1605 (44%) | 223 (26%) | 174 (54%) | 479 (50%) |
| No Insurance | 3257 (44%) | 480 (42%) | 211 (39%) | 1618 (45%) | 515 (60%) | 113 (35%) | 320 (33%) |
| Missing | 2123 | 285 | 167 | 997 | 350 | 100 | 224 |
| Highest Level of Education | |||||||
| Less than high school | 87 (1%) | ---- | ---- | 42 (1%) | ---- | ---- | ---- |
| Some high school | 853 (11%) | 149 (13%) | 69 (12%) | 399 (11%) | 68 (8%) | 45 (14%) | 123 (13%) |
| High school degree/GED | 3097 (42%) | 492 (43%) | 283 (50%) | 1487 (41%) | 294 (34%) | 144 (44%) | 397 (41%) |
| Some College | 2208 (29%) | 333 (29%) | 132 (24%) | 1106 (30%) | 280 (32%) | 83 (25%) | 274 (28%) |
| Trade/technical/vocational training | 149 (2%) | ---- | ---- | 77 (2%) | ---- | ---- | 26 (3%) |
| College graduate or higher | 1151 (15%) | 147 (13%) | 54 (10%) | 562 (15%) | 209 (24%) | 42 (13%) | 137 (14%) |
| Missing | 2040 | 279 | 154 | 964 | 336 | 95 | 212 |
| Religious Affiliation | |||||||
| Christian | 3914 (58%) | 545 (53%) | 292 (57%) | 1900 (58%) | 516 (65%) | 171 (59%) | 490 (58%) |
| Non-religious | 1719 (26%) | 262 (26%) | 148 (29%) | 859 (26%) | 174 (22%) | 63 (22%) | 213 (25%) |
| Other | 238 (3%) | 30 (3%) | 19 (4%) | 116 (34%) | 34 (4%) | 17 (6%) | 22 (3%) |
| Prefer Not To Answer | 862 (13%) | 190 (18%) | 50 (10%) | 396 (12%) | 74 (9%) | 36 (13%) | 116 (14%) |
| Missing | 2852 | 394 | 206 | 1366 | 408 | 136 | 342 |
| Number of Children | |||||||
| 0 | 1747 (23%) | 259 (23%) | 99 (17%) | 927 (25%) | 186 (21%) | 67 (20%) | 209 (21%) |
| 1–2 | 3963 (52%) | 624 (54%) | 303 (54%) | 1848 (50%) | 474 (54%) | 191 (56%) | 523 (54%) |
| 3+ | 1884 (25%) | 264 (23%) | 164 (29%) | 922 (25%) | 216 (25%) | 73 (22%) | 245 (25%) |
| Missing | 1991 | 274 | 149 | 940 | 330 | 92 | 206 |
| Country of Birth | |||||||
| United States | 7295 (97%) | 1131 (99%) | 542 (97%) | 3502 (96%) | 867 (100%) | 320 (98%) | 933 (97%) |
| International 5 | 219 (3%) | --- | 19 (3%) | 150 (4%) | --- | --- | 33 (3%) |
| Missing | 2071 | 282 | 154 | 985 | 337 | 96 | 217 |
| n (Column %) 3 | Overall (n = 9585) | Alabama (n = 1421) | Florida (n = 715) | Georgia (n = 4637) | Mississippi (n = 1206) | South Carolina (n = 423) | Tennessee (n = 1183) |
|---|---|---|---|---|---|---|---|
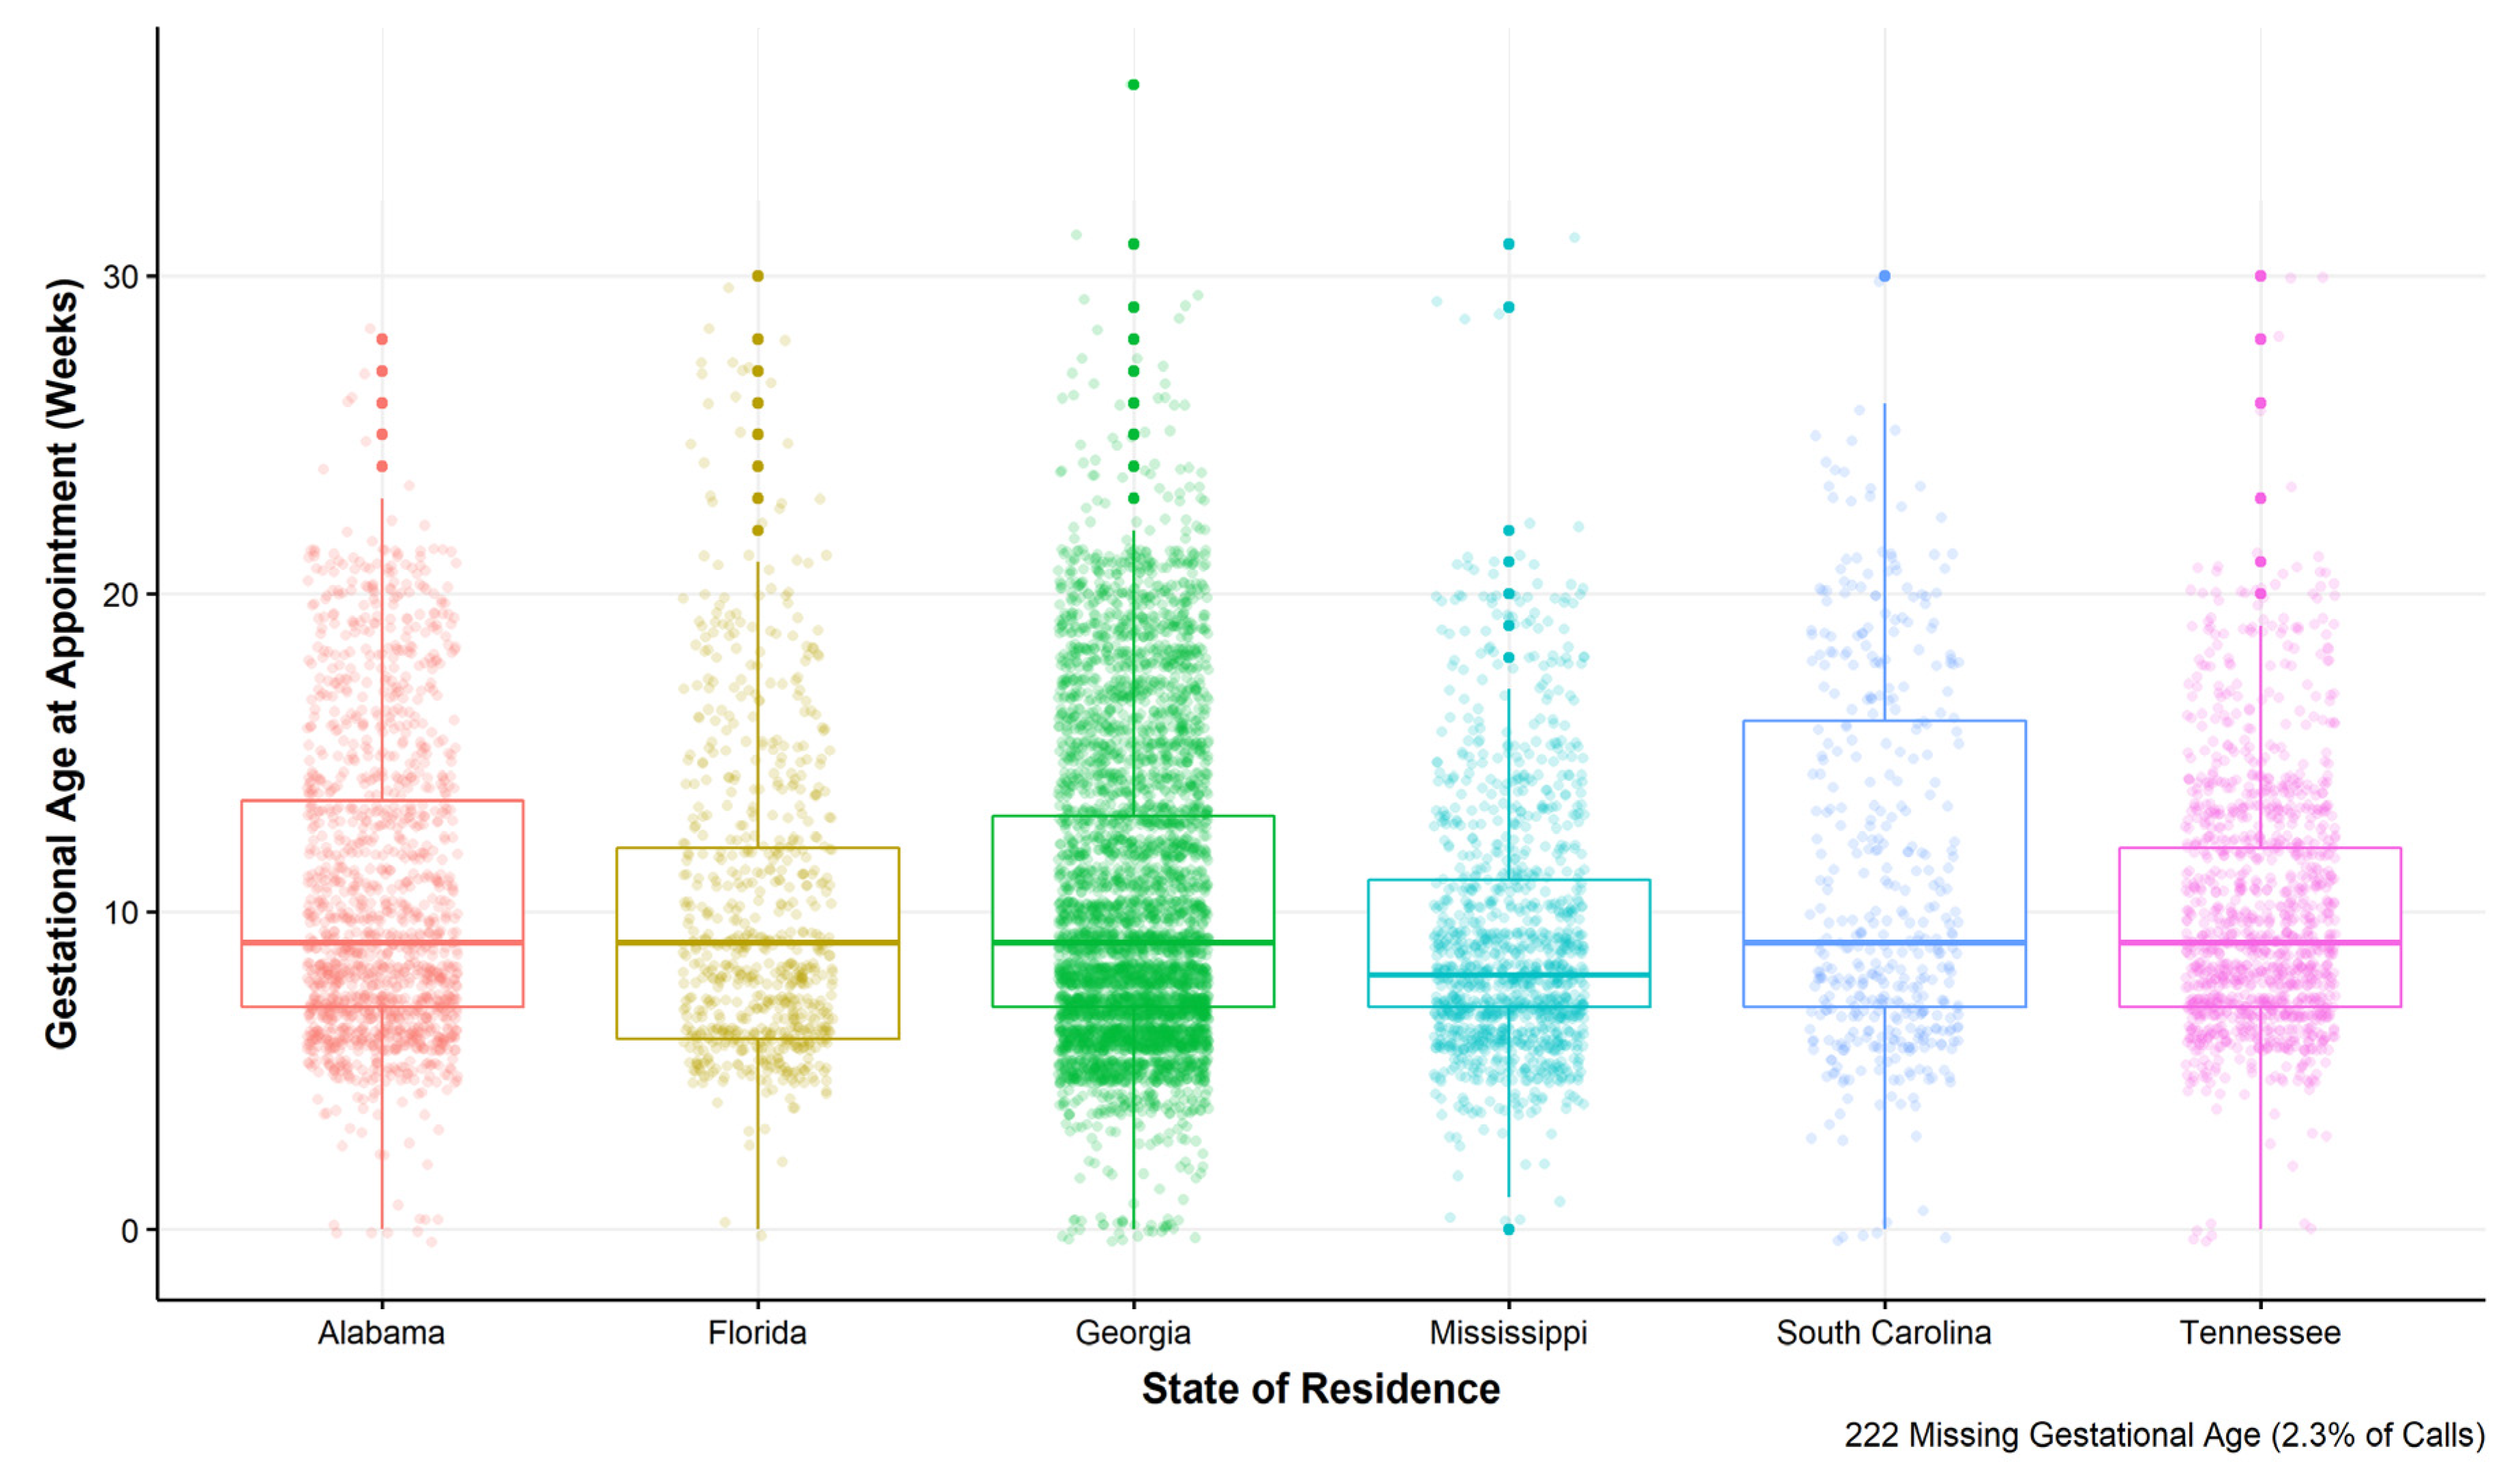
| Gestational Age Category, Weeks | |||||||
| 0–10 weeks | 5948 (64%) | 836 (61%) | 449 (64%) | 2830 (63%) | 884 (74%) | 241 (58%) | 708 (61%) |
| 11–12 weeks | 869 (9%) | 124 (9%) | 78 (11%) | 378 (8%) | 91 (8%) | 36 (8%) | 162 (14%) |
| 13–15 weeks | 1072 (11%) | 169 (12%) | 69 (10%) | 503 (11%) | 123 (10%) | 33 (8%) | 175 (15%) |
| 16–18 weeks | 744 (8%) | 121 (9%) | 49 (7%) | 422 (9%) | 46 (4%) | 46 (11%) | 60 (5%) |
| 19–21 weeks | 608 (7%) | 114 (8%) | 35 (5%) | 322 (7%) | 44 (4%) | 44 (11%) | 49 (4%) |
| 22+ weeks | 122 (1%) | ---- | 21 (3%) | 63 (2%) | ---- | 16 (4%) | ---- |
| Missing | 222 | 46 | 14 | 119 | 12 | 7 | 24 |
| Abortion Type | |||||||
| Medication Abortion | 3202 (35%) | 343 (25%) | 272 (39%) | 1434 (32%) | 661 (56%) | 127 (32%) | 365 (32%) |
| Surgical Abortion | 6072 (65%) | 1018 (75%) | 423 (61%) | 3060 (68%) | 515 (44%) | 275 (68%) | 781 (68%) |
| Missing | 311 | 60 | 20 | 143 | 30 | 21 | 37 |
| ARC-Southeast AF Pledge | 7233 (76%) | 834 (59%) | 583 (82%) | 3573 (77%) | 973 (81%) | 334 (79%) | 936 (79%) |
| ARC-Southeast AF Pledge, Dollars 4 | 75 (60, 100) | 85 (60, 100) | 80 (60, 100) | 75 (60, 100) | 75 (60, 100) | 85 (75, 125) | 80 (75, 100) |
| ARC-Southeast AF Caller Contribution, Dollars 3 | 200 (40, 300) | 150 (0, 275) | 220 (100, 350) | 200 (50, 300) | 175 (29, 250) | 165 (25, 274) | 175 (0, 250) |
| Visiting Clinic in state of Residence | 7652 (81%) | 720 (51%) | 652 (91%) | 4366 (96%) | 889 (74%) | 75 (18%) | 950 (81%) |
| Distance from Residential Zip Code to Clinic, Miles | |||||||
| 0–24 miles | 4627 (48%) | 377 (27%) | 522 (73%) | 2517 (54%) | 394 (33%) | 61 (14%) | 756 (64%) |
| 25–49 miles | 1374 (14%) | 179 (12%) | 40 (6%) | 922 (20%) | 94 (8%) | 59 (14%) | 80 (7%) |
| 50–99 miles | 1386 (15%) | 248 (18%) | 30 (4%) | 600 (13%) | 321 (27%) | 109 (26%) | 78 (6%) |
| 100–299 miles | 1887 (20%) | 566 (40%) | 67 (9%) | 527 (11%) | 320 (26%) | 163 (39%) | 244 (21%) |
| 300+ miles | 311 (3%) | 51 (4%) | 56 (8%) | 71 (2%) | 77 (6%) | 31 (7%) | 25 (2%) |
| n (Column %) 2 | With Geographic Information | Without Geographic Information |
|---|---|---|
| (n = 9585) | (n = 542) | |
| Year | ||
| 2017 | 1766 (18%) | 354 (65%) |
| 2018 | 2534 (27%) | 86 (16%) |
| 2019 | 5285 (55%) | 102 (19%) |
| State of Residence | ||
| Alabama | 1421 (15%) | 65 (12%) |
| Florida | 715 (8%) | 39 (7%) |
| Georgia | 4637 (48%) | 319 (59%) |
| Mississippi | 1206 (13%) | 26 (5%) |
| South Carolina | 423 (4%) | 61 (11%) |
| Tennessee | 1183 (12%) | 32 (6%) |
| Race/Ethnicity 3 | ||
| Asian or Pacific Islander | 47 (1%) | --- |
| Hispanic | 257 (4%) | 15 (3%) |
| Indigenous American | 15 (<1%) | --- |
| Non-Hispanic Black | 5856 (81%) | 356 (80%) |
| Non-Hispanic White | 1033 (14%) | 67 (15%) |
| Missing | 2377 | 95 |
| Age Category, Years | ||
| <18 | 185 (2%) | --- |
| 18–24 | 2504 (27%) | 135 (25%) |
| 25–29 | 3299 (35%) | 185 (34%) |
| 30–34 | 2225 (23%) | 106 (20%) |
| 35–39 | 977 (10%) | 71 (13%) |
| 40+ | 342 (3%) | 28 (5%) |
| Missing | 16 | --- |
| Insurance Payor | ||
| Private | 954 (13%) | 43 (10%) |
| Public | 3251 (43%) | 221 (48%) |
| No Insurance | 3257 (44%) | 193 (42%) |
| Missing | 2123 | 85 |
| Highest Level of Education | ||
| Less than high school | 87 (1%) | --- |
| Some high school | 853 (11%) | 65 (14%) |
| High school degree/GED | 3097 (41%) | 208 (45%) |
| Some College | 2208 (29%) | 118 (25%) |
| Trade/technical/vocational training | 149 (2%) | --- |
| College graduate or higher | 1151 (15%) | 66 (14%) |
| Missing | 2040 | 75 |
| Religious Affiliation | ||
| Christian | 3914 (58%) | 232 (52%) |
| Non-religious | 1719 (26%) | 140 (32%) |
| Other | 238 (3%) | 20 (5%) |
| Prefer not to Answer | 862 (13%) | 43 (10%) |
| Missing | 2852 | 107 |
| Number of Children | ||
| 0 | 1747 (23%) | 131 (28%) |
| 1–2 | 3963 (52%) | 225 (48%) |
| 3+ | 1884 (25%) | 111 (24%) |
| Missing | 1991 | 75 |
| Country of Birth | ||
| United States | 7295 (97%) | 450 (97%) |
| International 4 | 219 (3%) | --- |
| Missing | 2071 | 80 |
| Gestational Age Category, Weeks | ||
| 0–10 weeks | 5948 (64%) | 208 (55%) |
| 11–12 weeks | 869 (9%) | 33 (9%) |
| 13–15 weeks | 1072 (11%) | 40 (11%) |
| 16–18 weeks | 744 (8%) | 36 (9.5) |
| 19–21 weeks | 608 (7%) | 38 (10%) |
| 22+ weeks | 122 (1%) | 23 (6%) |
| Missing | 222 | 164 |
| Abortion Type | ||
| Medication Abortion | 3202 (35%) | 59 (17%) |
| Surgical Abortion | 6072 (65%) | 291 (83%) |
| Missing | 311 | 192 |
| ARC-Southeast AF Pledge | 7233 (76%) | 113 (21%) |
| Median ARC-Southeast AF Pledge, Dollars 5 | 75 (60, 100) | 60 (50, 100) |
| Median ARC-Southeast AF Caller Contribution, Dollars 5 | 200 (40, 300) | 0 (0,0) |
Publisher’s Note: MDPI stays neutral with regard to jurisdictional claims in published maps and institutional affiliations. |
© 2021 by the authors. Licensee MDPI, Basel, Switzerland. This article is an open access article distributed under the terms and conditions of the Creative Commons Attribution (CC BY) license (https://creativecommons.org/licenses/by/4.0/).
Share and Cite
Rice, W.S.; Labgold, K.; Peterson, Q.T.; Higdon, M.; Njoku, O. Sociodemographic and Service Use Characteristics of Abortion Fund Cases from Six States in the U.S. Southeast. Int. J. Environ. Res. Public Health 2021, 18, 3813. https://doi.org/10.3390/ijerph18073813
Rice WS, Labgold K, Peterson QT, Higdon M, Njoku O. Sociodemographic and Service Use Characteristics of Abortion Fund Cases from Six States in the U.S. Southeast. International Journal of Environmental Research and Public Health. 2021; 18(7):3813. https://doi.org/10.3390/ijerph18073813
Chicago/Turabian StyleRice, Whitney S., Katie Labgold, Quita Tinsley Peterson, Megan Higdon, and Oriaku Njoku. 2021. "Sociodemographic and Service Use Characteristics of Abortion Fund Cases from Six States in the U.S. Southeast" International Journal of Environmental Research and Public Health 18, no. 7: 3813. https://doi.org/10.3390/ijerph18073813