Article

Spatial and Temporal Variations in PM10 Concentrations between 2010–2017 in South Africa

by
Oluwaseyi Olalekan Arowosegbe
1,2,*,
Martin Röösli
1,2,
Temitope Christina Adebayo-Ojo
1,2,
Mohammed Aqiel Dalvie
3 and
Kees de Hoogh
1,2
1
Department of Epidemiology and Public Health, Swiss Tropical and Public Health Institute, Socinstrasse 57, CH-4002 Basel, Switzerland
2
Faculty of Science, University of Basel, CH-4003 Basel, Switzerland
3
Centre for Environmental and Occupational Health Research, School of Public Health and Family Medicine, University of Cape Town, Rondebosch, Cape Town 7700, South Africa
*
Author to whom correspondence should be addressed.
Int. J. Environ. Res. Public Health 2021, 18(24), 13348; https://doi.org/10.3390/ijerph182413348
Submission received: 11 November 2021 / Revised: 10 December 2021 / Accepted: 14 December 2021 / Published: 18 December 2021
(This article belongs to the Special Issue Air Pollution in Africa and the African Diaspora)

Abstract

:
Particulate matter less than or equal to 10 μm in aerodynamic diameter (PM10 µg/m3) is a priority air pollutant and one of the most widely monitored ambient air pollutants in South Africa. This study analyzed PM10 from monitoring 44 sites across four provinces of South Africa (Gauteng, Mpumalanga, Western Cape and KwaZulu-Natal) and aimed to present spatial and temporal variation in the PM10 concentration across the provinces. In addition, potential influencing factors of PM10 variations around the three site categories (Residential, Industrial and Traffic) were explored. The spatial trend in daily PM10 concentration variation shows PM10 concentration can be 5.7 times higher than the revised 2021 World Health Organization annual PM10 air quality guideline of 15 µg/m3 in Gauteng province during the winter season. Temporally, the highest weekly PM10 concentrations of 51.4 µg/m3, 46.8 µg/m3, 29.1 µg/m3 and 25.1 µg/m3 at Gauteng, Mpumalanga, KwaZulu-Natal and Western Cape Province were recorded during the weekdays. The study results suggest a decrease in the change of annual PM10 levels at sites in Gauteng and Mpumalanga Provinces. An increased change in annual PM10 levels was reported at most sites in Western Cape and KwaZulu-Natal.

1. Introduction

The levels of air pollution in sub-Saharan Africa (SSA) have remained high compared to other regions of the world that have witnessed notable improvements [1]. The deteriorating trend of air quality in SSA countries, such as South Africa, has been linked to rapid urbanization, industrialization and the resultant increase in population. South Africa relies significantly on fossil fuel for both industrial and domestic activities—over 80% of power generation is from fossil fuel. Other important sources of air pollution emission in South Africa include bush burning, land-fills, dust from construction sites and wind-blown dust from open land [2,3]. Exposure to ambient air pollution accounted for over four million deaths globally in 2019 [4]. Particulate matter less than or equal to 10 μm in aerodynamic diameter (PM10 µg/m3) is one of the most important pollutants of public health interest that is monitored in South Africa [5]. The revised 2015 National Air Quality standard of daily limit of 75 µg/m3 and annual limit of 40 µg/m3 are less stringent than the World’s Health Organization’s limit of 45 µg/m3 and annual limit of 15 µg/m3 [6,7].
The levels of PM10 concentration can vary in space and time due to distinct meteorological conditions and anthropogenic sources, such as vehicular, domestic and industrial emissions, between the different provinces in South Africa [8,9]. Several air quality management policies and strategies have been introduced to address the worsening air quality in South Africa [6]. These include the identification and control of priority pollutants, the promulgation of regulations to reduce emissions from industries and the classification of air pollution prone areas as priority areas for efficient management of limited air quality management resources [6,10,11]. To this end, air quality management and monitoring resources are concentrated in four air pollution priority areas, including the Highveld, the Vaal triangle, the South Durban Basin and Waterberg, located in four different provinces (Gauteng, Mpumalanga, Western Cape and KwaZulu-Natal) of South Africa. These four areas were prioritized due to the propensity of the observed or outlook of air quality in these areas to exceed the national air quality standards [6,10,12]. Only a few previous studies of air pollutants have examined the spatial and temporal trends of PM10 from sites in these areas and SSA [10,12,13,14,15]. This is because of limited measurement data to explore the long-term spatial and temporal patterns of PM10 in these areas. A couple of studies have assessed the trend in PM10 mostly in air pollution priority areas of Gauteng and Mpumalanga province of South Africa [10,12,13,15,16]. In addition, Onyango et al. described the spatial and temporal variation in PM10 concentrations at three sites in Uganda [14].
Our previous study described the quality of ground-level PM10 measurements in four provinces of South Africa, Gauteng, Mpumalanga, Western Cape and KwaZulu-Natal, for the years 2010–2017 [17]. The earlier study explored methods to bridge the gap in daily PM10 data by imputing missing daily PM10 for some sites in these provinces for the study period. This study intends to build on the PM10 exposure data from the earlier study to characterize daily PM10 spatially and temporally for four provinces of South Africa. To investigate the pattern of change in PM10, we assessed the change in annual PM10 average across the sites in these areas for the years 2010–2017. Additionally, we explored the characterization of potential influencing factors of PM10 emission around the sites. An improved understanding of the pattern of PM10 concentration between the four provinces can play a significant role in informing mitigation actions toward addressing the threat posed by air pollution, especially in low- and middle-income countries, such as South Africa, with limited ground-monitored data.

2. Materials and Methods

In this study, PM10 measurements from 44 monitoring sites across four provinces (Gauteng, Mpumalanga, Western Cape and KwaZulu-Natal) of South Africa were included. Hourly PM10 from the South African Air Quality Information System (SAAQIS). SAAQIS can be reached via their website (https://saaqis.environment.gov.za/, accessed on 22 October 2018). For our study, we selected, for each year between 2010 and 2017, all sites with more than or equal to 70% of total daily measurement data available during a year [17]. Missing data were imputed using a random forest machine learning method, including spatiotemporal predictors, like meteorological, land use and source-related variables, as described in detail in our previous paper [17]. The combined observed and imputed data were used for this study analysis. The distribution of the sites across the provinces differs substantially (Figure 1). The Vaal triangle airshed Priority Area monitoring network and the Highveld Priority Area air quality-monitoring network that cut across Mpumalanga and Gauteng Provinces were the earliest networks established to monitor ambient air quality in South Africa. The South Africa Weather Service classifies the majority of the sites (21) as industrial sites, 18 as residential sites and 5 as traffic sites. An overview of the state of annual PM10 availability is presented in supplementary material Table S1. Thirty-two of the forty-four sites (73%) have more than a year of PM10 measurement data.
To evaluate the potential influencing factors of PM10 around these monitoring sites, we explored multiple buffers (100, 300, 500, 1000, 10,000 m) of land use categories (Residential and Industrial), population density and road density around the monitoring sites. South Africa’s road network was obtained from OpenStreetMap (OSM) and the sum of road length was calculated for two categories: (1) major roads defined as roads of OSM types of primary, secondary and tertiary roads and (2) all roads defined as roads of OSM types of residential, service, motorway and trunk. Population density was obtained from the Socioeconomic data and Application Center (SEDAC) dataset. Land use was classified based on the 2018 South Africa National Land cover dataset categories.
To evaluate changes in annual average PM10 concentrations for 2010–2017, we applied two formulas. For sites with two consecutive years with average PM10 data, the change was calculated by applying the formula:
  = ( C x C y 1 ) 100
where Δ is the change, Cx is the annual mean PM10 concentration in the current year and Cy is the annual mean PM10 concentration in the previous year.
For sites with missing data between successive years, the change in average PM10 for a year with average PM10 data was calculated by applying:
  = ( C x C y y x 1 ) 100
where Δ is the change, Cx is the annual mean PM10 concentration in current year y, Cy is the annual mean PM10 concentration in the next previous year (year x) with an annual mean PM10 concentration and yx is the number of year(s) between available measurements.
We also calculated annual changes of PM10 levels for the 32 sites with more than a year of PM10 sites using a linear regression analysis.

3. Results

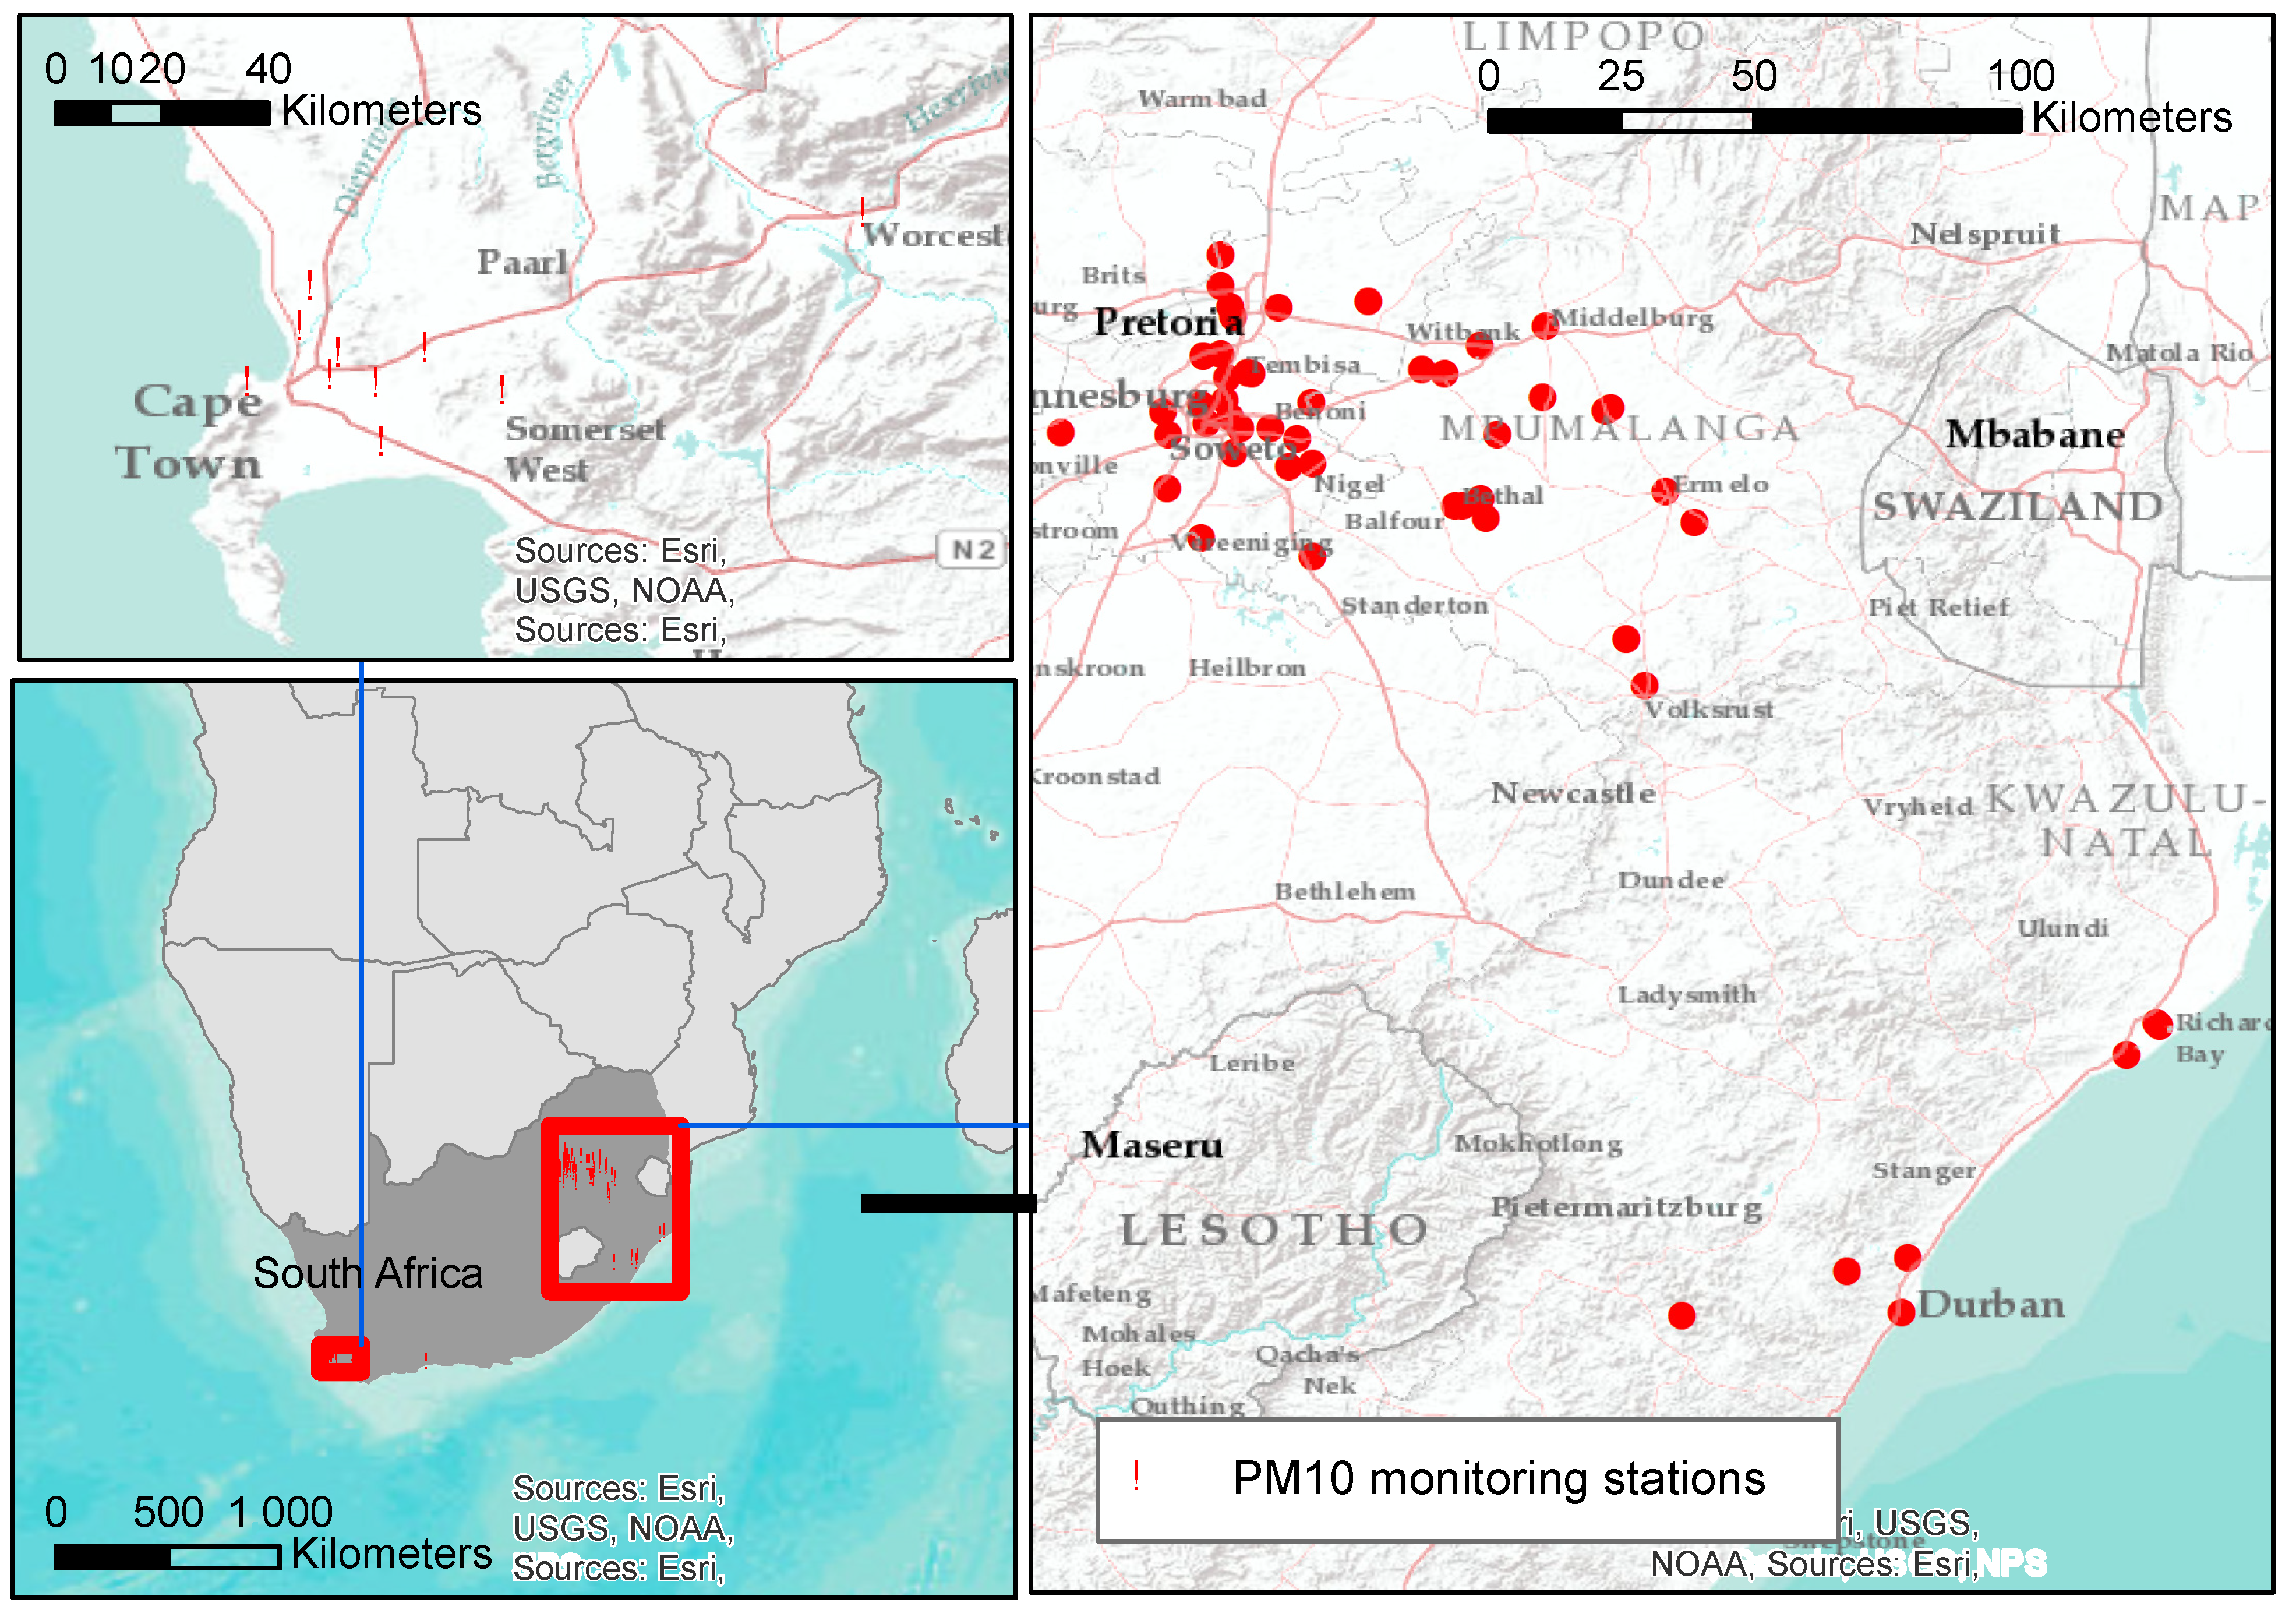
3.1. Characterization of Sites

Figure 2 presents the level of variation in potential land use, road density and population variables that can provide information about the likely prominent influencing factors of PM10 around the site types as designated by the South Africa Weather Service. Buffers of different sizes ranging from 100, 300, 500, 1000, and 10,000 m radii around the sites were considered. Figure 3 presents the analysis for a 300-m buffer. The other buffers sizes did not show substantially different patterns in their distributions. Generally, the distribution of calculated land use, road density and population within a 300 m buffer are in agreement with the monitoring site classification, although industrial land use was actually lower around industrial sites compared to the other two site types. Residential land use and population density were highest for residential classified sites. Major road density within a 300 m buffer was highest for monitoring sites classified as traffic sites.

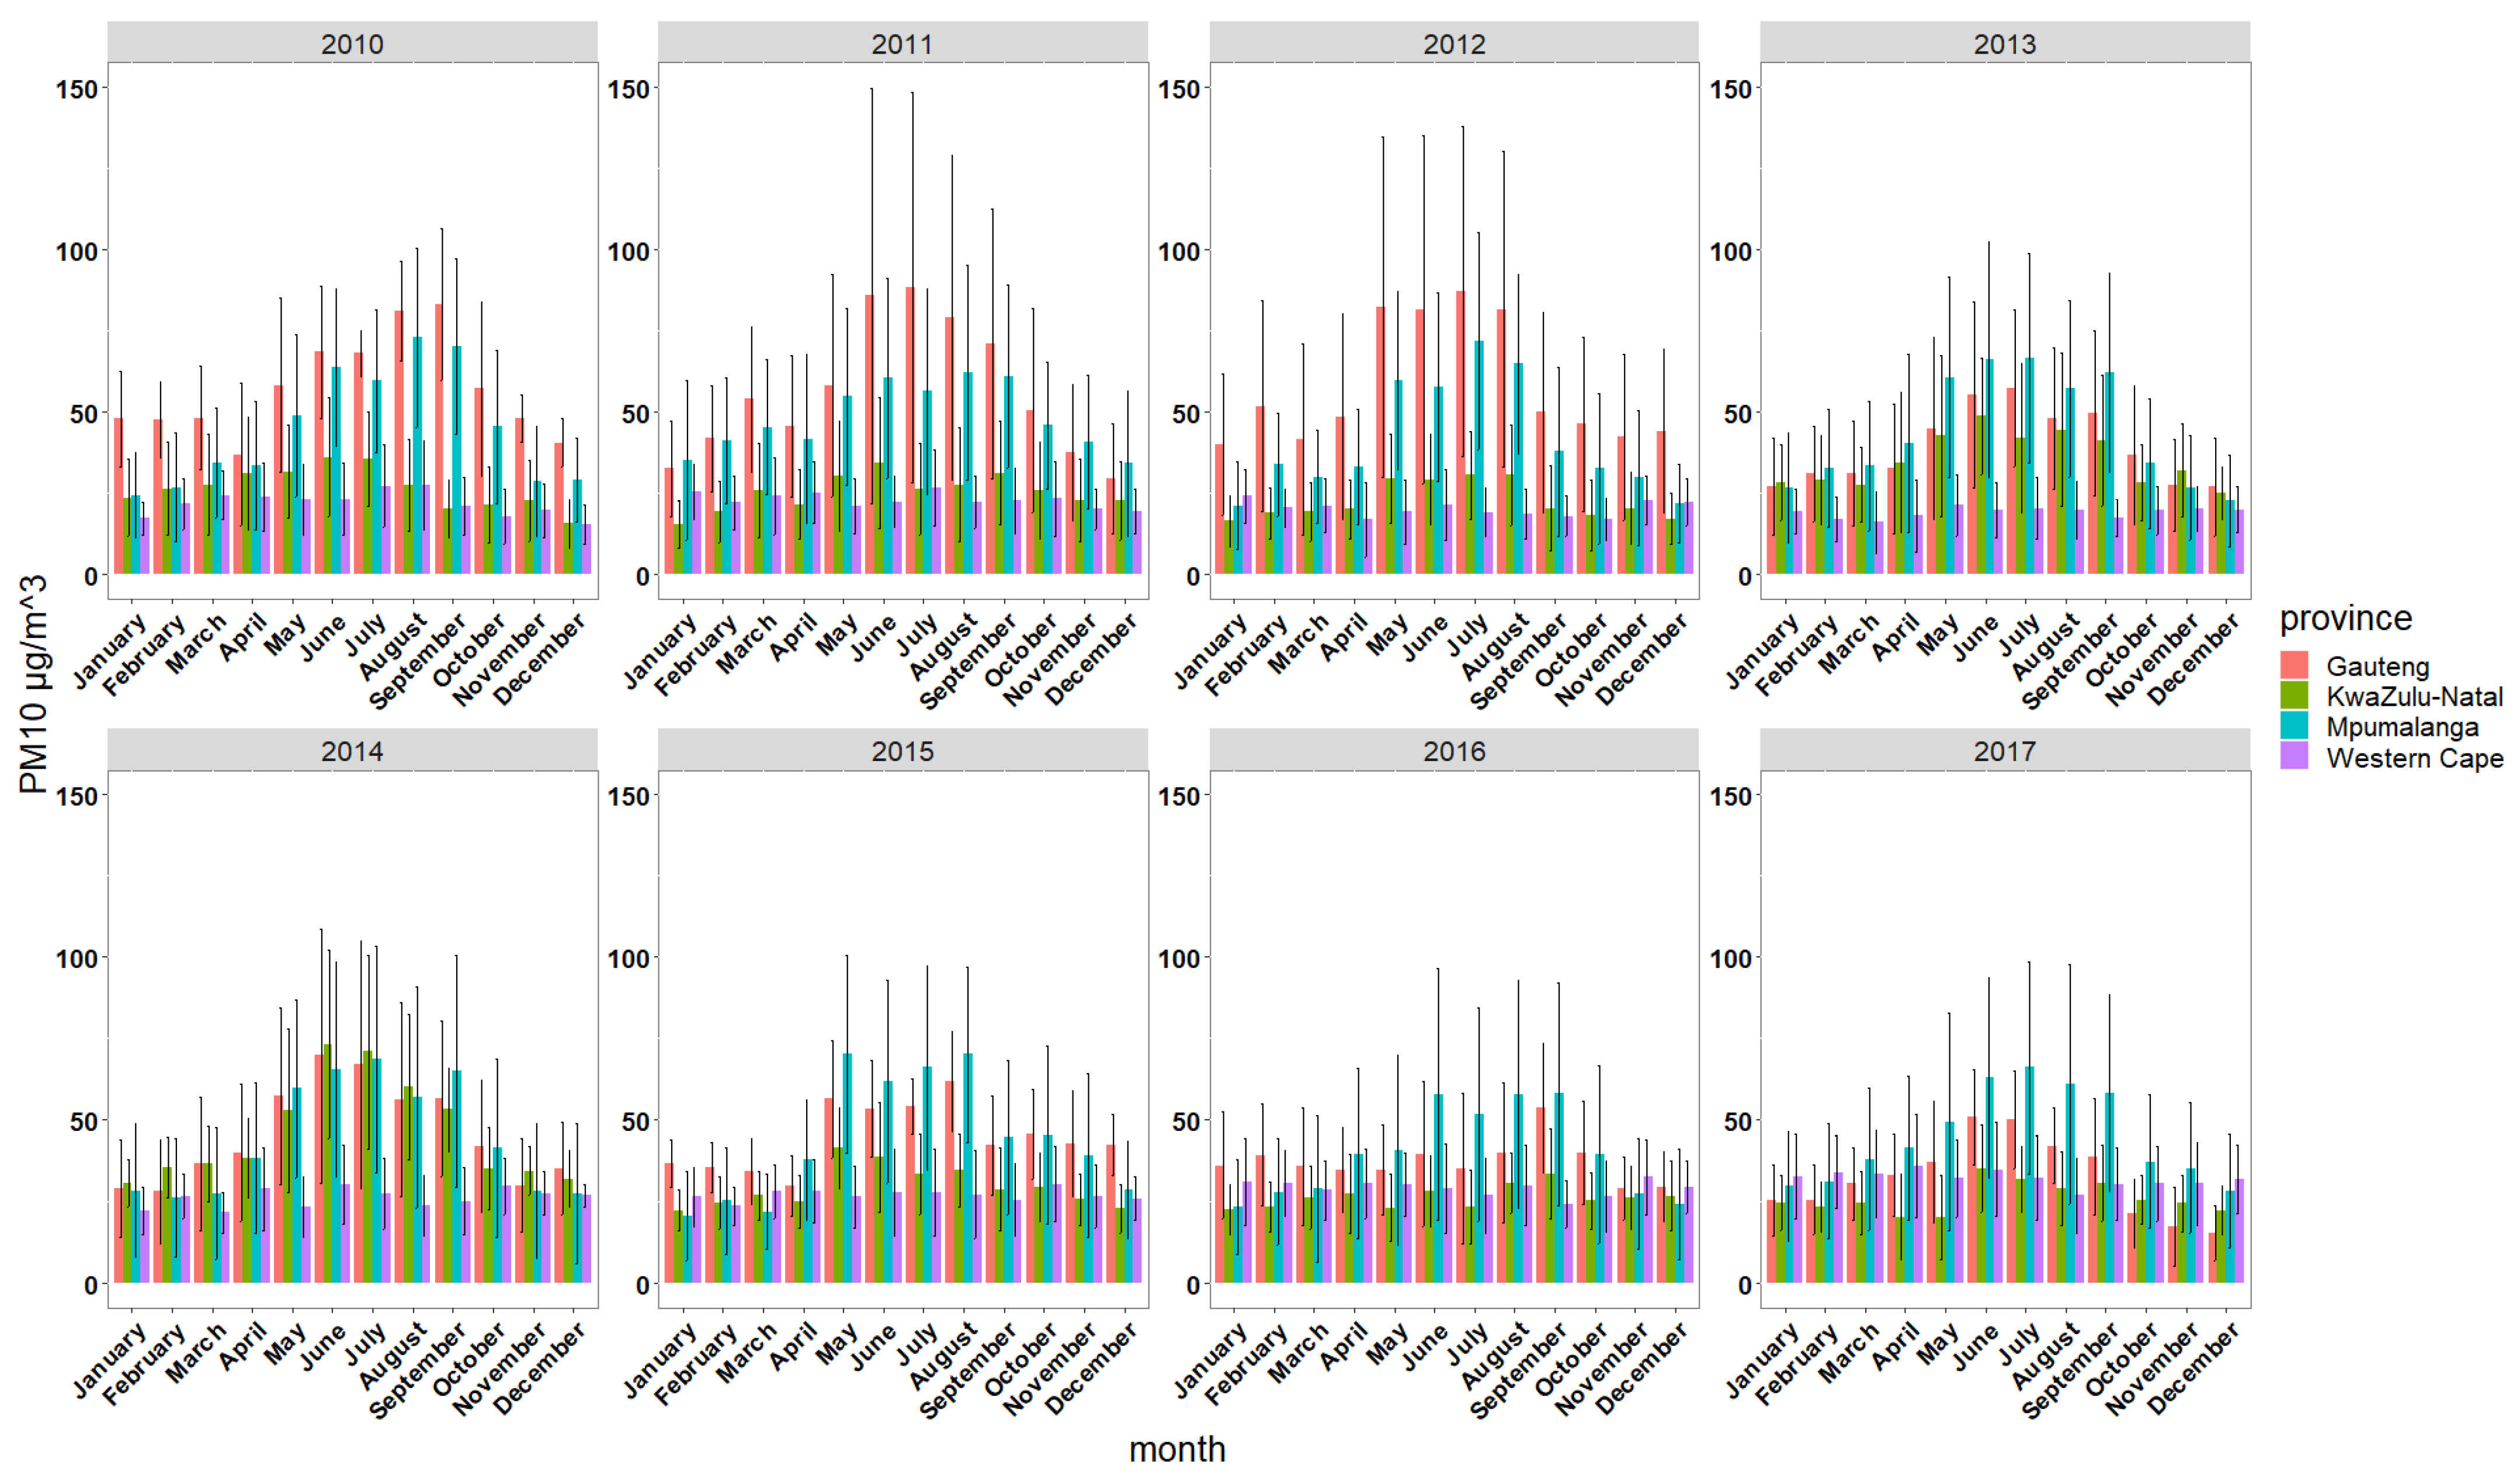
3.2. Annual Change in Site’s Average PM10 µg/m3 Concentration over the Study Period

Table 1 shows how the levels of PM10 change across the sites for the years 2010–2017. In Gauteng province, the average change in annual PM10 concentration decreased in 5 of 8 sites (63%) (Table 1). In Mpumalanga province, the average change in annual PM10 concentration decreased in 9 of 12 sites (75%). The average change in annual PM10 concentration decreased in only 3 of 7 (43%) Western Cape Province sites. Similarly, a decrease in the average change in annual PM10 concentration was observed in only 2 of 5 (40%) KwaZulu-Natal province sites.

3.3. Monthly Differences in Daily PM10

A summary of monthly mean PM10 concentrations across all sites per province and across the years 2010–2017 is presented in Figure 3. The pattern in the levels of PM10 across the four provinces (Gauteng, KwaZulu-Natal, Mpumalanga and Western Cape) of South Africa suggests seasonal variation in monthly PM10 levels. The monthly PM10 levels show a seasonal pattern across the provinces and are more prominent in Gauteng and Mpumalanga provinces. The monthly mean PM10 levels were highest in Gauteng Province and lowest in Western Cape Province. In Gauteng, the lowest monthly mean PM10 concentrations were recorded during the summer months (December–February), ranging from a monthly mean of 15.51 µg/m3 recorded in December 2017 to 51.92 µg/m3 recorded in February 2012. The monthly mean PM10 peaked during the winter months, ranging from 35.29 µg/m3 recorded in July 2016 to 88.46 µg/m3 recorded in July 2011. The highest mean PM10 recorded during the winter months is about 5.7 times higher than the revised 2021 WHO annual PM10 air quality guideline of 15 µg/m3. In Western Cape Province, the lowest monthly mean during the summer months ranged from 15.53 µg/m3 recorded in December 2010 to 34.17 µg/m3 in February 2017. The monthly mean PM10 during the winter months ranged from 18.69 µg/m3 recorded in August 2012 to 34.98 µg/m3 recorded in June 2017. In general, all provinces recorded peak PM10 levels during the winter months in South Africa between June and August.

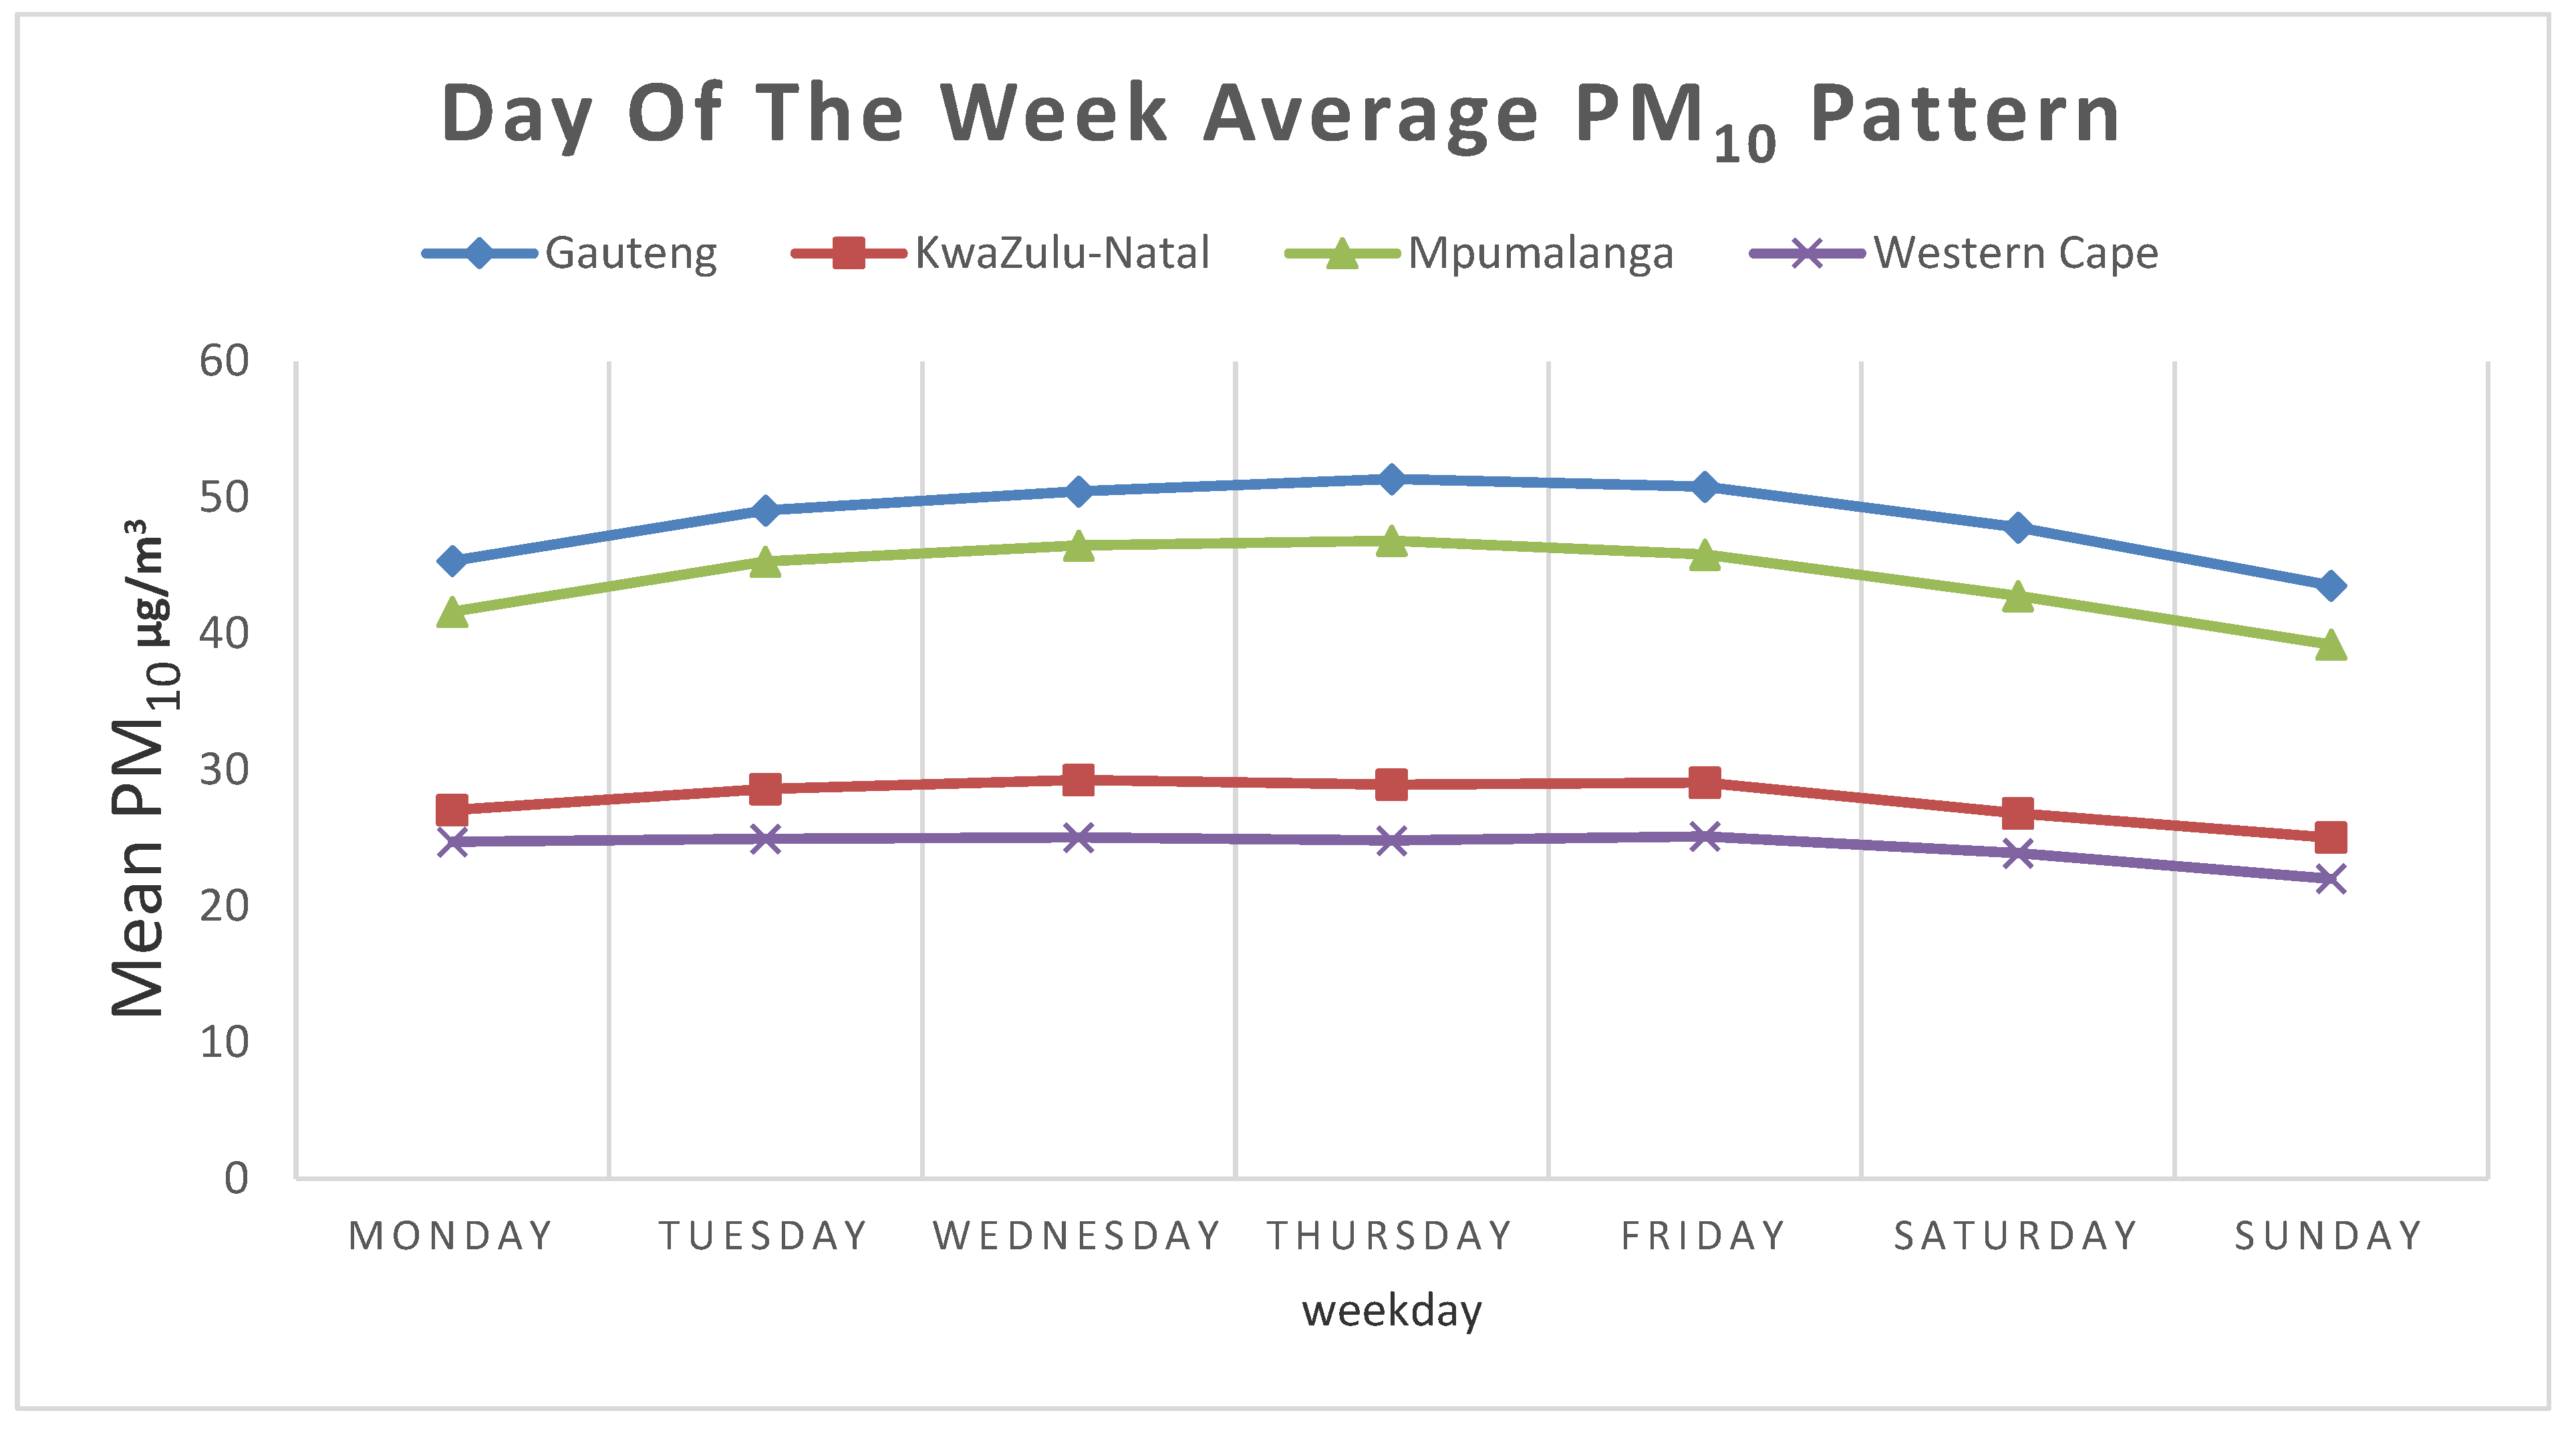
3.4. Week Day Differences in Daily PM10

Figure 4 summarizes daily mean PM10 per province for the eight-year study period. Generally, marginal differences were found between different days of the week between 2010 and 2017. Average daily PM10 concentrations during the weekdays are slightly higher than during weekends in all four provinces. The highest PM10 concentrations of 51.4 µg/m3, 46.8 µg/m3, 29.1 µg/m3 and 25.1 µg/m3 at Gauteng, Mpumalanga, KwaZulu-Natal and Western Cape Province were recorded during the weekdays. Statistically significant differences in mean PM10 concentrations were observed between weekdays and weekends (F = 14.57 and value = 0.0009) and by province (F = 380.11 and p value =< 0.0001). The Pairwise Tukey’s test comparisons suggest the difference between weekdays and weekends mean PM10 concentrations was statistically significant in all pairs of provinces but between KwaZulu-Natal and Western Cape (p value = 0.14).

3.5. Spatial Variation in PM10

A summary of descriptive statistics is presented in Table 2. There are 20 industrial sites, 18 residential sites and 5 traffic sites included in this analysis. These traffic sites are located in the three provinces of Gauteng (1 site), Western Cape (2 sites), KwaZulu-Natal (2 sites). The results from Table 2 show that the levels of PM10 concentration level is highest in Gauteng and for all provinces PM10 concentration is highest at the residential sites compared to industrial and traffic sites. In Gauteng, the concentration at one traffic site was similar to the concentration at the residential sites and substantially higher than the levels at the industrial sites.
The levels of PM10 concentration in Mpumalanga province are also high (Table 2). The industrial sites in Mpumalanga recorded the highest levels of PM10 compared to the industrial sites in other provinces. The PM10 concentration levels at both industrial and residential sites in Mpumalanga are comparable. The levels of PM10 concentration in Western Cape are the lowest compared to other provinces. Residential sites recorded the highest level of PM10 concentration in Western Cape. However, there are no substantial differences in the levels of PM10 concentration across the site types. Similarly, sites from KwaZulu-Natal province also recorded relatively low levels of PM10 concentration compared to Gauteng and Mpumalanga provinces. The levels at residential sites are also marginally higher than the levels at traffic sites (Table 2).

3.6. Attainment of PM10 Standards

Table 3 shows the percentage of days that PM10 concentration daily limits were exceeded using WHO and South Africa’s National Air Quality Standard (NAAQS) for the sites in the four provinces from 2010–2017. Gauteng province reported the highest proportion of days exceeding the daily limits of WHO and NAAQS standards, with about 38% of the days exceeding the WHO daily standard and around 17% of days exceeding the NAAQS daily standard. In contrast, Western Cape Province reported the lowest percentage of days exceeding both WHO and NAAQS PM10 air quality standards (3% and 0.09%, respectively) between years 2010–2017 (Table 3).

4. Discussion

This study adds to existing evidence on levels of PM10 in South Africa. The eight-year trend in PM10 level suggest that PM10 is still high in the earliest high pollution designated priority areas around Gauteng and Mpumalanga provinces. However, there is evidence of decreasing PM10 levels at most sites in both Gauteng and Mpumalanga Provinces. While the level of PM10 of most sites in KwaZulu-Natal and Western Cape Provinces suggest an increase in PM10 levels during the study period. The presented analysis identified trends in ambient PM10 concentrations in four South African Provinces for the years 2010–2017.

4.1. Spatial and Temporal Trends in Daily PM10

The Vaal Triangle Airshed Priority Area (VTAPA) and Highveld Priority Area around Gauteng and Mpumalanga Provinces were the first areas designated as air pollution priority areas in South Africa due to the observed or expected level of air pollution in these areas [2,10]. Both provinces share similar emissions profiles; they are home to the majority of coal-powered plants, coal mining, gold mining, mine tailing, petrochemical and ferroalloy industries in South Africa. To address the level of air pollution in these areas, air quality management plans were developed to guide actions towards improving the air quality in these priority areas. Some of the actions implemented to reduce the air pollution in these areas include the closure of a high polluting industry, large-scale domestic electrification program in these areas to reduce domestic emissions [2,10]. Thus, the decrease in the levels of PM10 reported in this study at most sites around these areas in Mpumalanga and Gauteng Provinces could be because of the changing emission profiles in these priority areas due to these mitigation actions. Despite the lower levels of PM10 reported in KwaZulu-Natal and Western Cape Provinces compared to Gauteng and Mpumalanga Provinces, the average change in annual PM10 increased at most sites in these Provinces. This trend signals a deteriorating air quality in these areas that is likely due to changes in emissions profiles in these areas. The Southern Basin Industrial areas in KwaZulu-Natal have been identified as air pollution hotspots due to the high density of industrial activities in this area [18]. There are also concerns about the air quality in Western Cape provinces, especially around the increasing informal settings in Western Cape Province [19].
The monthly variation in PM10 across the provinces during the study period shows that PM10 concentrations are highest during the winter months between June and August. This is consistent with results of a study in Gauteng assessing the characteristics of ground-monitored PM2.5 and PM10 between years 2010 and 2014 [13] and a study conducted in eMbalenhle—a low socio-economic in Mpumalanga province [15]. Similarly, the marginal seasonal difference in PM10 reported in Western Cape Province follows the pattern reported in a Western Cape study that reported the seasonal difference in PM10 in 2016 using data from one monitoring site [16]. A Ugandan study, however, reported higher PM10 concentration during the dry seasons compared to wet seasons [14]. The difference in seasonal weather patterns and sources of PM10 between South Africa and Ugandan could explain the seasonal difference in PM10 concentration. The cold season in most of South Africa’s provinces is characterized by cold weather and an increase in solid biomass use as a source of energy. The reliance of South African’s on solid biomass as a source of energy for cooking and heating system during the winter has been reported in other studies [2,20,21,22]. Residential fuel consumption in South Africa includes kerosene, residential fuel oil, LPG, sub-bituminous coal, wood/wood waste, other primary solid biomass and charcoal. Overall, residential fuel consumption dropped from 2010 to 2017, but domestic coal consumption increased slightly [22]. This study also highlights the fact that domestic sources of PM10 contribute substantially to the variability of PM10 in South Africa.
The trend in weekday PM10 level follows a similar pattern across the four provinces. PM10 concentration increased through the weekdays, reaching its peak between Wednesday and Friday. This study suggests that there is a difference between PM10 levels between weekends and weekdays, with lower PM10 levels reported during the weekends. Although there are only four traffic sites in this analysis, the decreased level in traffic-related activities during the weekend might be responsible for the observed lower PM10 levels during the weekend.

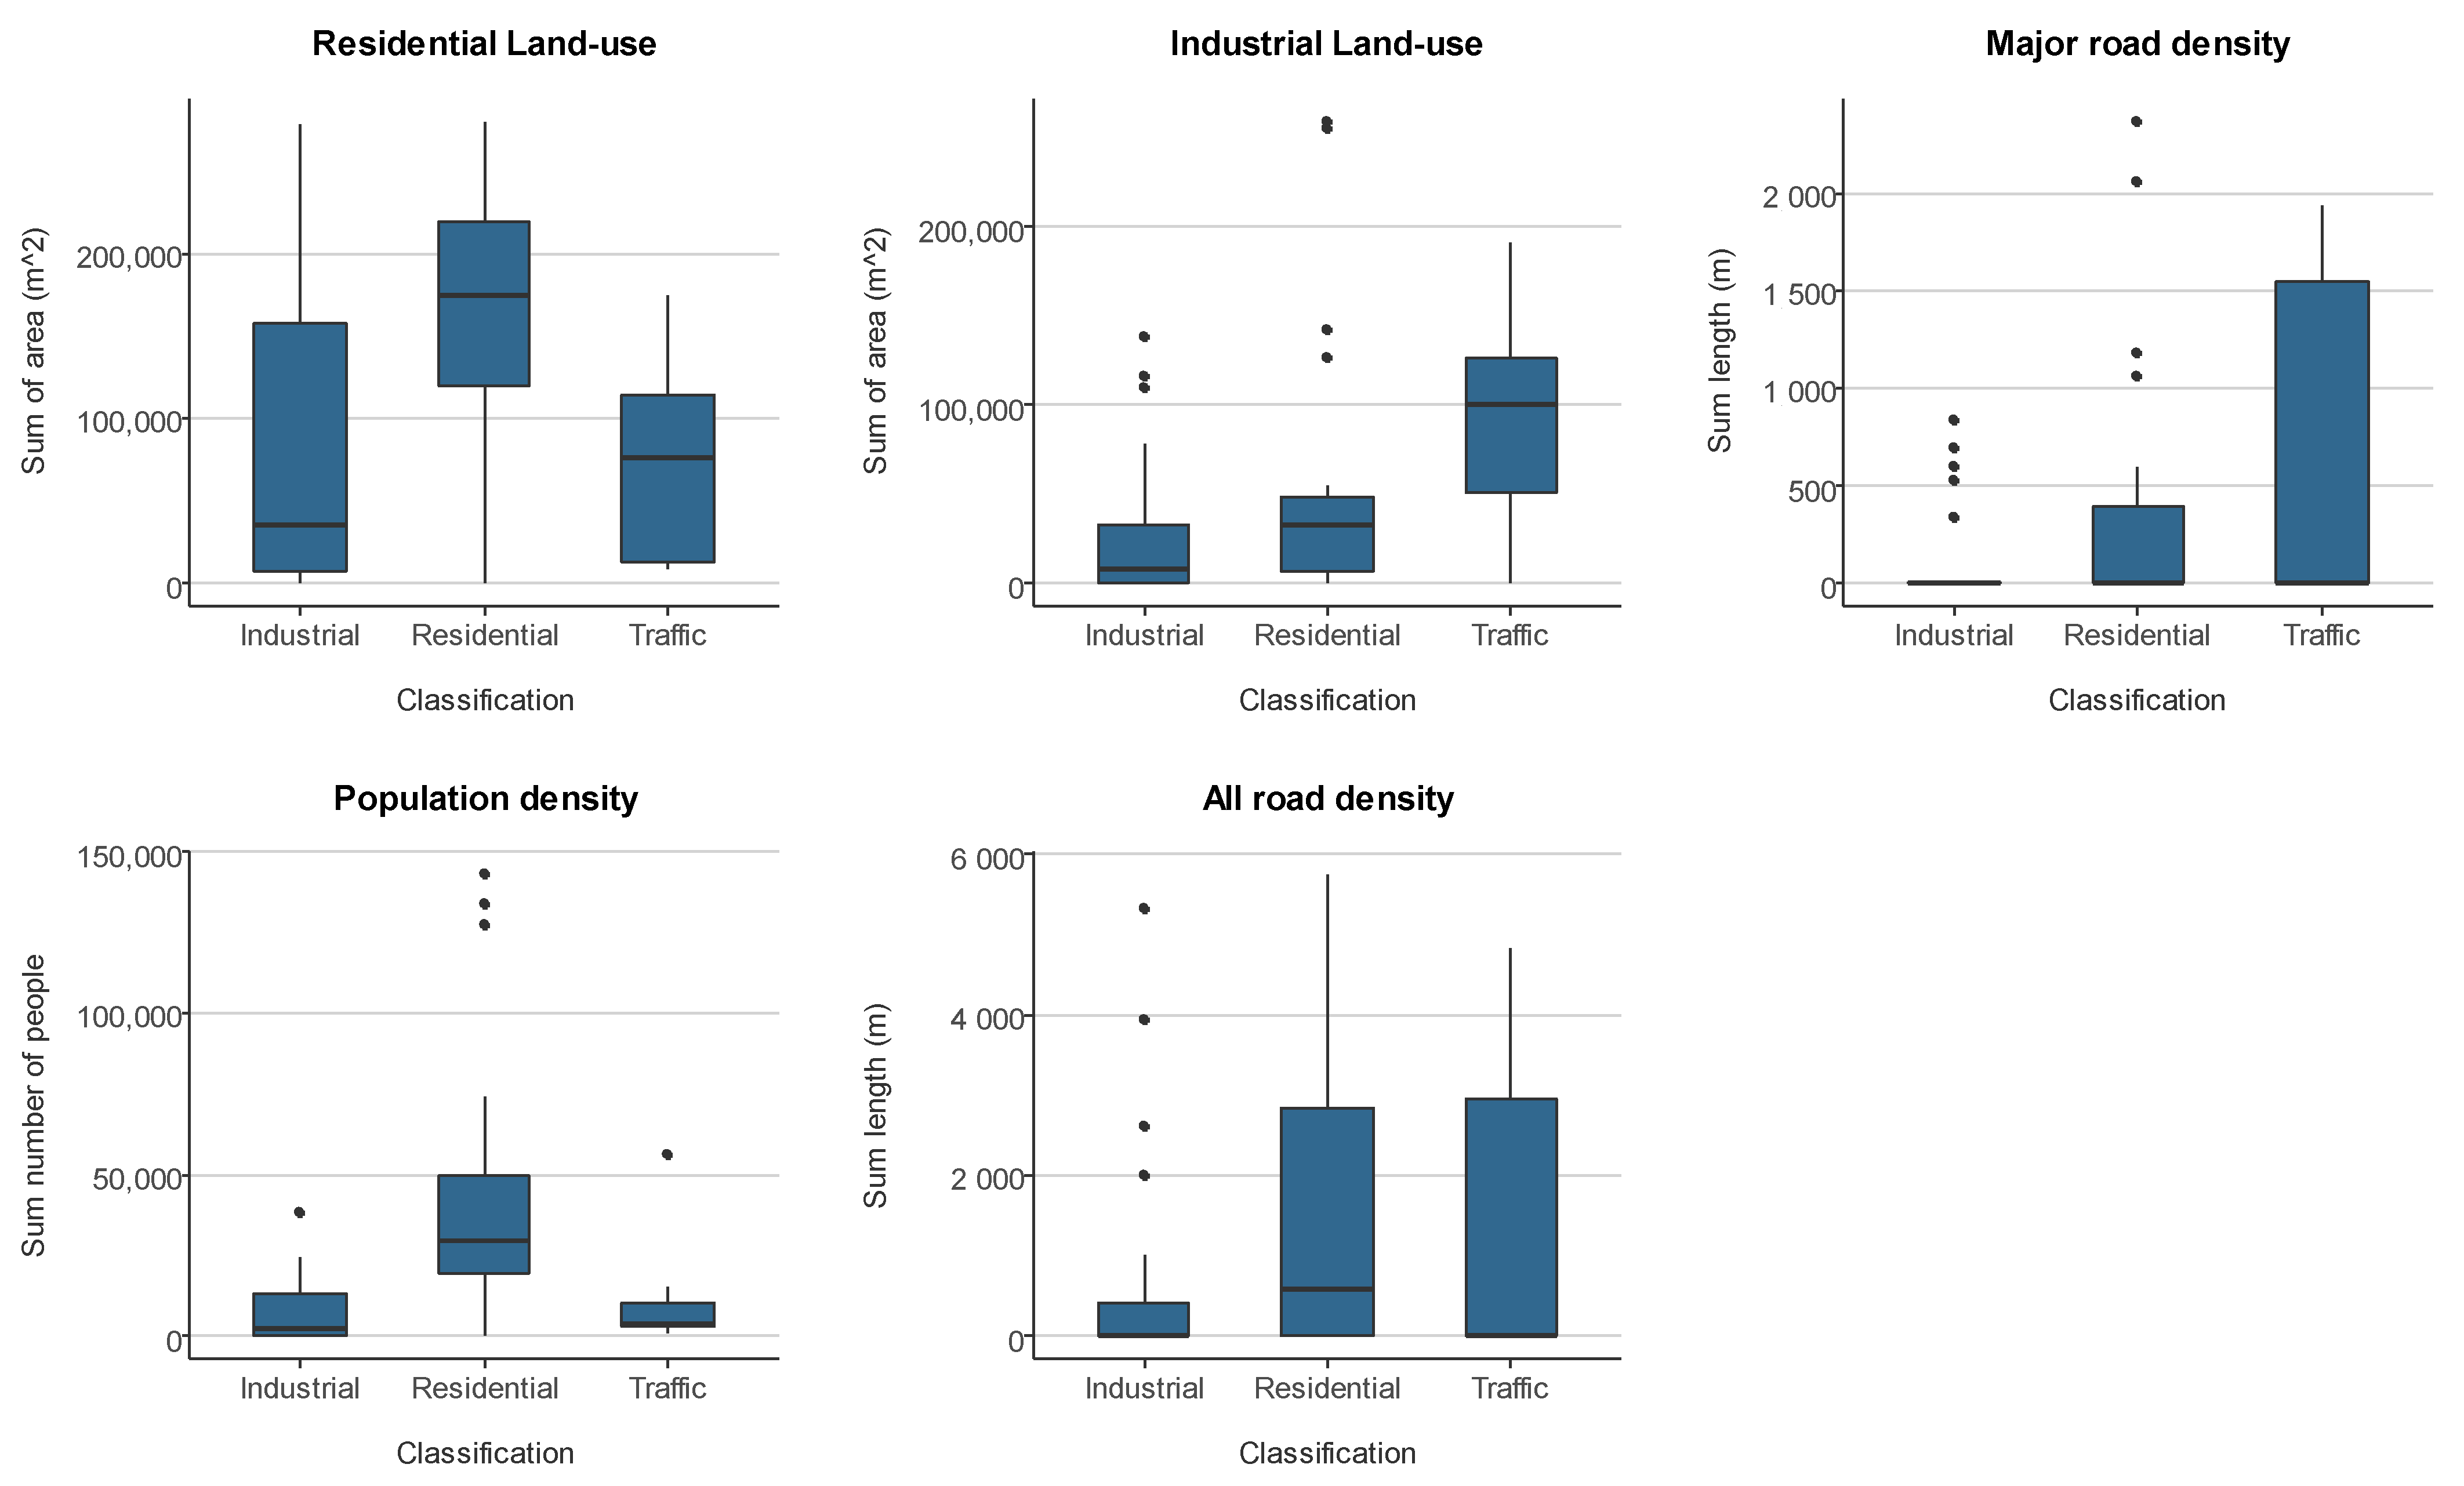
4.2. PM10 Level across Site Types

The trends in PM10 across the primary environment types in South Africa used for classifying the PM10 monitoring sites by the South Africa Weather Service are the Industrial, Residential and Traffic areas. The majority of the monitoring sites included in this analysis are industrial and residential sites. Table 2 shows that average PM10 levels were highest in residential sites compared to other categories of sites during the study period in all four provinces. This result is not unusual; similar results were reported in Gauteng areas of South Africa [13]. Our result also show that PM10 levels are generally higher at residential sites in the other three provinces. A possible explanation for the high levels of PM10 concentration levels at residential areas across the provinces is the high level of domestic burning in residential areas in South Africa. Previous studies have highlighted domestic emissions as the predominant source of particulate matter in South Africa [2,13]. It has also been argued that because the industrial emissions are released into a stable atmosphere in stacks above the generally shallow boundary layer height in South Africa could have affected the dispersion of the emissions to the ground level [2,13]. We also explored the variation in residential and industrial land use and road and population density around the monitoring sites. The residential radii have the highest level of variation from multiple influencing factors of PM10 emission. The high variability in the multiple sources of PM10 emission suggests that the high density of PM10 emissions around residential areas could explain the highest concentration of PM10 recorded in residential sites in our analysis. The high level of PM10 concentration and high variability of potential PM10 influencing factors around residential areas have implications on the population’s health outcomes [23].

4.3. Strengths and Limitations

There are some limitations in this study worth nothing. First, the pattern of missingness of PM10 exposure data during the study period poses a challenge to understanding the time-series trend in PM10 exposure data across the sites. The results presented are for four out of nine provinces in South Africa. Thus, these results cannot be extrapolated beyond the provinces that contributed data to our analysis. In addition, the representativeness of the site types is also a limitation of this study; the majority of the sites included in this study are industrial and residential sites. To address the challenge of missing daily PM10 data, this study combined observed and imputed PM10 exposure data from 44 monitoring sites across four provinces in South Africa to investigate the trends in PM10 concentrations. Despite the limitations, our results provide some insights on trends of PM10 concentrations in the four provinces during the study period.

5. Conclusions

It has been over a decade since the promulgation of South Africa’s National Environmental Management Air Quality Act in 2004. There have been concerns over the progress made so far [11]. We found that PM10 levels are higher than the WHO limits standard across the four provinces. The provincial differences in PM10 concentration show that PM10 levels are higher around air pollution priority areas, while the temporal variability of PM10 suggest that emissions during the winter months contribute markedly to the high level of PM10 recorded during the winter seasons.
An interesting result for future epidemiological studies in South Africa is the high level of PM10 and high variability of potential influencing factors of PM10 emission around where people live and work. Taken together, these results have implications for addressing the trends of PM10 pollution in South Africa.

Supplementary Materials

The following are available online at https://www.mdpi.com/article/10.3390/ijerph182413348/s1, Table S1: The pattern of PM10 data availability across the sites for years 2010–2017.

Author Contributions

Conceptualization, O.O.A., K.d.H. and M.R.; methodology, O.O.A. and K.d.H.; formal analysis, O.O.A.; data curation, O.O.A. and K.d.H. writing—original draft preparation, O.O.A. and K.d.H.; writing—review and editing, O.O.A., K.d.H., M.R., M.A.D. and T.C.A.-O.; supervision, K.d.H., M.R. and M.A.D.; funding acquisition, M.R., M.A.D. and K.d.H. All authors have read and agreed to the published version of the manuscript.

Funding

This study is part of the Joint South Africa and Swiss Chair in Global Environmental Health (SARChI), funded by the South African National Research Foundation (grant number 94883) and the Swiss State Secretariat for Education, Research and Innovation. O.O.A. is a recipient of a Swiss Government Excellence Scholarship.

Institutional Review Board Statement

Not applicable.

Informed Consent Statement

Not applicable.

Acknowledgments

We would like to thank the staff of the different monitoring stations and the staff at South Weather Services who provided data for this study.

Conflicts of Interest

The authors declare no conflict of interest.

References

  1. Health Effects Institute. The State of Global Air; Health Effects Institute: Boston, MA, USA, 2020. [Google Scholar]
  2. Pretorius, I.; Piketh, S.; Burger, R.; Neomagus, H. A perspective on South African coal fired power station emissions. J. Energy S. Afr. 2015, 26, 27–40. [Google Scholar] [CrossRef]
  3. Altieri, K.E.; Keen, S.L. Public health benefits of reducing exposure to ambient fine particulate matter in South Africa. Sci. Total. Environ. 2019, 684, 610–620. [Google Scholar] [CrossRef] [PubMed]
  4. GBD 2019 Risk Factors Collaborators. Global burden of 87 risk factors in 204 countries and territories, 1990–2019: A systematic analysis for the Global Burden of Disease Study 2019. Lancet 2019, 396, 1223–1249. [Google Scholar]
  5. Khumalo, T.N. 2017 State of Air Report and National Air Quality Indicator; Department of Environmental Affairs: Pretoria, South Africa, 2017. [Google Scholar]
  6. Department of Environmental Affairs. 2nd South Africa Environment Outlook; Department of Environmental Affairs: Pretoria, South Africa, 2016. [Google Scholar]
  7. World Health Organization. WHO Global Air Quality Guidelines: Particulate Matter (PM2.5 and PM10), Ozone, Nitrogen Dioxide, Sulfur Dioxide and Carbon Monoxide; World Health Organization: Geneva, Switzerland, 2021. [Google Scholar]
  8. Mkoma, S.L.; Mjemah, I.C. Influence of meteorology on ambient air quality in Morogoro, Tanzania. Int. J. Environ. Sci. 2011, 1, 1107. [Google Scholar]
  9. Czernecki, B.; Półrolniczak, M.; Kolendowicz, L.; Marosz, M.; Kendzierski, S.; Pilguj, N. Influence of the atmospheric conditions on PM10 concentrations in Poznań, Poland. J. Atmos. Chem. 2017, 74, 115–139. [Google Scholar] [CrossRef] [Green Version]
  10. Feig, G.; Garland, R.M.; Naidoo, S.; Maluleke, A.; Van Der Merwe, M. Assessment of changes in concentrations of selected criteria pollutants in the Vaal and Highveld Priority Areas. Clean Air J. 2019, 29. [Google Scholar] [CrossRef]
  11. Tshehla, C.; Wright, C.Y. 15 Years after the National Environmental Management Air Quality Act: Is legislation failing to reduce air pollution in South Africa? S. Afr. J. Sci. 2019, 115, 1–4. [Google Scholar] [CrossRef]
  12. Feig, G.; Naidoo, S.; Ncgukana, N. Assessment of ambient air pollution in the Waterberg Priority Area 2012-2015. Clean Air J. 2016, 26, 21–28. [Google Scholar] [CrossRef]
  13. Hersey, S.P.; Garland, R.M.; Crosbie, E.; Shingler, T.; Sorooshian, A.; Piketh, S.; Burger, R. An overview of regional and local characteristics of aerosols in South Africa using satellite, ground, and modeling data. Atmos. Chem. Phys. 2015, 15, 4259–4278. [Google Scholar] [CrossRef] [PubMed] [Green Version]
  14. Onyango, S.; Parks, B.; Anguma, S.; Meng, Q. Spatio-Temporal Variation in the Concentration of Inhalable Particulate Matter (PM10) in Uganda. Int. J. Environ. Res. Public Health 2019, 16, 1752. [Google Scholar] [CrossRef] [PubMed] [Green Version]
  15. Lina, N.D.; Engelbrecht, J.C.; Wright, C.Y.; Oosthuizen, M.A.; Thabethe, N.D.L. Human health risks posed by exposure to PM10 for four life stages in a low socio-economic community in South Africa. Pan Afr. Med. J. 2014, 18, 206. [Google Scholar] [CrossRef] [PubMed]
  16. Olaniyan, T.; Dalvie, M.A.; Röösli, M.; Naidoo, R.N.; Künzli, N.; de Hoogh, K.; Berman, D.; Parker, B.; Leaner, J.; Jeebhay, M.F. Short term seasonal effects of airborne fungal spores on lung function in a panel study of schoolchildren residing in informal settlements of the Western Cape of South Africa. Environ. Pollut. 2020, 260, 114023. [Google Scholar] [CrossRef] [PubMed]
  17. Arowosegbe, O.; Röösli, M.; Künzli, N.; Saucy, A.; Adebayo-Ojo, T.; Jeebhay, M.; Dalvie, M.; de Hoogh, K. Comparing Methods to Impute Missing Daily Ground-Level PM10 Concentrations between 2010–2017 in South Africa. Int. J. Environ. Res. Public Health 2021, 18, 3374. [Google Scholar] [CrossRef] [PubMed]
  18. Department of Environmental Affairs. South Durban Basin Multi-Point Plan Case Study Report. In Air Quality Act Implementation: Air Quality Management Planning; Department of Environmental Affairs: Pretoria, South Africa, 2007. [Google Scholar]
  19. Department of Environmental Affairs. Status of Air Quality in South Africa & Roadmap for Asbestos Waste Disposal: Department of Environmental Affairs Briefing; Department of Environmental Affairs: Pretoria, South Africa, 2019. [Google Scholar]
  20. Friedl, A.; Holm, D.; John, J.; Kornelius, G.; Pauw, C.J.; Oosthuizen, R.; van Niekerk, A.S. Air pollution in dense, low-income settlements in South Africa. In Proceedings of the National Association for Clean Air (NACA), Mpumalanga, South Africa, 1–3 October 2008. [Google Scholar]
  21. Scorgie, Y.; Burger, L.; Annegarn, H. Socio-economic Impact of Air Pollution Reduction Measures–Task 2: Establishment of Source Inventories, and Task 3: Identification and Prioritisation of Technology Options. In Report Compiled on Behalf of NEDLAC; National Economic Development and Labour Council: Pretoria, South Africa, 2003; Volume 25. [Google Scholar]
  22. Department of Environmental Affairs. Greenhouse Emissions National Inventory Report 2017; Department of Environmental Affairs: Pretoria, South Africa, 2017. [Google Scholar]
  23. Pope, C., 3rd. Epidemiology of fine particulate air pollution and human health: Biologic mechanisms and who’s at risk? Environ. Health Perspect. 2000, 108, 713–723. [Google Scholar] [CrossRef] [PubMed]
Figure 1. The spatial distribution of particulate matter (PM10) monitoring stations included in this paper across the four provinces of South Africa operating at some point during 2010–2017.
Ijerph 18 13348 g001
Figure 2. Distribution of indicators of PM10 emissions; land use (sum of area, m2), road density (sum length, m) and population (sum number of people) within a 300 m buffer across the three site classifications.
Ijerph 18 13348 g002
Figure 3. Variations in mean PM10 µg/m3 concentration across the provinces and months of the year. Error bars represent one standard deviation of the mean.
Ijerph 18 13348 g003
Figure 4. Weekdays variation in average daily PM10 µg/m3 concentration across the provinces.
Ijerph 18 13348 g004
Table 1. Levels and changes in annual PM10 µg/m3 concentrations across sites for the years 2010–2017. The first entry per site shows the annual PM10 concentration in µg/m³. Subsequent entries depict the percentage changes compared to the previous entry. The last column shows the annual changes in µg/m³ per year assuming a linear trend between the first and last available measurement per site.
ProvinceSite20102011201220132014201520162017Annual Change in PM10
Percentage increase/decrease
GautengBodibeng 57.64+2.54 +1.46
Booysen 57.88 +7.42 +4.30
Ekandustria 30.40+70.51 +21.4
Elandsfontein 29.45−1.64−0.48
Leandra 22.14−28.07 −6.22
Orange Farm57.25 −5.42−3.10
Randwater 47.19−4.40−0.67+1.15−27.53−2.85
Rosslyn 20.08−0.75−0.71 −0.15
MpumalangaCamden 53.95 −20.50 −3.41−6.07
Club 29.18+14.16+26.17 −6.38−21.11+0.02
Embalenhle 37.08 +31.35 −4.38+2.62
Ermelo40.50+0.01+15.93−2.11−37.80+52.56−10.68 −0.59
Grootvlei 33.29 +2.36 +0.79
Hendrina38.23−6.02+11.23 −4.80−29.07 −1.89
Komati 64.56+0.15 −7.33+16.62−15.79+29.65−0.06
Middleburg39.80−20.34+3.71−19.66−41.27+50.82−40.36 −3.84
Phola 74.89+1.90 −4.89−6.57−2.86
Secunda61.95+1.09−68.07+122.87 −8.73
Verykkop 24.39 −2.97−21.07−1.49
Witbank44.47 −1.12−38.39+119.33−8.46 +1.58
Western CapeBeliville 21.88+10.84 +7.03+0.05+11.88+1.65
Foreshore 21.30+3.40−7.65 +15.22−6.39+15.28+1.21
George21.95 −7.65 −1.68
Goodwood 28.01−8.44 +1.21+12.64+6.94 +0.84
Stellenbosch 16.72−0.09 −0.02
Tableview 19.76−8.11−1.19 −0.91
Wallacedene 16.91 +16.30+31.45+12.38+4.05
KwaZulu-NatalBrackenham 26.41+13.66 +0.33−6.90+10.64+0.45
CBD 23.01+13.91+0.33 +5.00−16.35+6.32+0.24
Esikhaweni 27.22−20.64−5.62
Gangles34.61+12.97 +7.07+3.59 +2.88
Ferndale16.14−19.44−9.17 −2.16
Legend
1st annual PM10 average
Percentage decrease in annual PM10
Percentage increase in annual PM10
No Data
Table 2. The distribution of daily PM10 concentration in µg/m3 by province and site type.
Site Classifications
IndustrialResidentialTraffic
ProvinceNMedian25–75% percentileMin–MaxNMedian25–75% percentileMin-MaxNMedian25–75% percentileMin–Max
Gauteng51142917.5–43.97.03–139402058.541.2–14420.9–34473153.938.8–74.623.5–152
Western Cape475022.316.5–29.79.68–82.5219325.418.4–34.810.9–93.4292221.116.4–27.710.7–74.0
Mpumalanga1826437.122.3–59.28.78–228292137.721.9–61.49.1–216NANANANA
KwaZulu-NatalNANANANA51142616.5–37.27.27–13023.623.618.3–32.213.1–79.9
NA: Not available.
Table 3. The percentage of PM10 (µg/m3) concentration exceeding daily standards by province for the years 2010–2017.
Province WHO StandardNAAQS Standard
Number of Days Exceeding Daily Limit% of Days Exceeding Daily Limit aNumber of Days Exceeding Daily Limit% of Days Exceeding Daily Limit a
Gauteng3820/986538.71605/986516.3
Mpumalanga7139/2118533.73104/2118514.7
KwaZulu-Natal549/76717.2108/76711.4
Western Cape272/98652.88/98650.1
a The percentage of days PM10 concentration daily limits were exceeded based on the number of days with PM10 data for 2010–2017 divided by the total number of days with valid PM10 data. WHO standard; World Health Organization 2021 daily standard of 45 µg/m3. NAAQS; South Africa’s National Air Quality 2006 daily standard of 75 µg/m3.
Publisher’s Note: MDPI stays neutral with regard to jurisdictional claims in published maps and institutional affiliations.

