Predicting Malaria Transmission Dynamics in Dangassa, Mali: A Novel Approach Using Functional Generalized Additive Models

 ,
,  , and
, and
Abstract
:1. Introduction
2. Materials and Methods
2.1. Materials
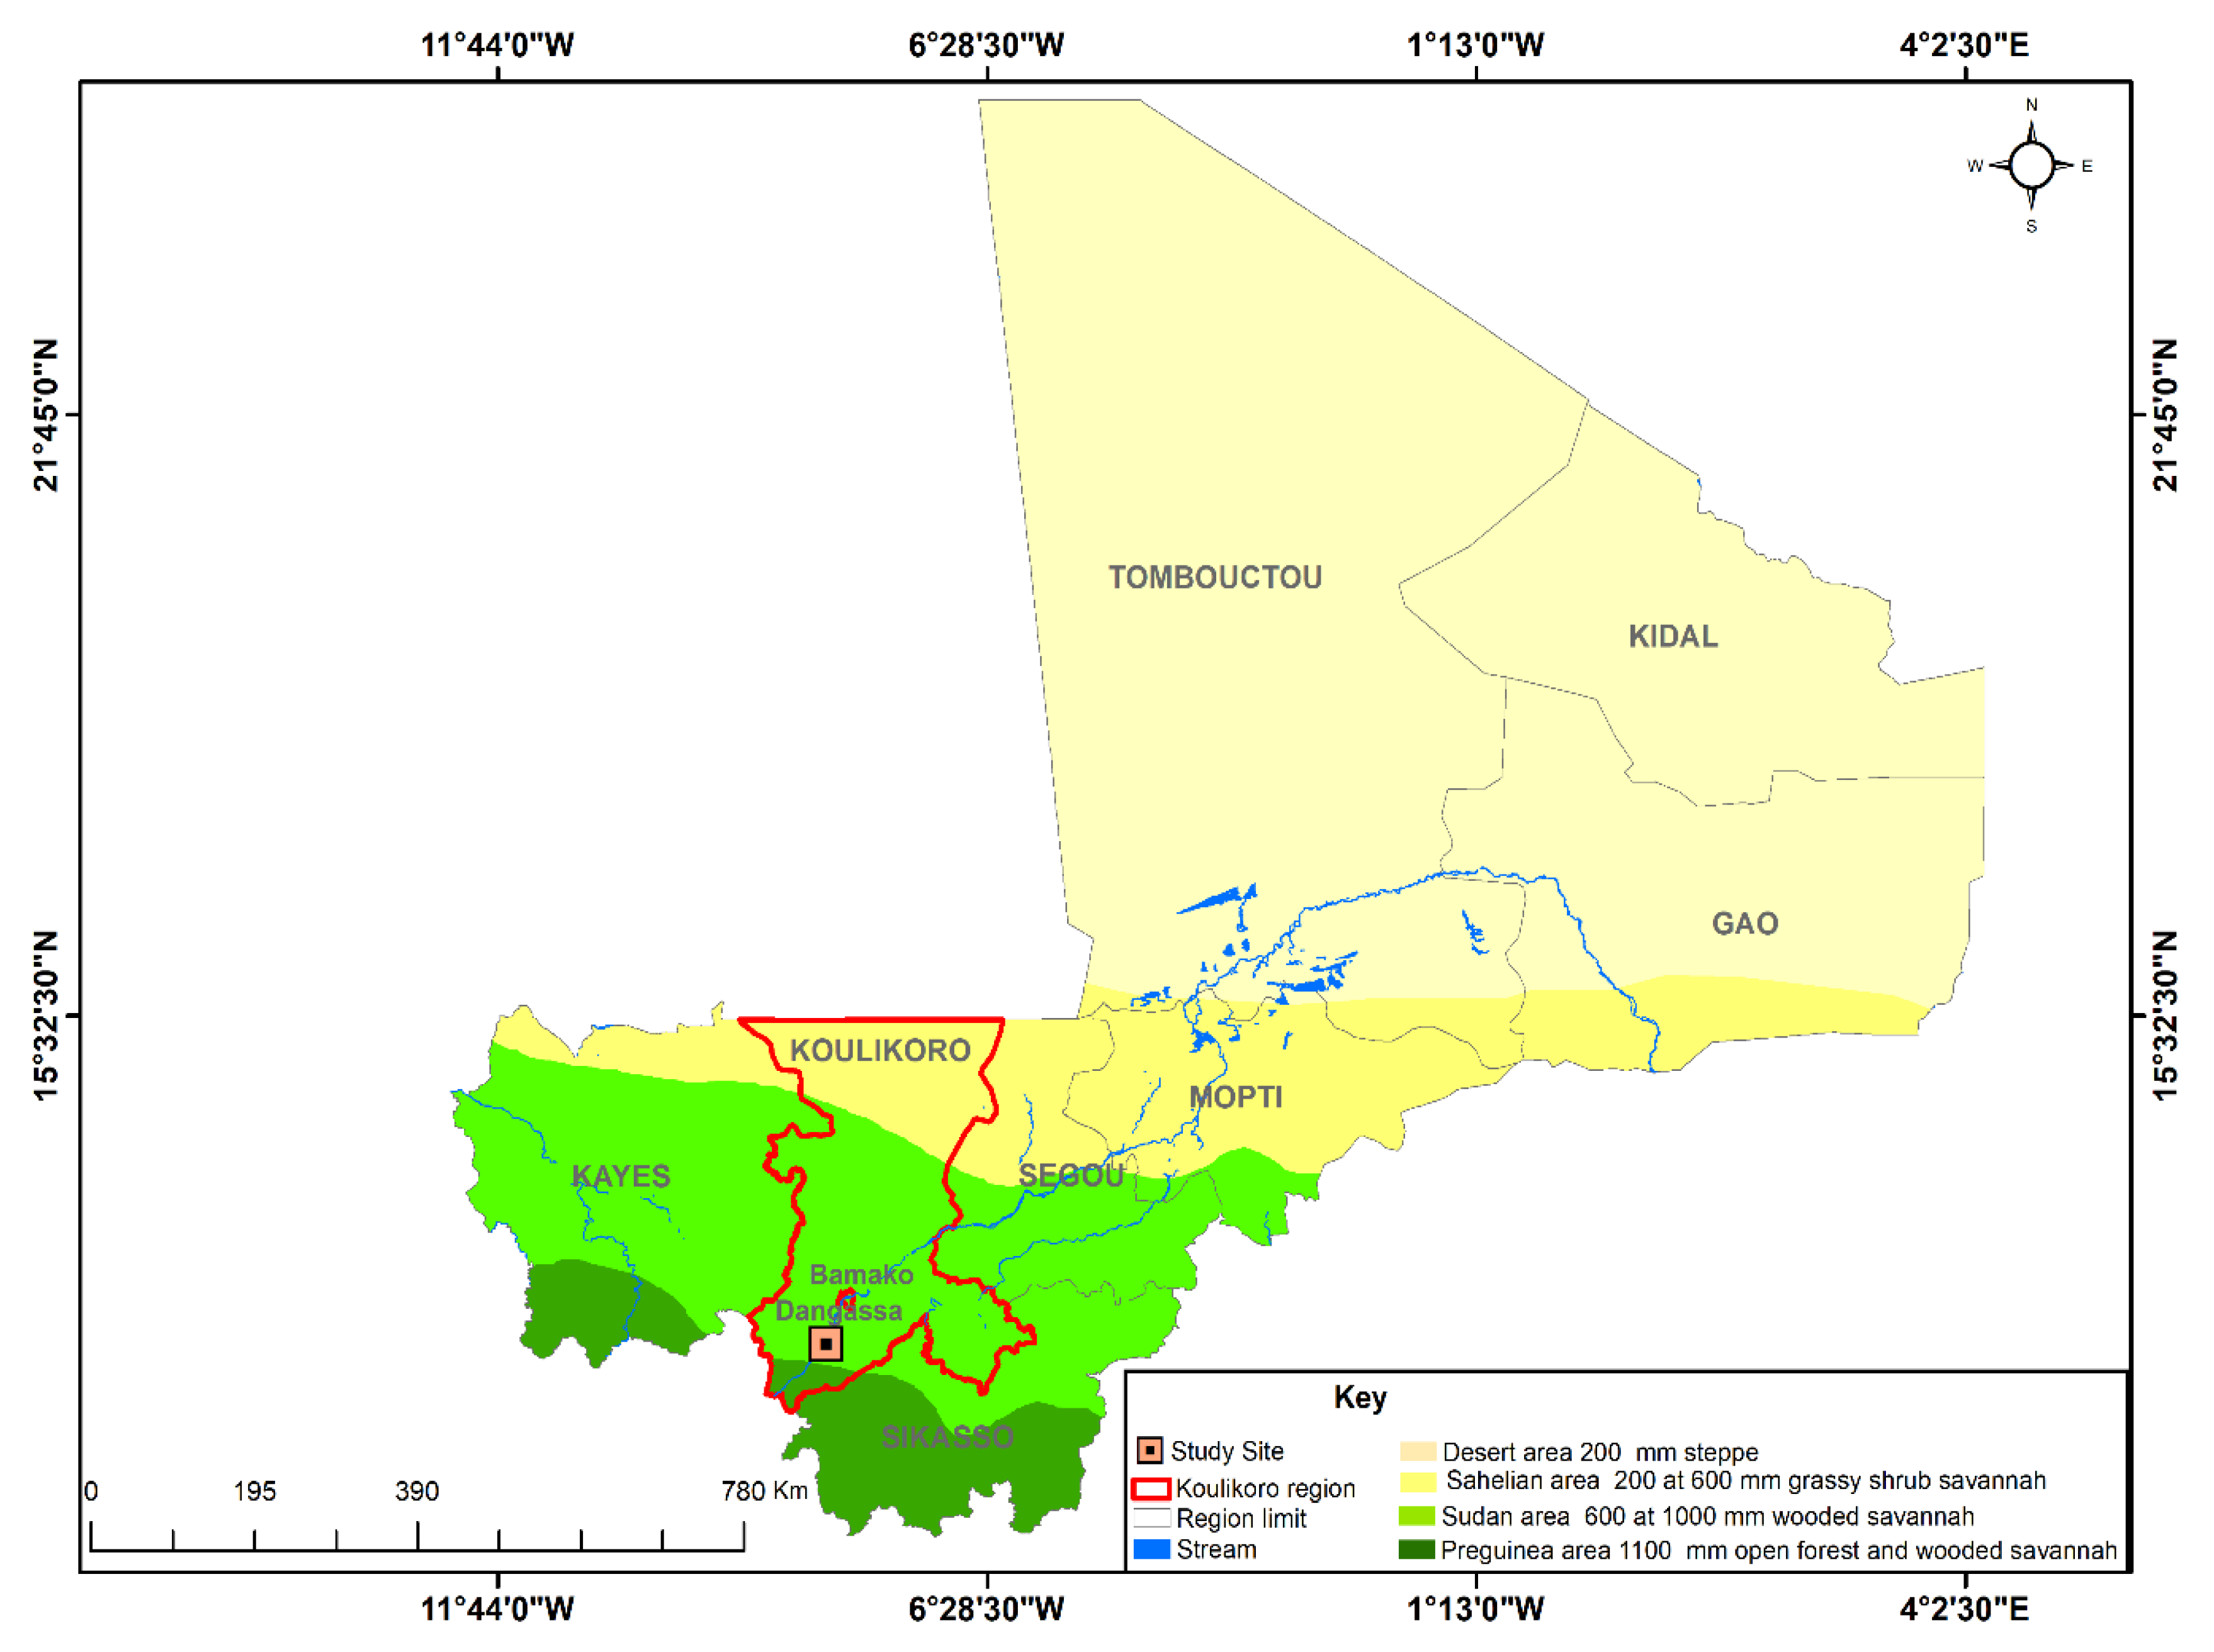
2.1.1. Study Areas
2.1.2. Data Source
Study Population and Data Collection
- (1)
- Malaria Data
- (2)
- Meteorological and Environmental Data
2.2. Statistical Methods
- FGLM:
- FGSAM: with being smooth functions of , the score of the kth principal component of the ith covariate.
- FGKAM: with being a general function computed from the functional covariate using a Gaussian kernel approximation.
3. Result
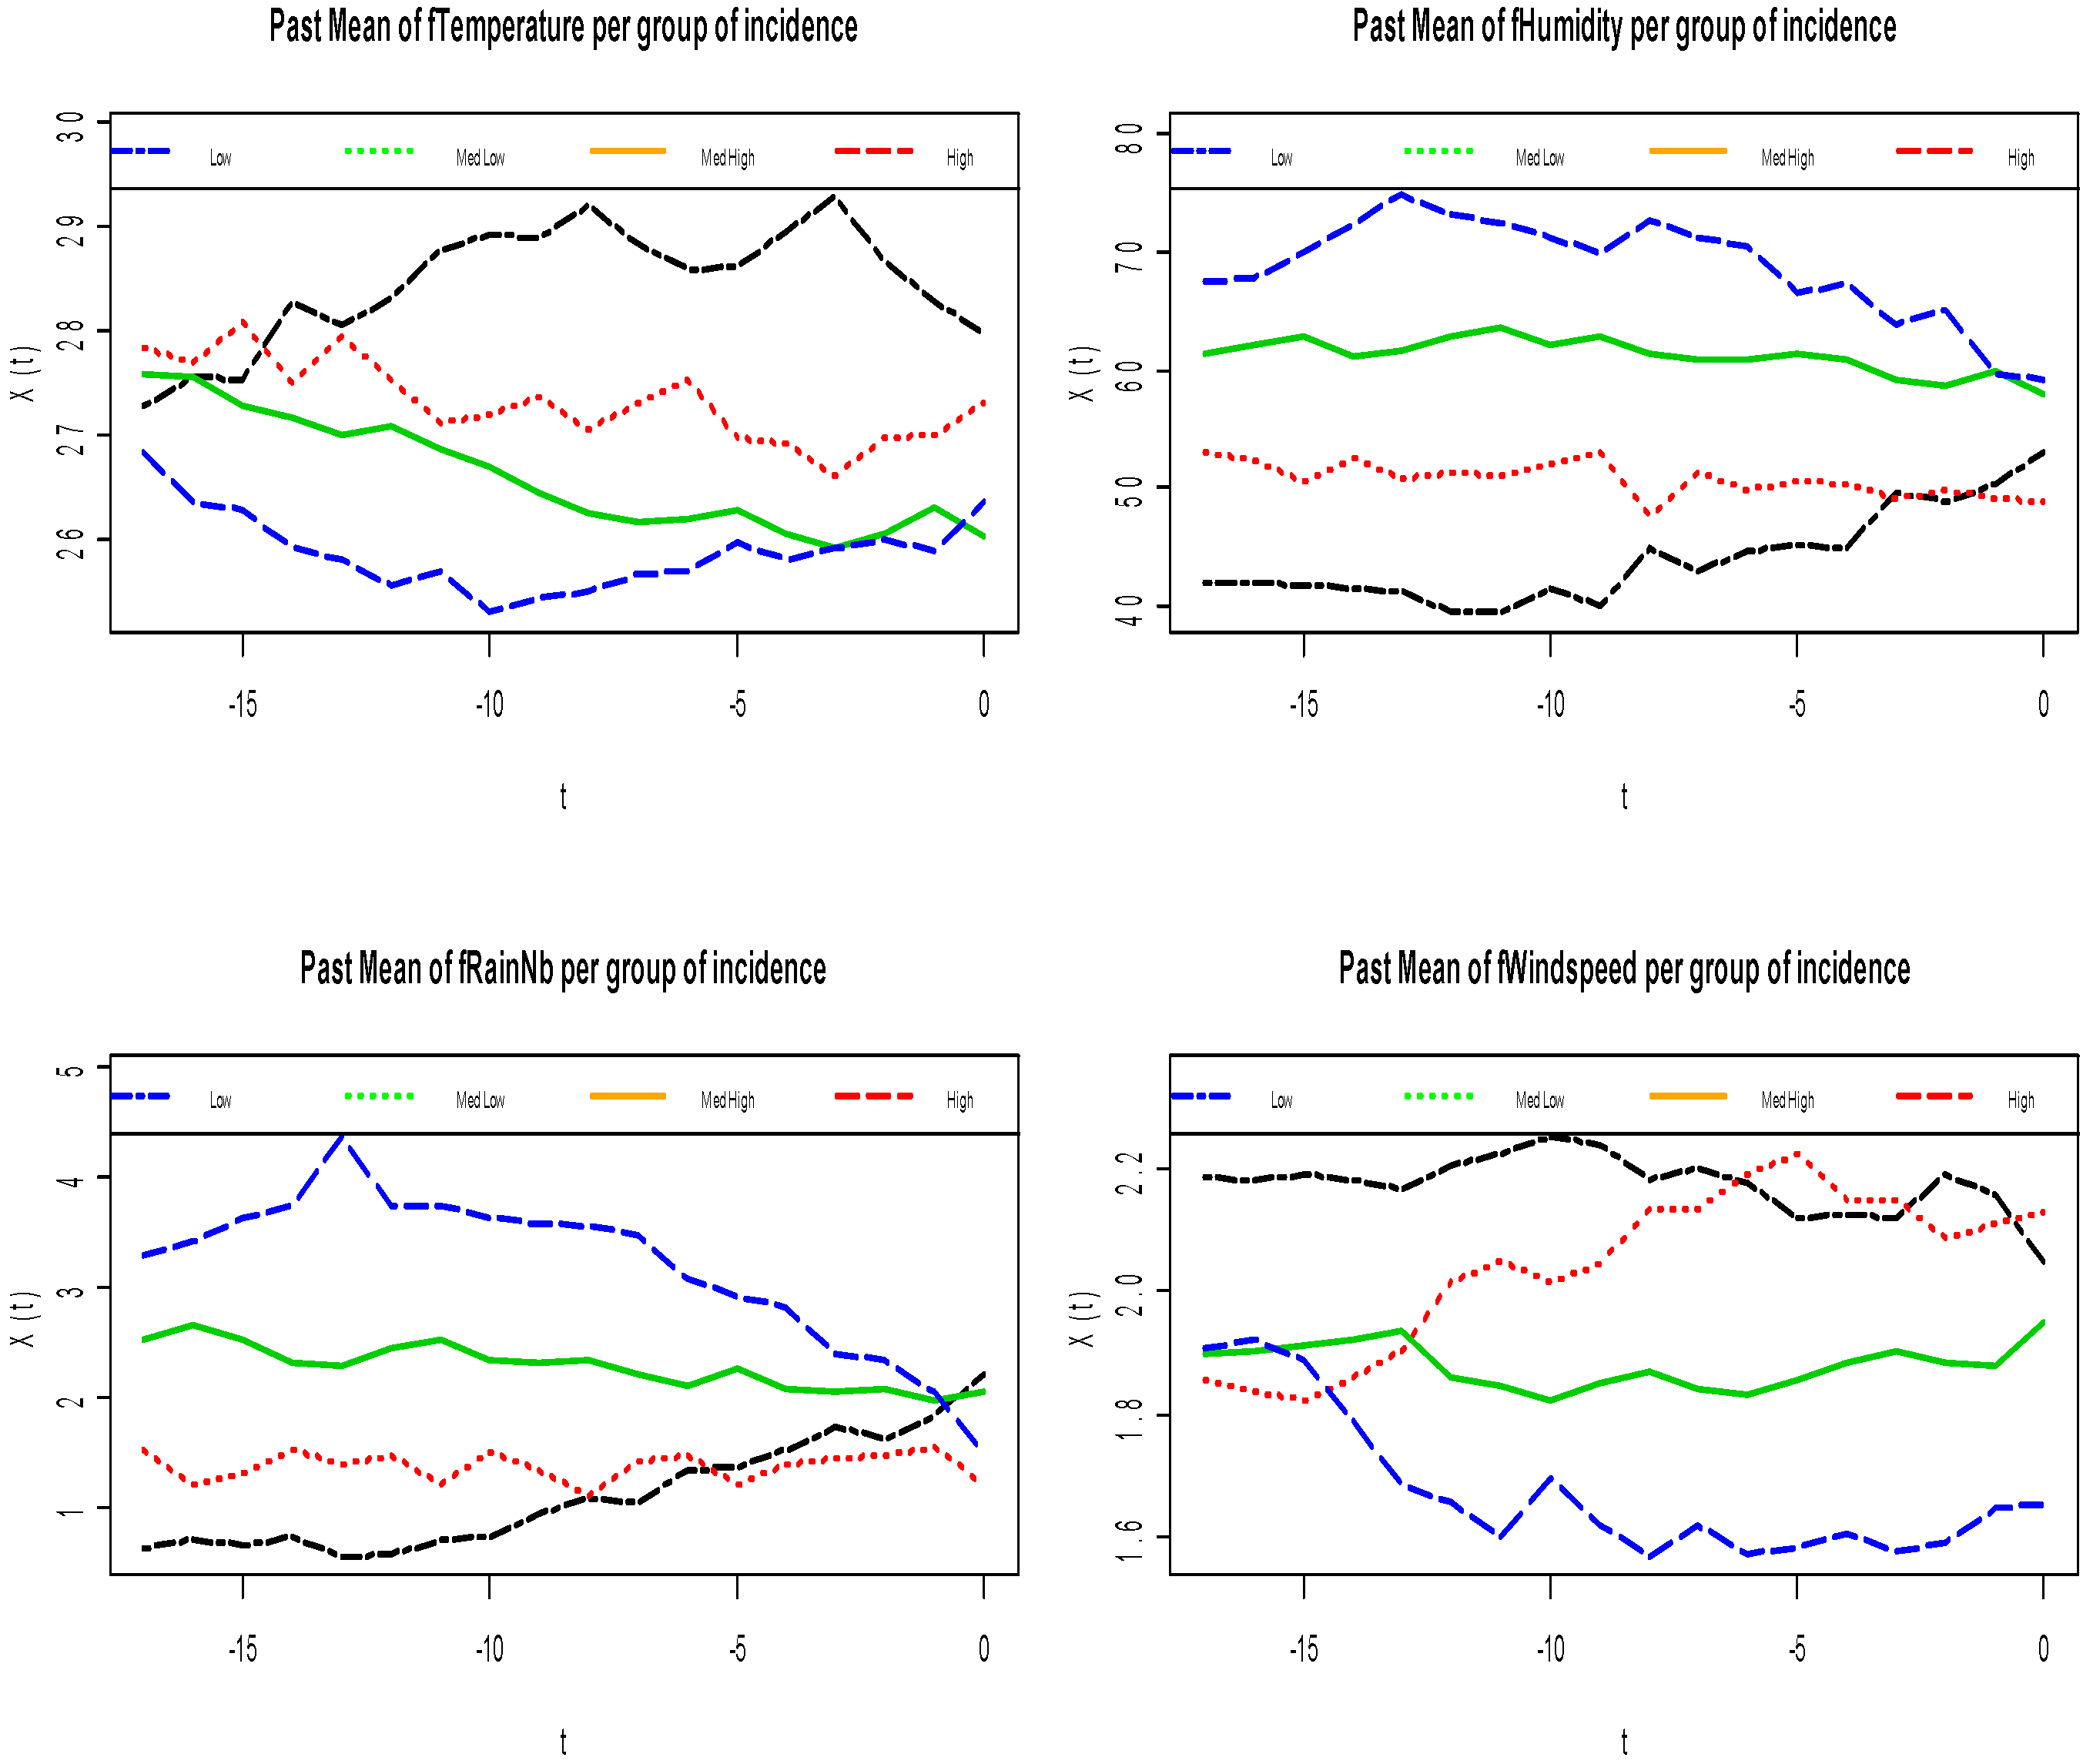
3.1. Descriptive Analysis of the Functional Data
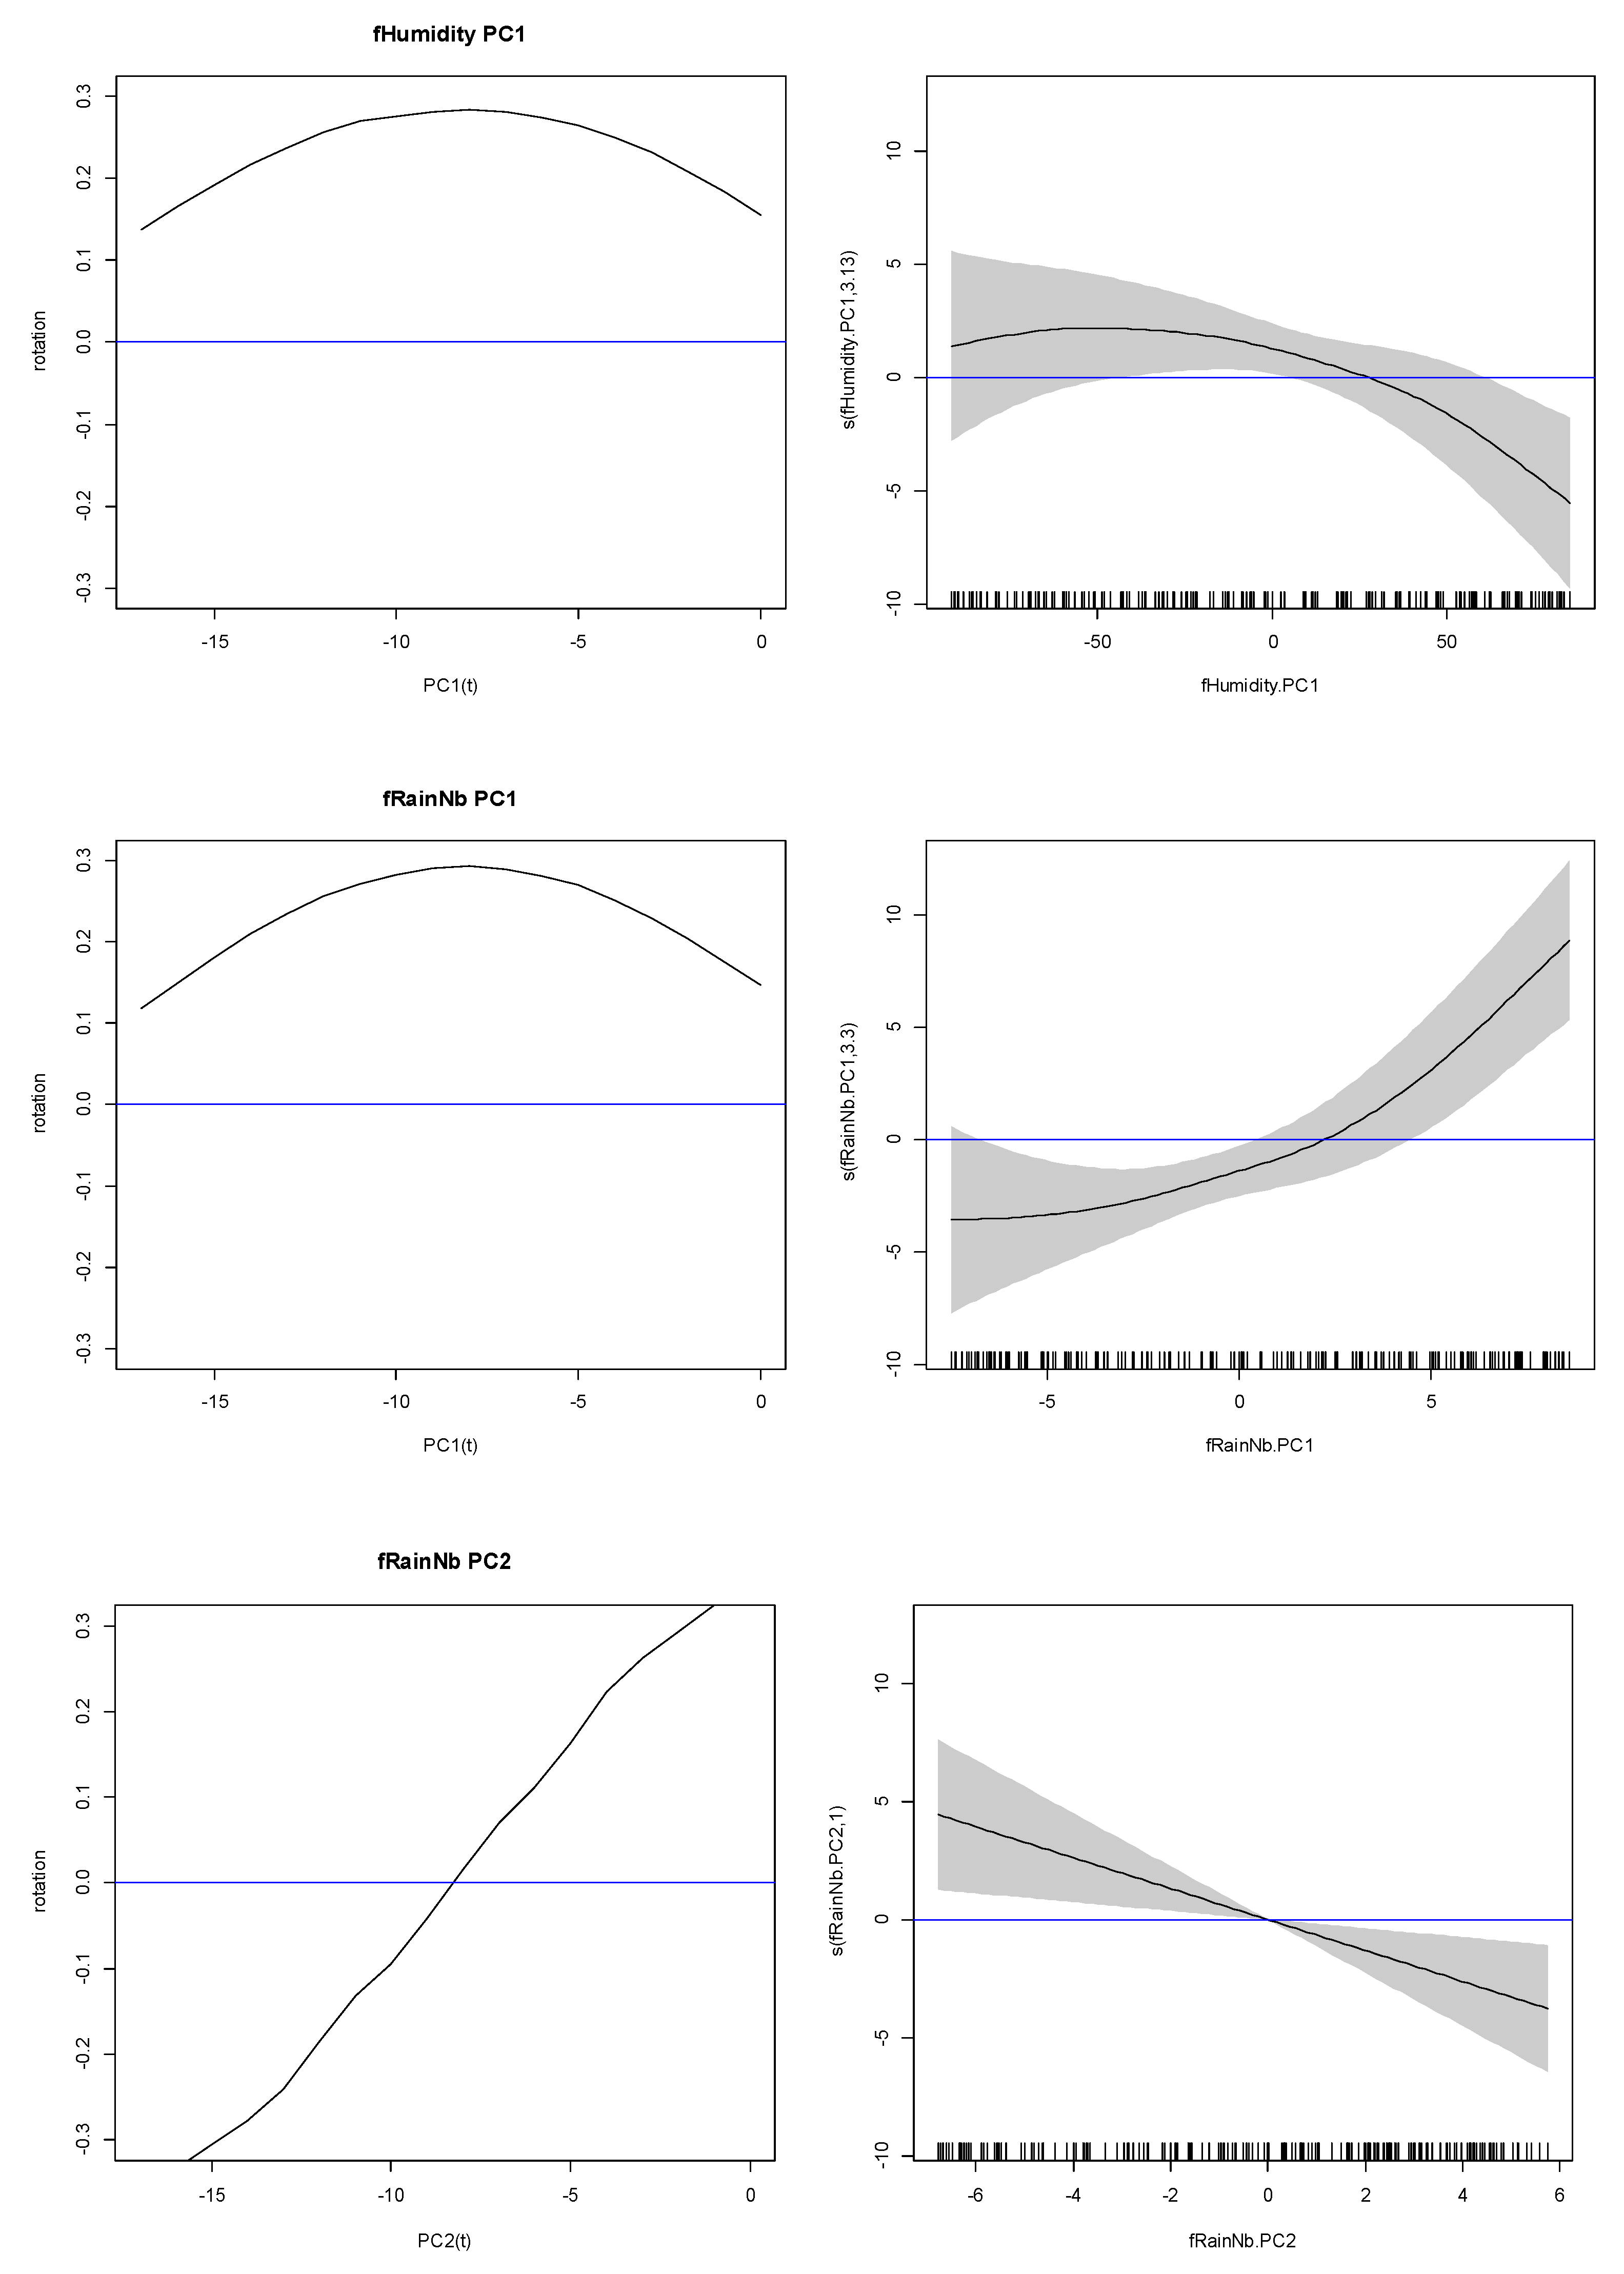
3.2. Constructing a Functional Regression Model (FGSAM) for Malaria Incidence Rate
3.3. Comparing Different Functional Models for Dangassa Data
4. Discussion
5. Conclusions
Author Contributions
Funding
Acknowledgments
Conflicts of Interest
Abbreviations
| ACTs | Artemisinin-based Combination Therapies |
| EOSDIS | Earth Observing System Data and Information System |
| IPTp | Intermittent Preventive Treatment during pregnancy |
| LLINS | Long Lasting Insecticidal Nets |
| NASA | National Aeronautics and Space Administration |
| FDA | Functional Data Analysis |
| FGLM | Functional Generalized Linear Model |
| FGSAM | Functional Generalized Spectral Additive Models |
| FGKAM | Functional Generalized Kernel Additive Models |
| MSPE | Mean Squared Prediction Error |
| NDVI | Normalized Difference Vegetation Index |
| PCA | Principal Components Analysis |
| PCD | Passive Detection Case |
| RDT | Rapid Diagnostic Test |
| SMC | Seasonal Malaria Chemoprevention |
References
- Institut National de la Statistique (INSTAT). Cellule de planification et de statistique secteur santé, développement social et promotion de la famille (CPS/SS-DS-PF). In Canevas de Synthèse Des Rapports D’Activités 2018 et de Programmation 2020 Pour Les Journées D’Evaluation Des Structures Centrales; Institut National de la Statistique: Bamako, Mali, 2018. [Google Scholar]
- WHO World Malaria Report 2018. Available online: http://www.who.int/malaria/publications/world-malaria-report-2018/en/ (accessed on 20 January 2019).
- Ateba, F.F.; Sagara, I.; Sogoba, N.; Touré, M.; Konaté, D.; Diawara, S.I.; Diakité, S.A.S.; Diarra, A.; Coulibaly, M.D.; Dolo, M.; et al. Spatio-temporal dynamic of malaria incidence: A comparison of two ecological zones in Mali. Int. J. Environ. Res. Public Health 2020, 17, 4698. [Google Scholar] [CrossRef] [PubMed]
- Roberts, D.; Matthews, G. Risk factors of malaria in children under the age of five years old in Uganda. Malar. J. 2016, 15, 1–11. [Google Scholar] [CrossRef] [PubMed] [Green Version]
- Santos-Vega, M.; Bouma, M.J.; Kohli, V.; Pascual, M. Population density, climate variables and poverty synergistically structure spatial risk in urban malaria in India. PLoS Negl. Trop. Dis. 2016, 10, e0005155. [Google Scholar] [CrossRef] [PubMed]
- Béguin, A.; Hales, S.; Rocklöv, J.; Åström, C.; Louis, V.R.; Sauerborn, R. The opposing effects of climate change and socio-economic development on the global distribution of malaria. Glob. Environ. Chang. 2011, 21, 1209–1214. [Google Scholar] [CrossRef]
- Midekisa, A.; Beyene, B.; Mihretie, A.; Bayabil, E.; Wimberly, M.C. Seasonal associations of climatic drivers and malaria in the highlands of Ethiopia. Parasit. Vectors 2015, 8, 1–11. [Google Scholar] [CrossRef] [Green Version]
- Gunda, R.; Chimbari, M.J.; Shamu, S.; Sartorius, B.; Mukaratirwa, S. Malaria incidence trends and their association with climatic variables in rural Gwanda, Zimbabwe, 2005–2015. Malar. J. 2017, 16, 1–13. [Google Scholar] [CrossRef] [Green Version]
- Killeen, G.F.; Marshall, J.M.; Kiware, S.S.; South, A.B.; Tusting, L.S.; Chaki, P.P.; Govella, N.J. Measuring, manipulating and exploiting behaviours of adult mosquitoes to optimise malaria vector control impact. BMJ Glob. Health 2017, 2, e000212. [Google Scholar] [CrossRef] [Green Version]
- Bi, Y.; Yu, W.; Hu, W.; Lin, H.; Guo, Y.; Zhou, X.N.; Tong, S. Impact of climate variability on plasmodium vivax and plasmodium falciparum malaria in Yunnan province, China. Parasites Vectors 2013, 6, 357. [Google Scholar] [CrossRef] [Green Version]
- Ototo, E.N.; Githeko, A.K.; Wanjala, C.L.; Scott, T.W. Surveillance of vector populations and malaria transmission during the 2009/10 El Niño event in the western Kenya highlands: Opportunities for early detection of malaria hyper-transmission. Parasites Vectors 2011, 4, 144. [Google Scholar] [CrossRef] [Green Version]
- Sadoine, M.L.; Smargiassi, A.; Ridde, V.; Tusting, L.S.; Zinszer, K. The associations between malaria, interventions, and the environment: A systematic review and meta-analysis. Malar. J. 2018, 17, 1–11. [Google Scholar] [CrossRef] [Green Version]
- Gaudart, J.; Touré, O.; Dessay, N.; Dicko, A.L.; Ranque, S.; Forest, L.; Demongeot, J.; Doumbo, O.K. Modelling malaria incidence with environmental dependency in a locality of Sudanese savannah area, Mali. Malar. J. 2009, 8, 61. [Google Scholar] [CrossRef]
- Parham, P.E.; Michael, E. Modeling the effects of weather and climate change on malaria transmission. Environ. Health Perspect. 2010, 118, 620–626. [Google Scholar] [CrossRef] [PubMed]
- Rossati, A.; Bargiacchi, O.; Kroumova, V.; Zaramella, M.; Caputo, A.; Garavelli, P.L. Climate, environment and transmission of malaria. Infez. Med. 2016, 24, 93–104. [Google Scholar]
- Ramsay, J.O.; Silverman, B.W. Functional data analysis. In International Encyclopedia of the Social & Behavioral Sciences, 2nd ed.; Elsevier: Amsterdam, The Netherlands, 2015. [Google Scholar]
- Horváth, L.; Kokoszka, P. Inference for Functional Data With Applications; Springer: Berlin/Heidelberg, Germany, 2012. [Google Scholar]
- Ferraty, F.; Vieu, P. Nonparametric Functional Data Analysis: Theory and Practice; Springer: Berlin/Heidelberg, Germany, 2006. [Google Scholar]
- Febrero-Bande, M.; González-Manteiga, W.; de la Fuente, M.O. Variable selection in functional additive regression models. Comput. Stat. 2019, 34, 469–487. [Google Scholar] [CrossRef] [Green Version]
- Székely, G.J.; Rizzo, M.L.; Bakirov, N.K. Measuring and testing dependence by correlation of distances. Ann. Stat. 2007, 35, 2769–2794. [Google Scholar] [CrossRef]
- Febrero-Bande, M.; Oviedo de la Fuente, M. Statistical computing in functional data analysis: The R package fda.usc. J. Stat. Softw. 2012, 51, 1–28. [Google Scholar] [CrossRef] [Green Version]
- Oviedo de la Fuente, M.; Febrero-Bande, M.; Muñoz, M.P.; Domínguez, À. Predicting seasonal influenza transmission using functional regression models with temporal dependence. PLoS ONE 2018, 13, e0194250. [Google Scholar] [CrossRef] [Green Version]
- Shaffer, J.G.; Doumbia, S.O.; Ndiaye, D.; Diarra, A.; Gomis, J.F.; Nwakanma, D.; Abubakar, I.; Ahmad, A.; Affara, M.; Lukowski, M.; et al. Development of a data collection and management system in West Africa: Challenges and sustainability. Infect. Dis. Poverty 2018, 7, 125. [Google Scholar] [CrossRef]
- Institut National de la Statistique (INSTAT); Cellule de Planifcation et de Statistique (CPS/SSDSPF); Institut National de la Statistique (INSTAT/MPATP); Center d’Estudes et d’Information Statistiques (INFO-STAT). Enquête Démographique et de Santé au Mali 2012–2013; CPS, INSTAT: Rockville, MA, USA, 2014. [Google Scholar]
- NASA Giovanni The Bridge Between Data and Science. Available online: https://giovanni.gsfc.nasa.gov/giovanni/ (accessed on 15 June 2018).
- Cardot, H.; Ferraty, F.; Sarda, P. Functional linear model. Stat. Probab. Lett. 1999, 45, 11–22. [Google Scholar] [CrossRef]
- Cardot, H.; Ferraty, F.; Sarda, P. Spline estimators for the functional linear model. In Statistica Sinica; Institute of Statistical Sciences, Academia Sinica: Taipei, Taiwan, 2003; Volume 13, pp. 571–592. [Google Scholar]
- Müller, H.-G.; Yao, F. Functional additive models. J. Am. Stat. Assoc. 2008, 103, 1534–1544. [Google Scholar] [CrossRef]
- Febrero-Bande, M.; González-Manteiga, W. Generalized additive models for functional data. Test 2013, 22, 278–292. [Google Scholar] [CrossRef]
- R Core Team. R: A Language and Environment for Statistical Computing; R Foundation for Statistical Computing: Vienna, Austria, 2019. [Google Scholar]
- ESRI Esri: GIS Mapping Software, Spatial Data Analytics & Location Intelligence. Available online: https://www.esri.com/en-us/home (accessed on 13 January 2019).
- Yadav, K.; Dhiman, S.; Rabha, B.; Saikia, P.K.; Veer, V. Socio-economic determinants for malaria transmission risk in an endemic primary health centre in Assam, India. Infect. Dis. Poverty 2014, 3, 19. [Google Scholar] [CrossRef] [PubMed] [Green Version]
- Awuah, R.B.; Asante, P.Y.; Sakyi, L.; Biney, A.A.E.; Kushitor, M.K.; Agyei, F.; De-Graft Aikins, A. Factors associated with treatment-seeking for malaria in urban poor communities in Accra, Ghana. Malar. J. 2018, 17, 1–8. [Google Scholar] [CrossRef]
- Bhatt, S.; Weiss, D.J.; Cameron, E.; Bisanzio, D.; Mappin, B.; Dalrymple, U.; Battle, K.; Moyes, C.L.; Henry, A.; Eckhoff, P.A.; et al. The effect of malaria control on Plasmodium falciparum in Africa between 2000 and 2015. Nature 2015, 526, 207–211. [Google Scholar] [CrossRef] [PubMed] [Green Version]
- Konaté, D.; Diawara, S.I.; Touré, M.; Diakité, S.A.S.; Guindo, A.; Traoré, K.; Diarra, A.; Keita, B.; Thiam, S.; Keita, M.; et al. Effect of routine seasonal malaria chemoprevention on malaria trends in children under 5 years in Dangassa, Mali. Malar. J. 2020, 19, 1–6. [Google Scholar] [CrossRef]
- Diakité, S.A.S.; Traoré, K.; Sanogo, I.; Clark, T.G.; Campino, S.; Sangaré, M.; Dabitao, D.; Dara, A.; Konaté, D.S.; Doucouré, F.; et al. A comprehensive analysis of drug resistance molecular markers and Plasmodium falciparum genetic diversity in two malaria endemic sites in Mali. Malar. J. 2019, 18, 361. [Google Scholar] [CrossRef] [PubMed] [Green Version]


| Functional Covariates | Incidence (n + 1) | Incidence (n + 2) |
|---|---|---|
| fIncidence (n − 17, …, n) | 0.256 | 0.220 |
| fWindspeed (n − 17, …, n) | 0.357 | 0.350 |
| fRainNb (n − 17, …, n) | 0.363 | 0.390 |
| fTemperature (n − 17, …, n) | 0.267 | 0.240 |
| fHumidity (n − 17, …, n) | 0.404 | 0.420 |
| Functional Covariates | fIncidence | fTemperature | fHumidity | fRainNb | fWindspeed |
|---|---|---|---|---|---|
| fIncidence | 1.000 | 0.457 | 0.556 | 0.604 | 0.585 |
| fTemperature | 0.457 | 1.000 | 0.519 | 0.430 | 0.387 |
| fHumidity | 0.556 | 0.519 | 1.000 | 0.887 | 0.705 |
| fRainNb | 0.604 | 0.430 | 0.887 | 1.000 | 0.691 |
| fWindspeed | 0.585 | 0.387 | 0.705 | 0.691 | 1.000 |
| Curves | Edf | Ref.df | F | p-Value |
|---|---|---|---|---|
| s(fHumidity.PC1) | 3.126 | 4.003 | 3.865 | 0.005 |
| s(fWindspeed.PC2) | 2.000 | 2.536 | 2.259 | 0.075 |
| s(fRainNb.PC1) | 3.304 | 4.199 | 9.457 | <0.001 |
| s(fRainNb.PC2) | 1.000 | 1.000 | 7.840 | 0.006 |
| s(fIncidence.PC1) | 8.544 | 8.910 | 4.551 | <0.001 |
| s(fIncidence.PC3) | 1.000 | 1.000 | 2.885 | 0.091 |
| Goodness-of-Fit Measures of the Functional Models | FGKAM | FGLM | FGSAM |
|---|---|---|---|
| Adjusted R-sq (%) | 65.70 | 57.90 | 67.30 |
| Dev. Explained (%) | 75.10 | 61.20 | 72.40 |
| MSPE | 7.52 | 7.50 | 11.38 |
| Pred. coverage (%) | 90.00 | 95.00 | 92.50 |
© 2020 by the authors. Licensee MDPI, Basel, Switzerland. This article is an open access article distributed under the terms and conditions of the Creative Commons Attribution (CC BY) license (http://creativecommons.org/licenses/by/4.0/).
Share and Cite
Ateba, F.F.; Febrero-Bande, M.; Sagara, I.; Sogoba, N.; Touré, M.; Sanogo, D.; Diarra, A.; Magdalene Ngitah, A.; Winch, P.J.; Shaffer, J.G.; et al. Predicting Malaria Transmission Dynamics in Dangassa, Mali: A Novel Approach Using Functional Generalized Additive Models. Int. J. Environ. Res. Public Health 2020, 17, 6339. https://doi.org/10.3390/ijerph17176339
Ateba FF, Febrero-Bande M, Sagara I, Sogoba N, Touré M, Sanogo D, Diarra A, Magdalene Ngitah A, Winch PJ, Shaffer JG, et al. Predicting Malaria Transmission Dynamics in Dangassa, Mali: A Novel Approach Using Functional Generalized Additive Models. International Journal of Environmental Research and Public Health. 2020; 17(17):6339. https://doi.org/10.3390/ijerph17176339
Chicago/Turabian StyleAteba, François Freddy, Manuel Febrero-Bande, Issaka Sagara, Nafomon Sogoba, Mahamoudou Touré, Daouda Sanogo, Ayouba Diarra, Andoh Magdalene Ngitah, Peter J. Winch, Jeffrey G. Shaffer, and et al. 2020. "Predicting Malaria Transmission Dynamics in Dangassa, Mali: A Novel Approach Using Functional Generalized Additive Models" International Journal of Environmental Research and Public Health 17, no. 17: 6339. https://doi.org/10.3390/ijerph17176339