Association between Exposure to Ambient Air Pollution and Rheumatoid Arthritis in Adults


Abstract
:1. Introduction
2. Materials and Methods
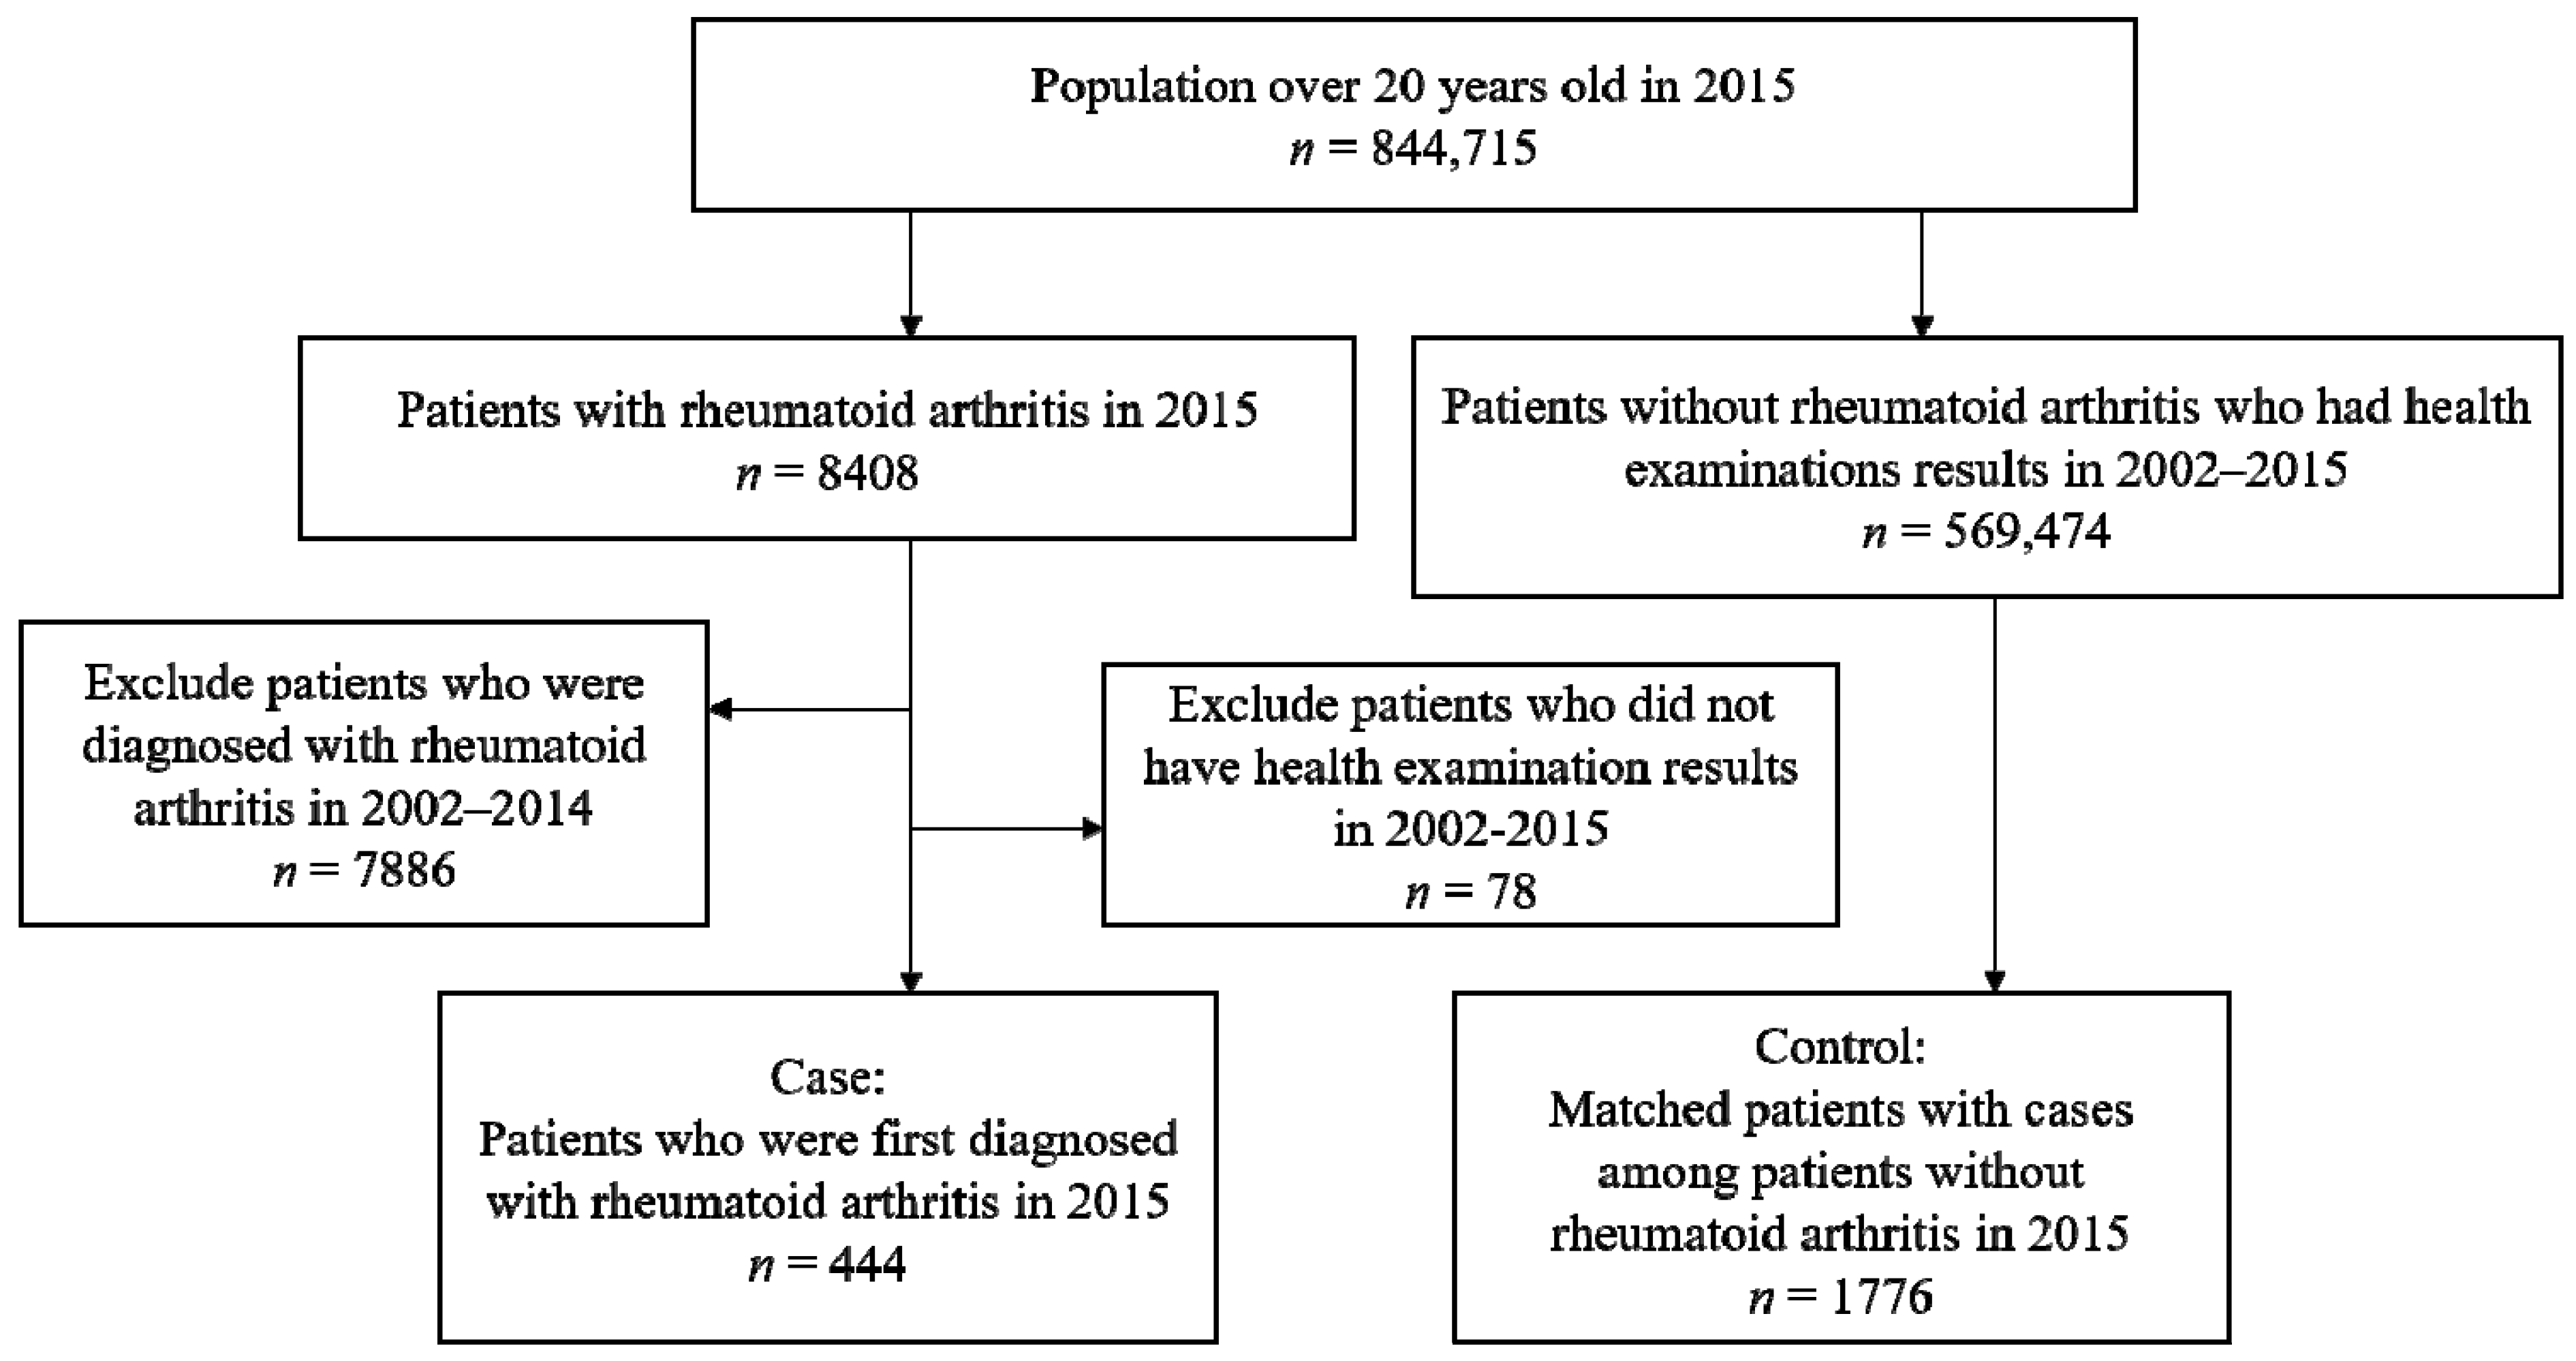
2.1. Data Source and Study Population
2.2. Estimating Individual Exposure to Air Pollutants
2.3. Statistical Analysis
3. Results
4. Discussion
5. Conclusions
Supplementary Materials
Author Contributions
Funding
Conflicts of Interest
References
- Brunekreef, B.; Holgate, S.T. Air Pollution and Health. Lancet 2002, 360, 1233–1242. [Google Scholar] [CrossRef]
- WHO. Ambient (Outdoor) Air Quality and Health. 2018; WHO: Geneva, Switzerland, 2018. [Google Scholar]
- Lawrence, R.C.; Helmick, C.G.; Arnett, F.C.; Deyo, R.A.; Felson, D.T.; Giannini, E.H.; Heyse, S.P.; Hirsch, R.; Hochberg, M.C.; Hunder, G.G. Estimates of the Prevalence of Arthritis and Selected Musculoskeletal Disorders in the United States. Arthritis Rheum. Off. J. Am. Coll. Rheumatol. 1998, 41, 778–799. [Google Scholar]
- Stolt, P.; Kallberg, H.; Lundberg, I.; Sjogren, B.; Klareskog, L.; Alfredsson, L.; EIRA Study Group. Silica Exposure is Associated with Increased Risk of Developing Rheumatoid Arthritis: Results from the Swedish EIRA Study. Ann. Rheum. Dis. 2005, 64, 582–586. [Google Scholar] [CrossRef] [PubMed]
- Sverdrup, B.; Källberg, H.; Bengtsson, C.; Lundberg, I.; Padyukov, L.; Alfredsson, L.; Klareskog, L. Association between Occupational Exposure to Mineral Oil and Rheumatoid Arthritis: Results from the Swedish EIRA Case–control Study. Arthritis Res. Ther. 2005, 7, R1296–R1303. [Google Scholar] [CrossRef] [PubMed]
- Criswell, L.A.; Merlino, L.A.; Cerhan, J.R.; Mikuls, T.R.; Mudano, A.S.; Burma, M.; Folsom, A.R.; Saag, K.G. Cigarette Smoking and the Risk of Rheumatoid Arthritis among Postmenopausal Women: Results from the Iowa Women’s Health Study. Am. J. Med. 2002, 112, 465–471. [Google Scholar] [CrossRef]
- De Roos, A.J.; Koehoorn, M.; Tamburic, L.; Davies, H.W.; Brauer, M. Proximity to Traffic, Ambient Air Pollution, and Community Noise in Relation to Incident Rheumatoid Arthritis. Environ. Health Perspect. 2014, 122, 1075–1080. [Google Scholar] [CrossRef] [PubMed] [Green Version]
- Chang, K.; Hsu, C.; Muo, C.; Hsu, C.Y.; Liu, H.; Kao, C.; Chen, C.; Chang, M.; Hsu, Y. Air Pollution Exposure Increases the Risk of Rheumatoid Arthritis: A Longitudinal and Nationwide Study. Environ. Int. 2016, 94, 495–499. [Google Scholar] [PubMed]
- Kodavanti, U.P.; Thomas, R.; Ledbetter, A.D.; Schladweiler, M.C.; Shannahan, J.H.; Wallenborn, J.G.; Lund, A.K.; Campen, M.J.; Butler, E.O.; Gottipolu, R.R.; et al. Vascular and Cardiac Impairments in Rats Inhaling Ozone and Diesel Exhaust Particles. Environ. Health Perspect. 2011, 119, 312–318. [Google Scholar] [PubMed]
- Tamagawa, E.; Bai, N.; Morimoto, K.; Gray, C.; Mui, T.; Yatera, K.; Zhang, X.; Xing, L.; Li, Y.; Laher, I. Particulate Matter Exposure Induces Persistent Lung Inflammation and Endothelial Dysfunction. Am. J. Physiol.-Lung Cell. Mol. Physiol. 2008, 295, L79–L85. [Google Scholar] [CrossRef]
- Lee, J.; Lee, J.S.; Park, S.; Shin, S.A.; Kim, K. Cohort Profile: The National Health Insurance Service—National Sample Cohort (NHIS-NSC), South Korea. Int. J. Epidemiol. 2016, 46, e15. [Google Scholar]
- Lee, M.; Shin, J.; Park, S.; Kim, D.; Cha, H.; Lee, E. Persistence of Biologic Disease-Modifying Antirheumatic Drugs in Patients with Rheumatoid Arthritis: An Analysis of the South Korean National Health Insurance Database. Semin. Arthritis Rheum. 2018, 47, 485–491. [Google Scholar] [CrossRef] [PubMed]
- Korea Environment Corporation. Air Korea; Korea Environment Corporation: Incheon, Korea, 2018. [Google Scholar]
- Diodato, N. The Influence of Topographic Co-variables on the Spatial Variability of Precipitation Over Small Regions of Complex Terrain. Int. J. Climatol. 2005, 25, 351–363. [Google Scholar] [CrossRef]
- Montero, J.; Fernández-Avilés, G. Functional Kriging Prediction of Atmospheric Particulate Matter Concentrations in Madrid, Spain: Is the New Monitoring System Masking Potential Public Health Problems? J. Clean. Prod. 2018, 175, 283–293. [Google Scholar] [CrossRef]
- Chen, L.; Gao, S.; Zhang, H.; Sun, Y.; Ma, Z.; Vedal, S.; Mao, J.; Bai, Z. Spatiotemporal Modeling of PM 2.5 Concentrations at the National Scale Combining Land use Regression and Bayesian Maximum Entropy in China. Environ. Int. 2018, 116, 300–307. [Google Scholar] [CrossRef] [PubMed]
- Panasevich, S.; Leander, K.; Rosenlund, M.; Ljungman, P.; Bellander, T.; de Faire, U.; Pershagen, G.; Nyberg, F. Associations of Long- and Short-Term Air Pollution Exposure with Markers of Inflammation and Coagulation in a Population Sample. Occup. Environ. Med. 2009, 66, 747–753. [Google Scholar] [CrossRef] [PubMed]
- Rothman, K.J.; Greenland, S.; Lash, T.L. Modern Epidemiology; LWW: Philadelphia, PA, USA, 2008. [Google Scholar]
- Schisterman, E.F.; Cole, S.R.; Platt, R.W. Overadjustment Bias and Unnecessary Adjustment in Epidemiologic Studies. Epidemiology 2009, 20, 488–495. [Google Scholar] [CrossRef] [Green Version]
- Hertz-Picciotto, I.; Smith, A.H. Observations on the Dose-Response Curve for Arsenic Exposure and Lung Cancer. Scand. J. Work Environ. Health 1993, 19, 217–226. [Google Scholar] [CrossRef] [PubMed]
- Vineis, P.; Kogevinas, M.; Simonato, L.; Brennan, P.; Boffetta, P. Levelling-Off of the Risk of Lung and Bladder Cancer in Heavy Smokers: An Analysis Based on Multicentric Case-Control Studies and a Metabolic Interpretation. Mutat. Res. 2000, 463, 103–110. [Google Scholar]
- Xie, W.; Li, G.; Zhao, D.; Xie, X.; Wei, Z.; Wang, W.; Wang, M.; Li, G.; Liu, W.; Sun, J.; et al. Relationship between Fine Particulate Air Pollution and Ischaemic Heart Disease Morbidity and Mortality. Heart 2015, 101, 257–263. [Google Scholar] [CrossRef]
- Smith, R.L.; Spitzner, D.; Kim, Y.; Fuentes, M. Threshold Dependence of Mortality Effects for Fine and Coarse Particles in Phoenix, Arizona. J. Air Waste Manag. Assoc. 2000, 50, 1367–1379. [Google Scholar] [CrossRef] [Green Version]
- Daniels, M.J.; Dominici, F.; Samet, J.M.; Zeger, S.L. Estimating Particulate Matter-Mortality Dose-Response Curves and Threshold Levels: An Analysis of Daily Time-Series for the 20 Largest US Cities. Am. J. Epidemiol. 2000, 152, 397–406. [Google Scholar] [CrossRef] [Green Version]
- Clapp, L.J.; Jenkin, M.E. Analysis of the Relationship between Ambient Levels of O3, NO2 and NO as a Function of NOx in the UK. Atmos. Environ. 2001, 35, 6391–6405. [Google Scholar] [CrossRef]
- Hart, J.E.; Källberg, H.; Laden, F.; Costenbader, K.H.; Yanosky, J.D.; Klareskog, L.; Alfredsson, L.; Karlson, E.W. Ambient Air Pollution Exposures and Risk of Rheumatoid Arthritis. Arthritis Care Res. 2013, 65, 1190–1196. [Google Scholar] [CrossRef] [PubMed]
- Hart, J.E.; Kallberg, H.; Laden, F.; Bellander, T.; Costenbader, K.H.; Holmqvist, M.; Klareskog, L.; Alfredsson, L.; Karlson, E.W. Ambient Air Pollution Exposures and Risk of Rheumatoid Arthritis: Results from the Swedish EIRA Case-Control Study. Ann. Rheum. Dis. 2013, 72, 888–894. [Google Scholar] [CrossRef] [PubMed]
- Jerrett, M.; Burnett, R.T.; Ma, R.; Pope, C.A., III; Krewski, D.; Newbold, K.B.; Thurston, G.; Shi, Y.; Finkelstein, N.; Calle, E.E. Spatial Analysis of Air Pollution and Mortality in Los Angeles. Epidemiology 2005, 16, 727–736. [Google Scholar] [CrossRef] [PubMed] [Green Version]


| Characteristics | All | |
|---|---|---|
| Cases n = 444 | Controls n = 1776 | |
| Sex | ||
| Male | 136 (30.6%) | 544 (30.6%) |
| Female | 308 (69.4%) | 1232 (69.4%) |
| Age | ||
| 20–30 | 6 (1.4%) | 24 (1.4%) |
| 30–40 | 33 (7.4%) | 132 (7.4%) |
| 40–50 | 86 (19.4%) | 344 (19.4%) |
| 50–60 | 147 (33.1%) | 588 (33.1%) |
| 60–70 | 100 (22.5%) | 400 (22.5%) |
| 70–80 | 55 (12.4%) | 220 (12.4%) |
| ≥80 | 17 (3.8%) | 68 (3.83%) |
| Household income relative to the median (%) | ||
| Lowest (<20%) | 91 (20.5%) | 364 (20.5%) |
| 20–80% | 171 (38.5%) | 684 (38.5%) |
| Highest (>80%) | 182 (41.0%) | 728 (41.0%) |
| BMI | ||
| Underweight | 44 (9.9%) | 196 (11.0%) |
| Normal weight | 261 (58.8%) | 993 (55.9%) |
| Overweight | 120 (27.0%) | 511 (28.8%) |
| Obesity | 19 (4.3%) | 76 (4.3%) |
| Insurance type | ||
| Employee insured | 102 (23.0%) | 481 (27.1%) |
| Self-employed insured | 328 (73.9%) | 1262 (71.1%) |
| Medical-aid beneficiary | 14 (3.2%) | 33 (1.86%) |
| Smoking status | ||
| Never | 336 (75.7%) | 1335 (75.3%) |
| Ever | 108 (24.3%) | 439 (24.8%) |
| Alcohol consumption | ||
| Rarely | 317 (71.4%) | 1172 (66.1%) |
| Over 2 or 3 times per month | 127 (28.6%) | 601 (33.9%) |
| Exercise status | ||
| <1 time per week | 256 (57.7%) | 983 (55.4%) |
| ≥1 time per week | 188 (42.3%) | 790 (44.6%) |
| Air Pollutant | Air Pollutant Distribution | ||||||
|---|---|---|---|---|---|---|---|
| Minimum | 25th | 50th (Median) | 75th | Maximum | Mean ± SD | ||
| Total n = 2220 | PM10 µg/m3 | 40.04 | 46.26 | 49.05 | 53.62 | 62.49 | 49.85 ± 5.33 |
| CO (ppb) | 351.83 | 465.34 | 509.70 | 552.25 | 643.10 | 505.50 ± 58.63 | |
| NO2 (ppb) | 15.68 | 20.63 | 22.66 | 32.47 | 36.09 | 25.59 ± 6.04 | |
| O3 (ppb) | 34.61 | 37.66 | 39.70 | 42.11 | 45.67 | 39.90 ± 2.75 | |
| SO2 (ppb) | 4.22 | 4.72 | 5.29 | 5.79 | 8.52 | 5.34 ± 0.79 | |
| Case n = 444 | PM10 µg/m3 | 40.04 | 45.38 | 48.14 | 53.57 | 62.49 | 49.41 ± 5.50 |
| CO (ppb) | 351.83 | 471.50 | 510.61 | 546.05 | 643.10 | 508.51 ± 53.10 | |
| NO2 (ppb) | 15.68 | 20.61 | 22.34 | 32.02 | 36.09 | 25.03 ± 5.87 | |
| O3 (ppb) | 34.61 | 37.95 | 40.15 | 42.17 | 45.67 | 40.17 ± 2.67 | |
| SO2 (ppb) | 4.22 | 4.58 | 5.17 | 5.73 | 8.52 | 5.31 ± 0.87 | |
| Control n = 1776 | PM10 µg/m3 | 40.04 | 46.39 | 49.26 | 53.62 | 62.49 | 49.95 ± 5.28 |
| CO (ppb) | 351.83 | 464.51 | 509.70 | 552.87 | 643.10 | 504.75 ± 59.92 | |
| NO2 (ppb) | 16.11 | 20.63 | 22.81 | 32.50 | 36.09 | 25.73 ± 6.07 | |
| O3 (ppb) | 34.61 | 37.59 | 39.68 | 42.10 | 45.67 | 39.84 ± 2.77 | |
| SO2 (ppb) | 4.22 | 4.78 | 5.29 | 5.79 | 8.52 | 5.35 ± 0.77 | |
| Air Pollutant | 1-Year Average Concentration | |||||
|---|---|---|---|---|---|---|
| PM10 | CO | NO2 | O3 | SO2 | ||
| 1-Year Average Concentration | PM10 | 1 | 0.11 * | 0.08 * | −0.30 * | 0.29 * |
| CO | 1 | 0.73 * | −0.37 * | −0.04 | ||
| NO2 | 1 | −0.75 * | 0.29 * | |||
| O3 | 1 | −0.50 * | ||||
| SO2 | 1 | |||||
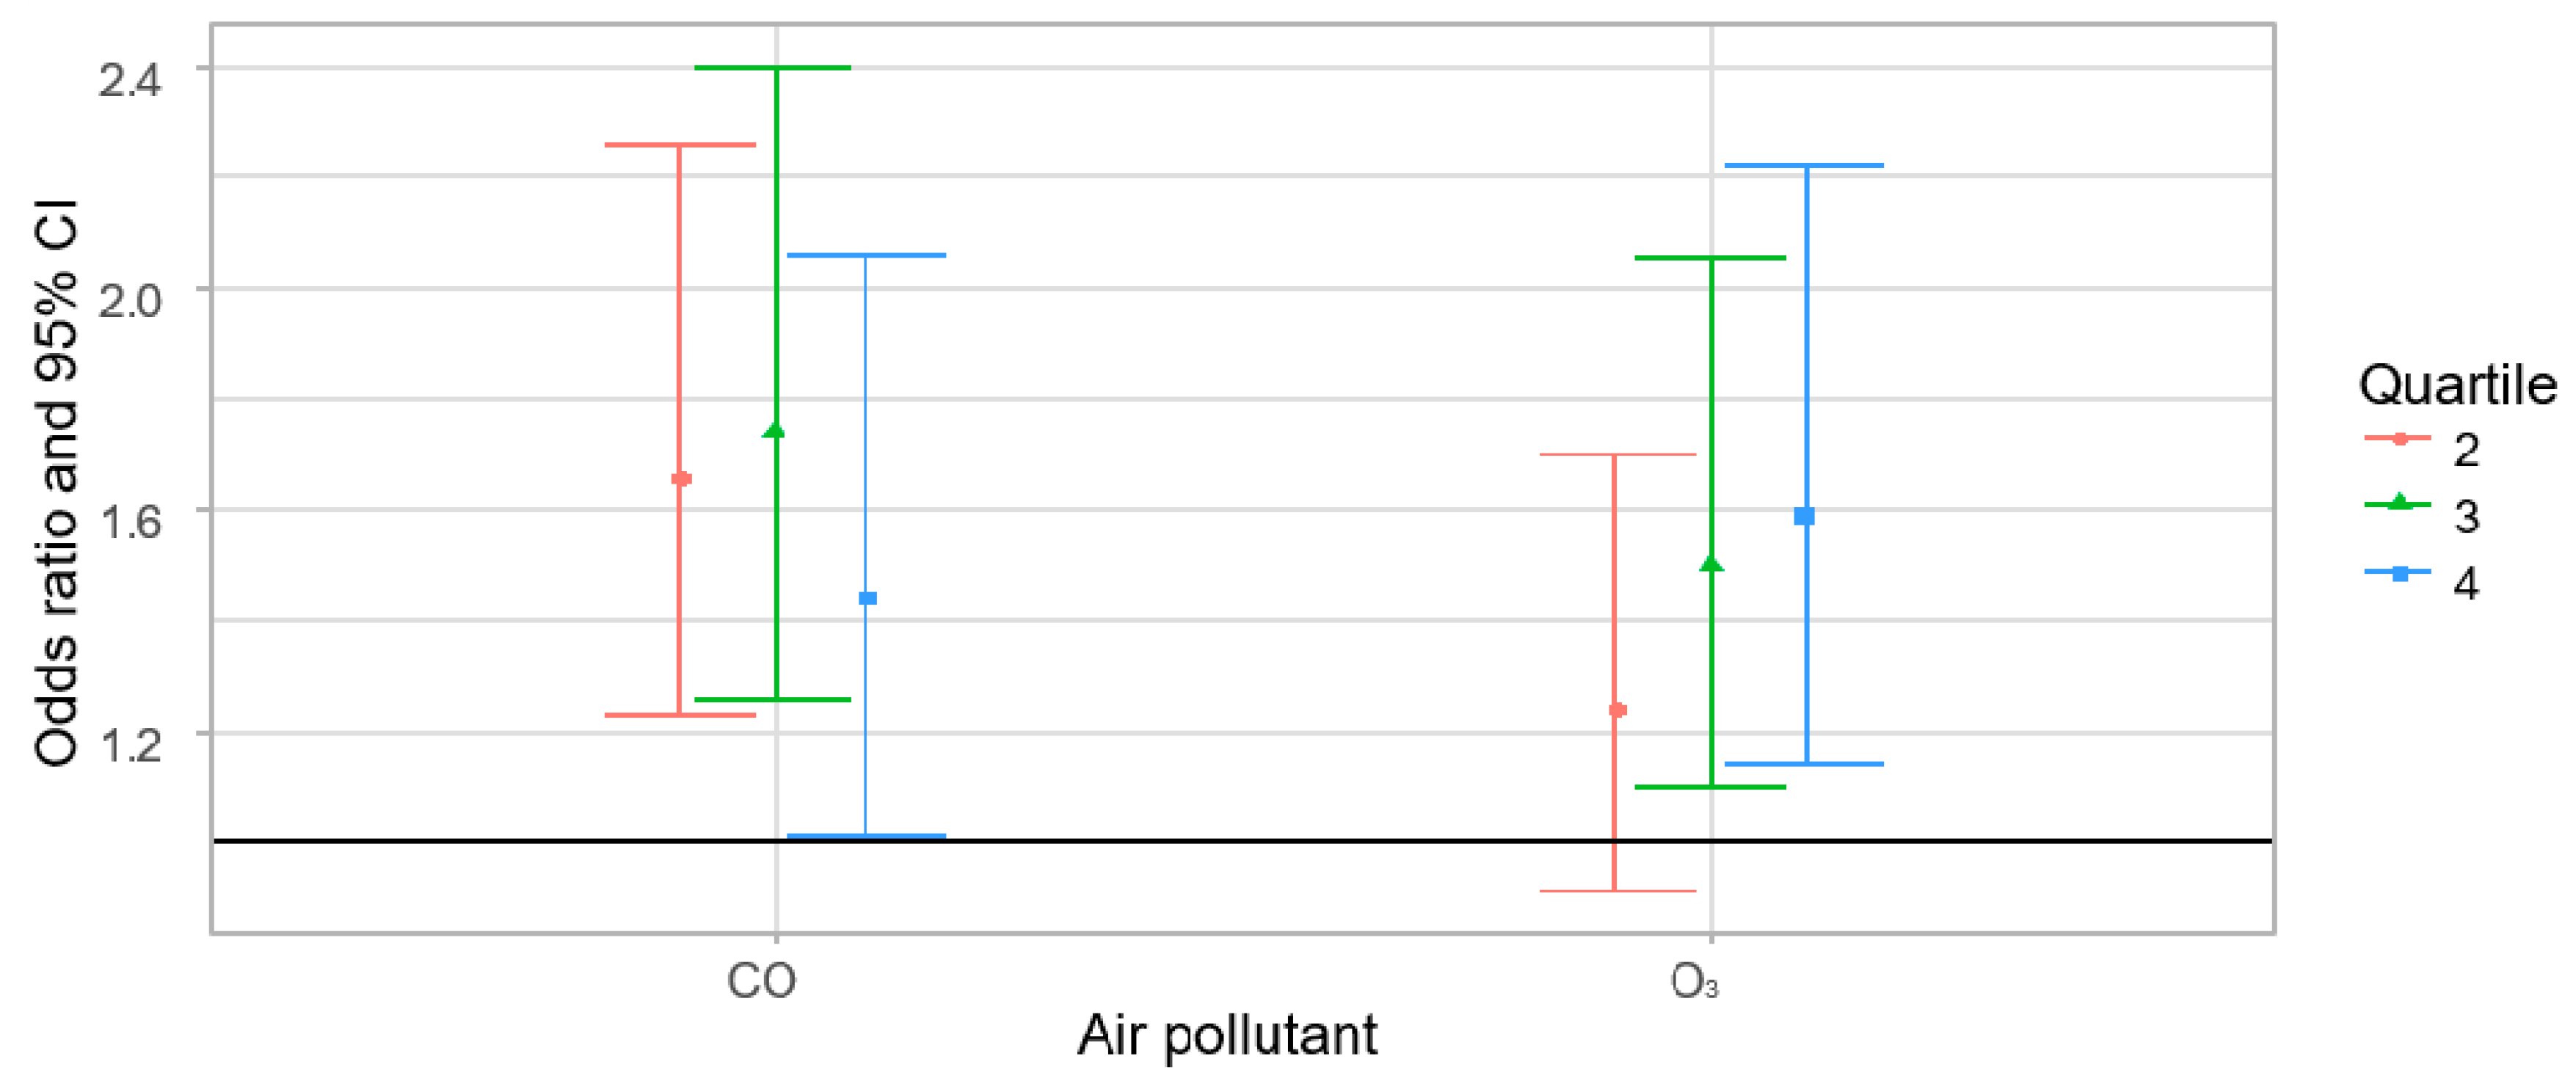
| Air Pollutant | Single-Pollutant Models | Multi-Pollutant Models c | ||
|---|---|---|---|---|
| Quartile b | OR (95% CI) | Quartile b | OR (95% CI) | |
| O3 (ppb) | 2 | 1.17 (0.86–1.59) | 2 | 1.13 (0.78–1.63) |
| 3 | 1.45 (1.08–1.96) | 3 | 1.21 (0.77–1.91) | |
| 4 | 1.35 (1.00–1.83) | 4 | 1.21 (0.69–2.13) | |
| PM10 µg/m3 | 2 | 0.87 (0.65–1.16) | 2 | 0.98 (0.69–1.41) |
| 3 | 0.79 (0.59–1.07) | 3 | 0.85 (0.60–1.22) | |
| 4 | 0.85 (0.64–1.13) | 4 | 0.82 (0.57–1.19) | |
| CO (ppb) | 2 | 1.52 (1.12–2.04) | 2 | 1.74 (1.24–2.44) |
| 3 | 1.57 (1.16–2.12) | 3 | 1.83 (1.24–2.70) | |
| 4 | 1.15 (0.83–1.58) | 4 | 1.83 (1.11–3.01) | |
| NO2 (ppb) | 2 | 0.96 (0.71–1.28) | 2 | 1.03 (0.73–1.46) |
| 3 | 1.00 (0.75–1.33) | 3 | 0.99 (0.64–1.52) | |
| 4 | 0.72 (0.53–0.98) | 4 | 0.71 (0.37–1.36) | |
| SO2 (ppb) | 2 | 0.79 (0.60–1.06) | 2 | 0.86 (0.58–1.28) |
| 3 | 0.75 (0.56–1.00) | 3 | 0.86 (0.55–1.33) | |
| 4 | 0.76 (0.57–1.02) | 4 | 0.98 (0.62–1.55) | |
© 2019 by the authors. Licensee MDPI, Basel, Switzerland. This article is an open access article distributed under the terms and conditions of the Creative Commons Attribution (CC BY) license (http://creativecommons.org/licenses/by/4.0/).
Share and Cite
Shin, J.; Lee, J.; Lee, J.; Ha, E.-H. Association between Exposure to Ambient Air Pollution and Rheumatoid Arthritis in Adults. Int. J. Environ. Res. Public Health 2019, 16, 1227. https://doi.org/10.3390/ijerph16071227
Shin J, Lee J, Lee J, Ha E-H. Association between Exposure to Ambient Air Pollution and Rheumatoid Arthritis in Adults. International Journal of Environmental Research and Public Health. 2019; 16(7):1227. https://doi.org/10.3390/ijerph16071227
Chicago/Turabian StyleShin, Jiyoung, Jiyoung Lee, Jueun Lee, and Eun-Hee Ha. 2019. "Association between Exposure to Ambient Air Pollution and Rheumatoid Arthritis in Adults" International Journal of Environmental Research and Public Health 16, no. 7: 1227. https://doi.org/10.3390/ijerph16071227