3. Materials and Methods
3.1. General Experimental Procedures
All reagents were purchased (Aldrich and Fluka) at the highest commercial quality and used without further purification. The reactions were monitored using thin layer chromatography (TLC) carried out on precoated silica gel plates (Merck 60, F254, 0.25 mm thick). Merck silica gel (Kieselgel 40, particle size 0.063–0.200 mm) was used for the column chromatography. All the HPLC (high performance liquid chromatography) separations and purifications were performed on a Phenomenex Luna column (25 cm × 4.6 mm, 5 µm) using n-hexane/EtOAc mixtures as eluent, at a flow rate of 1 mL/min. Na2SO4 was used as a drying agent for aqueous work-up. Nuclear magnetic resonance (NMR) experiments were performed using either a Bruker 700 MHz AvanceNeo spectrometer (Billerica, MA, US) equipped with a triple resonance cryoprobe or a Bruker 400 MHz Avance spectrometer (Billerica, MA, US) in CDCl3. Proton chemical shifts were referenced to the residual CHCl3 signal (7.26 ppm). 13C-NMR chemical shifts were referenced to the solvent (77.0 ppm). Coupling constants (J) are given in Hertz. Abbreviations for signal coupling are as follows: s = singlet, d = doublet, t = triplet, q = quartet, m = multiplet, b = broad. The optical rotations were measured using a JASCO P-2000 polarimeter (JASCO, Oklahoma City, OK, US) at the sodium D line. The high-resolution mass spectra were recorded by infusion on a Thermo Linear Trap Quadrupole (LTQ) Orbitrap XL mass spectrometer (Thermo Fisher Scientific, Waltham, MA, US) equipped with an electrospray source in the positive mode using MeOH as the solvent.
3.2. Mycalin A 1
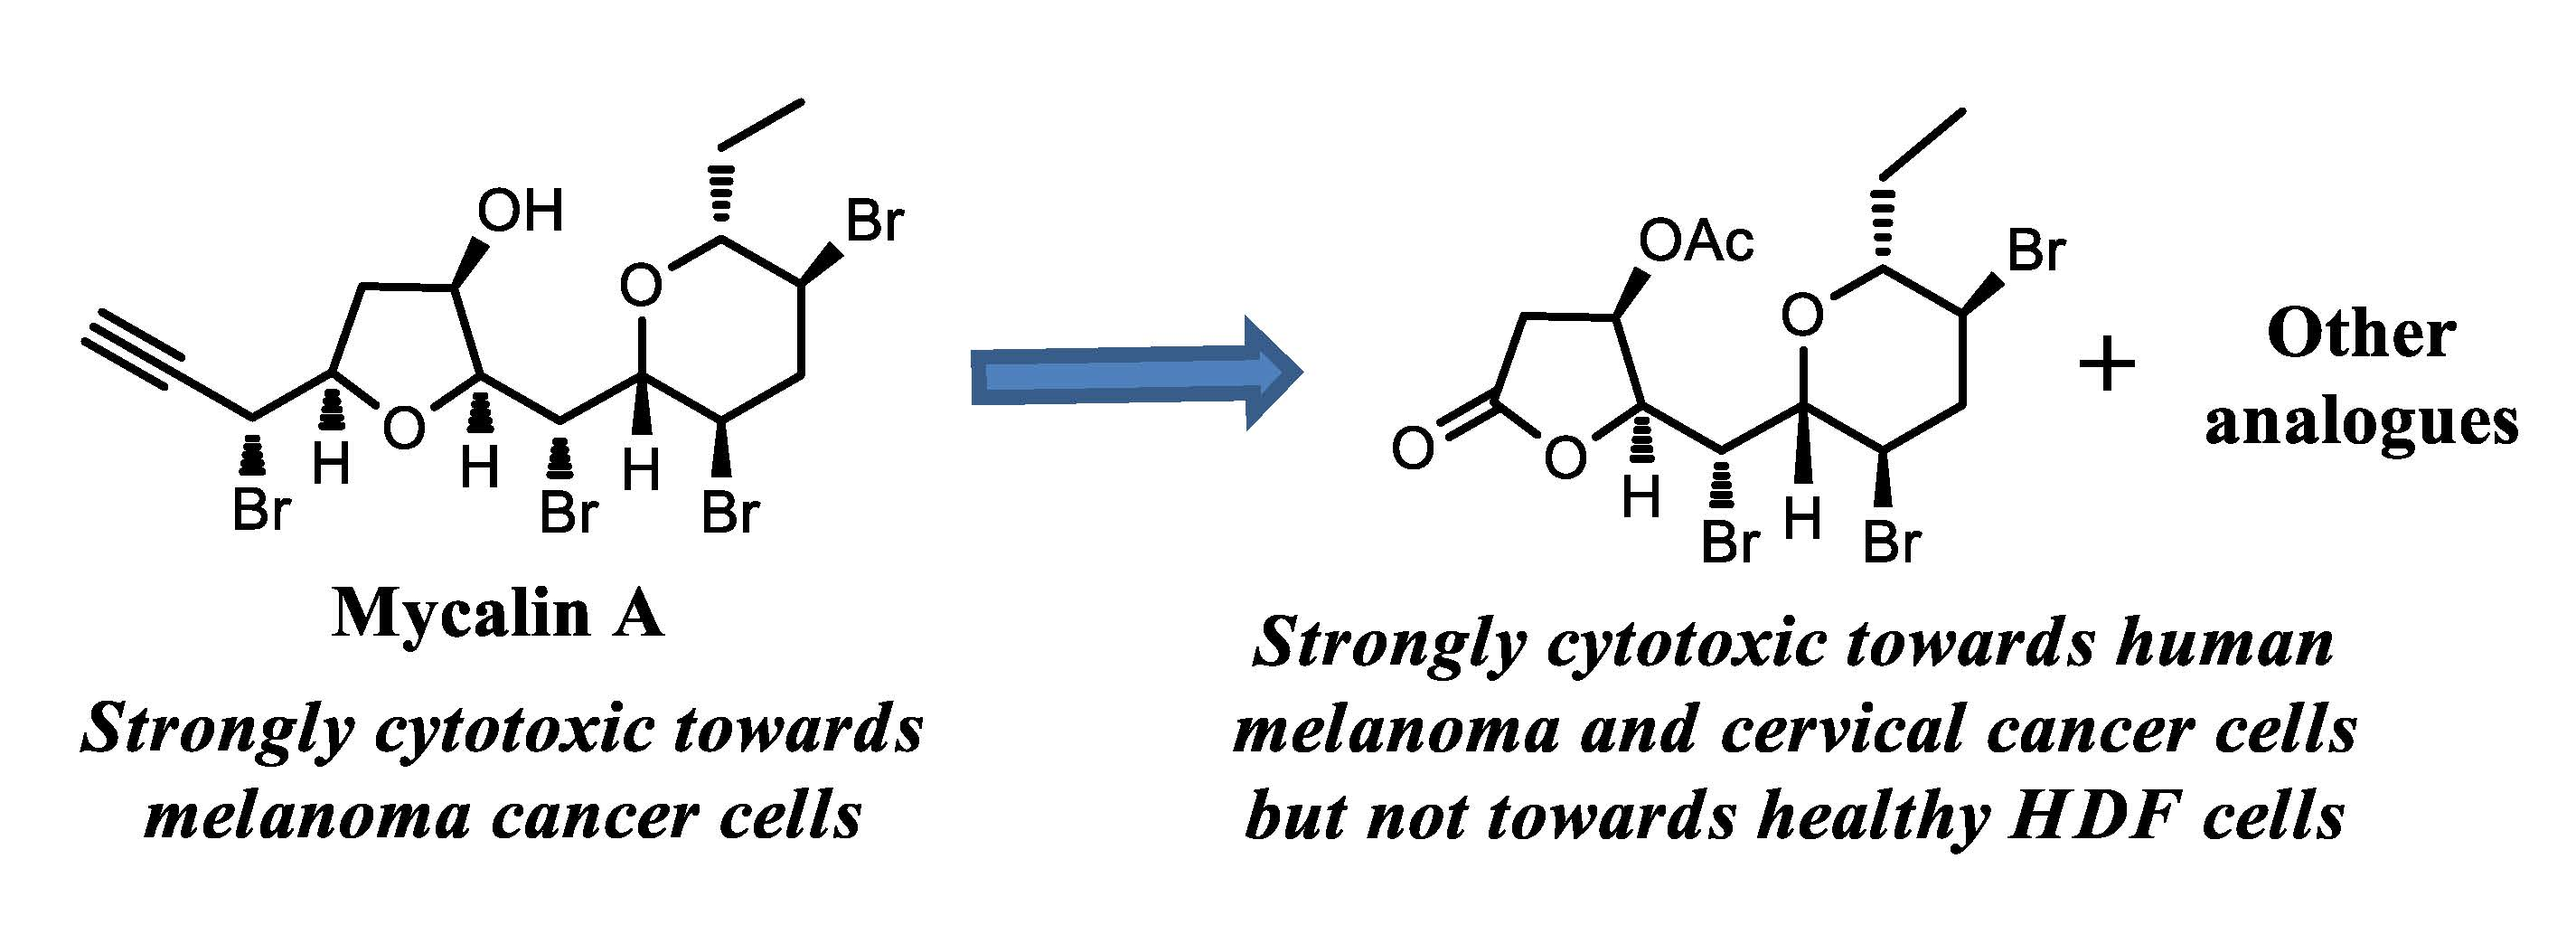
Mycalin A (
1) was isolated from the sponge
Mycale rotalis collected in the Stagnone di Marsala lagoon (Sicily) in the spring of 1989 [
5,
6]. For details of the isolation of mycalin A see ref. 6. A pure sample of mycalin A for the biological assays was obtained by filtration on a silica gel pad (eluent
n-hexane-EtOAc, 4:6) followed by HPLC purification using
n-hexane-EtOAc (75:25) as the eluent. Copy of the NMR spectra are reported in the
Supplementary Materials.
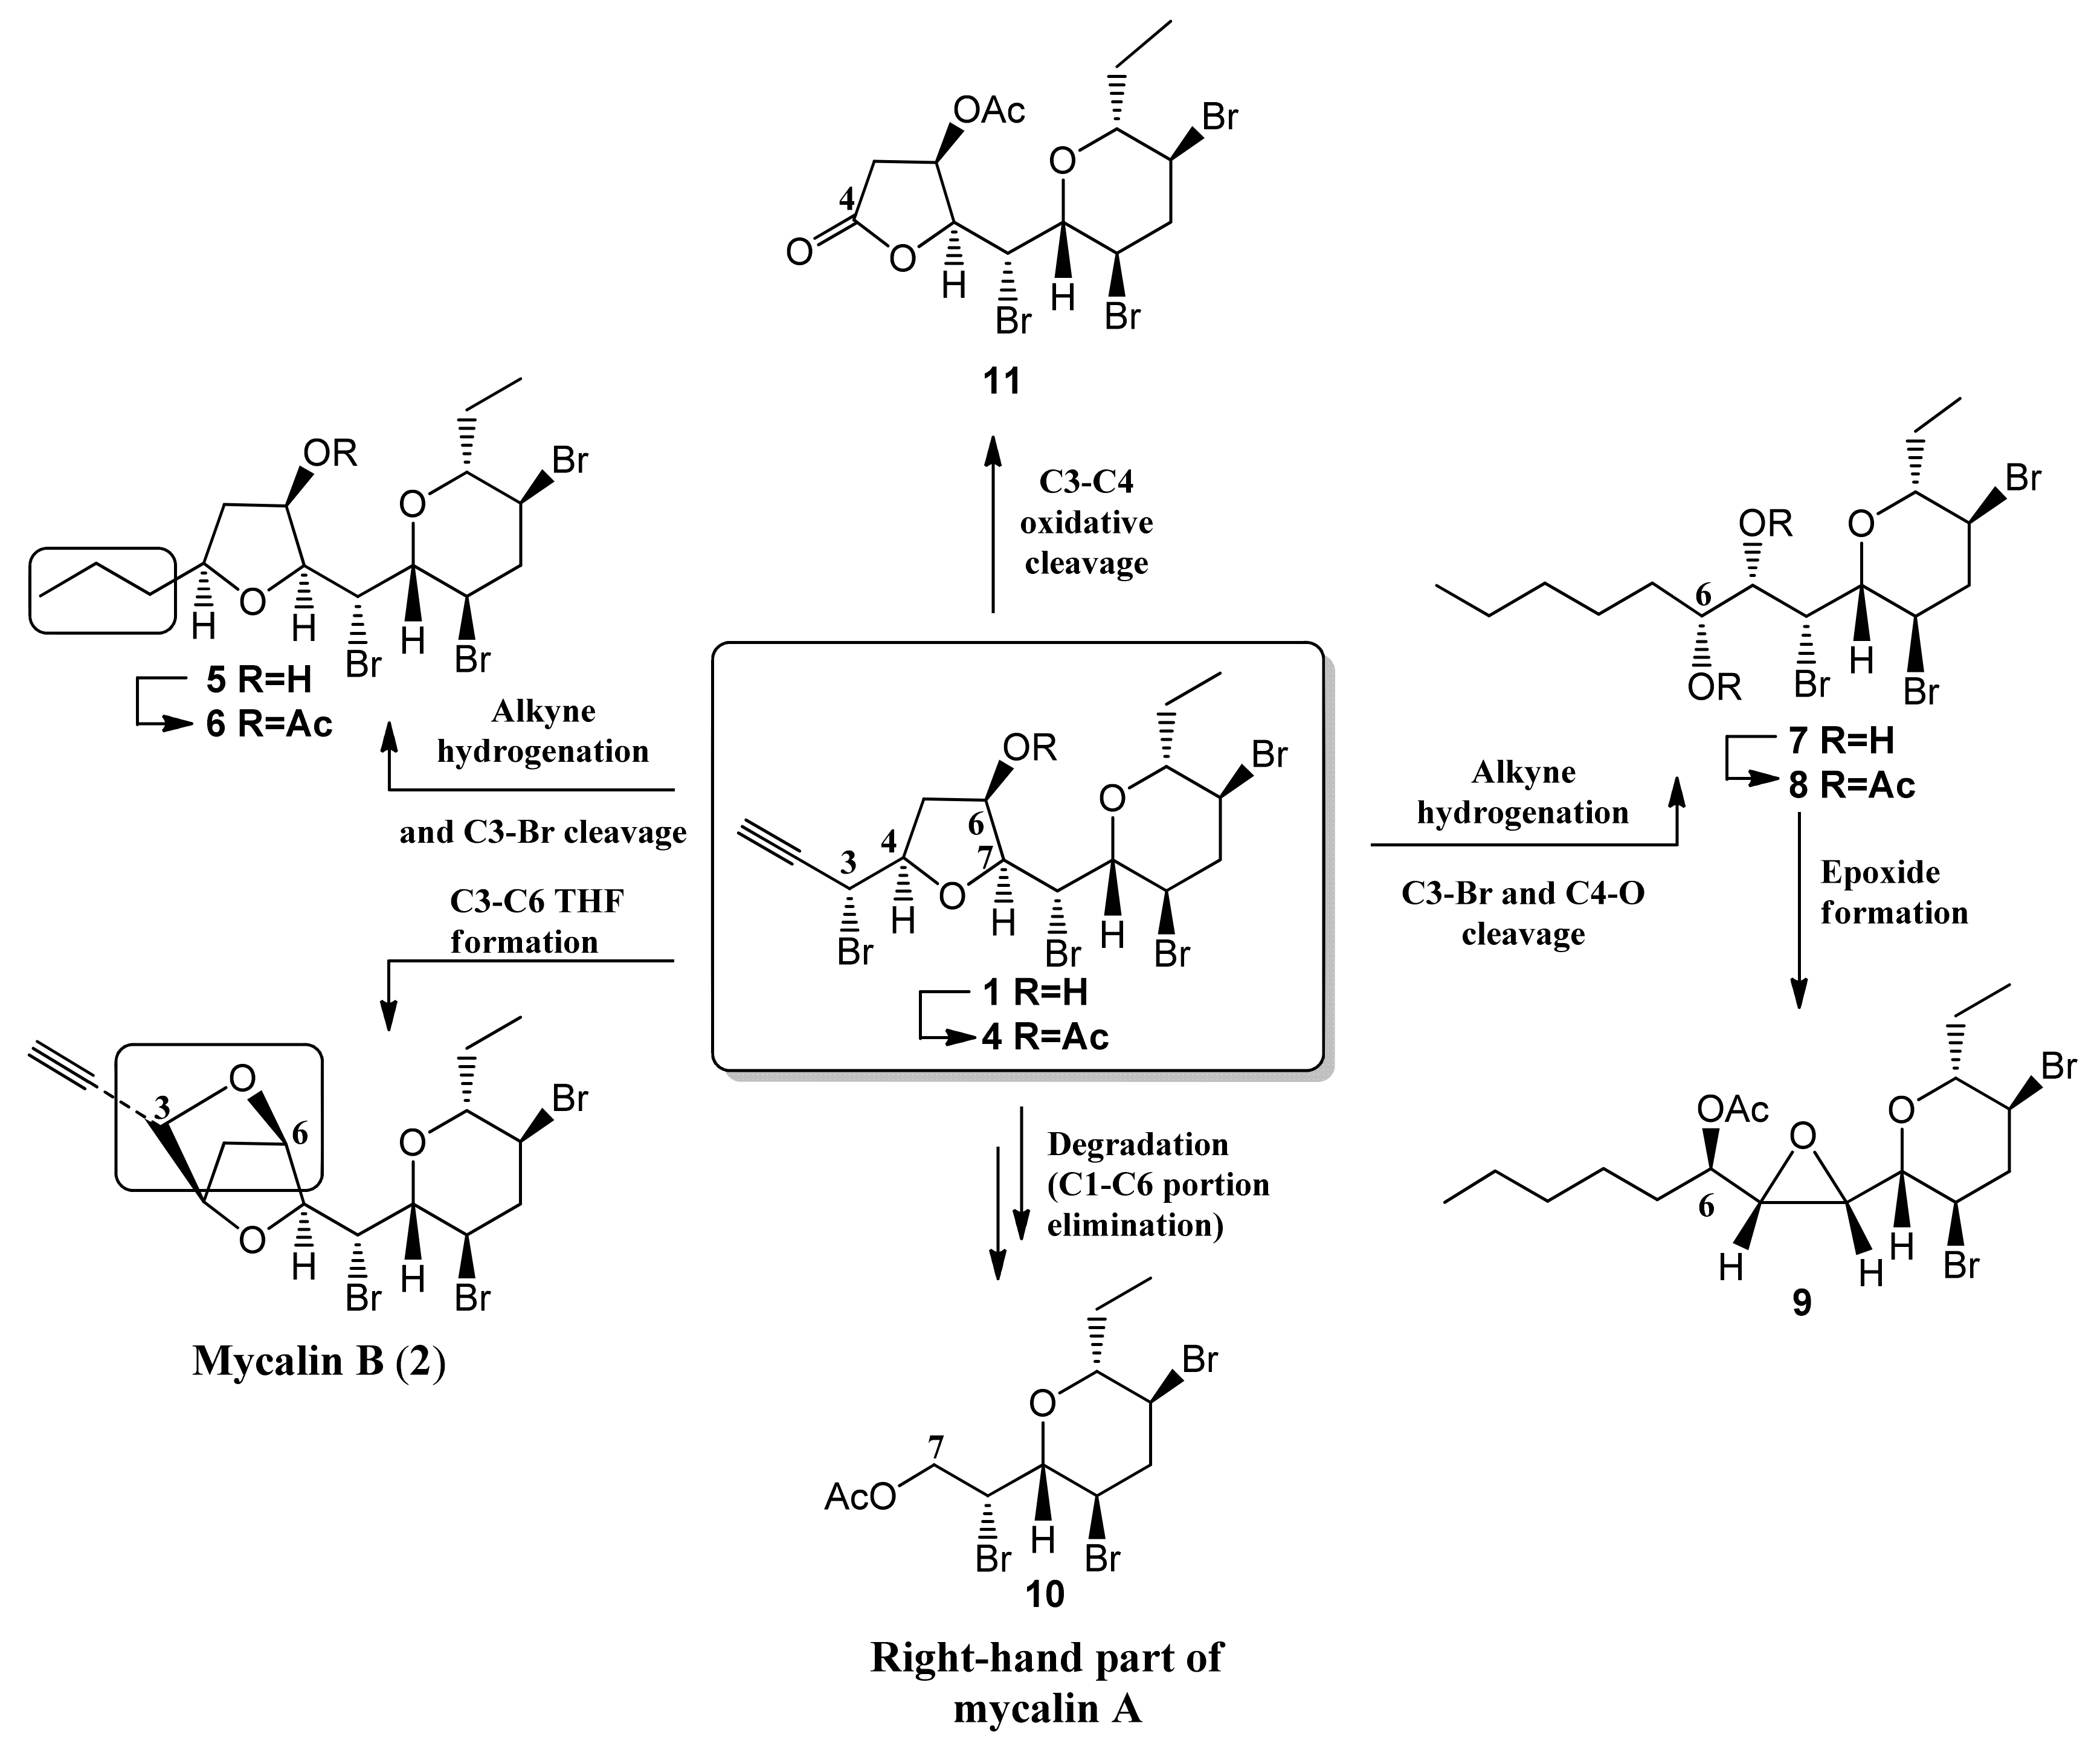
3.3. Mycalin A Acetate 4
Excess acetic anhydride (0.5 mL) was added to a solution of alcohol 1 (18.2 mg, 0.032 mmol) in pyridine (0.5 mL) and the mixture stirred at 50 °C. After 3 h the reaction mixture was evaporated under reduced pressure to give acetyl derivative 4 (19.5 mg) as a single spot by TLC (n-hexane-EtOAc, 7:3, Rf = 0.56) The crude was subjected to HPLC purification using n-hexane-EtOAc, 8:2 as the eluent to give 4 (18.0 mg, 93%) as a colourless oil. 4: = + 41.1 (c = 0.20, CHCl3). IR (infrared) (neat) λmax 2121, 1737, 1374, 1241, cm−1. 1H-NMR (400 MHz, CDCl3): δ 5.27 (1H, bdd, J = 5.4, 3.1), 4.65 (1H, dd, J = 9.5, 1.5), 4.59 (1H, dd, J = 6.7, 2.3), 4.34 (1H, ddd, 8.8, 6.6, 4.8), 4.24 (1H, dd, J = 9.6, 3.2), 4.17 (1H, ddd, J = 12.3, 9.5, 4.5), 3.72 (1H, ddd, J = 11.9, 10.2, 4.4), 3.39 (1H, dt, J = 9.5, 2.3), 3.21 (1H, dd, J = 9.6, 1.5), 2.98 (1H, ddd, J = 12.9, 4.4, 4.4), 2.68–2.59 (2H, overlapped m’s), 2.39 (1H, ddd, J = 12.6, 12.6, 12.6), 2.29 (1H, dd, J = 15.6, 5.0), 2.12 (3H, s, acetate), 2.02 (1H, m), 1.54 (1H, m), 0.93 (3H, t, J = 7.3). 13C-NMR: (100 MHz, CDCl3): δ 170.1, 83.7, 83.6, 80.2, 79.7, 79.3, 76.5, 72.1, 51.5, 47.1, 46.6, 45.1, 37.4, 37.0, 25.7, 21.2, 9.5. HRESIMS (high resolution electrospray ionization mass spectrometry) m/z: calcd for C17H2279Br4NaO4 628.8149 [M + Na]+, found: 628.8140.
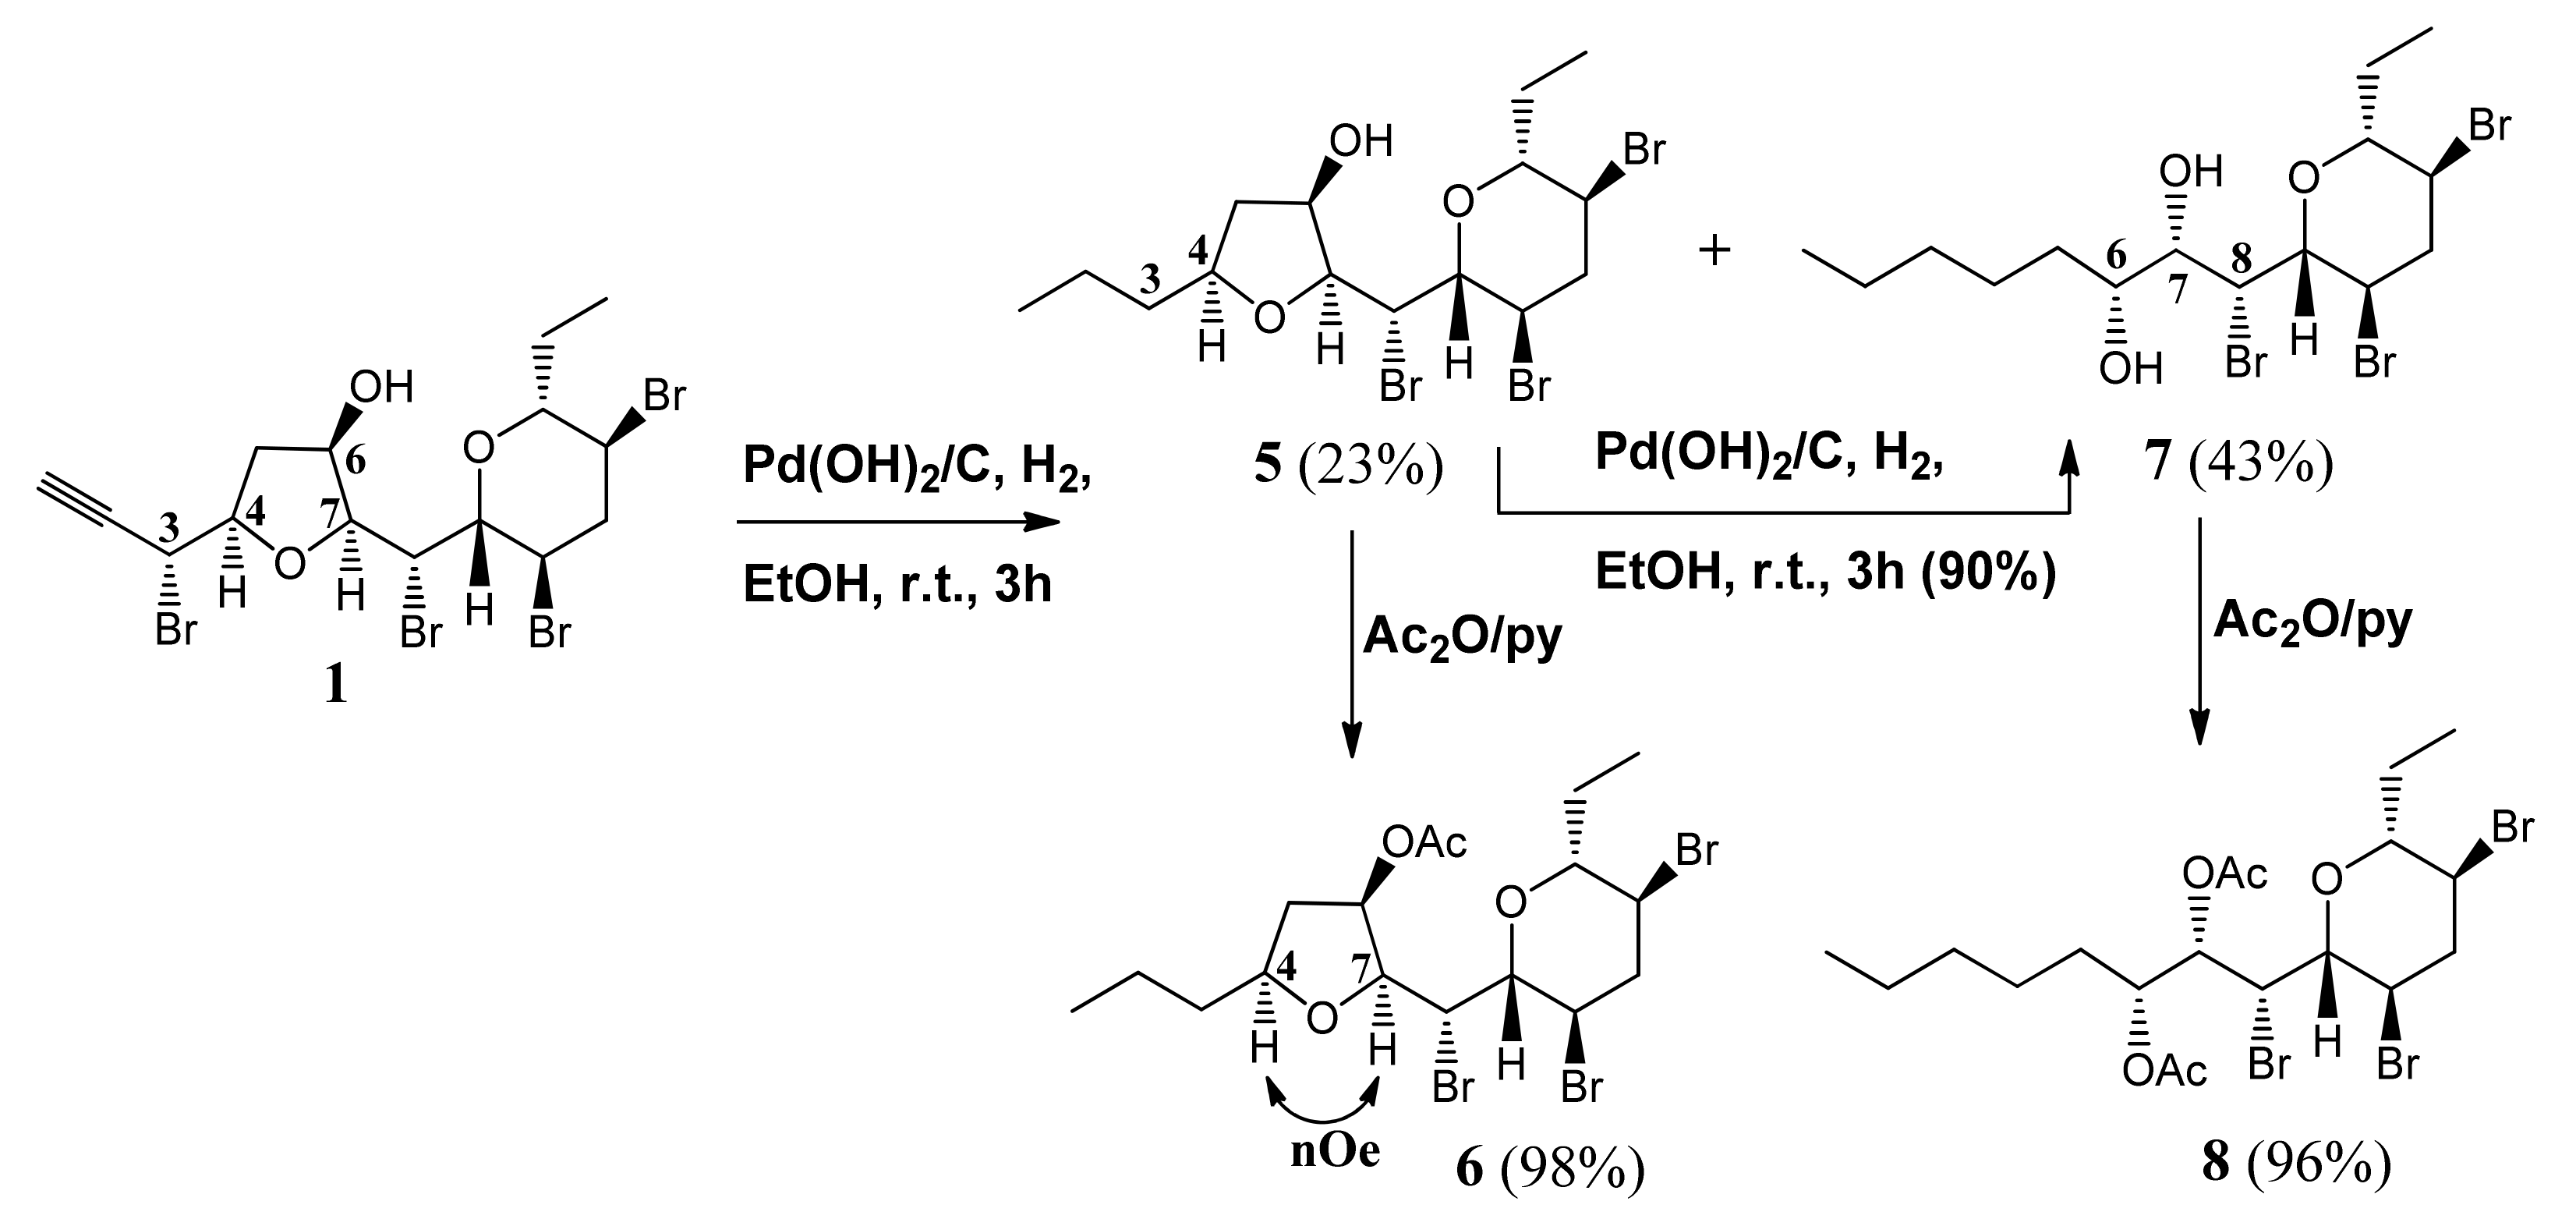
3.4. Propyl Derivative 5
Pd(OH)2/C (20% w/w, 8.5 mg) was added to mycalin A (1, 42.3 mg, 0.074 mmol) in EtOH (2 mL) and the mixture stirred under hydrogen atmosphere. A vacuum-fill technique was used using a hydrogen balloon and a three-way vacuum adapter. After 2 h the reaction mixture was filtered over celite, and the filtrate was dried under reduced pressure to give a mixture of the propyl-derivative 5 and the diol 7 (40.5 mg) as a colorless oil. Further filtration of the crude on a silica gel pad, eluting with n-hexane-EtOAc (7:3), afforded an oily material (29.8 mg), essentially constituted by a mixture of 5 and 7 (TLC: n-hexane-EtOAc, 7:3. 5: Rf = 0.60; 7: Rf = 0.67). HPLC separation with n-hexane-EtOAc (7:3) as the eluent gave pure compounds 5 (8.2 mg, 23%) and 7 (15.9 mg, 43%) as colourless oils. 5: = +4.2 (c = 0.17, CHCl3). IR (neat) λmax 3446 (broad) cm−1. 1H-NMR: (400 MHz, CDCl3): δ 4.64 (1H, dd, J = 9.2, 1.8), 4.24–4.14 (2H, overlapped m’s), 3.96–3.87 (2H, overlapped m’s), 3.81 (1H, dd, J = 9.8, 1.9), 3.76 (1H, ddd, J = 12.1, 10.0, 4.3), 3.44 (1H, dt, J = 9.1, 2.3), 3.00 (1H, ddd, J = 12.9, 4.3, 4.3), 2.48 (2H, overlapped m’s), 2.04 (1H, m), 1.77 (1H, m), 1.68–1.33 (5H, overlapped m’s), 0.96 (3H, t, J = 7.2), 0.94 (3H, t, J = 7.2). 13C-NMR: (100 MHz, CDCl3): δ 84.8, 83.8, 80.0, 71.9, 53.3, 47.7, 46.8, 45.3, 42.2, 38.9, 25.8, 19.2, 14.0, 9.7. HRESIMS m/z: calcd for C15H2579Br3NaO3 512.9252 [M + Na]+, found: 512.9240.
3.5. Propyl Acetate 6
Acetic anhydride (0.4 mL) was added to a stirred solution of 5 (8.2 mg, 0.017 mmol) in pyridine (0.4 mL), at room temperature. After 16 h the reaction mixture was evaporated under reduced pressure to give acetyl derivative 6 (9.0 mg) as a colourless oil. HPLC purification (eluent: n-hexane-EtOAc, 7:3) gave the pure compound 6 (8.8 mg, 98%) suitable for the biological assays. 6: = +15.3 (c = 0.71, CHCl3). IR (neat) λmax 1737, 1375, 1239 cm−1. 1H-NMR: (700 MHz, CDCl3): δ 5.19 (ddd, J = 6.3, 3.1, 1.1, 1H), 4.69 (dd, J = 9.7, 1.6, 1H), 4.17 (ddd, J = 12.1, 9.6, 4.6, 1H), 4.06 (dd, J = 9.7, 3.1, 1H), 3.96 (dq, J = 8.4, 6.4, 1H), 3.73 (ddd, J = 12.0, 10.0, 4.3, 1H), 3.38 (ddd, J = 10.0, 8.8, 2.4, 1H), 3.22 (dd, J = 9.6, 1.6, 1H), 2.98 (ddd, J = 13.0, 4.3, 4.3, 1H), 2.55 (ddd, J = 14.6, 8.4, 6.3, 1H), 2.40 (1H, ddd, J = 13.0, 12.1, 12.0), 2.12 (s, 3H, acetate), 2.06–1.98 (m, 1H), 1.79–1.71 (m, 1H), 1.66 (ddd, J = 14.5, 6.4, 1.1, 1H), 1.56–1.46 (m, 2H), 1.41 (dddd, J = 12.9, 10.3, 7.4, 5.5, 1H), 1.35 (dddd, J = 13.0, 10.6, 7.4, 5.4, 1H), 0.93 (t, J = 7.4, 6H, 2×Me). 13C-NMR: (176 MHz, CDCl3): δ 170.6, 83.6, 82.3, 80.2, 77.5, 73.2, 52.1, 47.4, 46.7, 45.0, 39.7, 38.2, 25.7, 21.4, 19.2, 14.1, 9.7. HRESIMS m/z: calcd for C17H2779Br3NaO4 554.9357 [M + Na]+, found: 554.9368.
3.6. THP Diol 7
Compound 7 was synthesized as described above (see propyl derivative 5). 7: Amorphous solid. = +9.9 (c = 0.57, CHCl3). IR (neat) λmax 3414 (broad) cm−1. 1H-NMR: (400 MHz, CDCl3): δ 4.67 (1H, dd, J = 6.3, 1.7), 4.14 (1H, ddd, J = 12.2, 12.2, 4.5), 3.81–3.67 (4H, overlapped m’s), 3.48 (1H, ddd, J = 8.6, 8.6, 2.3), 3.01 (1H, ddd, J = 12.9, 4.5, 4.5), 2.81 (2H, bs, 2xOH), 2.47 (1H, ddd, J = 12.3, 12.3, 12.3), 2.04 (1H, m), 1.66–1.26 (9H, overlapped m’s), 0.95 (3H, t, J = 7.3), 0.90 (3H, t, J = 6.9). 13C-NMR: (100 MHz, CDCl3): δ 83.8, 81.4, 75.7, 71.3, 59.2, 47.1, 46.9, 45.1, 33.8, 31.7, 25.8, 25.3, 14.0, 9.5. HRESIMS m/z: calcd for C15H2779Br3NaO3 514.9408 [M + Na]+, found: 514.9426.
3.7. THP Diol Acetate 8
Acetic anhydride (0.3 mL) was added to a stirred solution of diol 7 (7.0 mg, 0.014 mmol) in pyridine (0.3 mL), and the mixture stirred at 50 °C. After 3 h the reaction mixture was evaporated under reduced pressure to give diacetate 8 (8.3 mg) as a colorless oil (TLC: n-hexane-EtOAc, 85:15, Rf = 0.54). Pure 8 (7.9 mg, 96%), suitable for the biological assays, was obtained by HPLC purification (eluent: n-hexane-EtOAc, 85:15). 8: = +35.8 (c = 0.12, CHCl3). IR (neat) λmax 1742, 1371, 1217, cm−1. 1H-NMR (700 MHz, CDCl3) δ 5.49 (dd, J = 9.5, 2.0, 1H), 5.09 (ddd, J = 7.7, 6.0, 2.0, 1H), 4.55 (dd, J = 9.4, 1.9, 1H), 4.13 (ddd, J = 12.1, 9.5, 4.5, 1H), 3.72 (ddd, J = 12.1, 10.0, 4.3, 1H), 3.47 (ddd, J = 10.0, 8.6, 2.4, 1H), 3.43 (dd, J = 9.5, 1.9, 1H), 2.96 (ddd, J = 12.9, 4.5, 4.3, 1H), 2.44 (ddd, J = 12.9, 12.1, 12.0, 1H), 2.17 (s, 3H, acetate), 2.13 (s, 3H, acetate), 2.04 (m, 1H), 1.55 (m, 1H), 1.50 (m, 1H), 1.34–1.21 (m, 8H), 0.99 (t, J = 7.4, 3H), 0.86 (t, J = 7.0, 3H). 13C-NMR: (176 MHz, CDCl3): δ 170.7, 170.0, 83.7, 79.4, 74.3, 71.6, 54.8, 47.5, 47.3, 45.0, 31.5 (2C), 25.8, 24.7, 22.4, 21.1, 20.8, 13.9, 9.7. HRESIMS m/z: calcd for C19H3179Br3NaO5 598.9619 [M + Na]+, found: 598.9627.
3.8. THP Epoxyde 9
K2CO3 (3 eq, 2.2 mg, 0.016 mmol), was added to a stirred solution of diacetate 8 (3.0 mg, 0.005 mmol) in MeOH (1 mL), at room temperature. After 48 h AcOH was added up to pH = 6 and the reaction mixture was taken to dryness. The solid residue was partitioned between water and EtOAc and the organic phase was dried and evaporated to give an oil (2.9 mg). TLC analysis revealed still the presence of a trace amount of the starting diol. HPLC separation (eluent: n-hexane-EtOAc, 85:15) gave the pure 7-hydroxy epoxide (1.7 mg, 80%). Acetylation under usual conditions afforded acetate 9 (1.9 mg, 100%) as a colourless oil. 9: = −7.7 (c = 0.21, CHCl3). IR (neat) λmax 1742, 1463, 1371, 1239 cm−1. 1H-NMR (700 MHz, CDCl3) δ 4.89 (ddd, J = 8.7, 8.7, 3.9, 1H), 3.84 (ddd, J = 12.4, 10.0, 4.4, 1H), 3.73 (ddd, J = 12.4, 10.1, 4.4, 1H), 3.51 (dd, J = 10.0, 7.1, 1H), 3.45 (ddd, J = 10.1, 7.3, 2.7, 1H), 3.05 (dd, J = 8.7, 4.1, 1H), 3.02 (dd, J = 7.1, 4.1, 1H), 2.98 (dt, J = 12.4, 4.4, 1H), 2.43 (ddd, J = 12.2, 12.2, 12.0, 1H), 2.11 (s, 3H, acetate), 1.98 (ddq, J = 14.9, 7.4, 2.7, 1H), 1.75–1.52 (m, 3H overlapped), 1.36 (m, 1H), 1.34–1.20 (m, 5H overlapped), 0.95 (t, J = 7.4, 3H), 0.88 (t, J = 7.0, 3H). 13C-NMR: (176 MHz, CDCl3): δ 170.4, 83.0, 80.5, 71.9, 57.7, 56.6, 47.1, 46.1, 45.6, 32.1, 31.8, 25.8, 24.6, 22.5, 21.1, 14.0, 9.0. HRESIMS m/z: calcd for C17H2879Br2NaO4 477.0252 [M + Na]+, found: 477.0238.
3.9. Degraded THP Derivative 10
Crystalline lead tetraacetate (2 eq., 12.5 mg, 0.028 mmol) was added to a solution of diol 7 (7.0 mg, 0.014 mmol) in AcOH (1.0 mL). After 20 min., TLC analysis (n-hexane-EtOAc, 75:25) revealed the disappearance of the starting material and the formation of a slightly less polar substance. After a further 10 min., two drops of ethylene glycol were added and the mixture stirred for 10 min., diluted with water and extracted with CHCl3. The organic layer was washed with a sat. aqueous NaHCO3 solution, dried and evaporated to give 5.3 mg of aldehyde 12 as a smelling oil. NaBH4 (a tip of spatula, excess) was added to a solution of the crude aldehyde 12 (4.0 mg, 0.010 mmol) in EtOH (1 mL), and the suspension stirred at room temperature for 40 min. Then, the excess reagent was destroyed by the addition of a few drops of AcOH, water was added, and the mixture extracted with CHCl3. The organic phase was washed with a sat. aqueous NaHCO3 solution, dried and evaporated to give 4.8 mg of the crude alcohol. HPLC purification of the latter gave 3.8 mg of the pure C7 alcohol.
Acetylation of the above alcohol with Ac2O/pyridine (0.5 mL/0.5 mL) overnight afforded 4.0 mg of the acetyl derivative 10. Filtration of this material on a short pad of silica gel (eluent: n-hexane-EtOAc, 9:1), gave pure acetate 10 (2.8 mg, 45% over three steps) as a colorless oil. 10: = +18.2 (c = 0.19, CHCl3). IR (neat) λmax 1746, 1227 cm−1. 1H-NMR: (700 MHz, CDCl3): δ 4.60 (ddd, J = 8.3, 6.7, 1.8, 1H), 4.43 (dd, J = 11.3, 6.7, 1H), 4.40 (dd, J = 11.3, 8.3, 1H), 4.10 (ddd, J = 12.1, 9.7, 4.5, 1H), 3.75 (ddd, J = 12.0, 10.0, 4.3, 1H), 3.51 (dd, J = 9.7, 1.8, 1H), 3.43 (ddd, J = 10.0, 8.5, 2.5, 1H), 3.01 (ddd, J = 12.1, 4.5, 4.3, 1H), 2.46 (ddd, J = 12.9, 12.1, 12.0, 1H), 2.11 (s, 3H, acetate), 2.03 (ddq, 14.5, 7.4, 2.5 1H), 1.55 (ddq, J = 14.5, 8.5, 7.4, 1H), 0.96 (t, J = 7.4, 3H). 13C-NMR: (176 MHz, CDCl3): δ 170.2, 83.7, 79.3, 64.7, 49.9, 47.5, 46.6, 45.3, 25.8, 20.7, 9.4. HRESIMS m/z: calcd for C11H1779Br3NaO3 456.8626 [M + Na]+, found: 456.8629.
3.10. Lactone 11
PCC (10 mol%, 150 μL of a 0.01 M stock solution in acetonitrile) was added to a vigorously stirred suspension of H5IO6 (15 eq., 0.022 mmol, 49.8 mg) in acetonitrile (100 μL) at room temperature. After 5 min., compound 4 (9.0 mg, 0.015 mmol) dissolved in acetonitrile (100 μL + 2 × 100 μL rinse) was added to give a yellow cloudy mixture. After 16 h TLC analysis (n-hexane-EtOAc, 8:2) revealed the presence of a product at Rf = 0.3. No further progress of the process was observed after 2 h. Therefore, freshly prepared CCP (12 mol%, 180 μL of a 0.01 M stock solution in acetonitrile) was added to the reaction mixture. After 15 min., TLC analysis revealed the further progress of the process, but successive TLC analyses indicated no further consumption of the starting material. Two successive additions of the same amounts of CCP were required to drive the process to completion (overall further 2 h). Then, EtOH (1 mL) was added and the mixture was taken to dryness. Filtration of this material on a short pad of silica gel (eluent: CHCl3-MeOH, 95:5) followed by HPLC purification (n-hexane-EtOAc, 7:3) gave pure acetate 11 (4.1 mg, 55%) as a colourless oil. = +27.7 (c = 0.13, CHCl3). IR (neat) λmax 1794, 1745, 1225 cm−1. 1H-NMR: (700 MHz, CDCl3): δ 5.46 (1H, dd, J = 5.1, 3.3), 4.85 (1H, dd, J = 9.8, 3.3,), 4.75 (1H, dd, J = 9.8, 1.7), 4.19 (1H, ddd, J = 12.1, 9.5, 4.6), 3.75 (1H, ddd, J = 12.0, 10.5, 4.3), 3.42 (1H, ddd, J = 10.5, 8.4, 2.5), 3.26 (1H, dd, J = 9.5, 1.7), 3.01 (1H, ddd, J = 12.9, 4.6, 4.3), 2.95 (1H, dd, J = 18.1, 5.1), 2.69 (1H, d, J = 18.1), 2.41 (1H, ddd, J = 12.9, 12.1, 12.0), 2.17 (3H, s, acetate), 2.04 (1H, m), 1.59 (1H, m), 0.96 (3H, t, J = 7.4). 13C-NMR: (176 MHz, CDCl3): δ 171.9, 169.8, 83.7, 83.0, 79.3, 69.5, 49.8, 46.7, 46.1, 44.9, 37.9, 25.7, 21.0, 9.5. HRESIMS m/z: calcd for C14H1979Br3NaO5 526.8680 [M + Na]+, found: 525.8671.
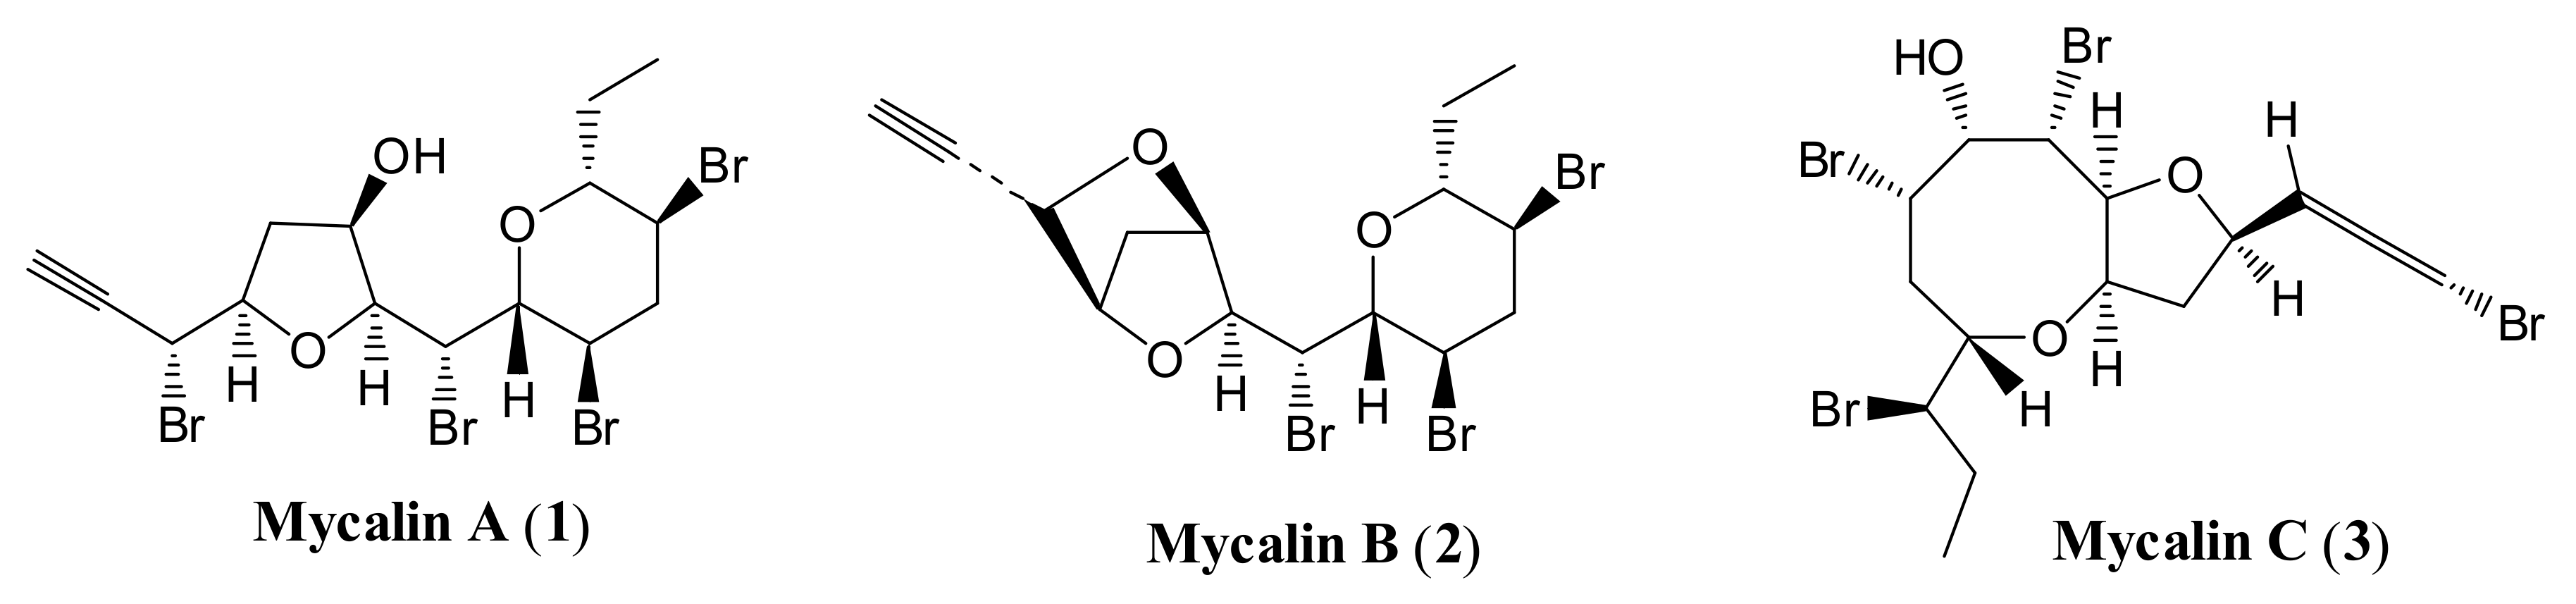
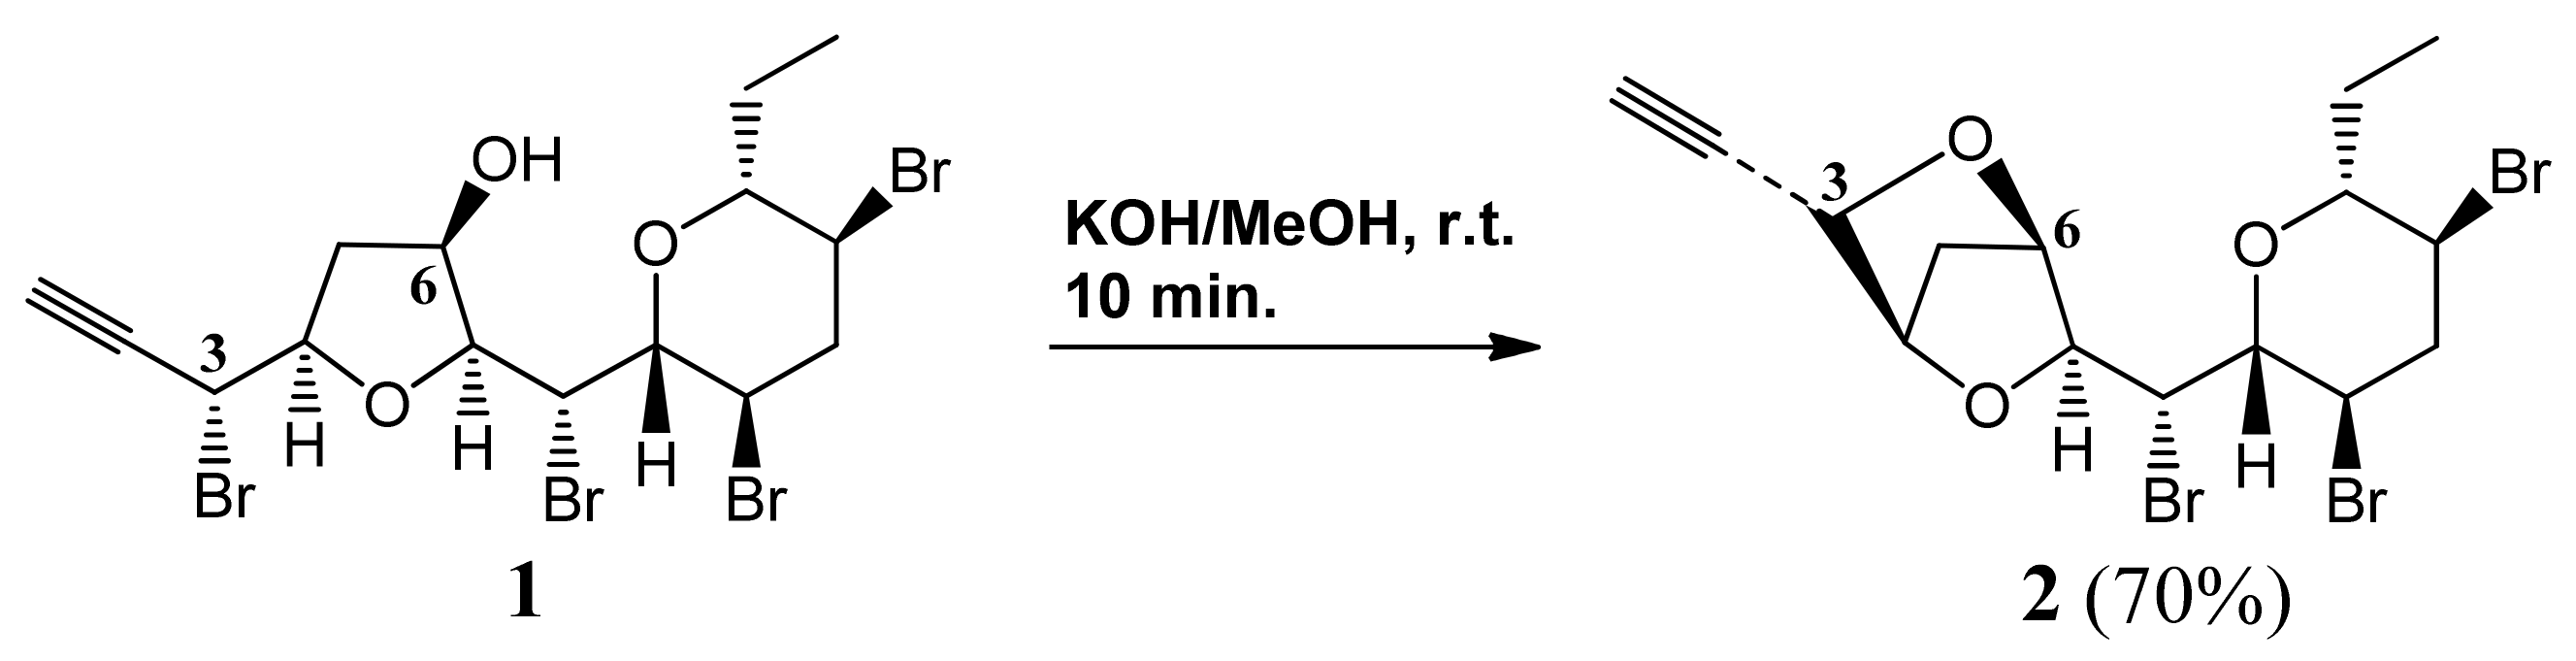
3.11. Mycalin B 2
KOH (excess) was added to a stirred solution of 1 (2.5 mg, 0.044 mmol) in MeOH (0.5 mL). After 10 min AcOH was added up to neutrality. The mixture was taken to dryness, the residue was partitioned between water and EtOAc and the organic phase was dried and evaporated. HPLC separation of the crude (eluent: n-hexane-EtOAc, 8:2) gave pure 2 (1.5 mg, 70%) as a colourless oil. 2: For the , IR and MS (mass spectrometry) data see refs. 5 and 8. 1H-NMR: (400 MHz, CDCl3): δ 4.60 (1H, bd, J = 2.4), 4.55 (1H, bd, J = 2.1), 4.51 (1H, bd, J = 2.2), 4.39 (1H, dd, J = 8.9, 2.0), 4.24 (1H, bd, J = 8.9), 4.13 (1H, ddd, J = 12.7, 9.6, 4.4), 3.73 (1H, ddd, J = 12.2, 9.9, 4.5), 3.58 (1H, dd, J = 9.5, 2.0), 3.38 (1H, ddd, J = 9.5, 9.5, 2.3), 3.00 (1H, ddd, J = 12.8, 4.3, 4.3), 2.59 (1H, d, J = 2.1), 2.44 (1H, ddd, J = 12.3, 12.3, 12.3), 2.38 (1H, dd, J = 10.6, 2.9), 2.10 (1H, dd, J = 10.6, 2.3), 2.04 (1H, m), 1.52 (1H, m), 0.92 (3H, t, J = 7.3). 13C-NMR: (100 MHz, CDCl3): δ 86.0, 83.9, 81.0, 80.7, 79.5, 76.5, 76.1, 73.6, 56.1, 47.5, 46.5, 45.1, 36.6, 25.8, 9.8.
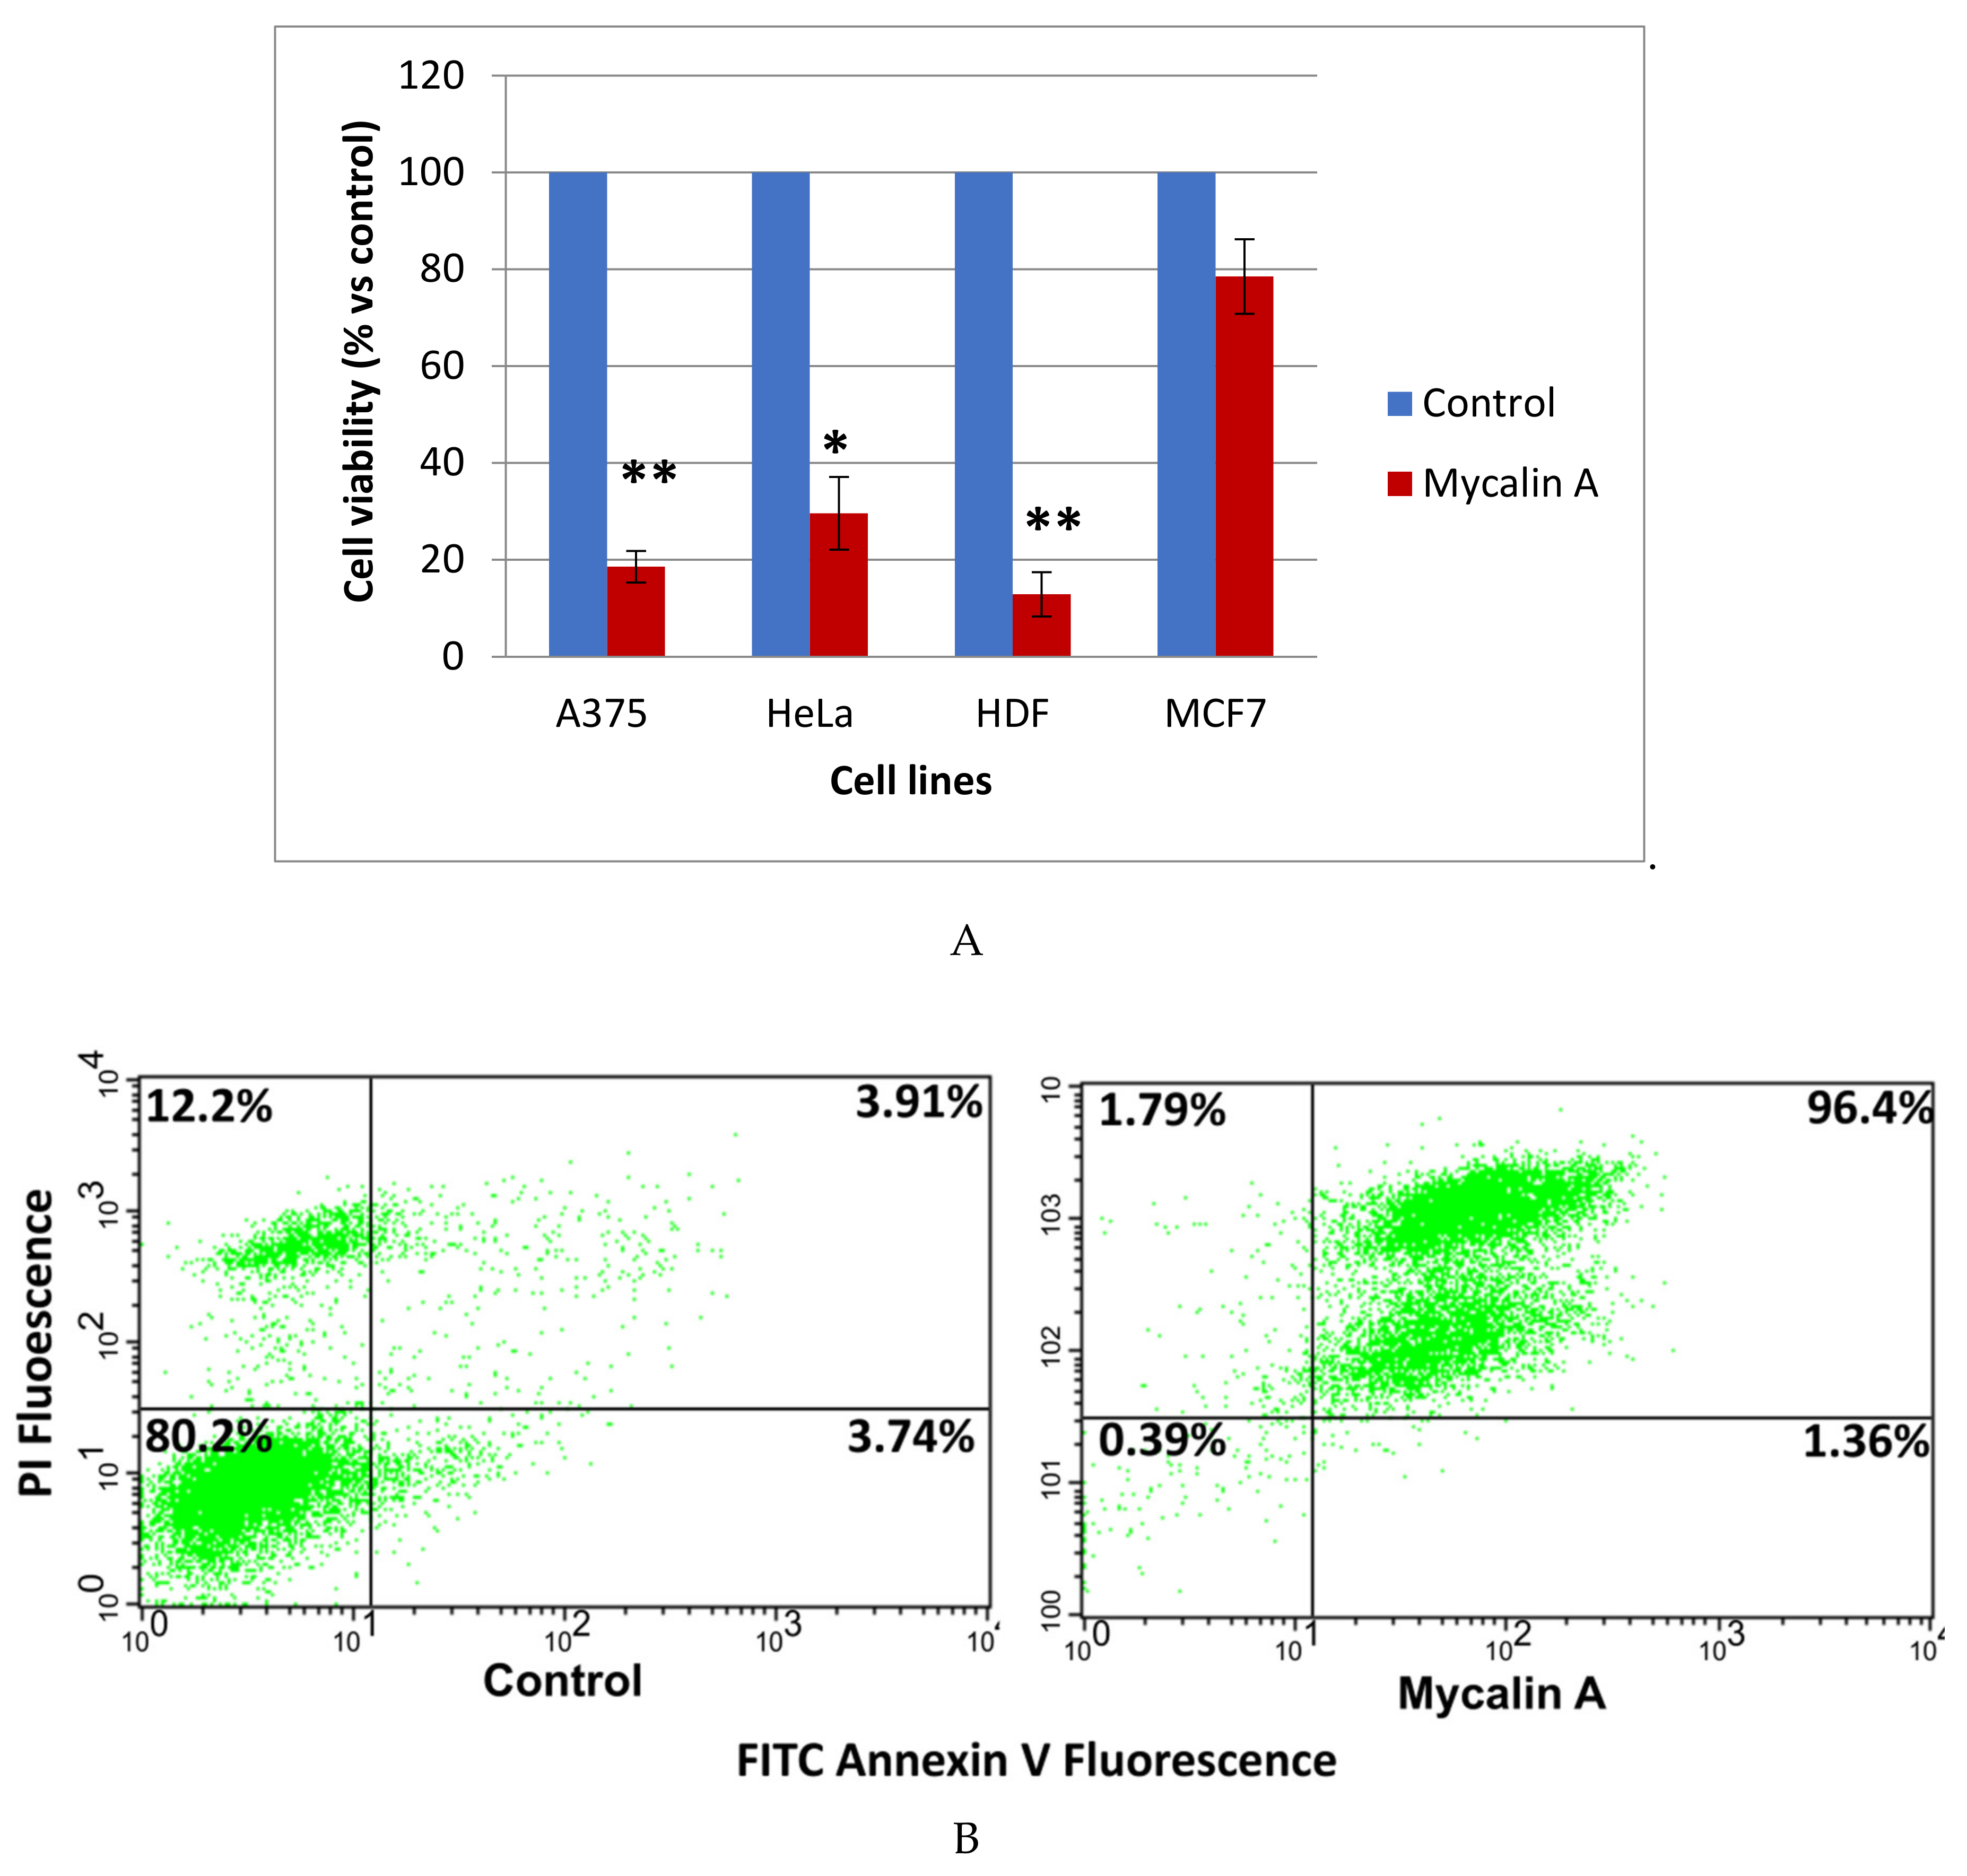
3.12. Cell Lines and Culture Conditions
The human cervical adenocarcinoma (HeLa), human breast adenocarcinoma (MCF-7) and human malignant melanoma (A375) cell lines were from ATCC (U.S.). The normal human dermal fibroblasts (HDF) were kindly provided by Dr. Annalisa Tito (Arterra, Biosciences). The cells were grown in DMEM (Dulbecco’s Modified Eagle Medium) supplemented with 10% fetal bovine serum (FBS), 1% glutamine, 100 U/mL penicillin and 100 µg/mL streptomycin (Euroclone, Milan, Italy) and maintained in humidified air containing 5% CO2, at 37 °C.
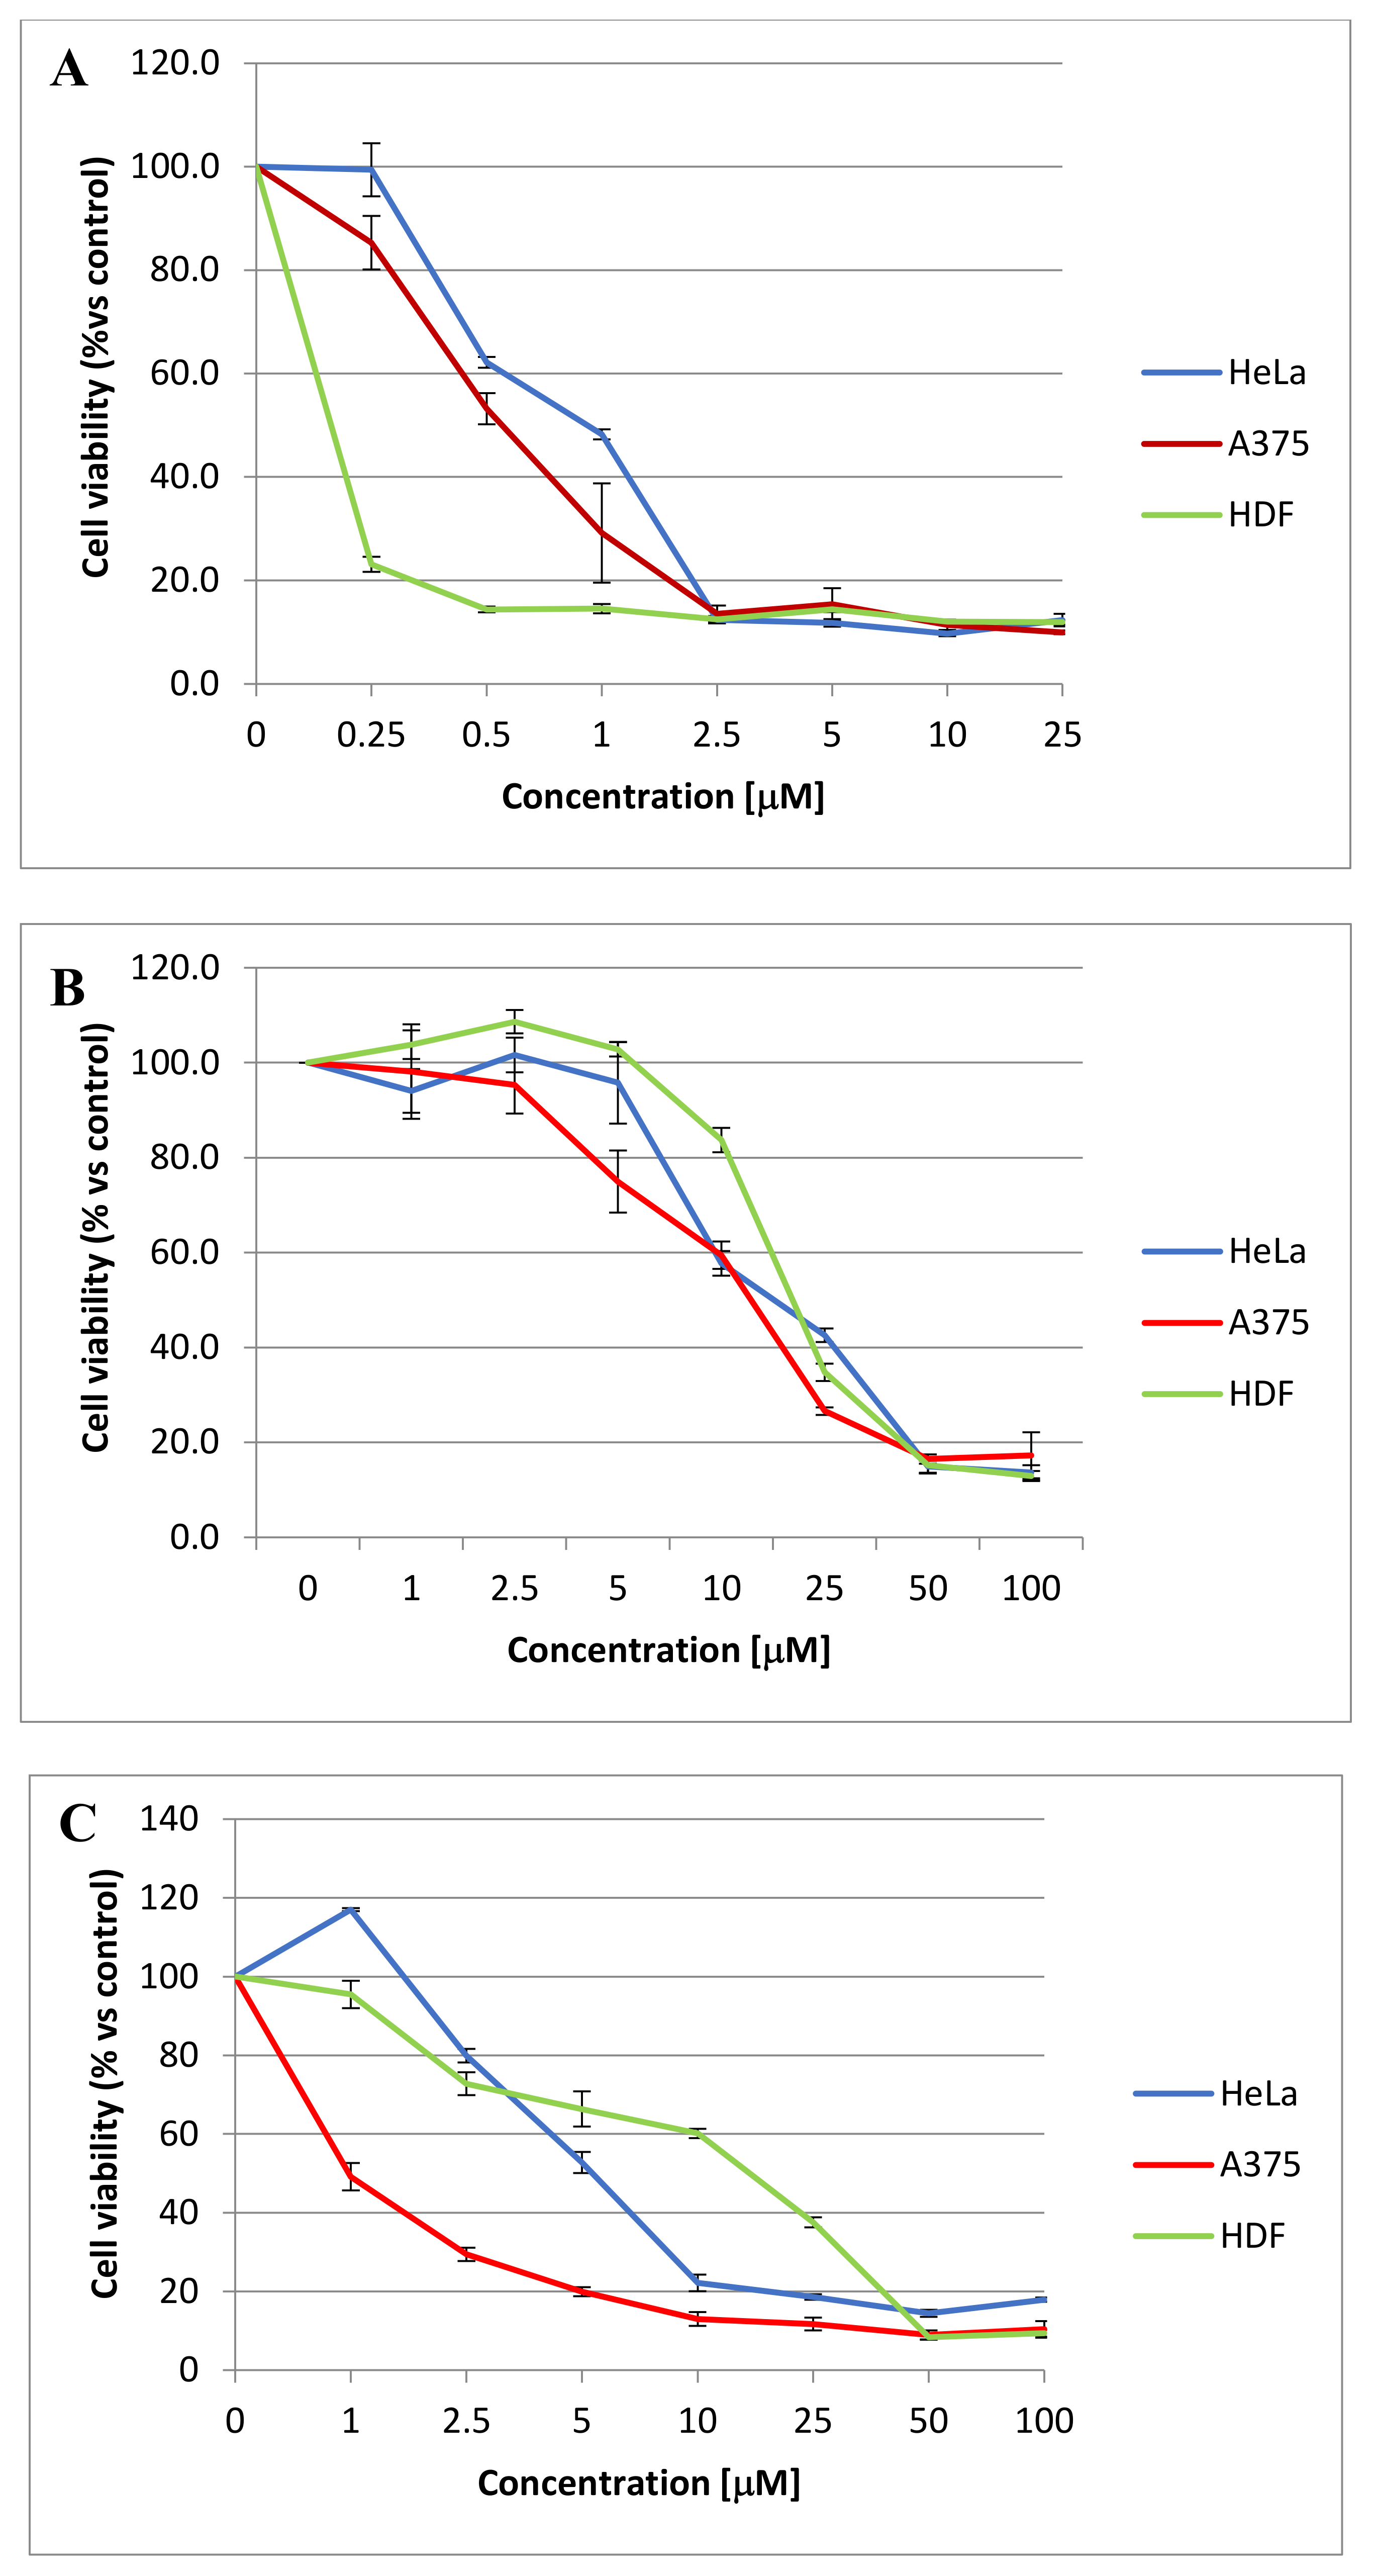
3.13. Cell Proliferation Assay
The cells were plated at a density of 1200 cells/well for A375, 1000 cells/well for HeLa and 2000 cells/well for HDF and MCF-7, in 96-well microplates (Corning). After 24 h incubation, the cells were treated with different concentrations of each of the compounds
1,
2 and
4–11, previously solubilized in DMSO (vehicle). The cell proliferation was determined after 48 h of treatment by using MTT (Sigma Aldrich, Milan, Italy) as previously reported. The plates were then analyzed by using a microplate reader (Enspire, Perkin Elmer, Cambridge, MA, USA) at 570 nm. The mean value ± SE of the adherent cells for each treatment was expressed as the relative percentage of the cell number with respect to the cells treated with the vehicle (control). Statistical differences were determined by the Student’s test, paired, two-sided. All the experiments were performed at least in triplicate and repeated at least 3 times; a
p value less than 0.05 was considered to be significative. The IC
50 values were obtained by the Prism 6.01 software (GraphPad San Diego, CA, U.S.) by extrapolating them from the dose–response curves data [
18].
3.14. Apoptosis Experiments
The apoptosis assays were performed on the A375 cells seeded at a density of 1x10
5 cells/well in 6 well plates and incubated with compounds
1,
4,
5,
and 11 at 37 °C and at 10 µM concentration for 48 h. The apoptosis was then analysed by staining with annexin V/FITC and propidium iodine (PI) (eBioscience). Briefly, after incubation, the cells were detached with accutase solution (eBioscience), harvested and washed with cold PBS [
19]. Subsequently, the cells were treated following the manufacturer’s instructions. The percentage of cell undergoing apoptosis or necrosis was quantified using a flow cytometer (Becton Dickinson, San Diego, CA, U.S.) equipped with the Cell Quest software version 3.5.1

 ,
, 


