
Alterations in Inflammatory Markers and Cognitive Ability after Treatment of Pediatric Obstructive Sleep Apnea
 , , , and
Abstract
:1. Introduction
2. Materials and Methods
- Evaluation of body mass index (BMI): BMI was calculated as weight (kg) divided by the square of height (m2) and was interpreted according to the International Obesity Task Force (IOTF) BMI cut-offs according to the percentile of BMI adjusted for age and gender [8].
- Pediatric Sleep Questionnaire (PSQ) using the sleep-related breathing disorders scale, which consists of 3 domains including 22 items with three responses to each item: yes (=1), no (=0), and do not know = missed answer [9].
- Neurocognitive Assessments using the NEPSY II score which is designed to assess six domains, where each domain was expressed as a scaled score, with lower scores indicating cognitive dysfunction [10].
- Otorhinolaryngologic assessment variables:
- v.
- Laboratory investigation: venous blood samples (5 mL) were collected for ELISA estimation of serum levels of tumor necrosis factor-α (TNF-α), interleukin (IL)-6 and 1β.
3. Results
4. Discussion
5. Conclusions
Author Contributions
Funding
Institutional Review Board Statement
Informed Consent Statement
Data Availability Statement
Conflicts of Interest
References
- Kemstach, V.V.; Korostovtseva, L.; Golovkova-Kucheriavaia, M.; Bochkarev, M.; Sviryaev, Y.; Alekhin, A. Obstructive sleep apnea syndrome and cognitive impairment. Zh. Nevrol. Psikhiatr. Im. S.S. Korsakova 2020, 120, 90–95. [Google Scholar] [CrossRef] [PubMed]
- Thompson, C.; Legault, J.; Moullec, G.; Martineau-Dussault, M.; Baltzan, M.; Cross, N.; Dang-Vu, T.; Gervais, N.; Einstein, G.; Hanly, P.; et al. Association between risk of obstructive sleep apnea, inflammation and cognition after 45 years old in the Canadian Longitudinal Study on Aging. Sleep Med. 2022, 191, 21–30. [Google Scholar] [CrossRef] [PubMed]
- Di Palmo, E.; Filice, E.; Cavallo, A.; Caffarelli, C.; Maltoni, G.; Miniaci, A.; Ricci, G.; Pession, A. Childhood Obesity and Respiratory Diseases: Which Link? Children 2021, 8, 177. [Google Scholar] [CrossRef] [PubMed]
- Dayyat, E.; Kheirandish-Gozal, L.; Gozal, D. Childhood Obstructive Sleep Apnea: One or Two Distinct Disease Entities? Sleep Med. Clin. 2007, 2, 433–444. [Google Scholar] [CrossRef] [PubMed] [Green Version]
- Fukuda, K.; Yasudo, H.; Ohta, N.; Narumi, H.; Abe, N.; Tarumoto, S.; Yamashita, H.; Ichihara, K.; Ohga, S.; Hasegawa, S. Time-Course Evaluation of Body Mass Index in Japanese Children with Obstructive Sleep Apnea Syndrome after Adenotonsillectomy: A Three-Years Follow-Up Study. Front. Pediatr. 2020, 8, 22. [Google Scholar] [CrossRef] [PubMed]
- Brockmann, P.E.; Gozal, D. Neurocognitive Consequences in Children with Sleep Disordered Breathing: Who Is at Risk? Children 2022, 9, 1278. [Google Scholar] [CrossRef] [PubMed]
- Adelantado-Renau, M.; Esteban-Cornejo, I.; Rodriguez-Ayllon, M.; Cadenas-Sanchez, C.; Gil-Cosano, J.; Mora-Gonzalez, J.; Solis-Urra, P.; Verdejo-Román, J.; Aguilera, C.; Escolano-Margarit, M.; et al. Inflammatory biomarkers and brain health indicators in children with overweight and obesity: The Active Brains project. Brain Behav. Immun. 2019, 81, 588–597. [Google Scholar] [CrossRef]
- Cole, T.J.; Lobstein, T. Extended international (IOTF) body mass index cut-offs for thinness, overweight and obesity. Pediatr. Obes. 2012, 7, 284–294. [Google Scholar] [CrossRef]
- Chervin, R.D.; Hedger, K.; Dillon, J.E.; Pituch, K.J. Pediatric sleep questionnaire (PSQ): Validity and reliability of scales for sleep-disordered breathing, snoring, sleepiness, and behavioral problems. Sleep Med. 2000, 1, 21–32. [Google Scholar] [CrossRef]
- Ahmad, S.A.; Warriner, E.M. Review of the NEPSY: A developmental neuropsychological assessment. Clin. Neuropsychol 2001, 15, 240–249. [Google Scholar] [CrossRef]
- Brodsky, L. Modern assessment of tonsils and adenoids. Pediatr. Clin. N. Am. 1989, 36, 1551–1569. [Google Scholar] [CrossRef] [PubMed]
- Samsoon, G.L.; Young, J.R. Difficult tracheal intubation: A retrospective study. Anaesthesia 1987, 42, 487–490. [Google Scholar] [CrossRef] [PubMed]
- Berry, R.; Quan, S.F.; Abreu, A. The AASM Manual for the Scoring of Sleep and Associated Events Rules, Terminology, and Technical Specifications. Version 2.6.0. Darien, (L). American Academy of Sleep Medicine. 2020. Available online: https://aasm.org/aasm-updated-version-sleep-scoring-manual (accessed on 5 January 2023).
- Zhao, J.; Han, S.; Zhang, J.; Wang, G.; Wang, H.; Xu, Z.; Tai, J.; Peng, X.; Guo, Y.; Liu, H.; et al. Association between mild or moderate obstructive sleep apnea-hypopnea syndrome and cognitive dysfunction in children. Sleep Med. 2018, 50, 132–136. [Google Scholar] [CrossRef]
- Wu, P.; Xu, Z. Research progress in the impact of obstructive sleep apnea syndrome on cognitive function in children. Chin. J. Pediatr. 2021, 59, 254–256. [Google Scholar]
- Hunter, S.J.; Gozal, D.; Smith, D.L.; Philby, M.F.; Kaylegian, J.; Kheirandish-Gozal, L. Effect of Sleep-Disordered Breathing Severity on Cognitive Performance Measures in a Large Community Cohort of Young School-Aged Children. Am. J. Respir. Crit. Care Med. 2016, 194, 739–747. [Google Scholar] [CrossRef] [Green Version]
- Taylor, H.; Bowen, S.; Beebe, D.; Hodges, E.; Amin, R.; Arens, R.; Chervin, R.; Garetz, S.; Katz, E.; Moore, R.; et al. Cognitive Effects of Adenotonsillectomy for Obstructive Sleep Apnea. Pediatrics 2016, 138, e20154458. [Google Scholar] [CrossRef] [Green Version]
- Au, C.; Chan, K.; Lee, D.; Leung, N.; Chow, S.; Chow, J.; Wing, Y.; Li, A.M. Effect of surgical intervention for mild childhood obstructive sleep apnea on attention and behavioral outcomes: A randomized controlled study. Respirology 2021, 26, 690–699. [Google Scholar] [CrossRef]
- Yu, Y.; Chen, Y.; Liu, L.; Yu, Z.; Luo, X. Neuropsychological functioning after adenotonsillectomy in children with obstructive sleep apnea: A meta-analysis. J. Huazhong Univ. Sci. Technol. Med. Sci. 2017, 37, 453–461. [Google Scholar] [CrossRef]
- Di Mauro, P.; Cocuzza, S.; Maniaci, A.; Ferlito, S.; Rasà, D.; Anzivino, R.; Vicini, C.; Iannella, G.; La Mantia, I. The Effect of Adenotonsillectomy on Children’s Behavior and Cognitive Performance with Obstructive Sleep Apnea Syndrome. State Art. Child. 2021, 8, 921. [Google Scholar] [CrossRef]
- Shan, S.; Wang, S.; Yang, X.; Liu, F.; Xiu, L. Effect of adenotonsillectomy on the growth, development, and comprehensive cognitive abilities of children with obstructive sleep apnea: A prospective single-arm study. BMC Pediatr. 2022, 22, 41. [Google Scholar] [CrossRef]
- Waters, K.; Chawla, J.; Harris, M.; Heussler, H.; Black, R.; Cheng, A.; Lushington, K. Cognition after Early Tonsillectomy for Mild OSA. Pediatrics 2020, 145, e20191450. [Google Scholar] [CrossRef] [PubMed]
- Wali, S.; Manzar, D.; Abdelaziz, M.; Alshomrani, R.; Alhejaili, F.; Al-Mughales, J.; Alamoudi, W.; Gozal, D. Putative associations between inflammatory biomarkers, obesity, and obstructive sleep apnea. Ann. Thorac. Med. 2021, 16, 329–336. [Google Scholar] [CrossRef] [PubMed]
- Bhatt, S.; Guleria, R.; Kabra, S. Metabolic alterations, and systemic inflammation in overweight/obese children with obstructive sleep apnea. PLoS ONE 2021, 16, e0252353. [Google Scholar] [CrossRef] [PubMed]
- Kang, K.; Weng, W.; Lee, P.; Hsu, W. C-reactive protein in children with obstructive sleep apnea and effects of adenotonsillectomy. Auris Nasus Larynx 2022, 49, 92–99. [Google Scholar] [CrossRef]
- Abulikemu, Y.; Abulajang, T.; Ailigen, A.; Tang, L. Analysis of propensity score matching between inflammatory factor levels and gene polymorphisms and susceptibility to obstructive sleep apnea. J. Clin. Otorhinolaryngol. Head Neck Surg. 2021, 35, 728–732. [Google Scholar]
- Rocchi, C.; Valentina, C.; Totaro, V.; Broggi, S.; Lattanzi, S.; Viticchi, G.; Falsetti, L.; Silvestrini, M.; Buratti, L. Inflammation markers in moderate and severe obstructive sleep apnea: The influence of sex. Sleep Breath. 2022. published online ahead of print. [Google Scholar] [CrossRef]
- Kheirandish-Gozal, L.; Gozal, D. Pediatric OSA Syndrome Morbidity Biomarkers: The Hunt Is Finally On! Chest 2017, 151, 500–506. [Google Scholar] [CrossRef] [Green Version]
- Andersen, I.; Holm, J.; Homøe, P. Impact of weight-loss management on children and adolescents with obesity and obstructive sleep apnea. Int. J. Pediatr. Otorhinolaryngol. 2019, 123, 57–62. [Google Scholar] [CrossRef]


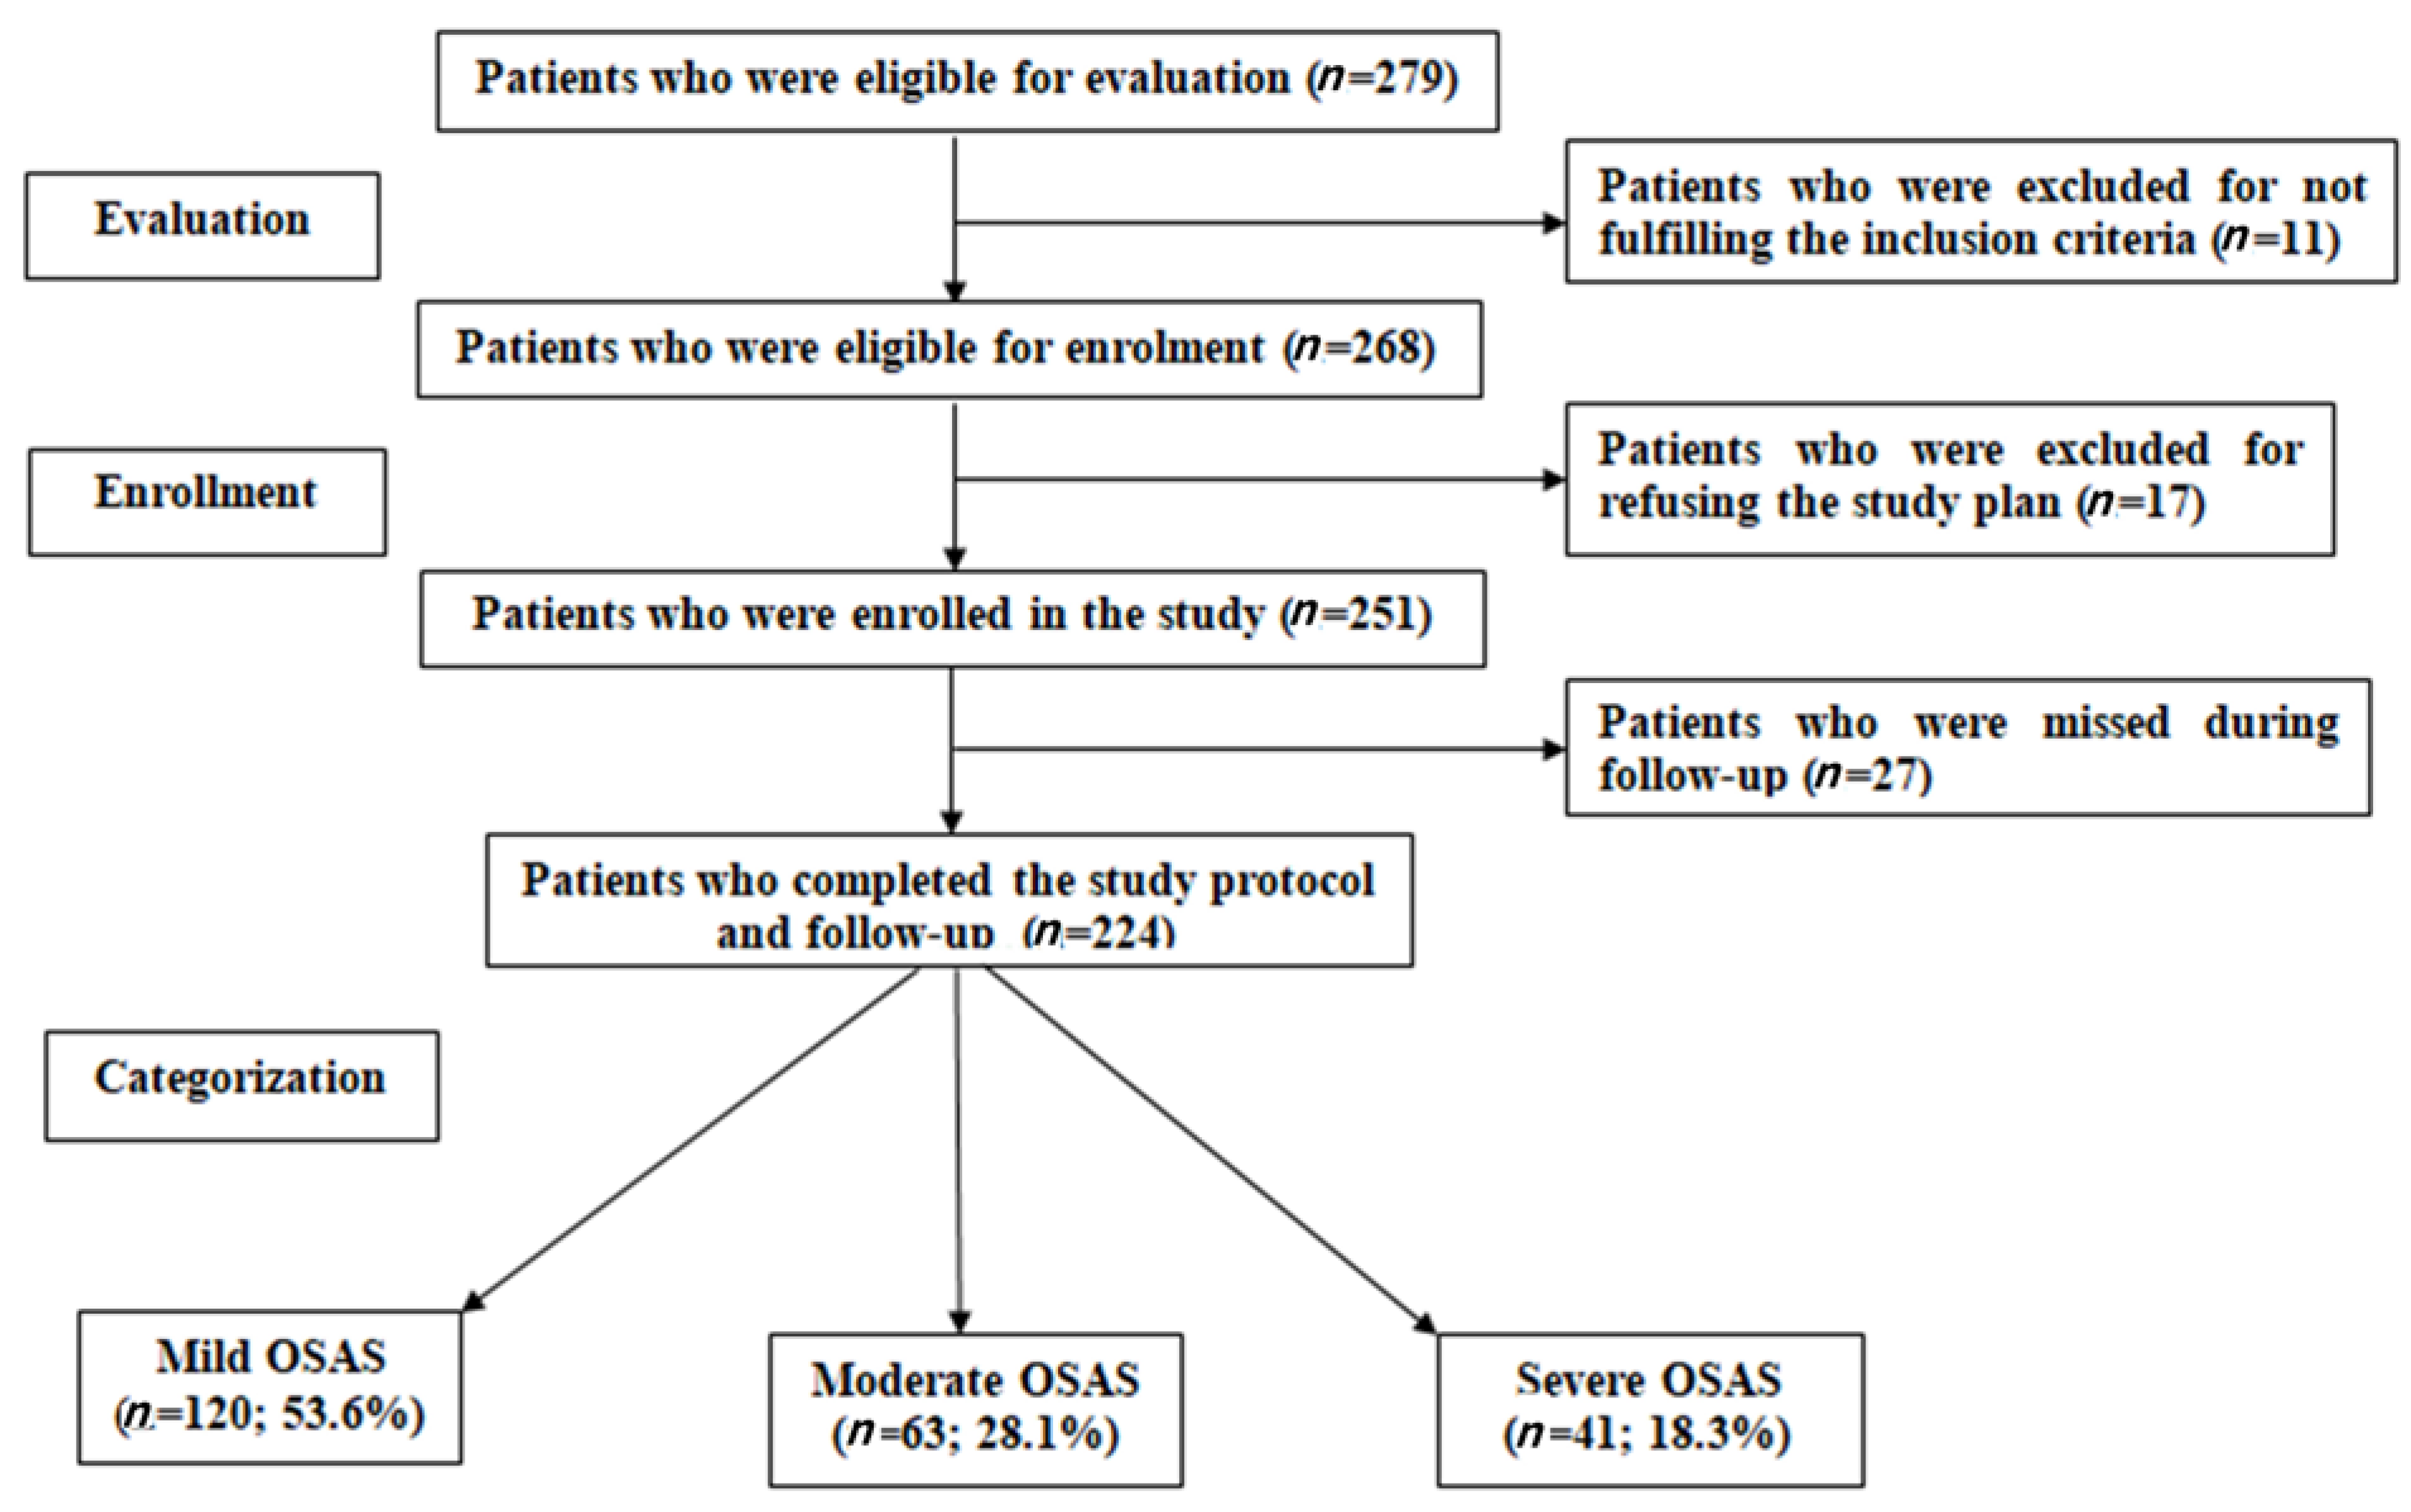
| Group Variables (mean ± SD) | Mild OSAS (n = 120; 53.6%) | Moderate OSAS (n = 63; 28.1%) | Severe OSAS (n = 41; 18.3%) | Significance of Difference between Groups | |||
|---|---|---|---|---|---|---|---|
| p1 | p2 | p3 | |||||
| AHI | 3.2 [2.7–3.7] | 7.9 [6.9–8.6] | 14 [12.7–16.7] | - | - | - | |
| Age (years) | 8.3 ± 2 | 8.7 ± 2 | 8.3 ± 2.1 | 0.859 | 0.983 | 0.546 | |
| Gender | Males | 64 (53.3%) | 39 (61.9%) | 24 (58.5%) | 0.267 | 0.563 | 0.731 |
| Females | 56 (46.7%) | 24 (38.1%) | 17 (41.5%) | ||||
| BMI grades | Average | 24 (20%) | 0 | 0 | 0.0001 | 0.0074 | 0.267 |
| Overweight | 41 (34.2%) | 18 (28.6%) | 16 (39%) | ||||
| Obese | 55 (45.8%) | 45 (71.4%) | 25 (61%) | ||||
| Mean BMI (kg/m2) | 21.8 ± 3.2 | 23.8 ± 1.9 | 24 ± 1.8 | 0.0001 | 0.0001 | 0.902 | |
| Tonsillar hypertrophy | Grade 1 | 2 (1.7%) | 0 | 0 | 0.444 | 0.739 | 0.448 |
| Grade 2 | 31 (25.8%) | 21 (33.3%) | 9 (22%) | ||||
| Grade 3 | 56 (46.7%) | 24 (38.1%) | 19 (46.3%) | ||||
| Grade 4 | 31 (25.8%) | 18 (28.6%) | 13 (31.7%) | ||||
| Adenoid hypertrophy | No | 10 (8.3%) | 2 (3.2%) | 0 | 0.272 | 0.212 | 0.079 |
| Grade 1 | 7 (5.8%) | 3 (4.8%) | 3 (7.3%) | ||||
| Grade 2 | 46 (44.2%) | 34 (53.9%) | 12 (29.2%) | ||||
| Grade 3 | 42 (35%) | 19 (30.2%) | 20 (48.9%) | ||||
| Grade 4 | 15 (12.5%) | 5 (7.9%) | 6 (14.6%) | ||||
| Modified Mallampati score | Class 1 | 63 (52.5%) | 34 (54%) | 16 (39.1%) | 0.074 | 0.0176 | 0.447 |
| Class 2 | 44 (36.7%) | 15 (23.8%) | 12 (29.2%) | ||||
| Class 3 | 9 (7.5%) | 12 (19%) | 10 (24.4%) | ||||
| Class 4 | 4 (3.3%) | 2 (3.2%) | 3 (7.3%) | ||||
| Group | Variables (mean ± SD) | Mild OSAS (n = 120; 53.6%) | Moderate OSAS (n = 63; 28.1%) | Severe OSAS (n = 41; 18.3%) | Significance of Difference between Groups | ||
|---|---|---|---|---|---|---|---|
| p1 | p2 | p3 | |||||
| Frequency of residual OSAS | 9 (7.5%) | 11 (17.5%) | 13 (31.7%) | 0.04 | 0.001 | 0.092 | |
| Pediatric sleep questionnaire | Baseline | 9.4 ± 1.9 | 9.7 ± 2.8 | 11.1 ± 2.7 | 0.692 | 0.002 | 0.005 |
| End of follow-up | 1.1 ± 1 | 1.4 ± 1.3 | 1.9 ± 1.2 | 0.192 | 0.002 | 0.047 | |
| p4 Value | <0.001 | <0.001 | <0.001 | ||||
| Cognitive function Assessments | Baseline | 9 ± 2.1 | 7.6 ± 1.8 | 6.9 ± 1.7 | 0.004 | <0.001 | 0.096 |
| End of follow-up | 10.1 ± 2.2 | 9.4 ± 1.9 | 9.1 ± 1.8 | 0.137 | 0.030 | 0.798 | |
| p4 Value | 0.001 | <0.001 | <0.001 | ||||
| % Of change | 12.9 ± 10 | 25.2 ± 17.8 | 36.1 ± 19.9 | 0.002 | <0.001 | 0.002 | |
| Cognitive outcome | Deteriorated | 0 | 0 | 0 | 0.127 | 0.237 | 0.602 |
| No change | 28 (23.3%) | 10 (15.9%) | 5 (12.2%) | ||||
| Improved | 92 (76.7%) | 53 (84.1%) | 36 (87.8%) | ||||
| Serum Variables (mean ± SD) | Group | Mild OSAS (n = 120; 53.6%) | Moderate OSAS (n = 63; 28.1%) | Severe OSAS (n = 41; 18.3%) | Significance of Difference between Groups | ||
|---|---|---|---|---|---|---|---|
| p1 | p2 | p3 | |||||
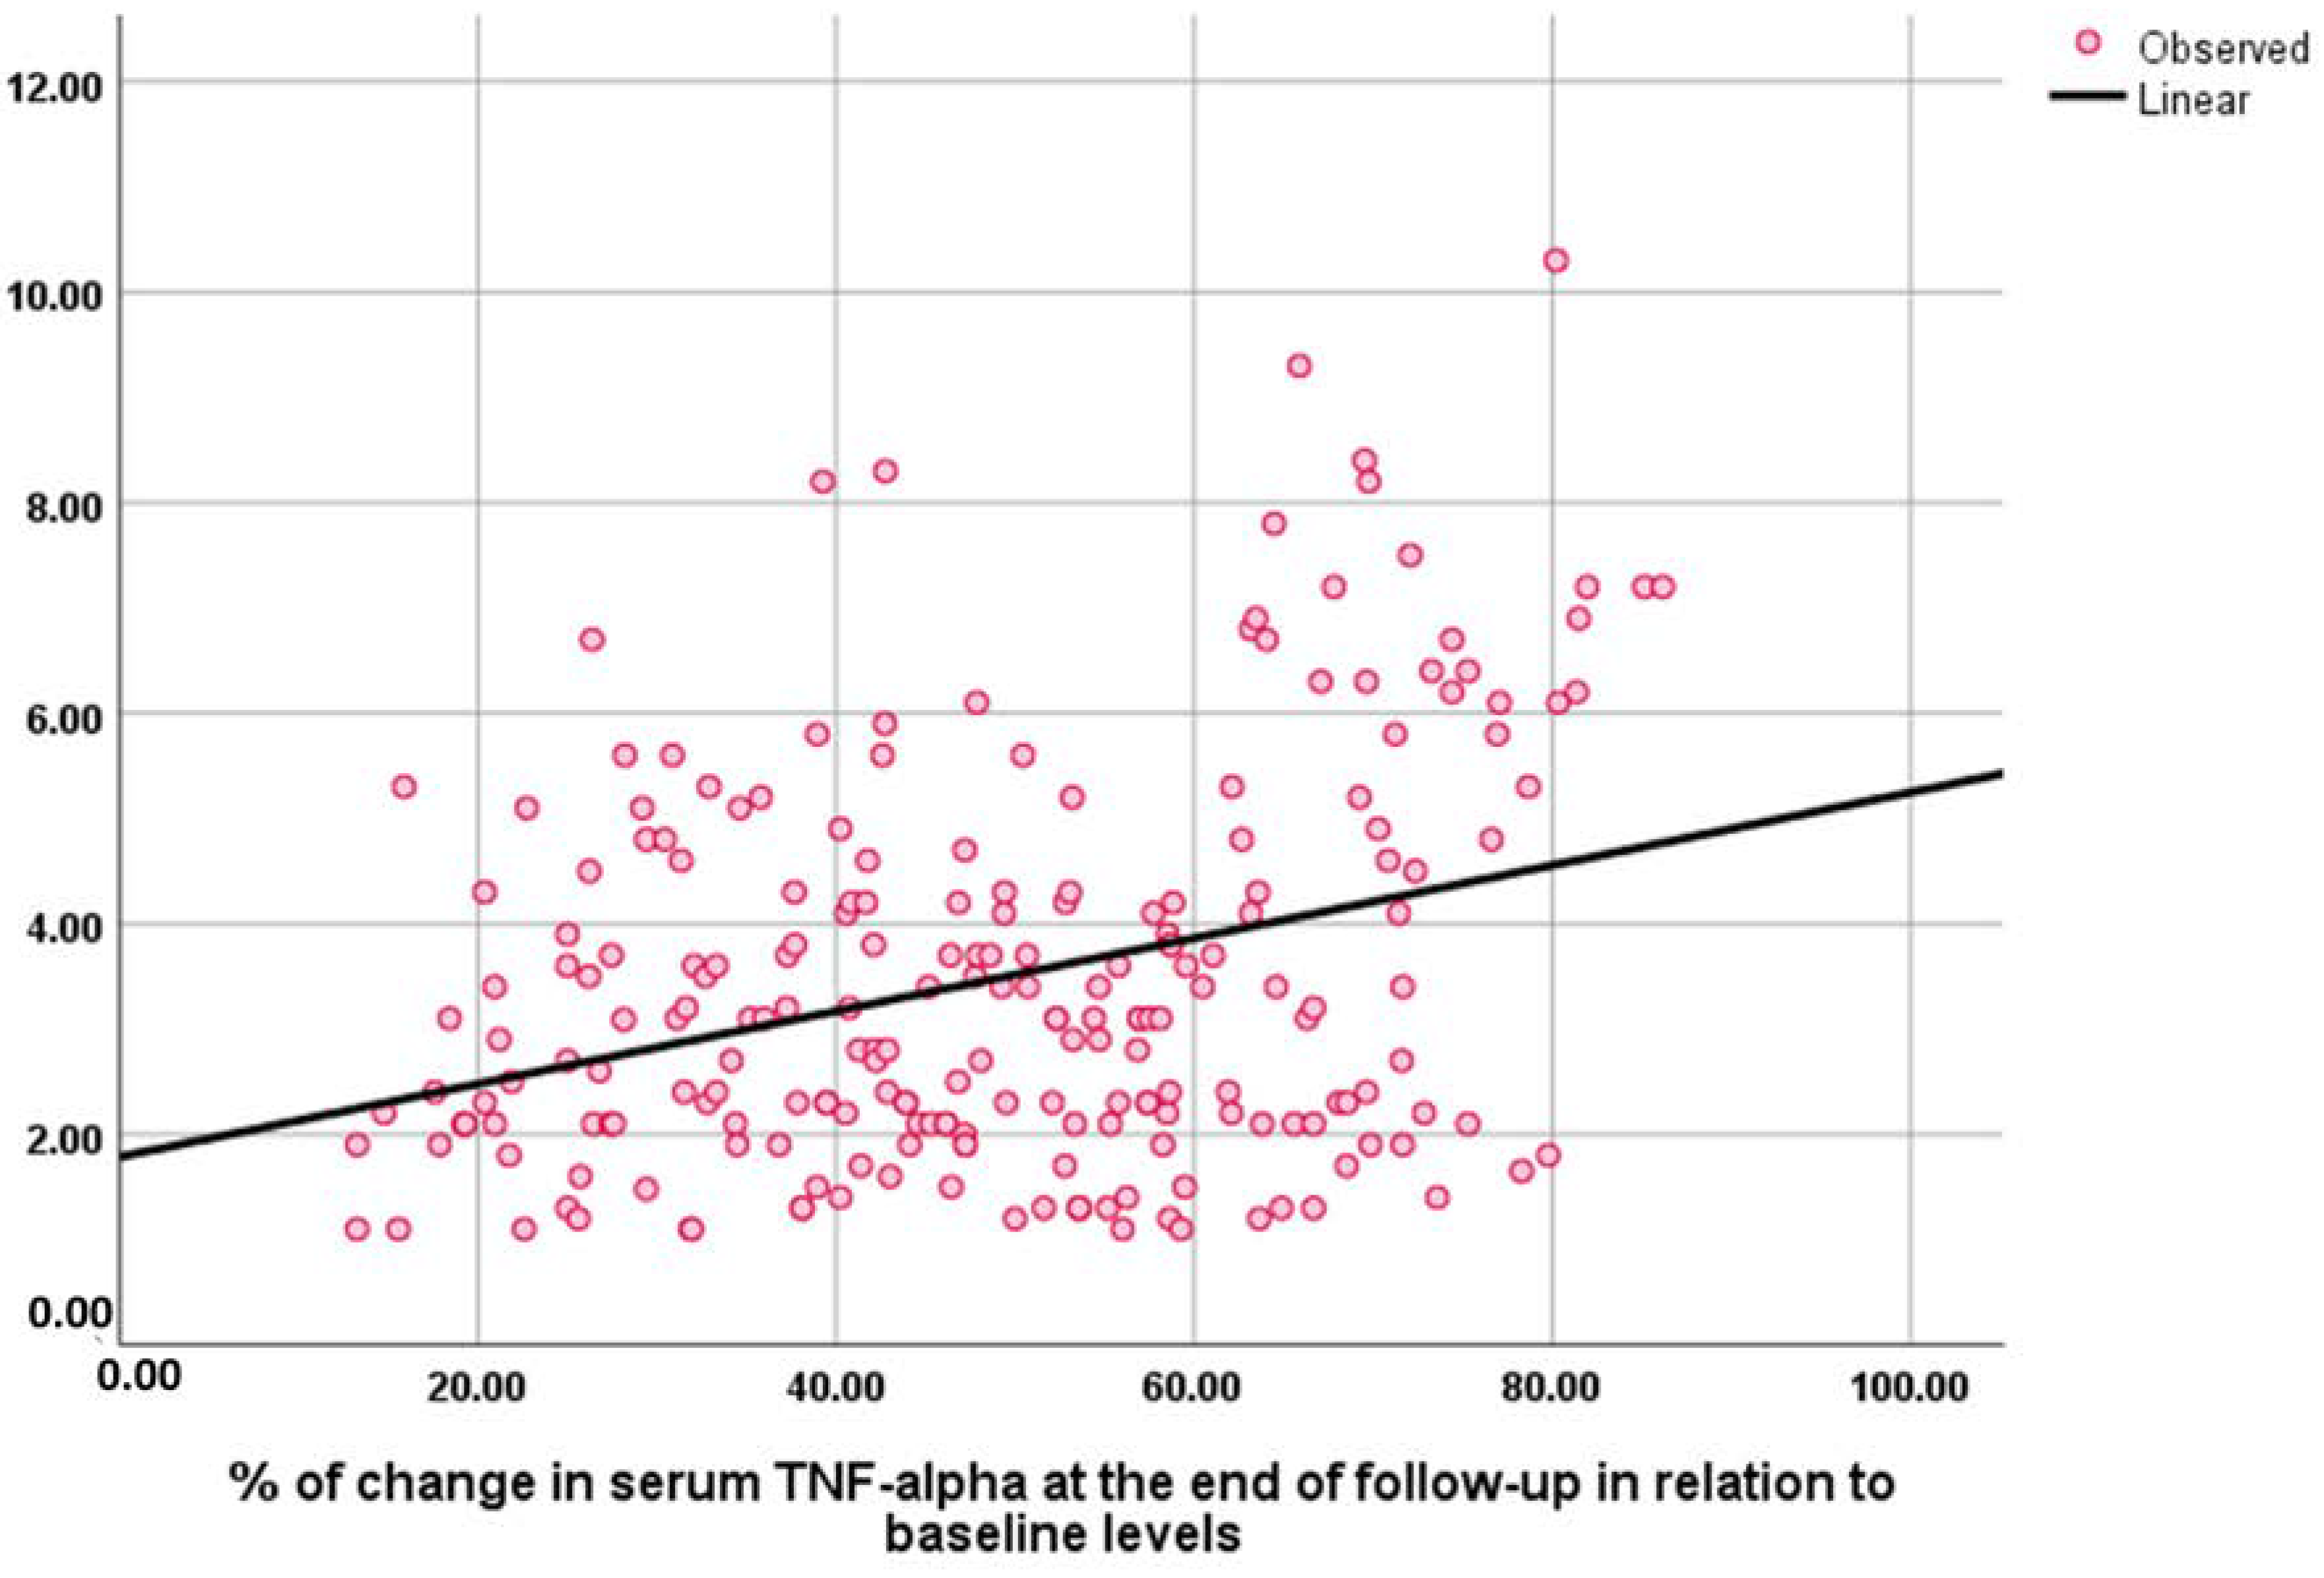
| TNF-α | Baseline | 6.14 ± 2.36 | 7.23 ± 1.6 | 8.38 ± 3.73 | 0.040 | <0.001 | 0.031 |
| End of follow-up | 3.15 ± 1.6 | 3.81 ± 1.75 | 3.91 ± 2.5 | 0.109 | 0.055 | 0.869 | |
| p4 Value | <0.001 | <0.001 | <0.001 | ||||
| % Of change | 47.2 ± 17.9 | 46.8 ± 20.7 | 54.4 ± 12.8 | 0.052 | <0.001 | 0.0002 | |
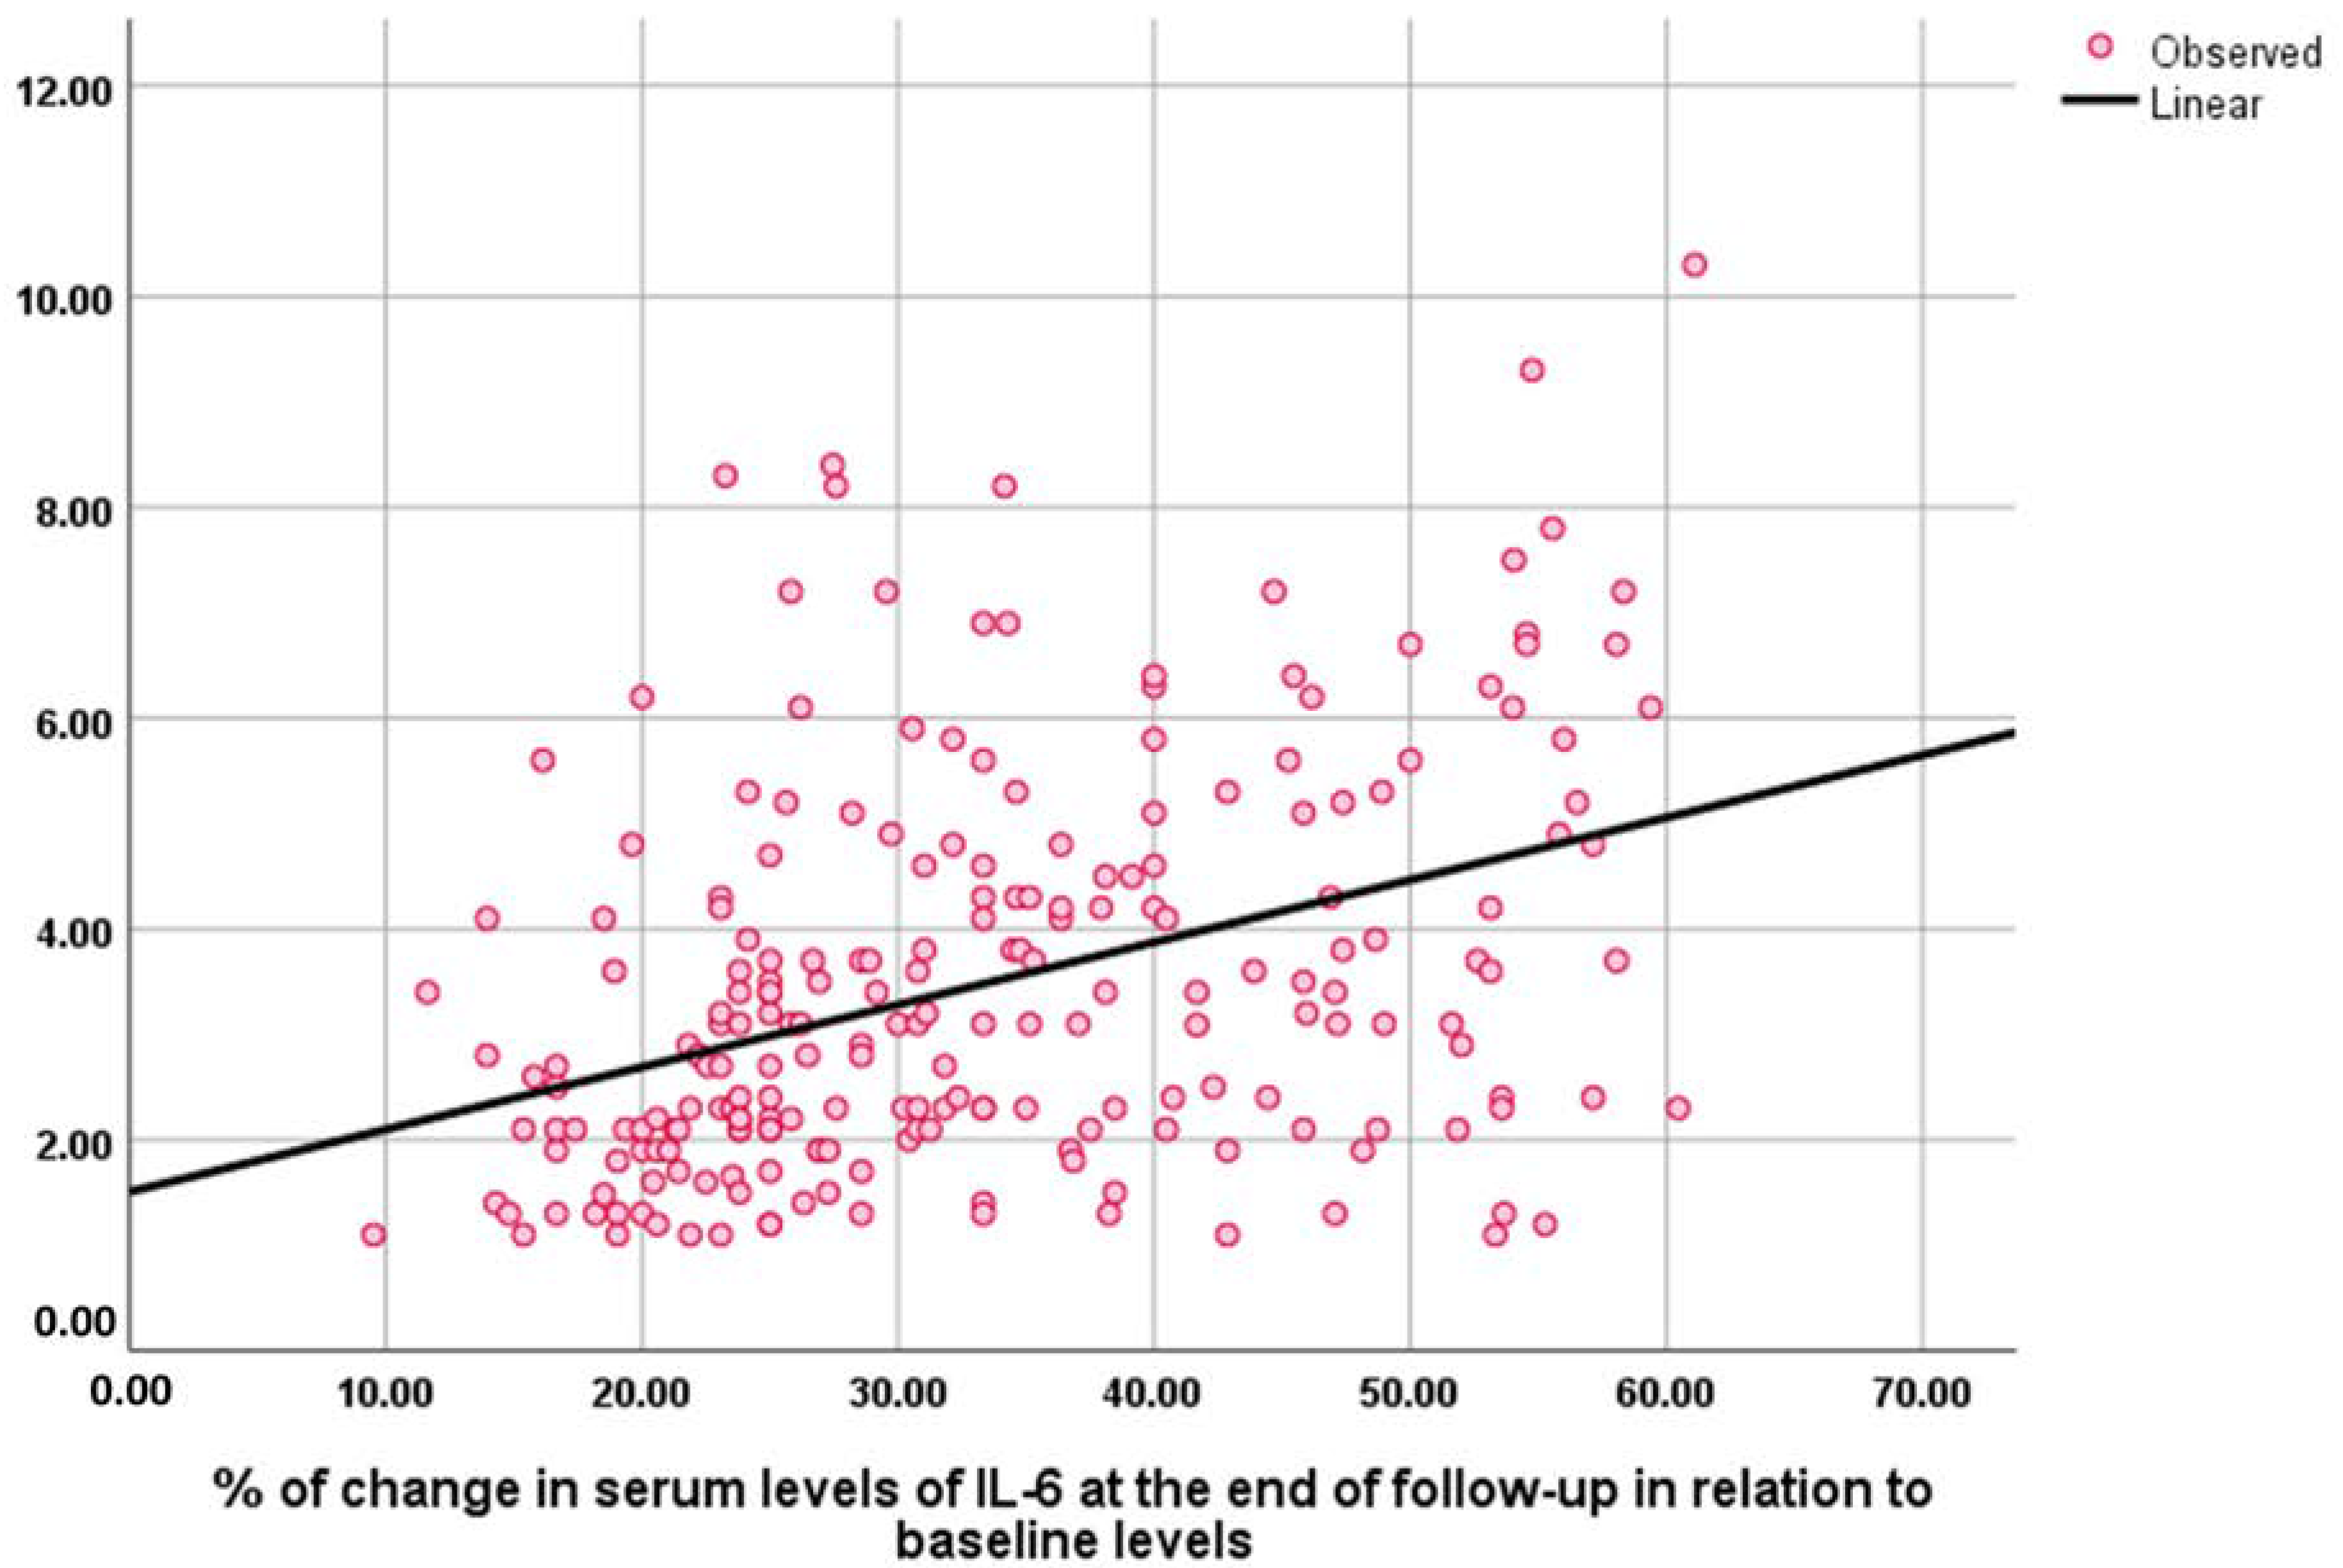
| IL-6 | Baseline | 25.2 ± 10.5 | 30.8 ± 8.6 | 36 ± 9.4 | 0.005 | <0.002 | 0.010 |
| End of follow-up | 17.7 ± 7.9 | 19.7 ± 6.9 | 21.9 ± 7.8 | 0.324 | 0.008 | 0.252 | |
| p4 Value | <0.001 | <0.001 | <0.001 | ||||
| % Of change | 29.5 ± 10.6 | 36.2 ± 12.3 | 39.2 ± 13.5 | 0.002 | 0.005 | 0.328 | |
| IL-1β | Baseline | 28.9 ± 8.2 | 23.2 ± 7.7 | 20.7 ± 9 | 0.232 | <0.001 | 0.007 |
| End of follow-up | 19 ± 7.1 | 13.7 ± 6.5 | 11 ± 6.3 | 0.057 | <0.001 | <0.001 | |
| p4 Value | <0.001 | <0.001 | <0.001 | ||||
| % Of change | 34.8 ± 13.8 | 40 ± 20.4 | 47.3 ± 20.2 | 0.146 | 0.002 | 0.207 | |
| Variables | BMI | Serum TNF-α | Serum IL-6 | Serum IL-1β | ||||
|---|---|---|---|---|---|---|---|---|
| Rho | p | Rho | p | Rho | p | Rho | p | |
| BMI | - | - | 0.36 | <0.001 | 0.117 | 0.08 | 0.181 | 0.007 |
| AHI index | 0.501 | <0.001 | 0.314 | <0.001 | 0.344 | <0.001 | 0.297 | <0.001 |
| PSQ score | 0.274 | <0.001 | 0.167 | 0.012 | 0.183 | 0.006 | 0.091 | 0.175 |
| NESPY score | 0.218 | −0.001 | 0.12 | −0.074 | 0.219 | −0.001 | −0.114 | 0.09 |
Disclaimer/Publisher’s Note: The statements, opinions and data contained in all publications are solely those of the individual author(s) and contributor(s) and not of MDPI and/or the editor(s). MDPI and/or the editor(s) disclaim responsibility for any injury to people or property resulting from any ideas, methods, instructions or products referred to in the content. |
© 2023 by the authors. Licensee MDPI, Basel, Switzerland. This article is an open access article distributed under the terms and conditions of the Creative Commons Attribution (CC BY) license (https://creativecommons.org/licenses/by/4.0/).
Share and Cite
Eldin, M.S.; Alahmer, M.; Alkashlan, E.; Zahran, M.; Eltonsy, M.; Zewail, A.; Kasem, A.; Abdelaal, K.; Seddeek, M.; Ahmed, Z. Alterations in Inflammatory Markers and Cognitive Ability after Treatment of Pediatric Obstructive Sleep Apnea. Medicina 2023, 59, 204. https://doi.org/10.3390/medicina59020204
Eldin MS, Alahmer M, Alkashlan E, Zahran M, Eltonsy M, Zewail A, Kasem A, Abdelaal K, Seddeek M, Ahmed Z. Alterations in Inflammatory Markers and Cognitive Ability after Treatment of Pediatric Obstructive Sleep Apnea. Medicina. 2023; 59(2):204. https://doi.org/10.3390/medicina59020204
Chicago/Turabian StyleEldin, Mohamed Shams, Mohamed Alahmer, Ebrahim Alkashlan, Mahmoud Zahran, Mohamed Eltonsy, Amr Zewail, Abdelfattah Kasem, Khaled Abdelaal, Mahrous Seddeek, and Zakaria Ahmed. 2023. "Alterations in Inflammatory Markers and Cognitive Ability after Treatment of Pediatric Obstructive Sleep Apnea" Medicina 59, no. 2: 204. https://doi.org/10.3390/medicina59020204