
Subendocardial Viability Ratio Predictive Value for Cardiovascular Risk in Hypertensive Patients
 ,
,  , , , , , ,
Abstract
:1. Introduction
2. Materials and Methods
2.1. Study Design and Population
2.2. Measurements
2.3. Atherosclerosis Evaluation Using the Artheriograph Device
2.4. Statistical Analysis
2.5. Ethics
3. Results
4. Discussion
5. Conclusions
Author Contributions
Funding
Institutional Review Board Statement
Informed Consent Statement
Conflicts of Interest
References
- Laurent, S.; Boutouyrie, P. Arterial Stiffness and Hypertension in the Elderly. Front. Cardiovasc. Med. 2020, 7, 544302. [Google Scholar] [CrossRef] [PubMed]
- Kumrular, M.; Ozer, P.K.; Elitok, A. The Role of Aortic Stiffness Parameters in Evaluating Myocardial Ischemia. Cardiol. Res. 2020, 11, 328–336. [Google Scholar] [CrossRef] [PubMed]
- Mahmud, A.; Feely, J. Aldosterone-to-renin ratio, arterial stiffness, and the response to aldosterone antagonism in essential hypertension. Am. J. Hypertens. 2005, 18, 50–55. [Google Scholar] [CrossRef] [PubMed] [Green Version]
- London, G.M.; Guerin, A.P. Influence of arterial pulse and reflected waves on blood pressure and cardiac function. Am. Heart J. 1999, 138, S220–S224. [Google Scholar] [CrossRef]
- Duprez, D.A.; Cohn, J.N. Arterial stiffness as a risk factor for coronary atherosclerosis. Curr. Atheroscler. Rep. 2007, 9, 139–144. [Google Scholar] [CrossRef]
- Salvi, P.; Parati, G. Aortic stiffness and myocardial ischemia. J. Hypertens. 2015, 33, 1767–1771. [Google Scholar] [CrossRef]
- Chen, W.; Han, Y.; Wang, Y.; Chen, X.; Qiu, X.; Li, W.; Xu, Y.; Zhu, T. Glucose Metabolic Disorders Enhance Vascular Dysfunction Triggered by Particulate Air Pollution: A Panel Study. Hypertension 2022, 79, 1079–1090. [Google Scholar] [CrossRef]
- Lundwall, K.; Jekell, A.; Desta, L.; Jacobson, S.H.; Kahan, T.; Spaak, J. Aortic stiffness and aortic-brachial stiffness mismatch as markers of renal dysfunction in hypertension. Blood Press. 2022, 31, 91–99. [Google Scholar] [CrossRef]
- Chirinos, J.A. Textbook of Arterial Stiffness and Pulsatile Hemodynamics in Health and Disease; Academic Press: Cambridge, MA, USA, 2022; ISBN 978-0-323-91648-6. [Google Scholar]
- Tsiachris, D.; Tsioufis, C.; Syrseloudis, D.; Roussos, D.; Tatsis, I.; Dimitriadis, K.; Toutouzas, K.; Tsiamis, E.; Stefanadis, C. Subendocardial viability ratio as an index of impaired coronary flow reserve in hypertensives without significant coronary artery stenoses. J. Hum. Hypertens. 2011, 26, 64–70. [Google Scholar] [CrossRef] [Green Version]
- Park, J.-S.; Shin, J.-H.; Park, J.-B.; Choi, D.-J.; Youn, H.-J.; Park, C.-G.; Kwan, J.; Ahn, Y.; Kim, D.-W.; Rim, S.-J.; et al. Central hemodynamics and the discrepancy between central blood pressure and brachial blood pressure. Medicine 2022, 101, e30484. [Google Scholar] [CrossRef]
- Tagawa, K.; Tsuru, Y.; Yokoi, K.; Aonuma, T.; Hashimoto, J. Aortic diastolic pressure decay explains sex-related differences in the subendocardial viability ratio: The Wakuya study. J. Hypertens. 2022, 40, 1099–1106. [Google Scholar] [CrossRef] [PubMed]
- Williams, B.; Mancia, G.; Spiering, W.; Agabiti Rosei, E.; Azizi, M.; Burnier, M.; Clement, D.L.; Coca, A.; de Simone, G.; Dominiczak, A.; et al. 2018 ESC/ESH Guidelines for the management of arterial hypertension. Eur. Heart J. 2018, 39, 3021–3104. [Google Scholar] [CrossRef] [PubMed] [Green Version]
- Wilson, P.W.F.; D’Agostino, R.B.; Levy, D.; Belanger, A.M.; Silbershatz, H.; Kannel, W.B. Prediction of Coronary Heart Disease Using Risk Factor Categories. Circulation 1998, 97, 1837–1847. [Google Scholar] [CrossRef] [PubMed] [Green Version]
- Anderson, K.M.; Wilson, P.W.; Odell, P.M.; Kannel, W.B. An updated coronary risk profile. A statement for health professionals. Circulation 1991, 83, 356–362. [Google Scholar] [CrossRef] [PubMed] [Green Version]
- Mortensen, M.B.; Falk, E. Limitations of the SCORE-guided European guidelines on cardiovascular disease prevention. Eur. Heart J. 2016, 38, 2259–2263. [Google Scholar] [CrossRef] [Green Version]
- Conroy, R.M.; Pyörälä, K.; Fitzgerald, A.P.; Sans, S.; Menotti, A.; De Backer, G.; De Bacquer, D.; Ducimetière, P.; Jousilahti, P.; Keil, U.; et al. Estimation of ten-year risk of fatal cardiovascular disease in Europe: The SCORE project. Eur. Heart J. 2003, 24, 987–1003. [Google Scholar] [CrossRef] [Green Version]
- Salvi, P. Pulse Waves; Springer: Milano, Italy, 2012; ISBN 978-88-470-2438-0. [Google Scholar]
- Scandale, G.; Dimitrov, G.; Recchia, M.; Carzaniga, G.; Minola, M.; Perilli, E.; Carotta, M.; Catalano, M. Arterial stiffness and subendocardial viability ratio in patients with peripheral arterial disease. J. Clin. Hypertens. 2018, 20, 478–484. [Google Scholar] [CrossRef] [Green Version]
- Laugesen, E.; Høyem, P.; Fleischer, J.; Kumarathas, I.; Knudsen, S.T.; Hansen, K.W.; Christiansen, J.S.; Hansen, T.K.; Poulsen, P.L. Reduced Subendocardial Viability Ratio Is Associated with Unfavorable Cardiovascular Risk Profile in Women with Short Duration of Type 2 Diabetes. Am. J. Hypertens. 2016, 29, 1165–1172. [Google Scholar] [CrossRef]
- Saito, M.; Kasuya, A. Relationship between the Subendocardial Viability Ratio and Risk Factors for Ischemic Heart Disease. Sangyo Eiseigaku Zasshi 2003, 45, 114–119. [Google Scholar] [CrossRef] [Green Version]
- Ma, Z.-C.; Zhang, Y.-L.; Ni, C.-M.; He, Z.-J.; Cao, Q.-Q.; Sun, Y.-N. A new method for determining subendocardial viability ratio from radial artery pressure waves. J. Mech. Med. Biol. 2013, 13, 1350060. [Google Scholar] [CrossRef]
- Guelen, I.; Mattace-Raso, F.U.; van Popele, N.M.; Westerhof, B.E.; Hofman, A.; Witteman, J.C.; Bos, W.J.W. Aortic stiffness and the balance between cardiac oxygen supply and demand: The Rotterdam Study. J. Hypertens. 2008, 26, 1237–1243. [Google Scholar] [CrossRef] [PubMed]
- Namasivayam, M.; Adji, A.; O’Rourke, M.F. Influence of Aortic Pressure Wave Components Determined Noninvasively on Myocardial Oxygen Demand in Men and Women. Hypertension 2011, 57, 193–200. [Google Scholar] [CrossRef] [PubMed] [Green Version]
- Chemla, D.; Nitenberg, A.; Teboul, J.-L.; Richard, C.; Monnet, X.; Le Clesiau, H.; Valensi, P.; Brahimi, M. Subendocardial viability ratio estimated by arterial tonometry: A critical evaluation in elderly hypertensive patients with increased aortic stiffness. Clin. Exp. Pharmacol. Physiol. 2008, 35, 909–915. [Google Scholar] [CrossRef] [PubMed]
- Fan, T.; Yang, Z.; Wu, Q.; Wang, Z.; Tan, Y.; Li, M.; Zhu, N.; Xu, B. Changes in the Subendocardial Viability Ratio in Patients with Atherosclerotic Coronary Heart Disease. Eur. PMC 2022. [Google Scholar]
- Mitchell, G.F. Effects of central arterial aging on the structure and function of the peripheral vasculature: Implications for end-organ damage. J. Appl. Physiol. 2008, 105, 1652–1660. [Google Scholar] [CrossRef] [Green Version]
- Vlachopoulos, C.; O’Rourke, M.; Nichols, W.W. McDonald’s Blood Flow in Arteries: Theoretical, Experimental and Clinical Principles; CRC Press: Boca Raton, FL, USA, 2011; ISBN 978-1-4441-2878-9. [Google Scholar]
- Laurent, S.; Cockcroft, J.; Van Bortel, L.; Boutouyrie, P.; Giannattasio, C.; Hayoz, D.; Pannier, B.; Vlachopoulos, C.; Wilkinson, I.; Struijker-Boudier, H. Expert consensus document on arterial stiffness: Methodological issues and clinical applications. Eur. Heart J. 2006, 27, 2588–2605. [Google Scholar] [CrossRef] [Green Version]
- Buckberg, G.D.; Fixler, D.E.; Archie, J.P.; Hoffman, J.I. Experimental Subendocardial Ischemia in Dogs with Normal Coronary Arteries. Circ. Res. 1972, 30, 67–81. [Google Scholar] [CrossRef] [Green Version]
- Jekell, A.; Kalani, M.; Kahan, T. Skin microvascular reactivity and subendocardial viability ratio in relation to dyslipidemia and signs of insulin resistance in non-diabetic hypertensive patients. Microcirculation 2021, 29, e12747. [Google Scholar] [CrossRef]
- Di Micco, L.; Salvi, P.; Bellasi, A.; Sirico, M.; Di Iorio, B. Subendocardial Viability Ratio Predicts Cardiovascular Mortality in Chronic Kidney Disease Patients. Blood Purif. 2013, 36, 26–28. [Google Scholar] [CrossRef]
- Koskela, J.K.; Vääräniemi, K.; Tahvanainen, A.M.H.; Mustonen, J.; Mäkelä, S.; Tikkakoski, A.J.; Pörsti, I. Disparate Information Provided by Pulse Wave Velocity versus Other Measures of Aortic Compliance in End-Stage Renal Disease. Nephron 2021, 146, 11–21. [Google Scholar] [CrossRef]
- Piko, N.; Petreski, T.; Naji, F.; Ekart, R.; Hojs, R.; Bevc, S. Cystatin C and arterial stiffness in patients without chronic kidney disease. Clin. Nephrol. 2021, 96, 43–48. [Google Scholar] [CrossRef]
- Fantin, F.; Di Francesco, V.; Rossi, A.; Giuliano, K.; Marino, F.; Cazzadori, M.; Gozzoli, M.P.; Vivian, M.E.; Bosello, O.; Rajkumar, C.; et al. Abdominal obesity and subclinical vascular damage in the elderly. J. Hypertens. 2010, 28, 333–339. [Google Scholar] [CrossRef] [PubMed]
- Lopes-Vicente, W.R.P.; Rodrigues, S.; Cepeda, F.X.; Jordão, C.P.; Costa-Hong, V.; Dutra-Marques, A.C.B.; Carvalho, J.C.; Alves, M.J.N.N.; Bortolotto, L.A.; Trombetta, I.C. Arterial stiffness and its association with clustering of metabolic syndrome risk factors. Diabetol. Metab. Syndr. 2017, 9, 87. [Google Scholar] [CrossRef] [PubMed] [Green Version]
- Topouchian, J.; Labat, C.; Gautier, S.; Bäck, M.; Achimastos, A.; Blacher, J.; Cwynar, M.; de la Sierra, A.; Pall, D.; Fantin, F.; et al. Effects of metabolic syndrome on arterial function in different age groups. J. Hypertens. 2018, 36, 824–833. [Google Scholar] [CrossRef] [PubMed] [Green Version]
- Tocci, N.D.; Collier, S.R.; Meucci, M. Measures of ejection duration and subendocardial viability ratio in normal weight and overweight adolescent children. Physiol. Rep. 2021, 9, e14852. [Google Scholar] [CrossRef] [PubMed]
- Marčun-Varda, N.; Nikolic, S.; Močnik, M. Subendocardial viability ratio and ejection duration as parameters of early cardiovascular risk in children. Clin. Nephrol. 2017, 88, 35–38. [Google Scholar] [CrossRef] [PubMed]
- Khoshdel, A.R.; Eshtiaghi, R. Assessment of Arterial Stiffness in Metabolic Syndrome Related to Insulin Resistance in Apparently Healthy Men. Metab. Syndr. Relat. Disord. 2019, 17, 90–96. [Google Scholar] [CrossRef]
- Fantin, F.; Giani, A.; Gasparini, L.; Rossi, A.P.; Zoico, E.; Mazzali, G.; Zamboni, M. Impaired subendocardial perfusion in patients with metabolic syndrome. Diabetes Vasc. Dis. Res. 2021, 18, 14791641211047136. [Google Scholar] [CrossRef]
- Ekart, R.; Bevc, S.; Hojs, N.; Knehtl, M.; Dvoršak, B.; Hojs, R. Albuminuria is Associated with Subendocardial Viability Ratio in Chronic Kidney Disease Patients. Kidney Blood Press. Res. 2015, 40, 565–574. [Google Scholar] [CrossRef]
- Di Pino, A.; Scicali, R.; Marchisello, S.; Zanoli, L.; Ferrara, V.; Urbano, F.; Filippello, A.; Di Mauro, S.; Scamporrino, A.; Piro, S.; et al. High glomerular filtration rate is associated with impaired arterial stiffness and subendocardial viability ratio in prediabetic subjects. Nutr. Metab. Cardiovasc. Dis. 2021, 31, 3393–3400. [Google Scholar] [CrossRef]
- Prince, C.T.; Secrest, A.M.; Mackey, R.H.; Arena, V.C.; Kingsley, L.A.; Orchard, T. Augmentation pressure and subendocardial viability ratio are associated with microalbuminuria and with poor renal function in type 1 diabetes. Diabetes Vasc. Dis. Res. 2010, 7, 216–224. [Google Scholar] [CrossRef] [PubMed]
- Ekart, R.; Bevc, S.; Hojs, N.; Galuf, T.S.; Hren, M.; Dvorsak, B.; Knehtl, M.; Jakopin, E.; Krajnc, I.; Hojs, R. Relationship between subendocardial viability ratio and hemoglobin in patients with chronic kidney disease. Clin. Nephrol. 2017, 88, 22–26. [Google Scholar] [CrossRef] [PubMed]
- Ekart, R.; Bevc, S.; Hojs, N.; Hojs, R. Derived Subendocardial Viability Ratio and Cardiovascular Events in Patients with Chronic Kidney Disease. Cardiorenal Med. 2018, 9, 41–50. [Google Scholar] [CrossRef] [PubMed]
- Piko, N.; Bevc, S.; Hojs, R.; Naji, F.H.; Ekart, R. The association between pulse wave analysis, carotid-femoral pulse wave velocity and peripheral arterial disease in patients with ischemic heart disease. BMC Cardiovasc. Disord. 2021, 21, 33. [Google Scholar] [CrossRef]
- Fantin, F.; Giani, A.; Franconi, A.; Zoico, E.; Urbani, S.; Rossi, A.P.; Mazzali, G.; Zamboni, M. Arterial Stiffness, Subendocardial Impairment, and 30-Day Readmission in Heart Failure Older Patients. Front. Cardiovasc. Med. 2022, 9, 918601. [Google Scholar] [CrossRef]
- Fantin, F.; Giani, A.; Macchi, F.; Amadio, G.; Rossi, A.P.; Zoico, E.; Mazzali, G.; Zamboni, M. Relationships between subendocardial perfusion impairment, arterial stiffness and orthostatic hypotension in hospitalized elderly individuals. J. Hypertens. 2021, 39, 2379–2387. [Google Scholar] [CrossRef]
- Anyfanti, P.; Gkaliagkousi, E.; Triantafyllou, A.; Dipla, K.; Zarifis, H.; Arseniou, P.; Lazaridis, A.; Douma, S. Noninvasive Assessment of Myocardial Perfusion in Different Blood Pressure Phenotypes and Its Association With Arterial Stiffness Indices. Am. J. Hypertens. 2019, 32, 557–563. [Google Scholar] [CrossRef]


| N | Mean | Std. Deviation | Std. Error | 95% Confidence Interval for Mean Lower Bound–Upper Bound | Min | Max | p | ||
|---|---|---|---|---|---|---|---|---|---|
| Systolic blood pressure (mmHg) | |||||||||
| Females | 21 | 145.524 | 26.0684 | 5.6886 | 133.658 | 157.390 | 102.0 | 219.0 | 0.538 |
| Males | 35 | 141.857 | 30.6231 | 5.1762 | 131.338 | 152.377 | 103.0 | 224.0 | |
| Total | 56 | 143.232 | 28.8103 | 3.8499 | 135.517 | 150.948 | 102.0 | 224.0 | |
| Pulse pressure (mmHg) | |||||||||
| Females | 21 | 67.238 | 13.8163 | 3.0150 | 60.949 | 73.527 | 43.0 | 98.0 | 0.305 |
| Males | 35 | 62.486 | 19.6594 | 3.3230 | 55.732 | 69.239 | 36.0 | 110.0 | |
| Total | 56 | 64.268 | 17.7123 | 2.3669 | 59.524 | 69.011 | 36.0 | 110.0 | |
| Biological Parameters | Minimum | Maximum | Mean Value | Standard Deviation |
|---|---|---|---|---|
| Hemoglobin (g%) | 10.30 | 18.00 | 13.5091 | 1.65678 |
| Hematocrit (%) | 33.00 | 53.10 | 40.4241 | 4.41400 |
| Fasting glucose, mg/dL | 62 | 287 | 125.20 | 44.357 |
| Total cholesterol, mg/dL | 105 | 296 | 195.67 | 45.622 |
| HDL-cholesterol, mg/dL | 14 | 112 | 46.98 | 15.673 |
| LDL-cholesterol, mg/dL | 55 | 205 | 121.67 | 42.186 |
| Triglycerides, mg/dL | 57 | 438 | 140.13 | 79.310 |
| Uric acid, mg/dL | 3.30 | 9.70 | 5.6116 | 1.62501 |
| Fibrinogen, mg/dL | 270.0 | 490.0 | 389.231 | 59.3743 |
| Urea, mg/dL | 16.00 | 75.00 | 40.6364 | 13.24465 |
| Serum creatinine, mg/dL | 0.57 | 1.97 | 0.9462 | 0.28369 |
| eGFR (mL/min/1.73 m2) | 36 | 135 | 82.80 | 23.896 |
| PWVao [m/s] | AIx Aortic [%] | SEVR % | DRA | |
|---|---|---|---|---|
| Mean | 9.757 | 32.823 | 107.8725 | 40.812 |
| Median | 9.750 | 32.050 | 108.3300 | 38.850 |
| Standard deviation | 1.7434 | 14.0231 | 28.14657 | 13.2270 |
| Minimum | 5.8 | 6.5 | 26.74 | 10.4 |
| Maximum | 14.1 | 63.2 | 161.78 | 75.3 |
| Percentile | ||||
| 25 | 8.325 | 23.700 | 91.0225 | 32.875 |
| 50 | 9.750 | 32.050 | 108.3300 | 38.850 |
| 75 | 10.900 | 43.800 | 125.1025 | 48.900 |
| SEVR | PWVao [m/s] | AIx Aortic [%] | ||||
|---|---|---|---|---|---|---|
| r | p | r | p | r | p | |
| Biochemical parameters | ||||||
| Fasting glucose (mg/dL) | 0.02 | 0.87 | 0.192 | 0.159 | −0.008 | 0.956 |
| Total cholesterol (mg/dL) | 0.02 | 0.84 | 0.245 | 0.079 | 0.306 | 0.027 |
| HDL-cholesterol (mg/dL) | 0.11 | 0.41 | −0.254 | 0.082 | 0.114 | 0.439 |
| LDL-cholesterol (mg/dL) | −0.07 | 0.59 | 0.330 | 0.021 | 0.307 | 0.032 |
| Triglycerides (mg/dL) | 0.16 | 0.23 | 0.301 | 0.030 | 0.081 | 0.569 |
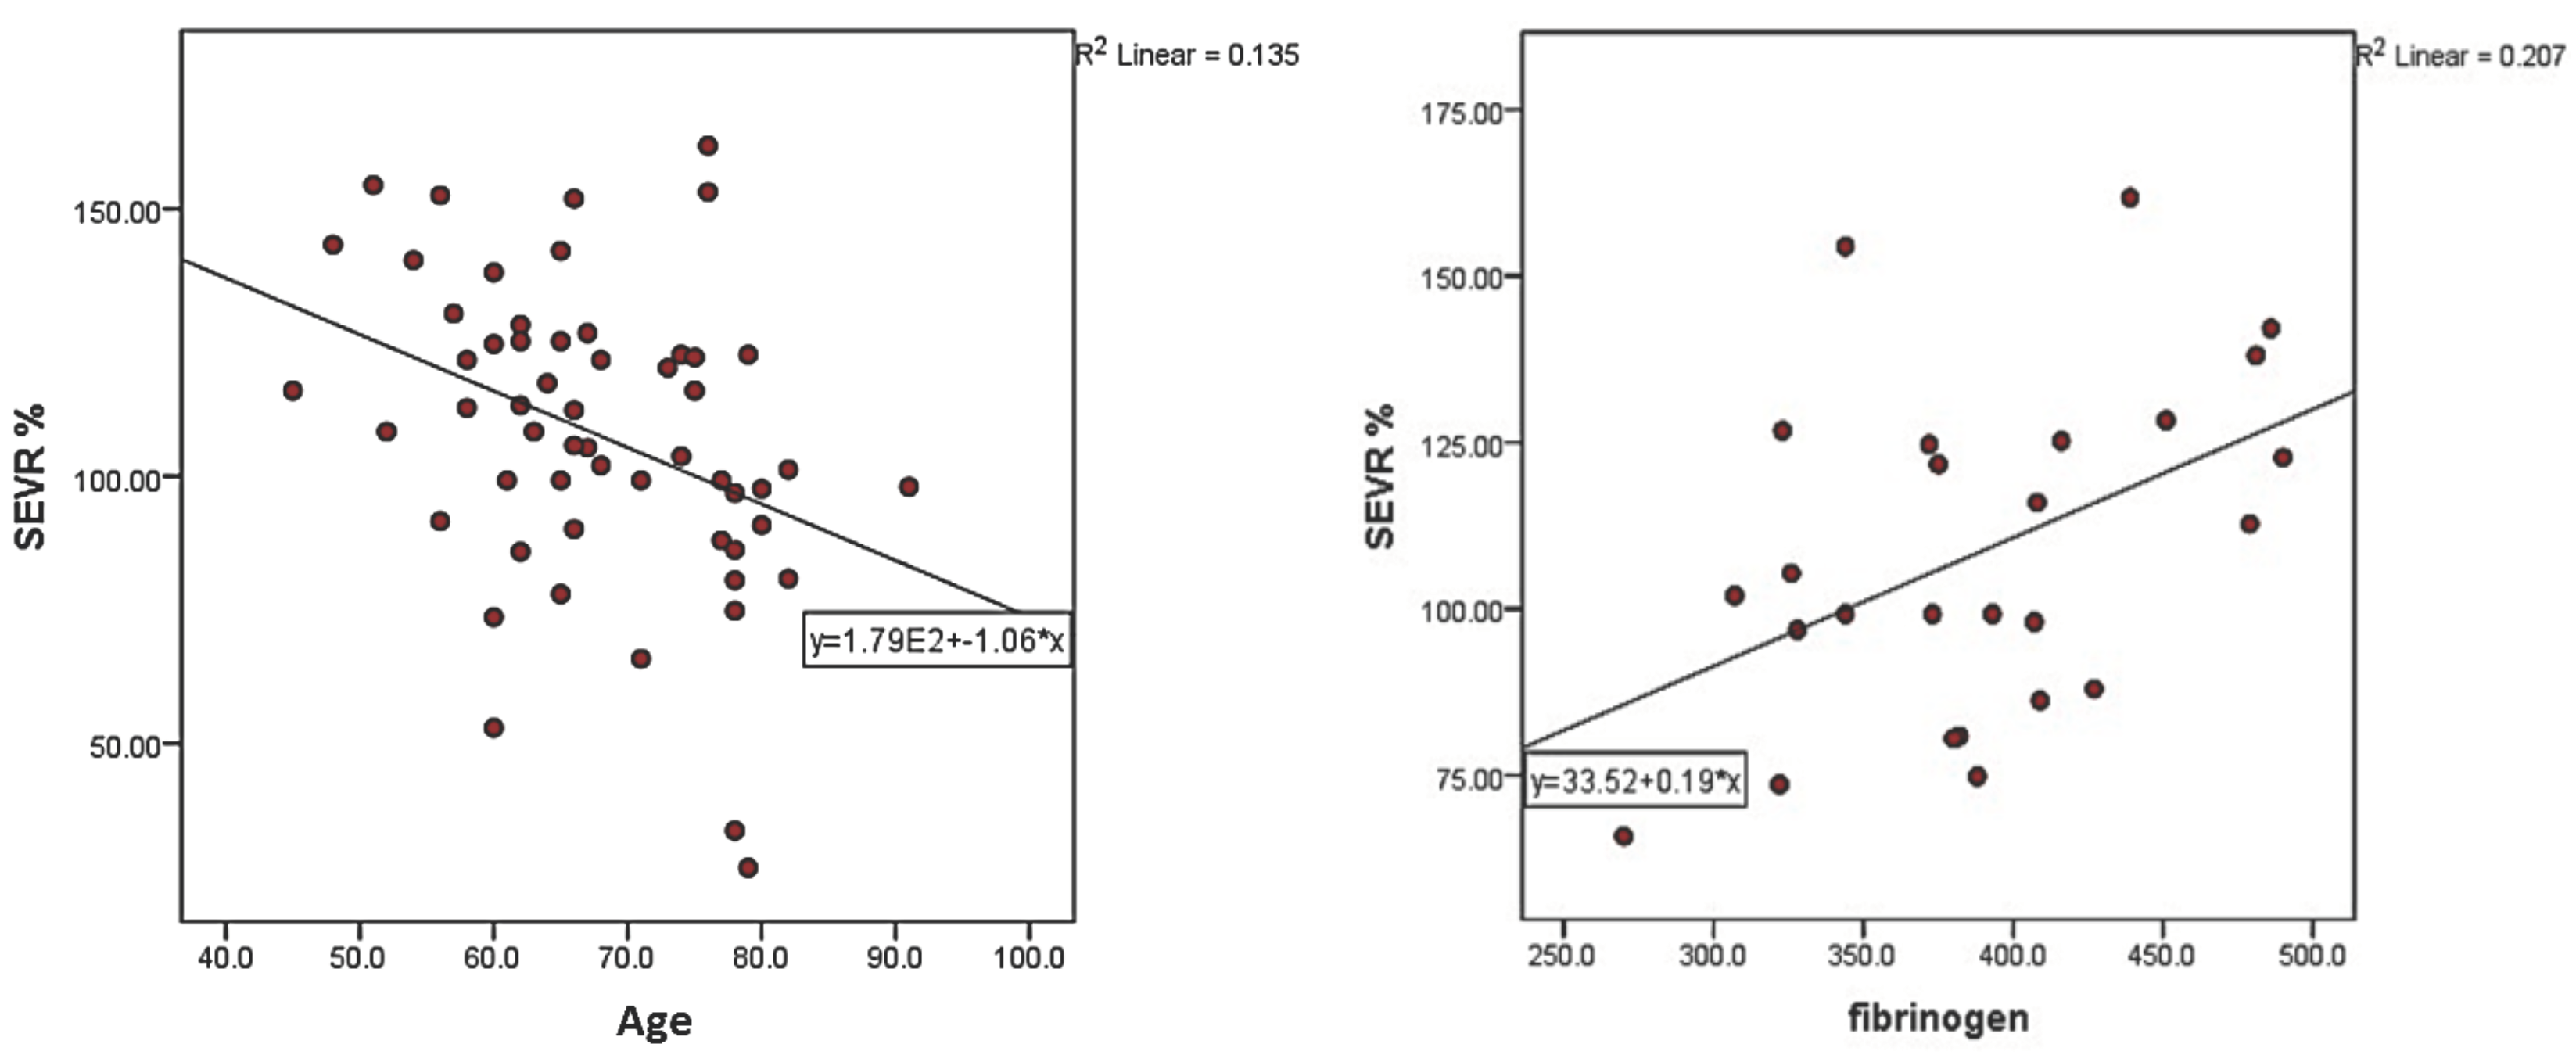
| Fibrinogen (mg/dL) | 0.455 | 0.02 | 0.346 | 0.083 | −0.260 | 0.199 |
| Serum urea (mg/dL) | −0.09 | 0.49 | 0.160 | 0.244 | 0.262 | 0.053 |
| Serum creatinine (mg/dL) | 0.04 | 0.77 | 0.014 | 0.917 | −0.048 | 0.728 |
| Uric acid (mg/dL) | −0.01 | 0.96 | 0.193 | 0.290 | −0.107 | 0.561 |
| Hemoglobin (g%) | 0.270 | 0.046 | −0.083 | 0.546 | −0.277 | 0.040 |
| Hematocrit (%) | 0.211 | 0.125 | −0.085 | 0.539 | −0.249 | 0.069 |
| Arterial stiffness parameters | ||||||
| Central SBP (mmHg) | −0.304 | 0.023 | 0.270 | 0.044 | 0.293 | 0.029 |
| Peripheral SBP (mmHg) | −0.350 | 0.008 | 0.242 | 0.073 | −0.010 | 0.942 |
| DBP (mmHg) | −0.154 | 0.256 | 0.196 | 0.147 | −0.118 | 0.388 |
| MBP (mmHg) | −0.258 | 0.055 | 0.230 | 0.088 | −0.070 | 0.608 |
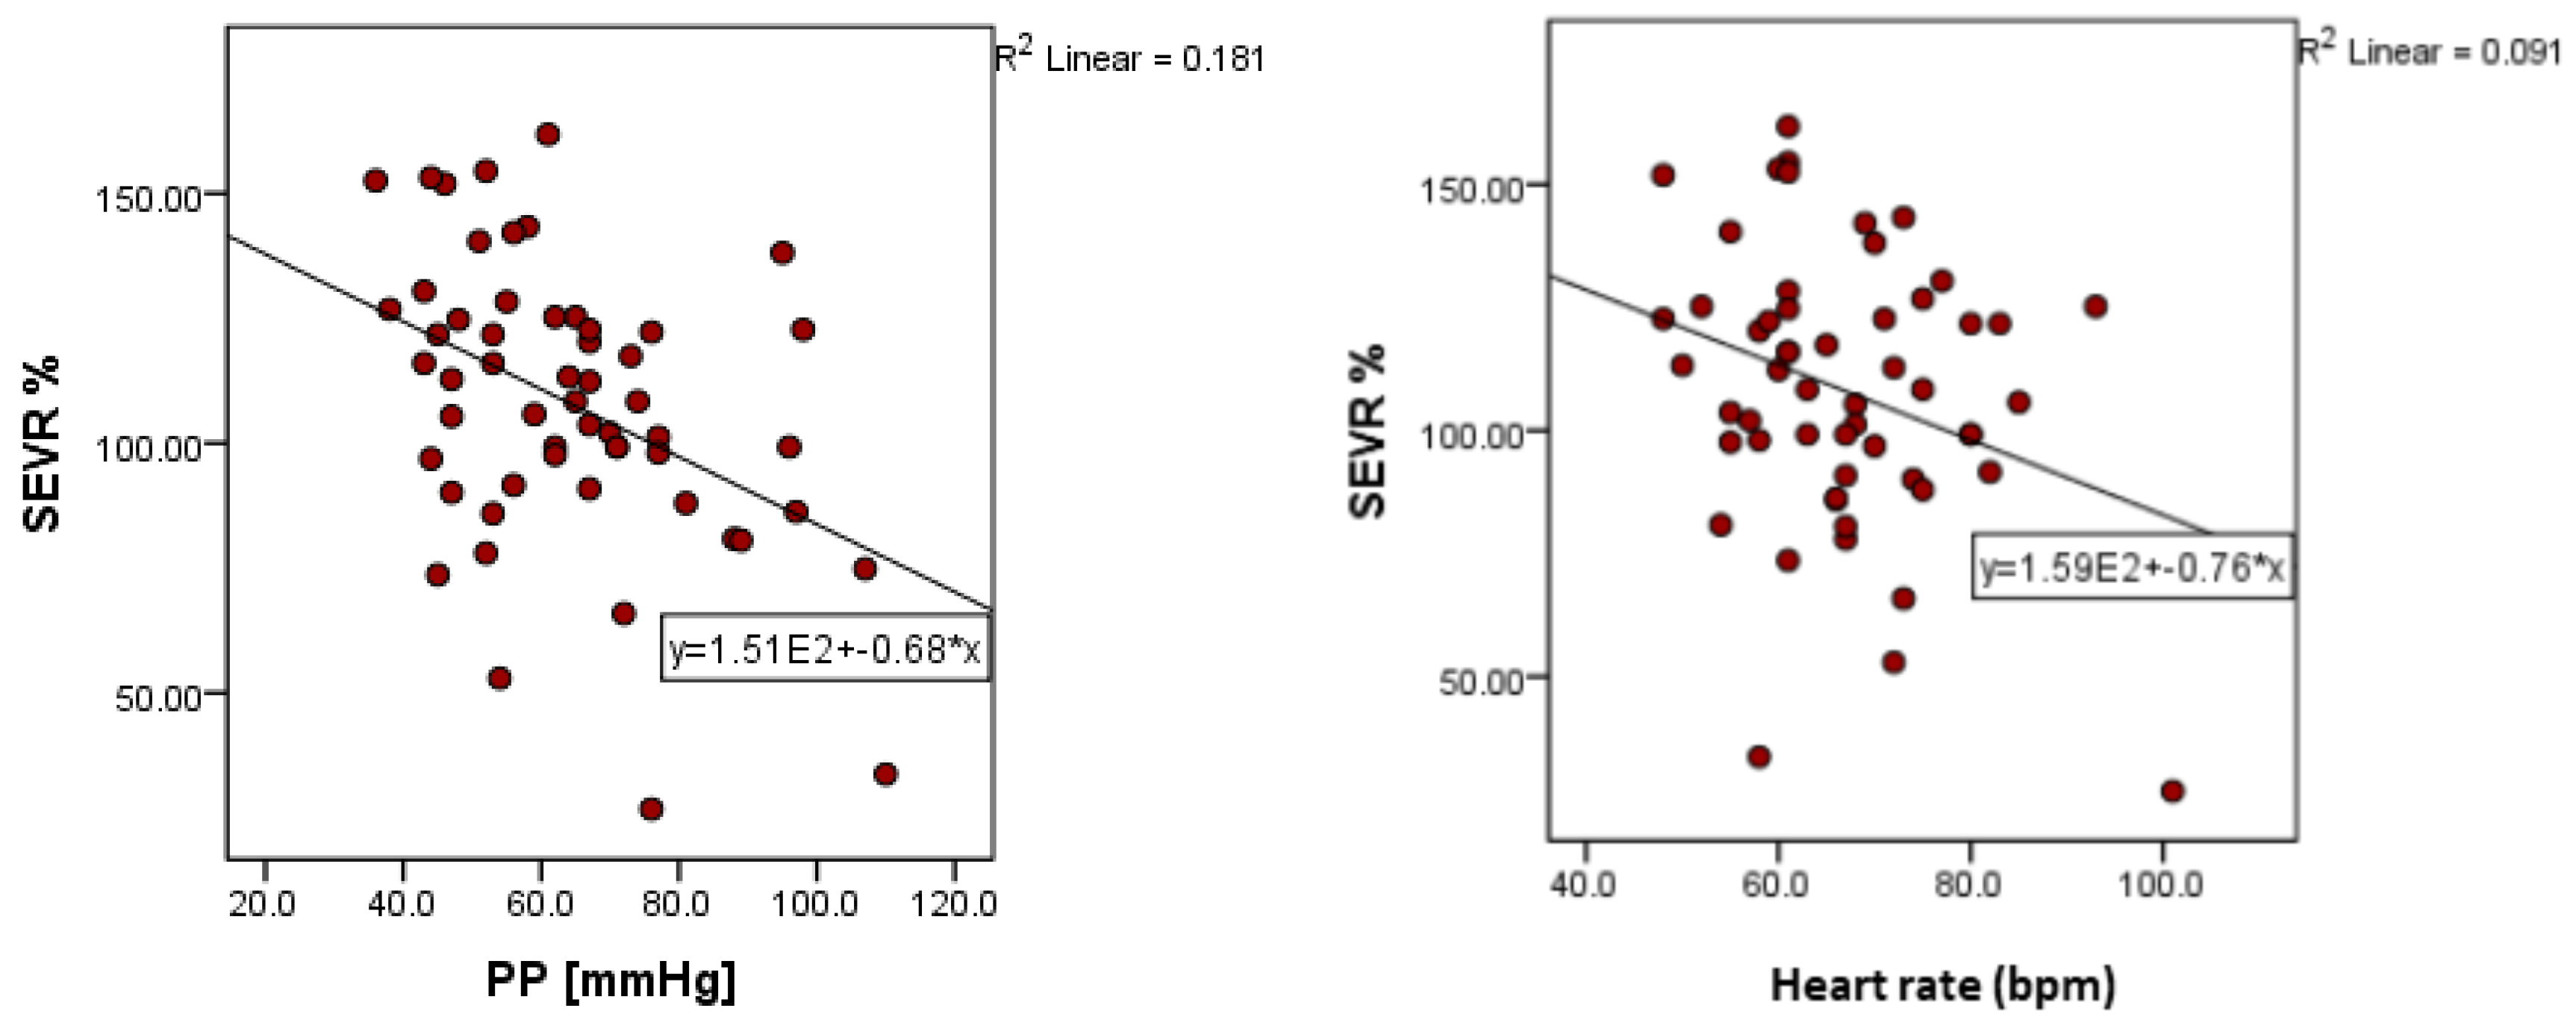
| PP (mmHg) | −0.426 | 0.001 | 0.211 | 0.119 | 0.093 | 0.495 |
| Heart rate, bpm | −0.301 | 0.024 | 0.203 | 0.133 | −0.478 | <0.001 |
Disclaimer/Publisher’s Note: The statements, opinions and data contained in all publications are solely those of the individual author(s) and contributor(s) and not of MDPI and/or the editor(s). MDPI and/or the editor(s) disclaim responsibility for any injury to people or property resulting from any ideas, methods, instructions or products referred to in the content. |
© 2022 by the authors. Licensee MDPI, Basel, Switzerland. This article is an open access article distributed under the terms and conditions of the Creative Commons Attribution (CC BY) license (https://creativecommons.org/licenses/by/4.0/).
Share and Cite
Aursulesei Onofrei, V.; Ceasovschih, A.; Anghel, R.C.; Roca, M.; Marcu, D.T.M.; Adam, C.A.; Mitu, O.; Cumpat, C.; Mitu, F.; Crisan, A.; et al. Subendocardial Viability Ratio Predictive Value for Cardiovascular Risk in Hypertensive Patients. Medicina 2023, 59, 24. https://doi.org/10.3390/medicina59010024
Aursulesei Onofrei V, Ceasovschih A, Anghel RC, Roca M, Marcu DTM, Adam CA, Mitu O, Cumpat C, Mitu F, Crisan A, et al. Subendocardial Viability Ratio Predictive Value for Cardiovascular Risk in Hypertensive Patients. Medicina. 2023; 59(1):24. https://doi.org/10.3390/medicina59010024
Chicago/Turabian StyleAursulesei Onofrei, Viviana, Alexandr Ceasovschih, Razvan Constantin Anghel, Mihai Roca, Dragos Traian Marius Marcu, Cristina Andreea Adam, Ovidiu Mitu, Carmen Cumpat, Florin Mitu, Adrian Crisan, and et al. 2023. "Subendocardial Viability Ratio Predictive Value for Cardiovascular Risk in Hypertensive Patients" Medicina 59, no. 1: 24. https://doi.org/10.3390/medicina59010024