
Antidiabetic Effect of Fermented Mesembryanthemum crystallinum L. in db/db Mice Involves Regulation of PI3K-Akt Pathway
 , ,
, ,  ,
,  and
and 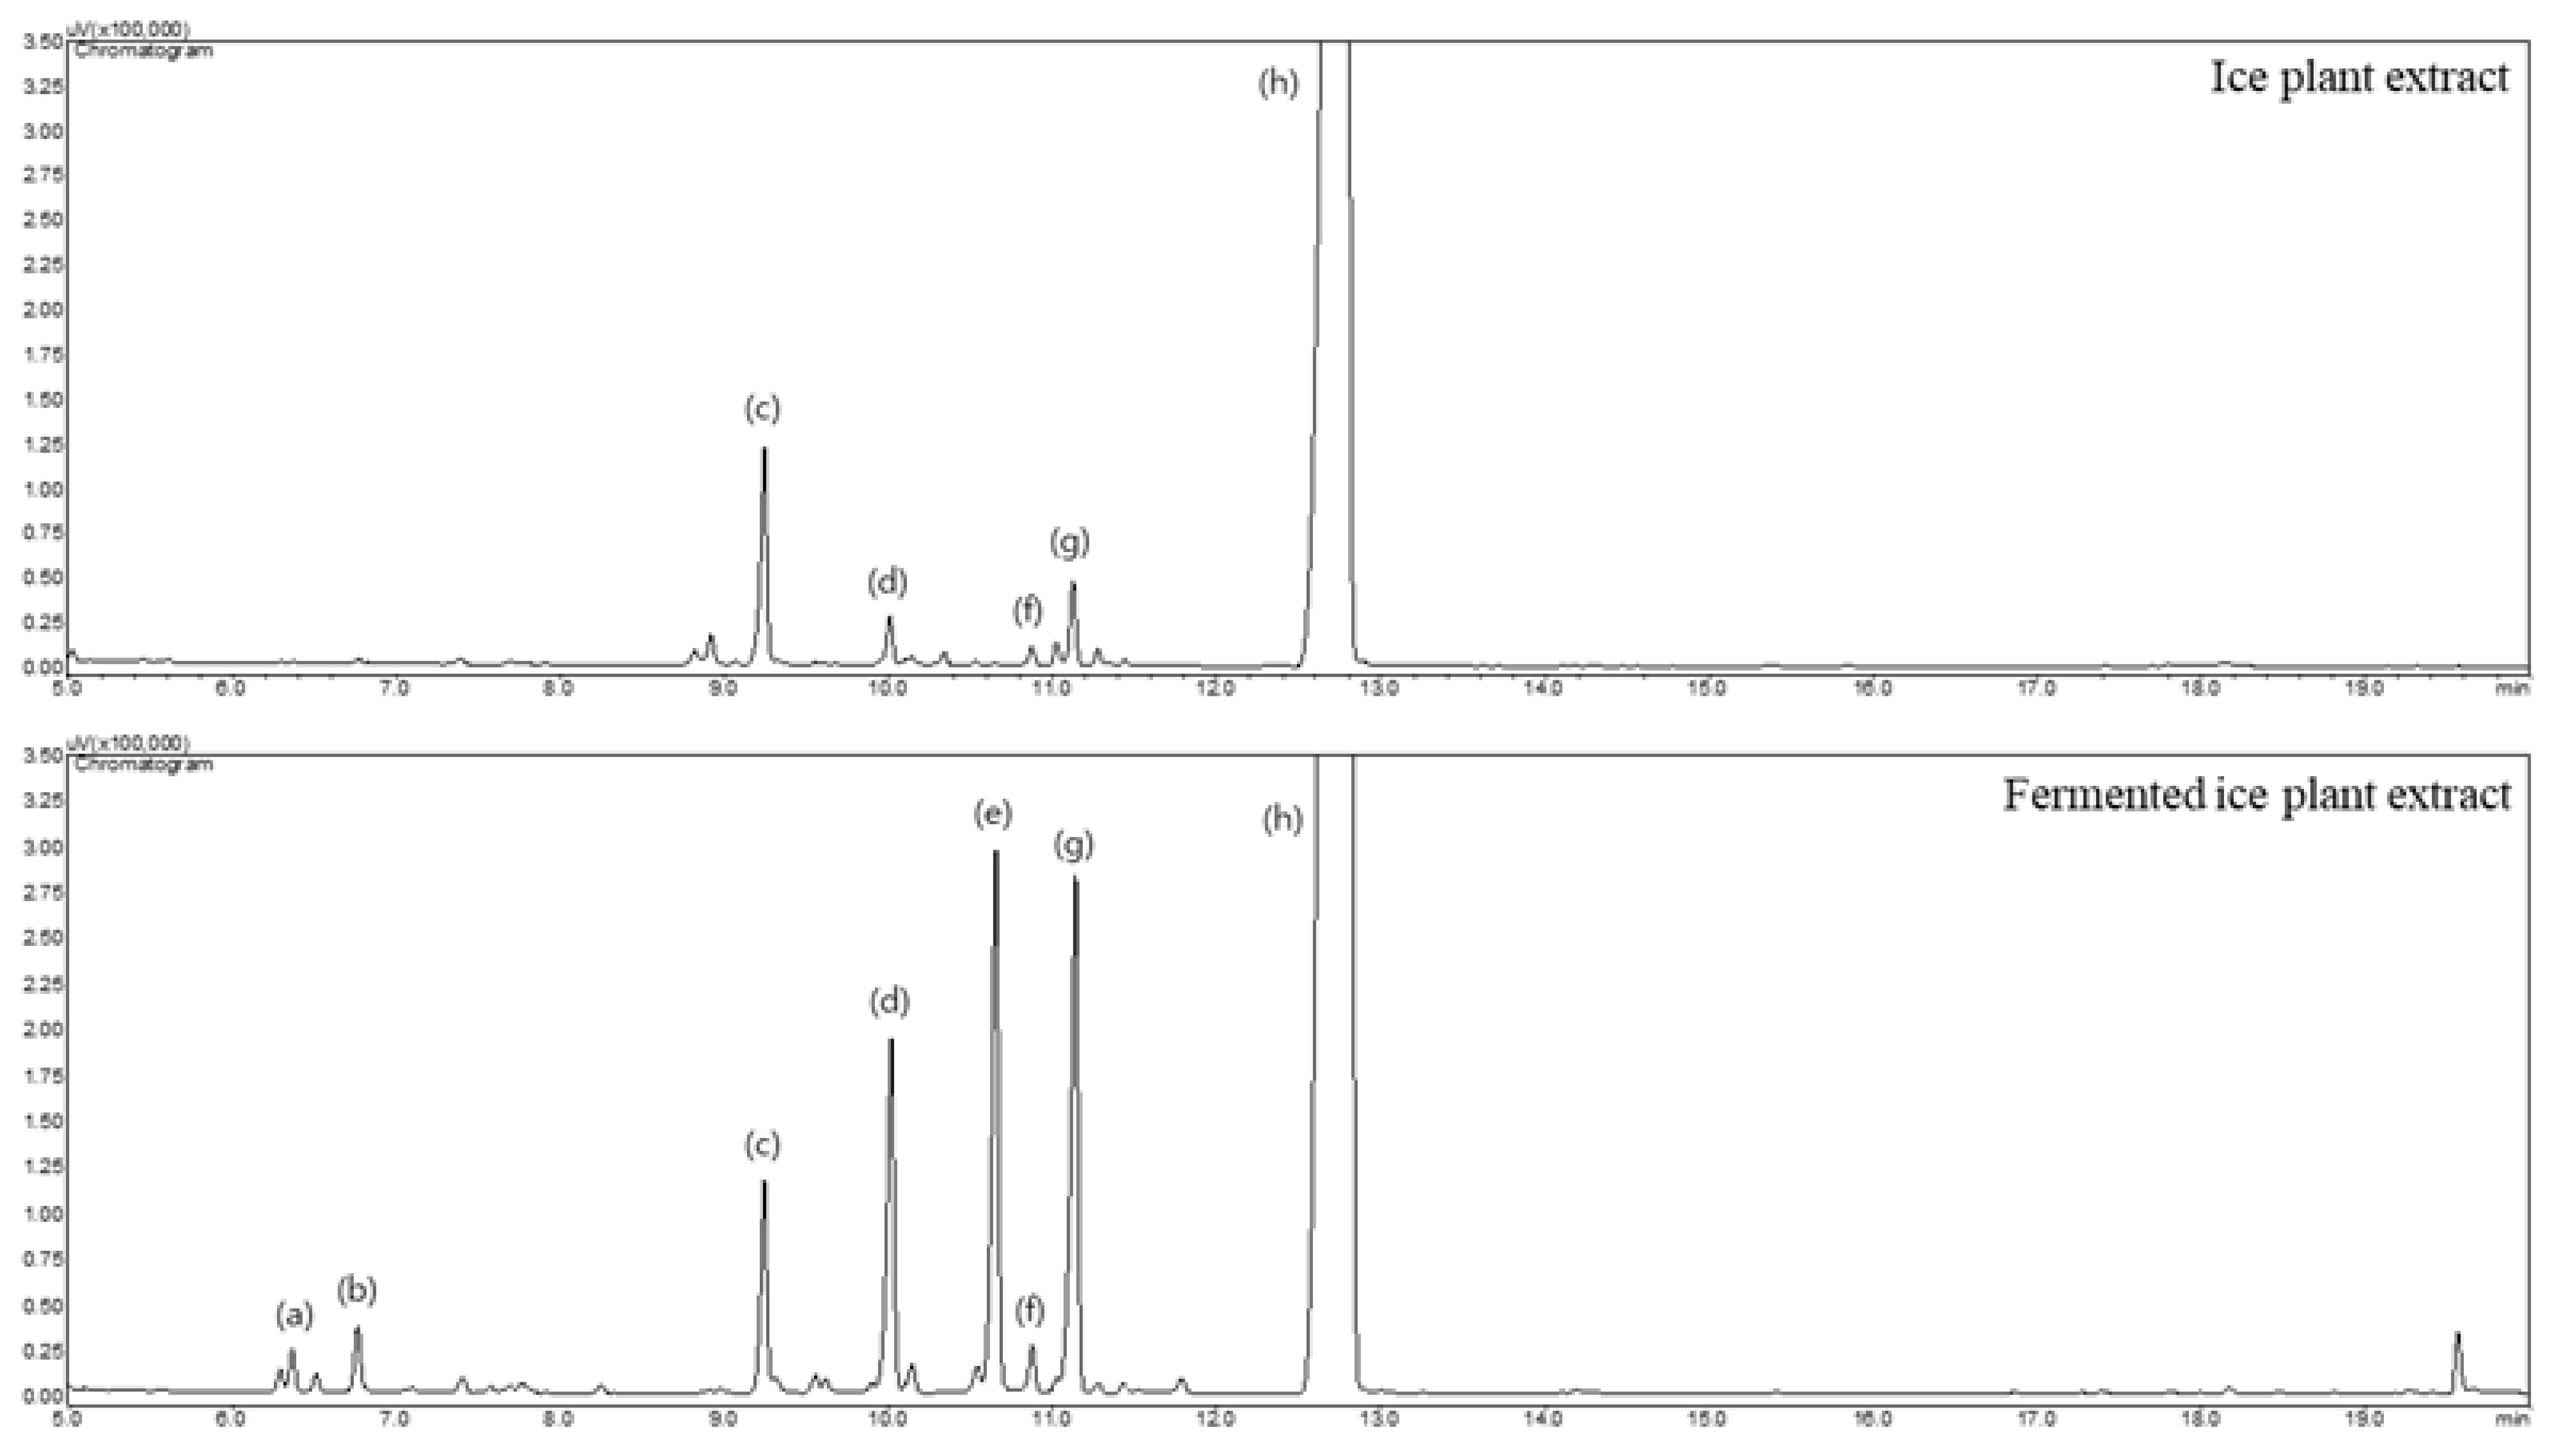
Abstract
:1. Introduction
2. Materials and Methods
2.1. Sample Purchase and Extract Preparation
2.2. Gas-Chromatographic Analysis
2.3. Animal Experiments
2.4. Oral Glucose Tolerance Test (OGTT)
2.5. Biochemical Analysis of Blood Serum
2.6. Histological Analysis by Hematoxylin & Eosin (H&E) Staining and Immunohistochemical (IHC) Staining
2.7. RNA Isolation and Real-Time Reverse Transcription-Polymerase Chain Reaction (RT-PCR)
- Irs1 (5′-CAAGGAGGTCTGGCAGGTTA-3′,5′-GGCCACGCGTCTGATATTC-3′)
- Pi3k (5′-ACTTAGCTTCCGACACCACA-3′,5′-CACAGGAATGGCAAGGTAGC-3′)
- Pdk1 (5′-CTACATTAAGGCTCTGTCG-3′,5′-CAAATTTAGCAGAAACCACA-3′)
- Akt1 (5′-GCCTCTGCTTTGTCATGGAG-3′,5′-AGCATGAGGTTCTCCAGCTT-3′)
- Srebp1 (5′-CAGCAGGTCCCAGTTGTACT-3′,5′-GGTGGATGGGCAGTTTGTCT-3′)
- Glut2 (5′-ACAGACACCCCACTTACA-3′,5′-TCCTGATACACTTCGTCC-3′)
- G6pase (5′-AAAAAGCCAACGTATGGATTCCG-3′,5′-CAGCAAGGTAGATCCGGGA-3′)
2.8. Western Blot Analysis
2.9. Cell Culture
2.10. Oil Red O Staining
2.11. Statistical Analysis
3. Results
3.1. Qualitative Analysis of Monosaccharides and Inositols
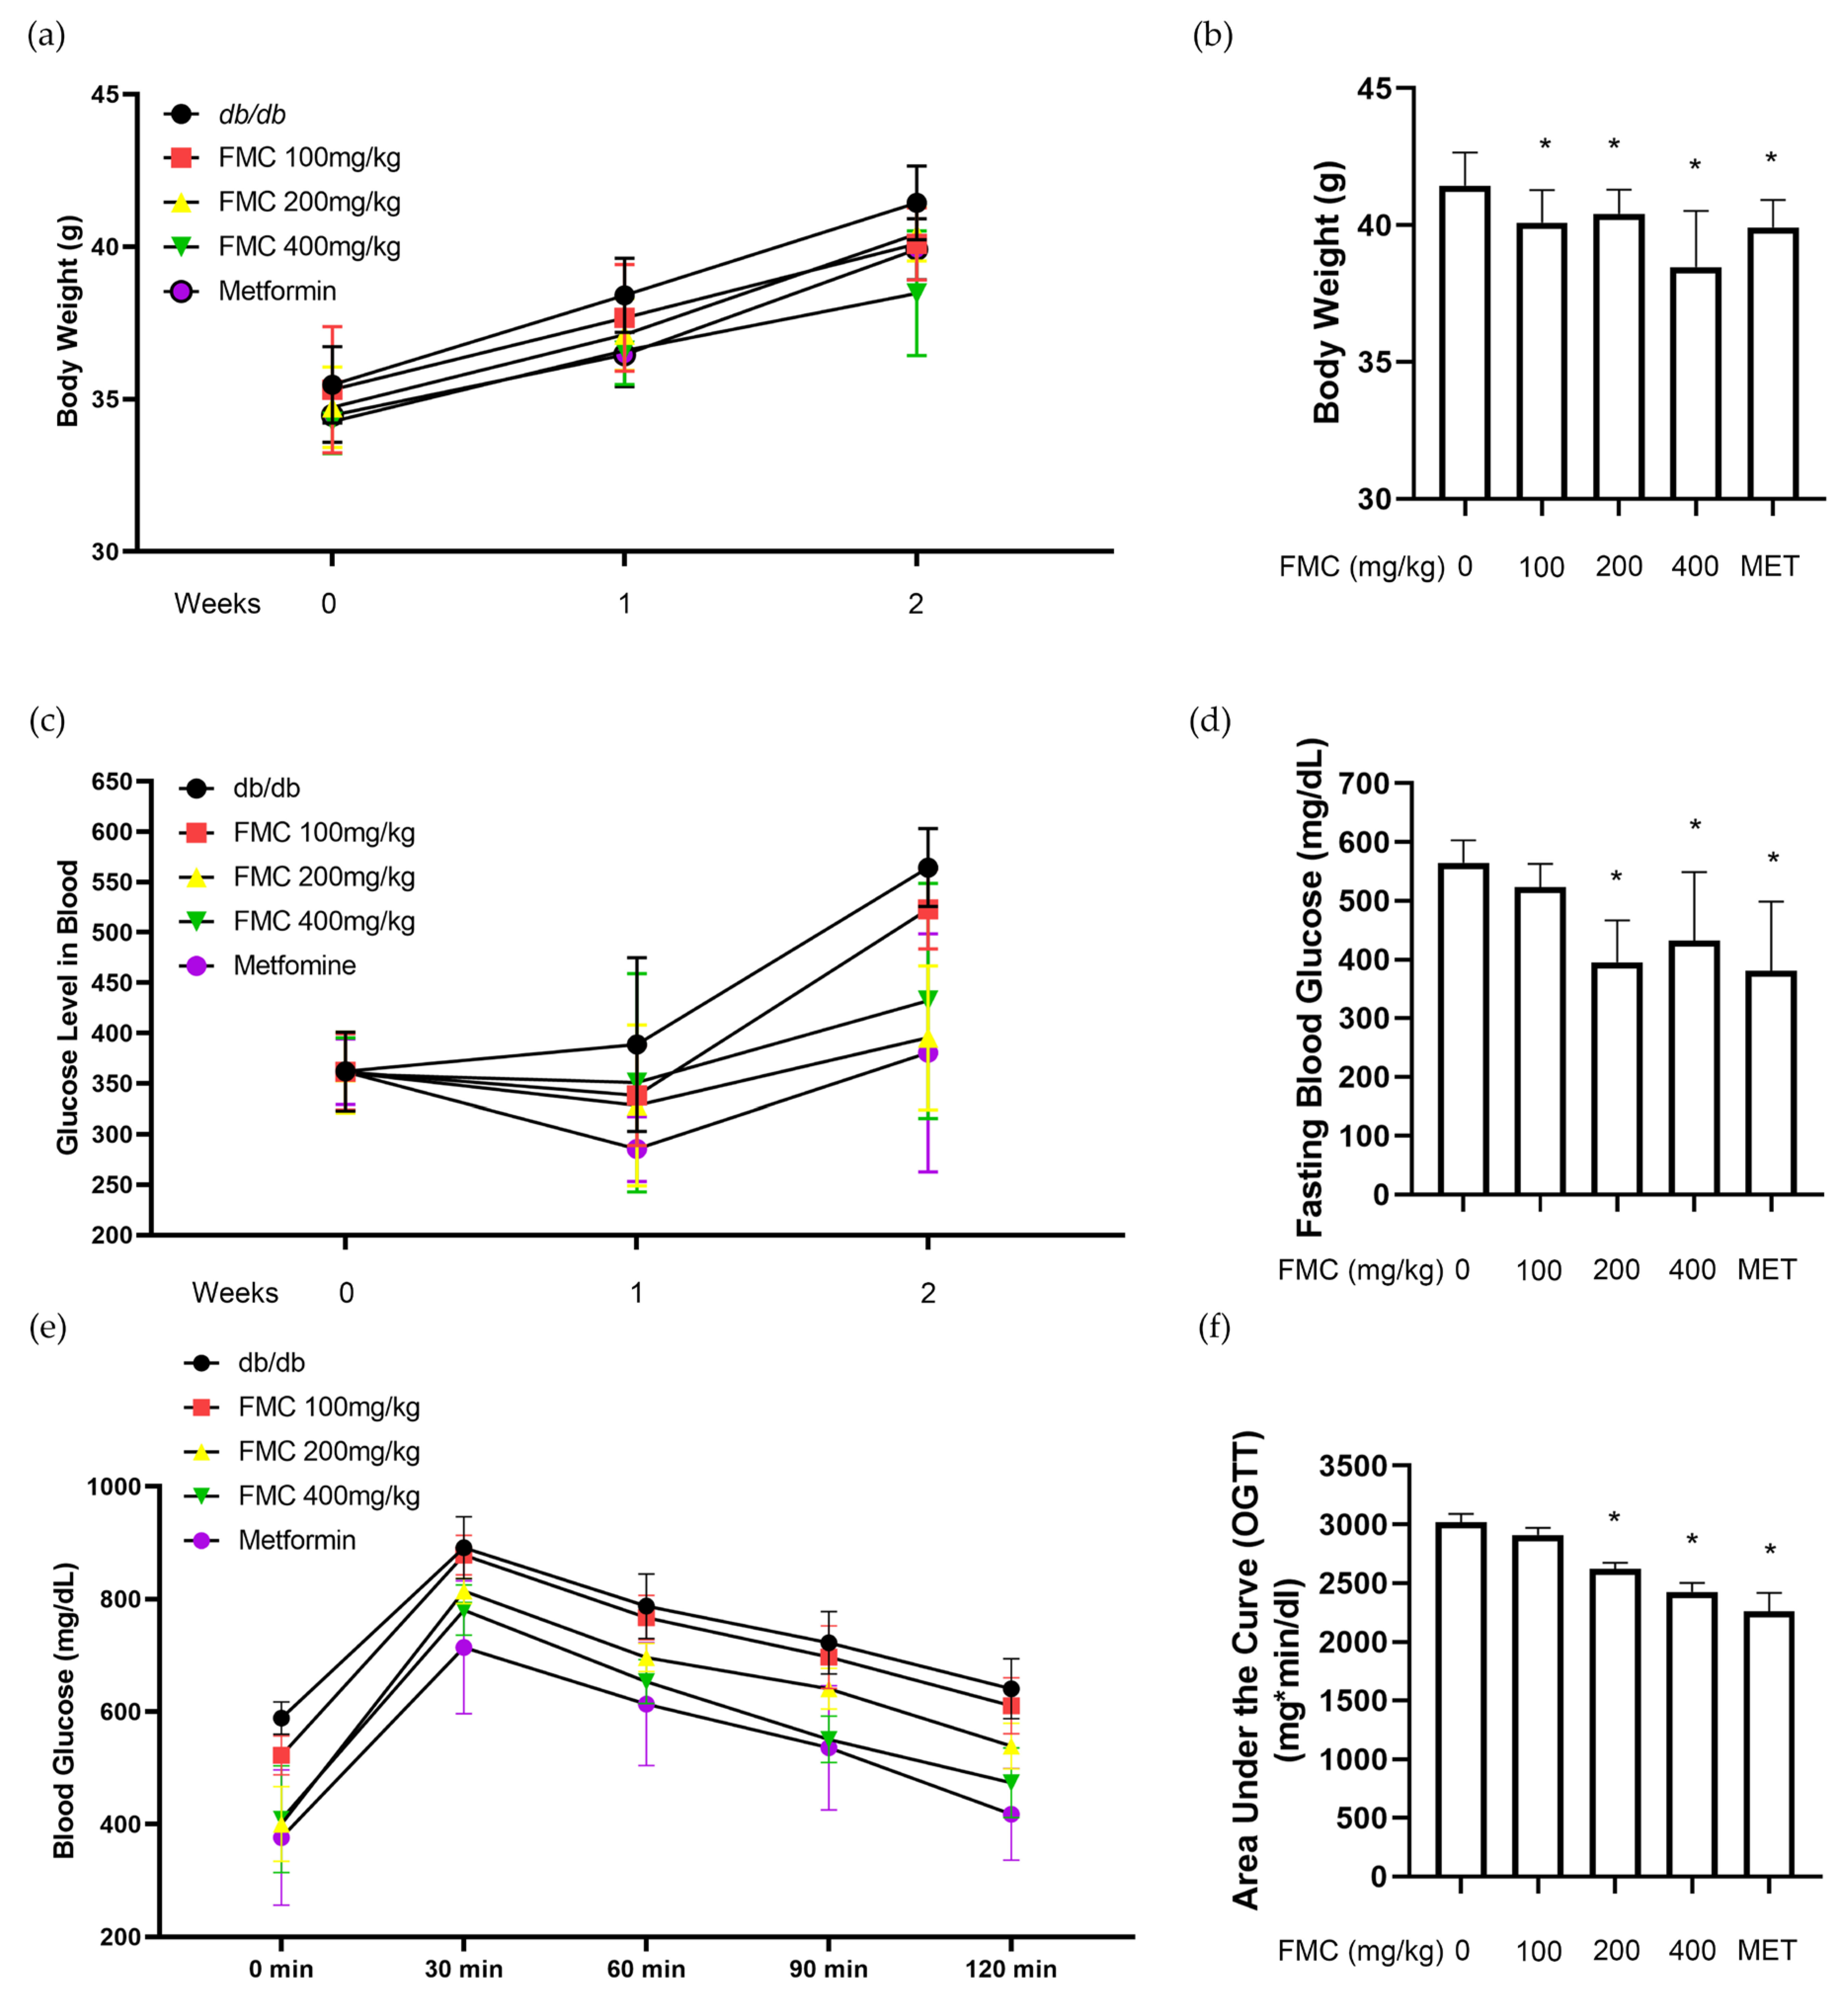
3.2. FMC Decreases Blood Glucose and Body Weight Gain in db/db Mice
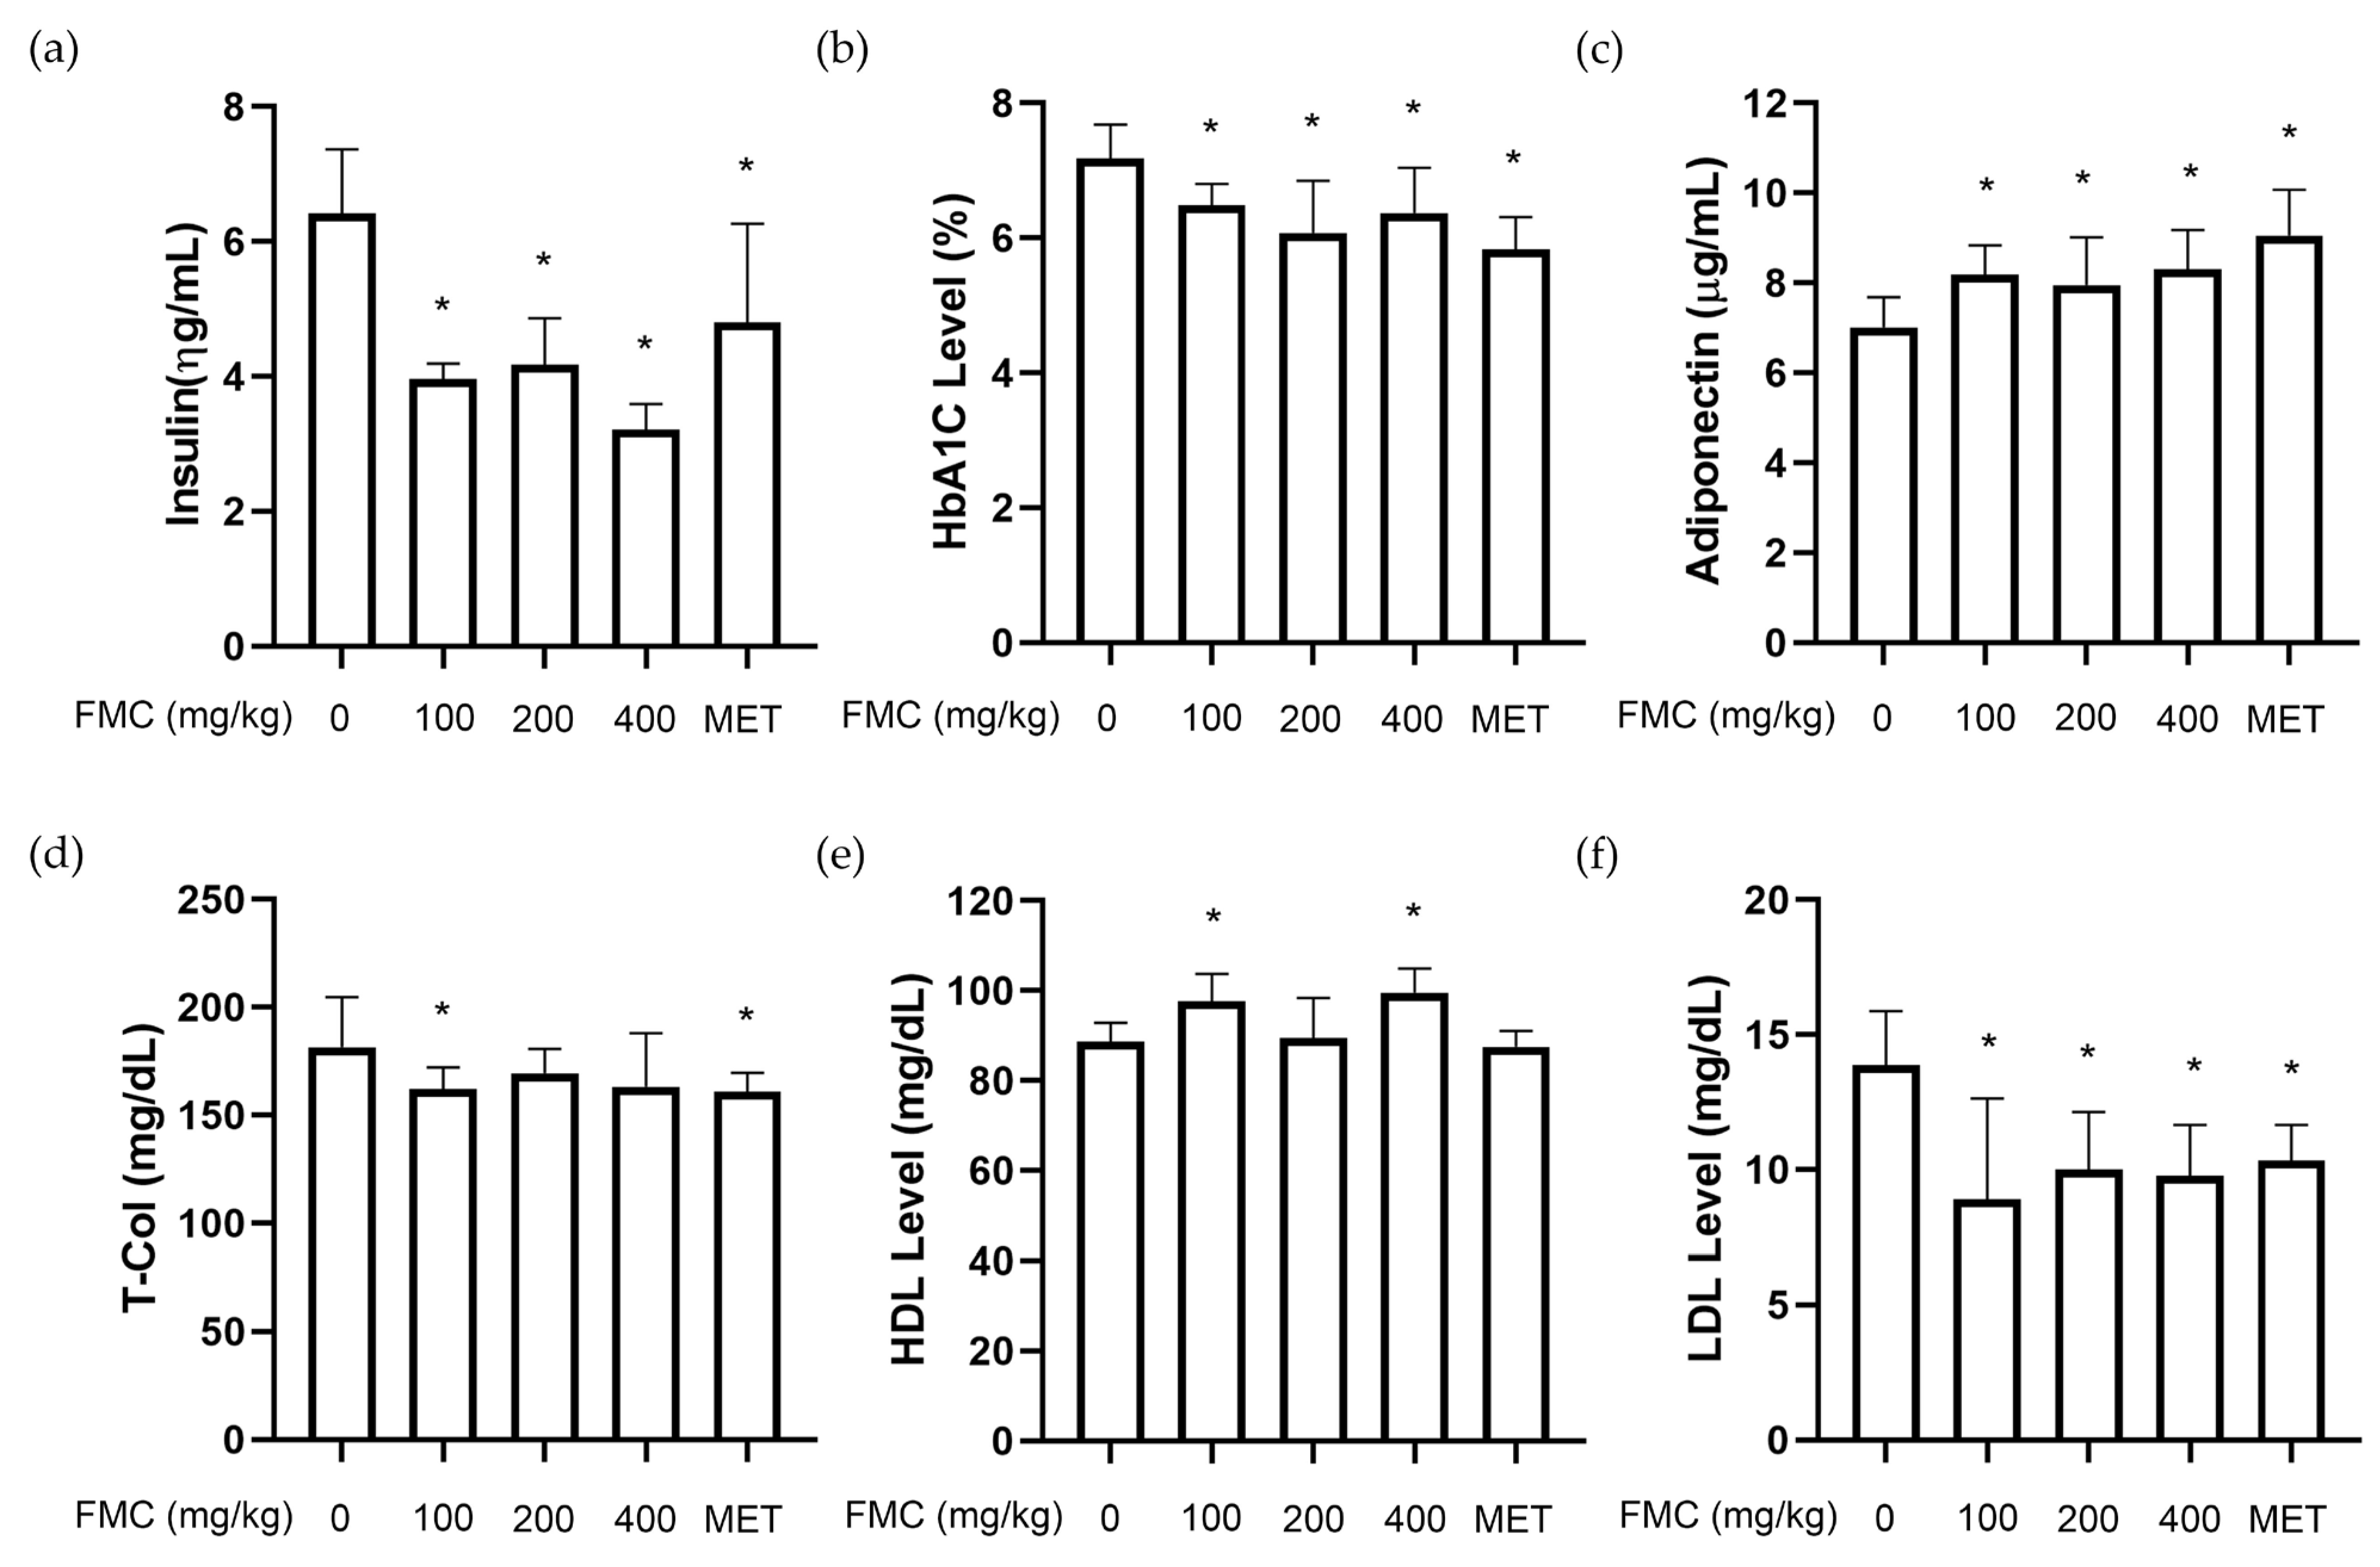
3.3. FMC Improves T2D-Related Serum Parameters in db/db Mice
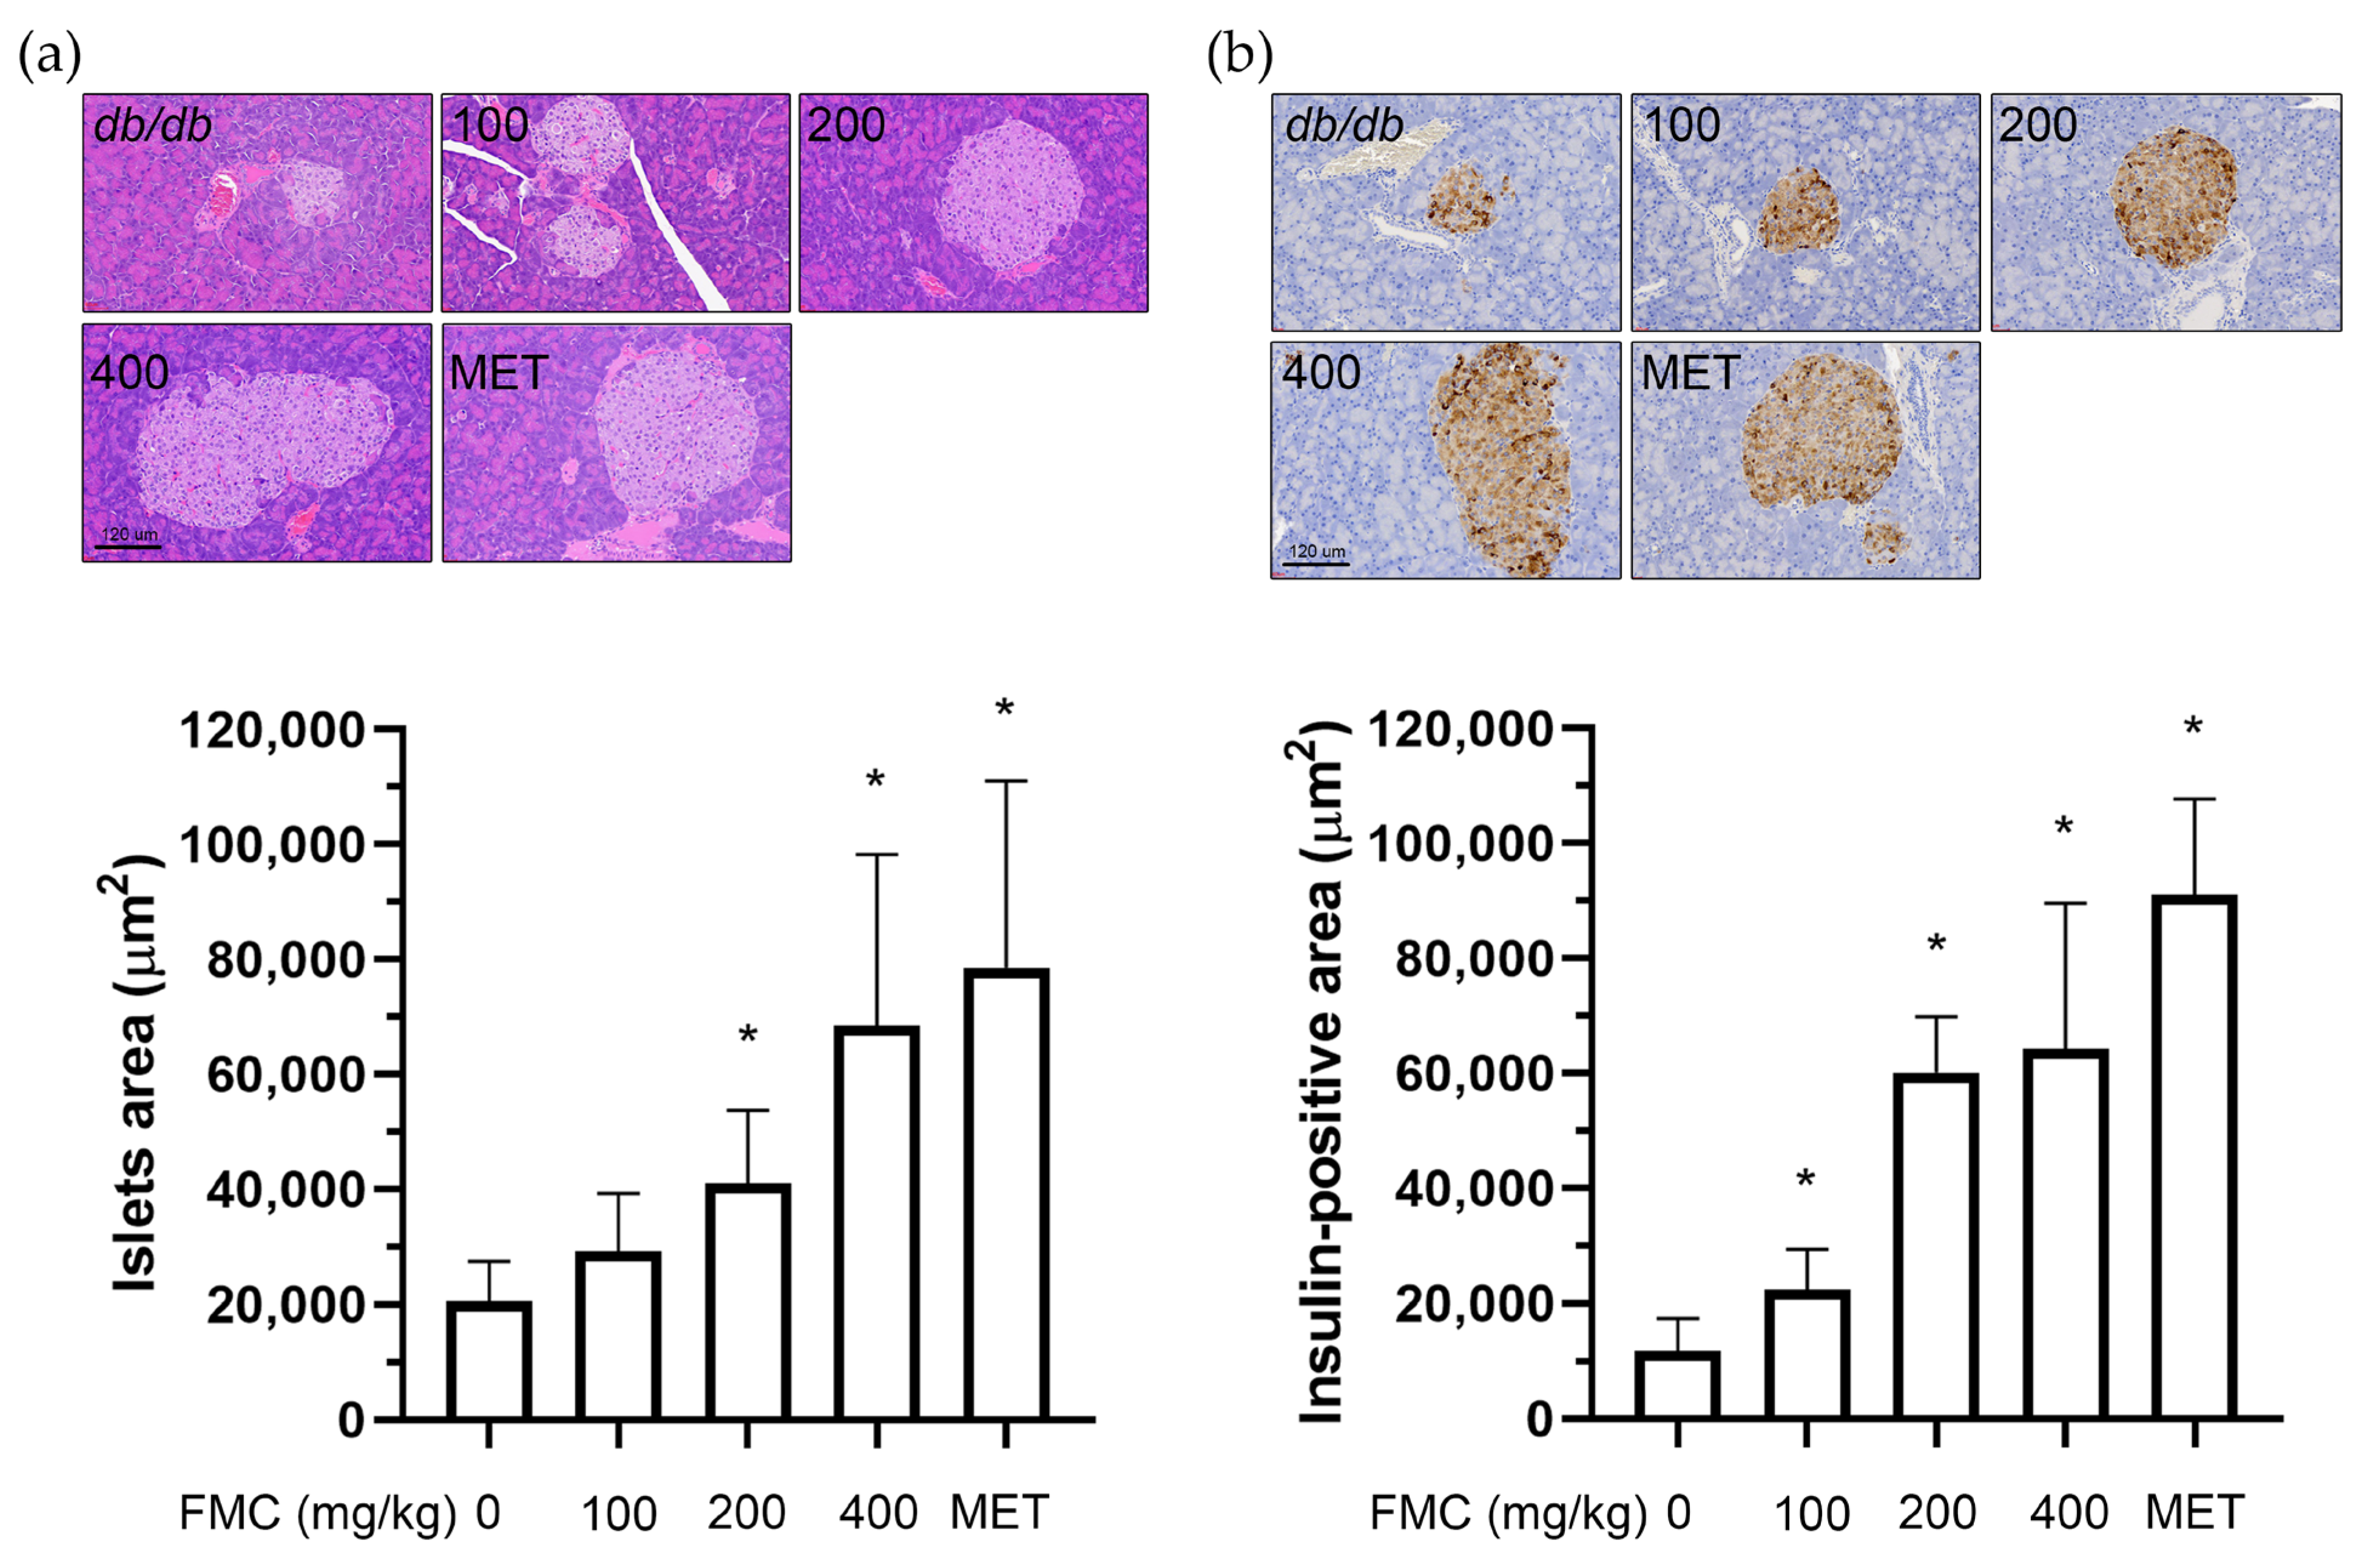
3.4. FMC Prevents Histopathological Changes and Increases Insulin Secretion in the Pancreas of db/db Mice
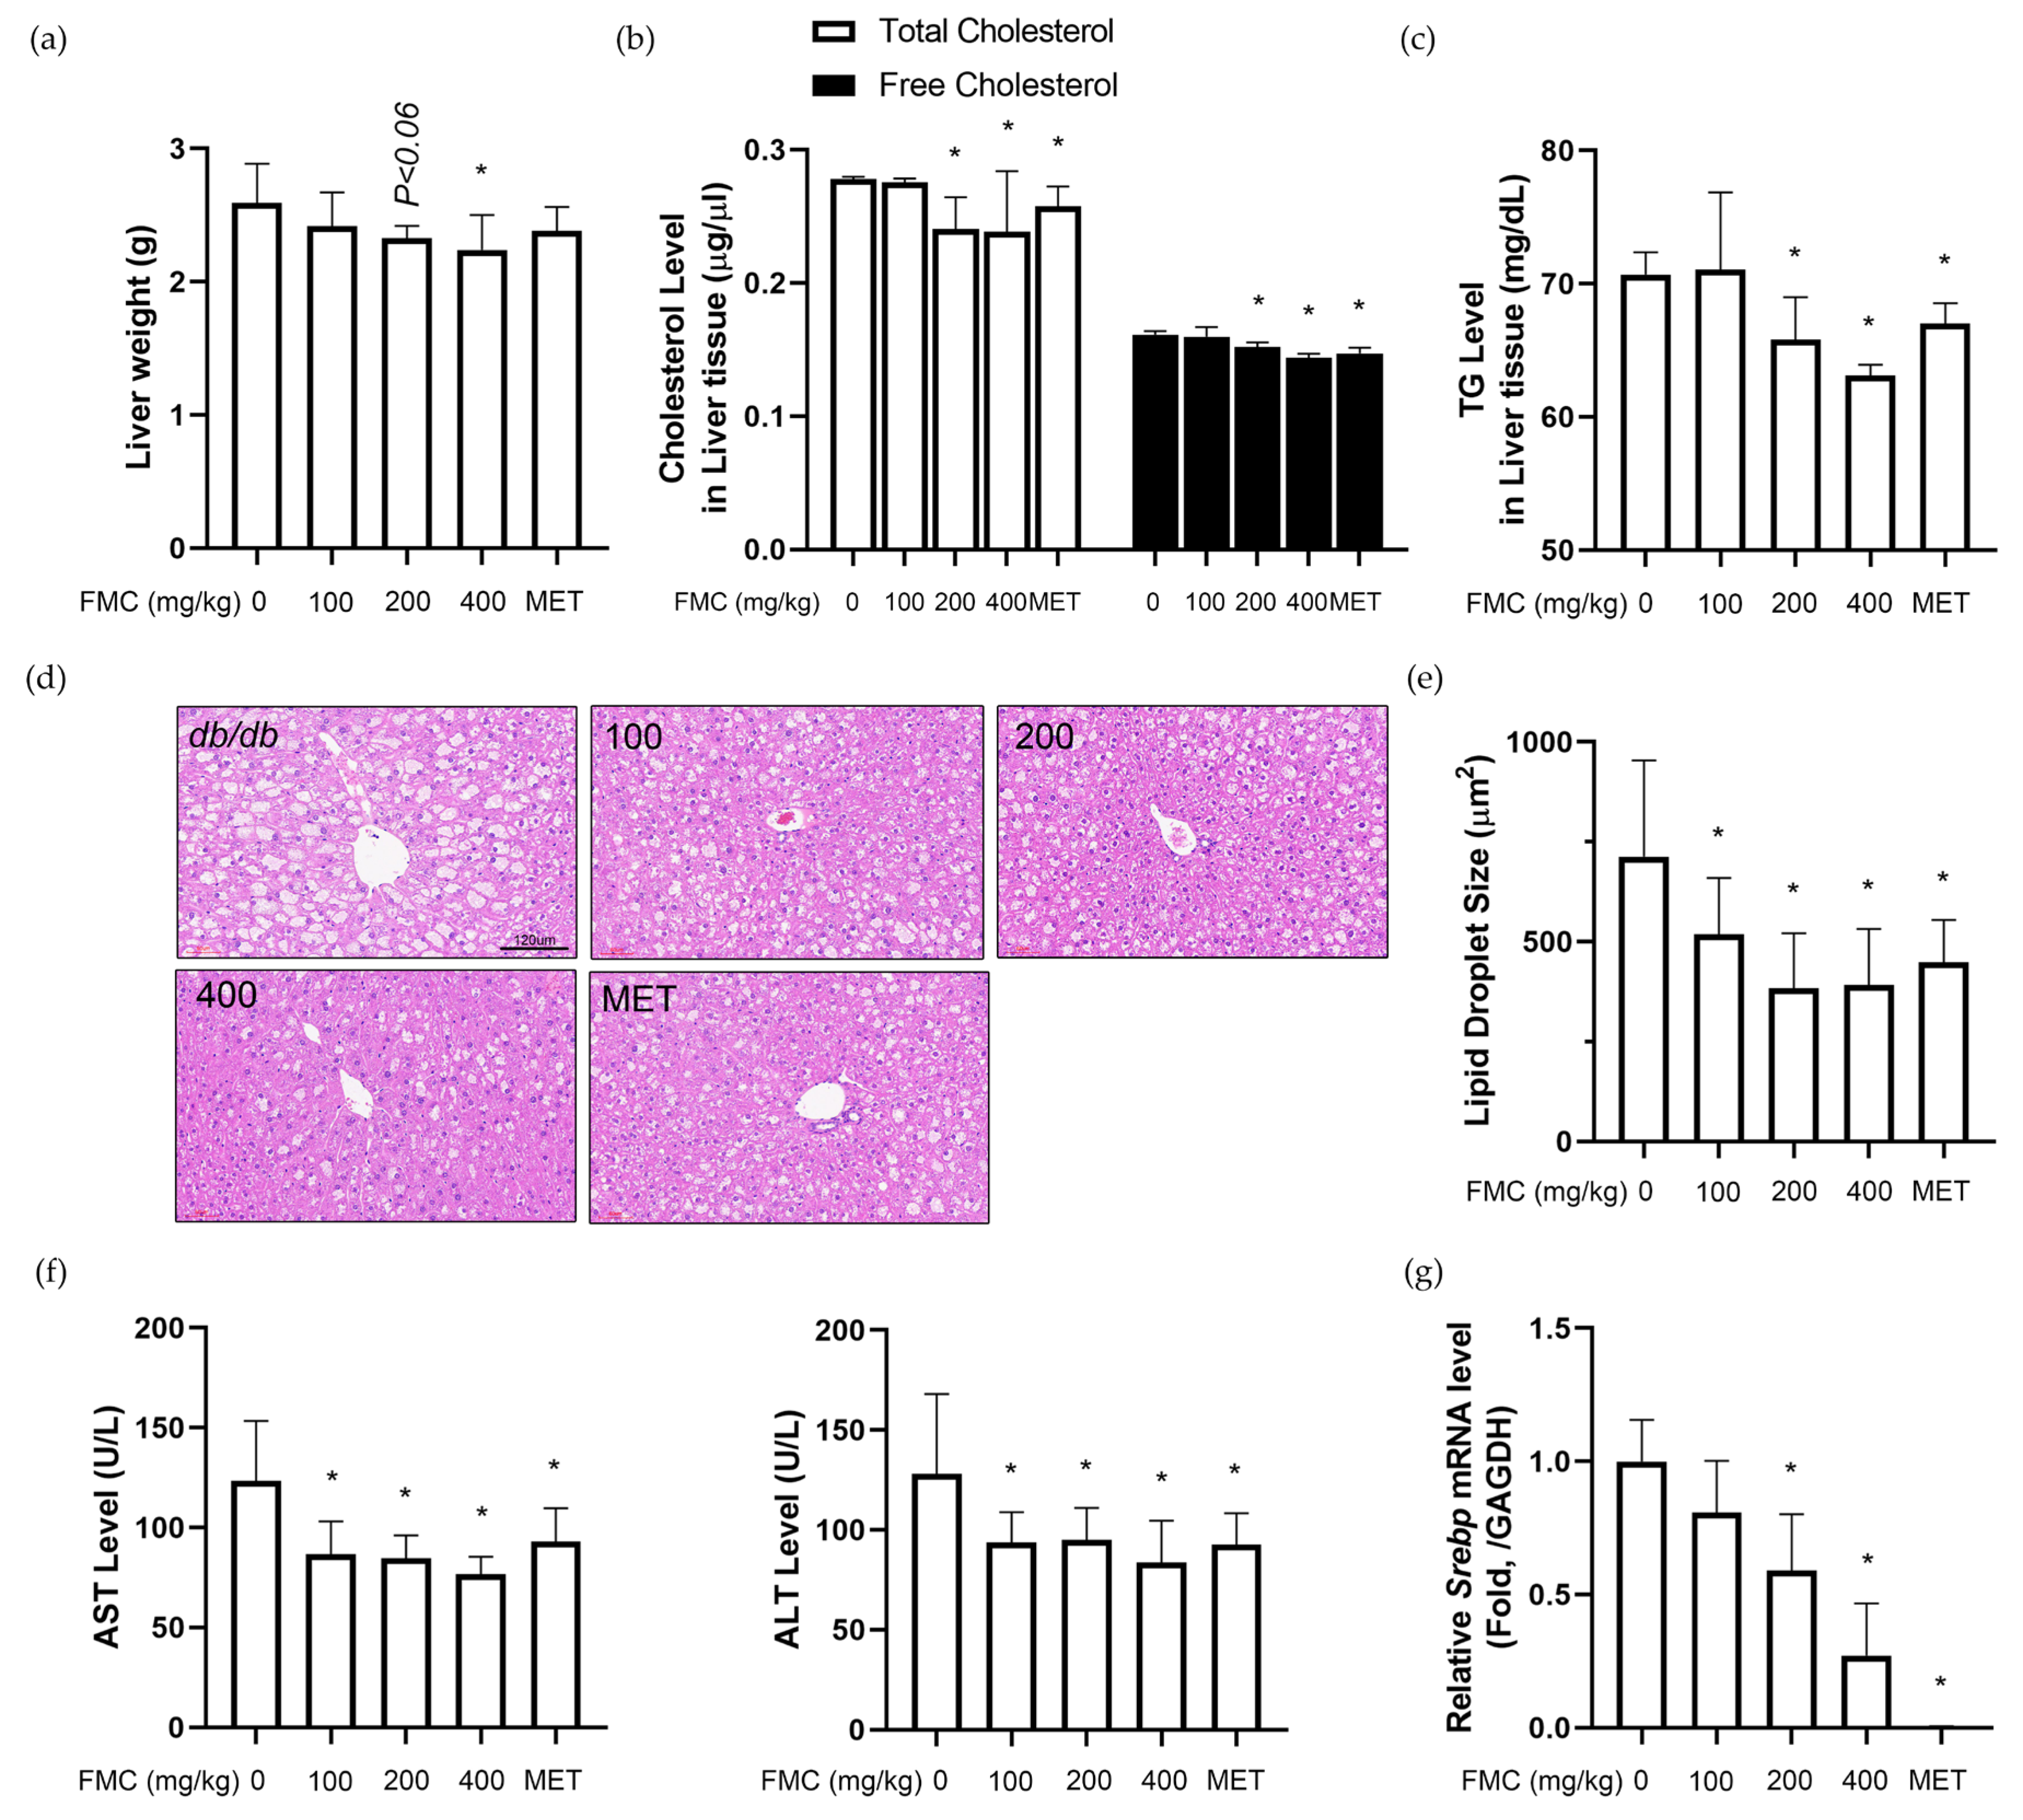
3.5. FMC Restores T2D-Induced Liver Injury in db/db Mice
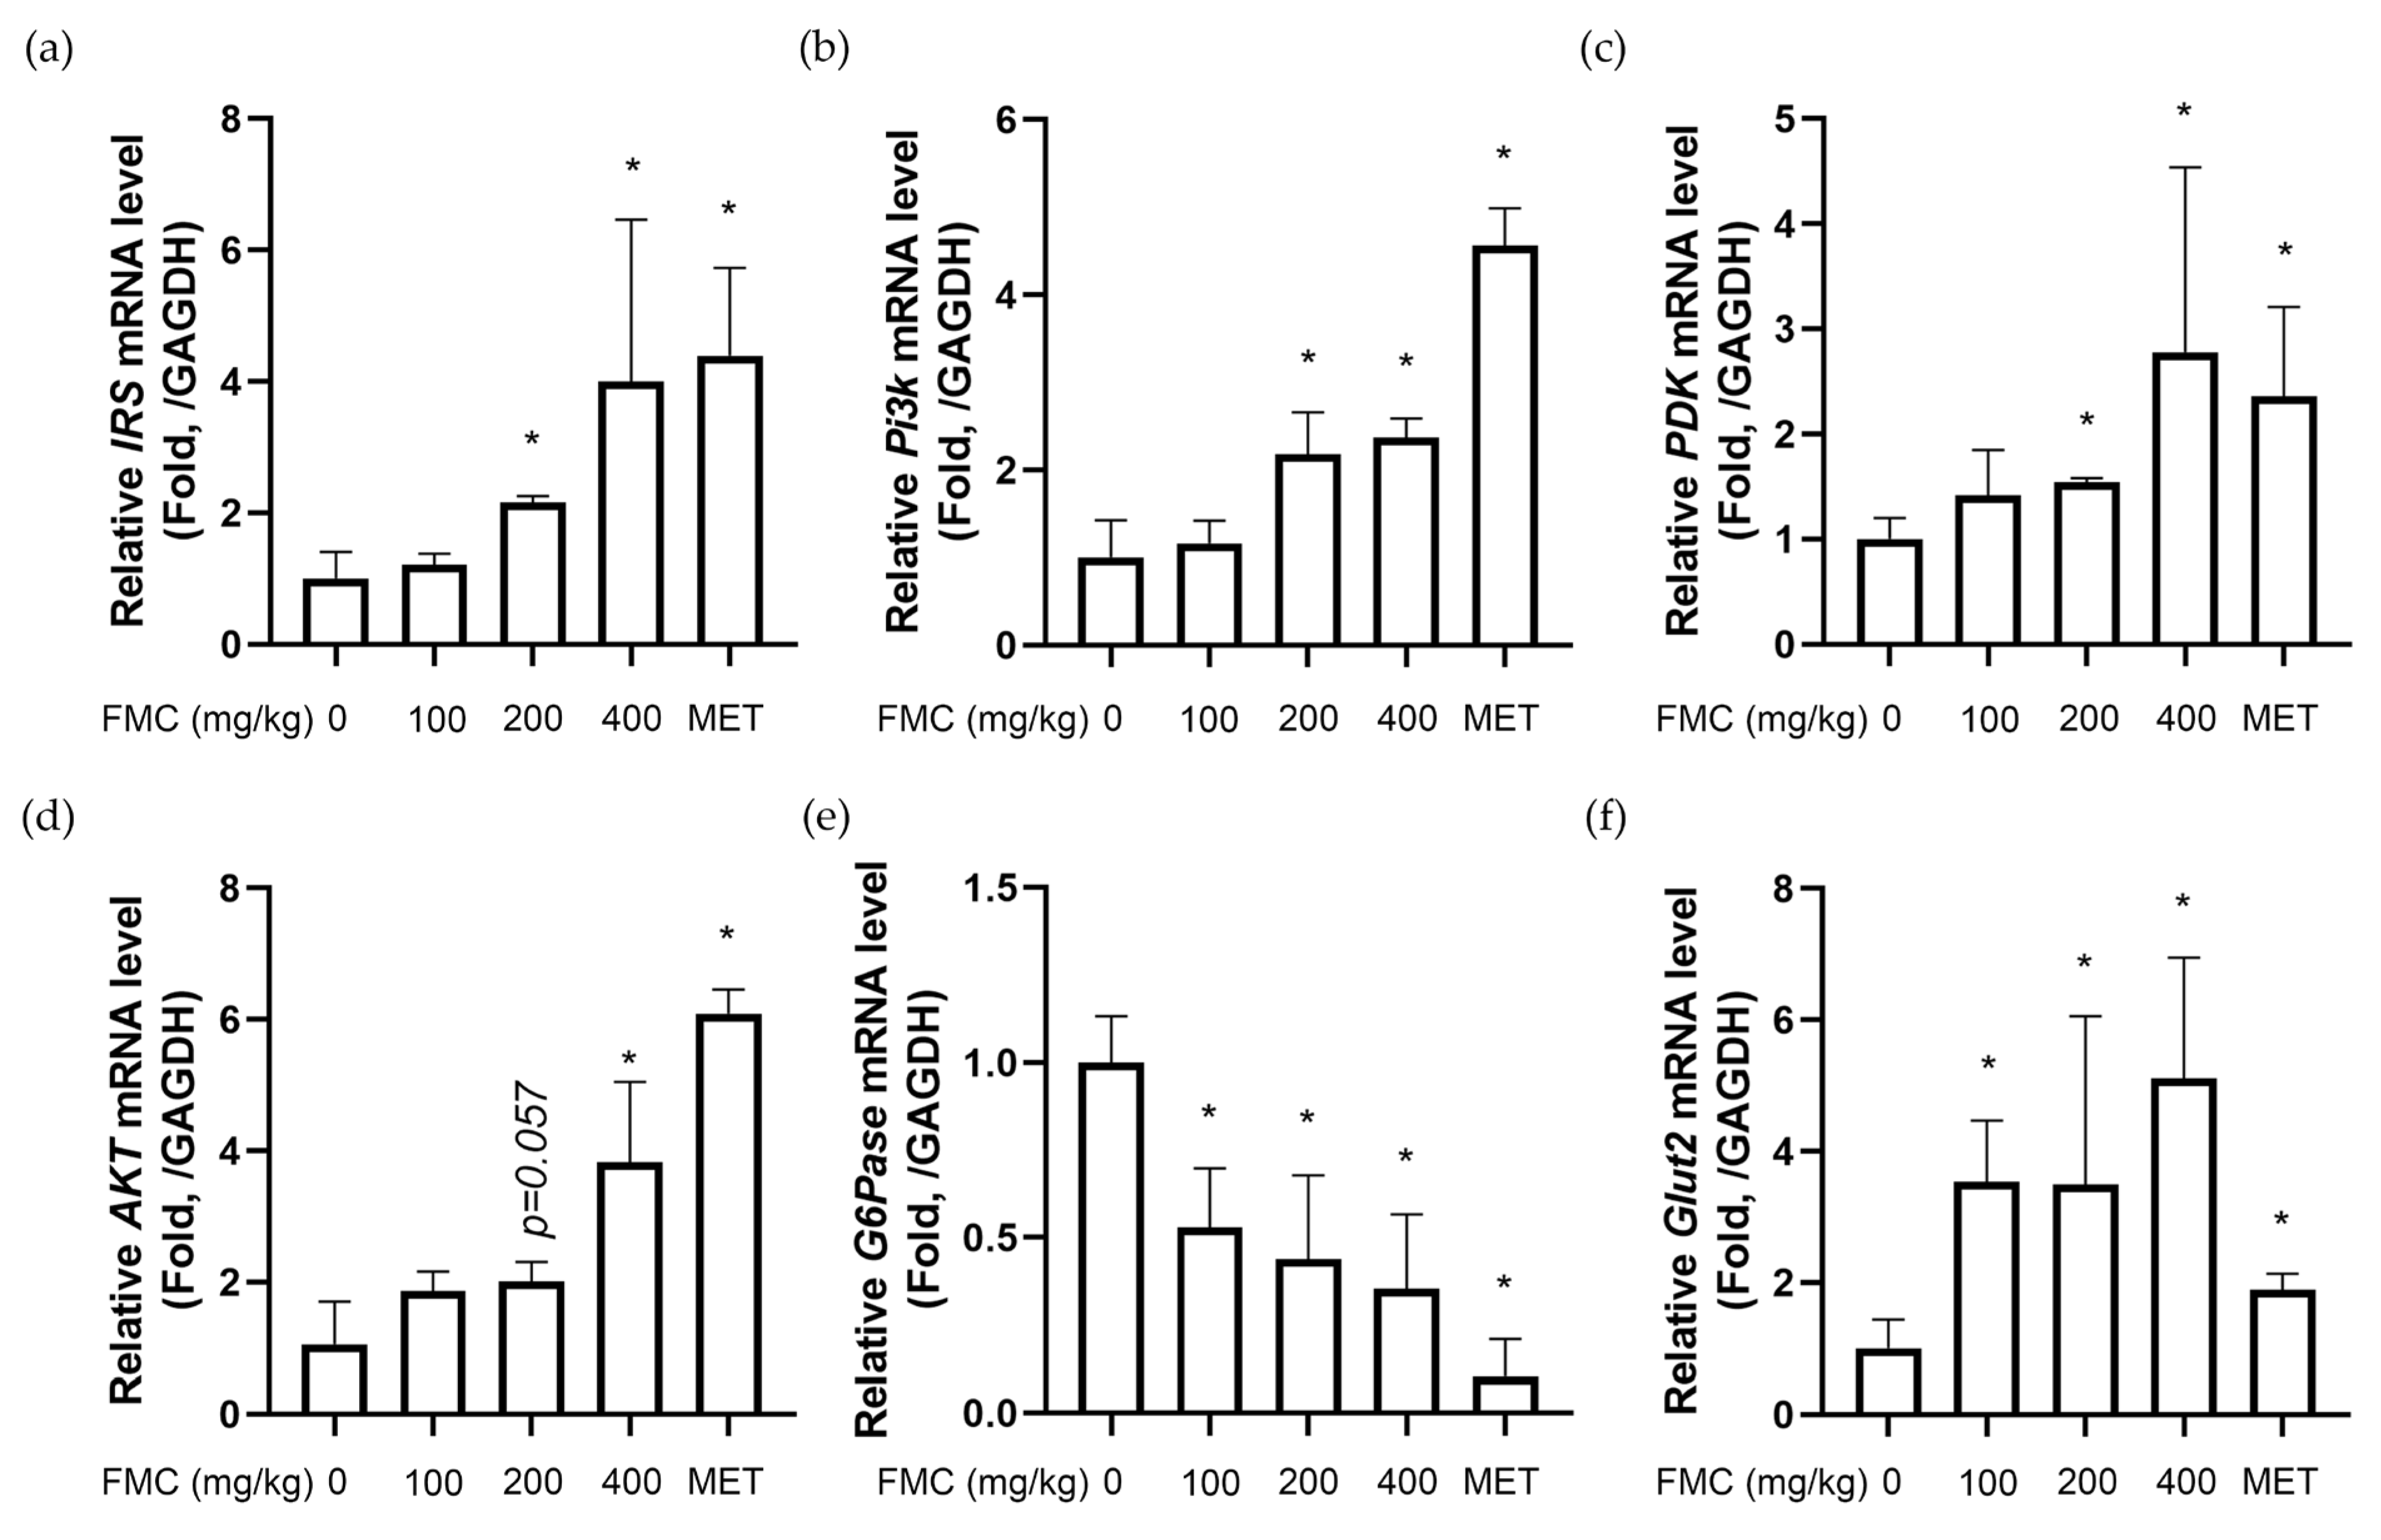
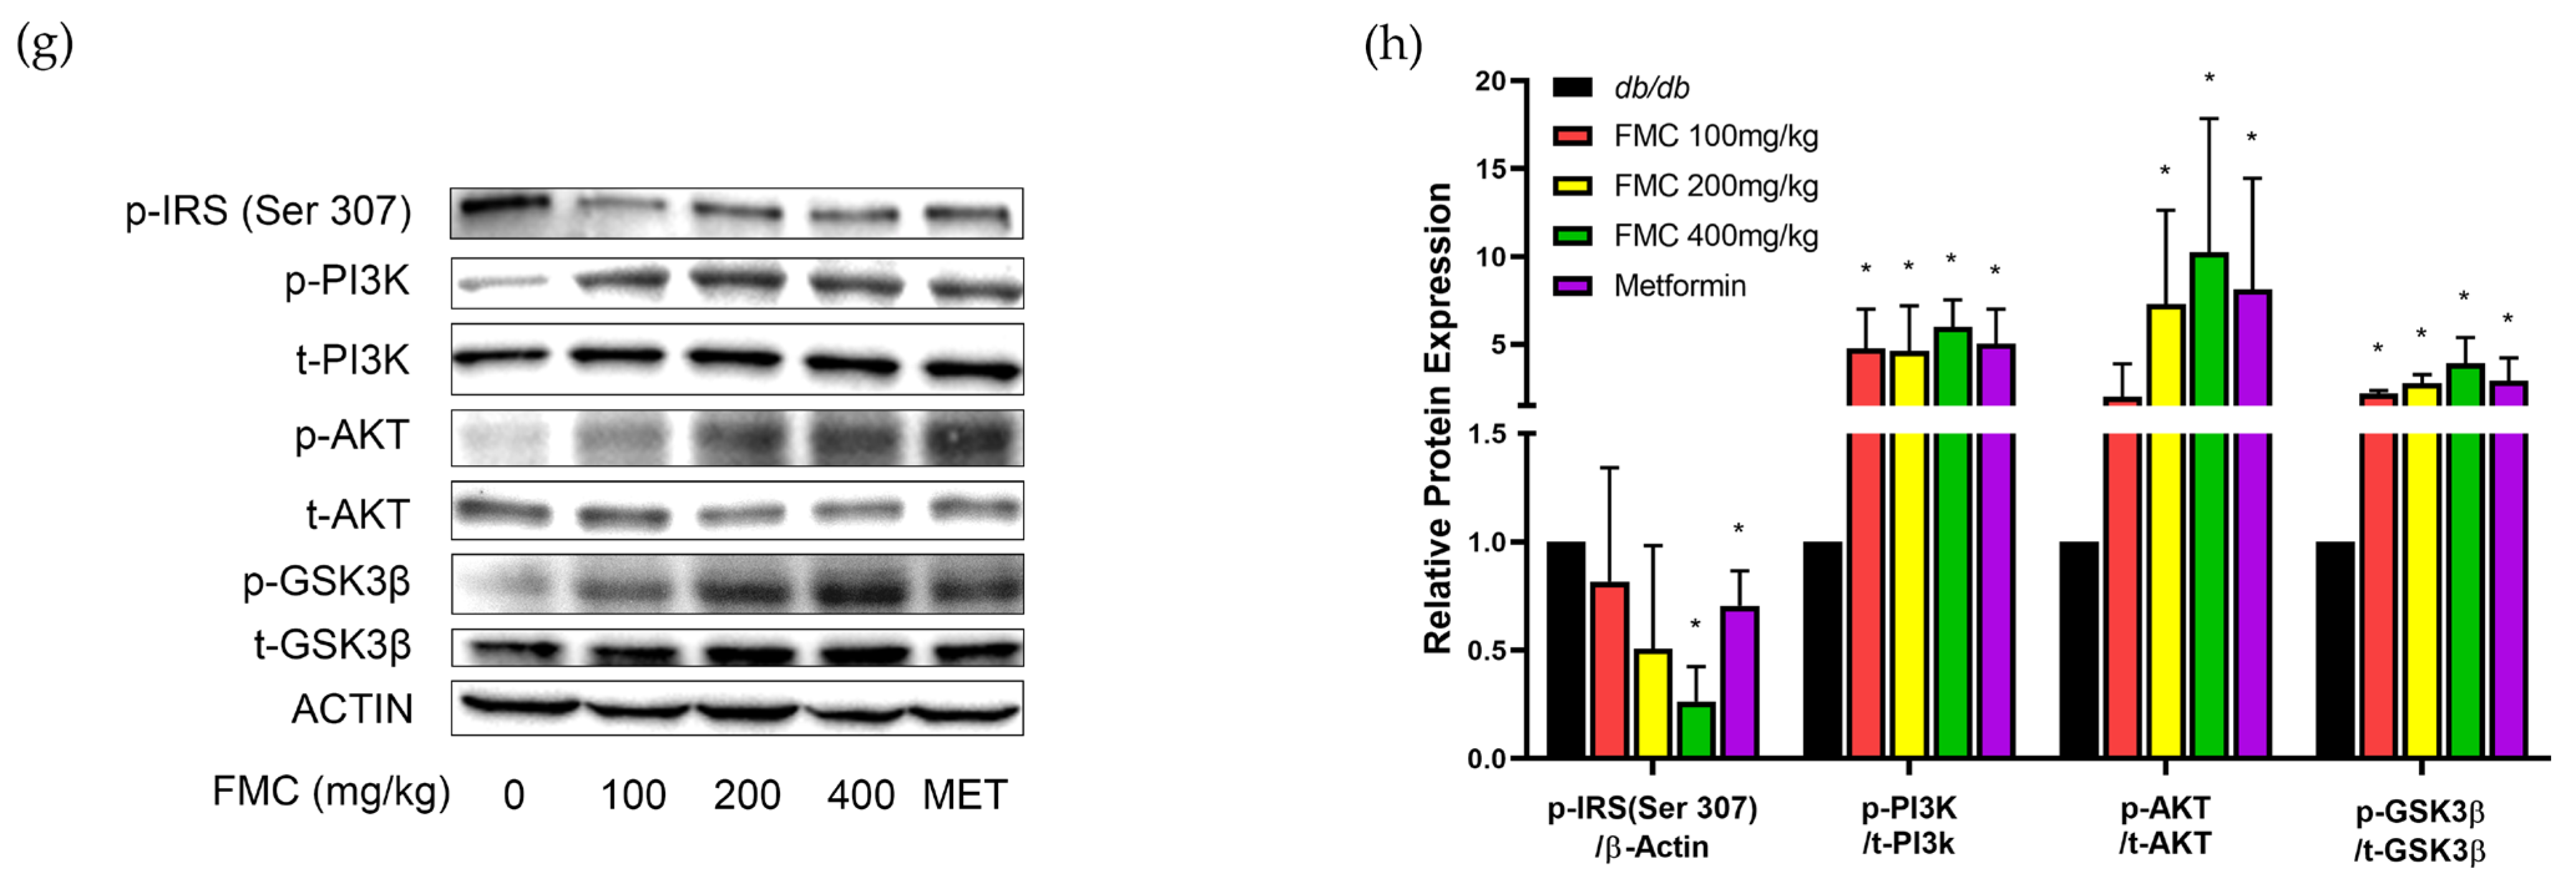
3.6. FMC Increases Expression of IRS-PI3K-AKT Pathway in Liver Tissues of db/db Mice
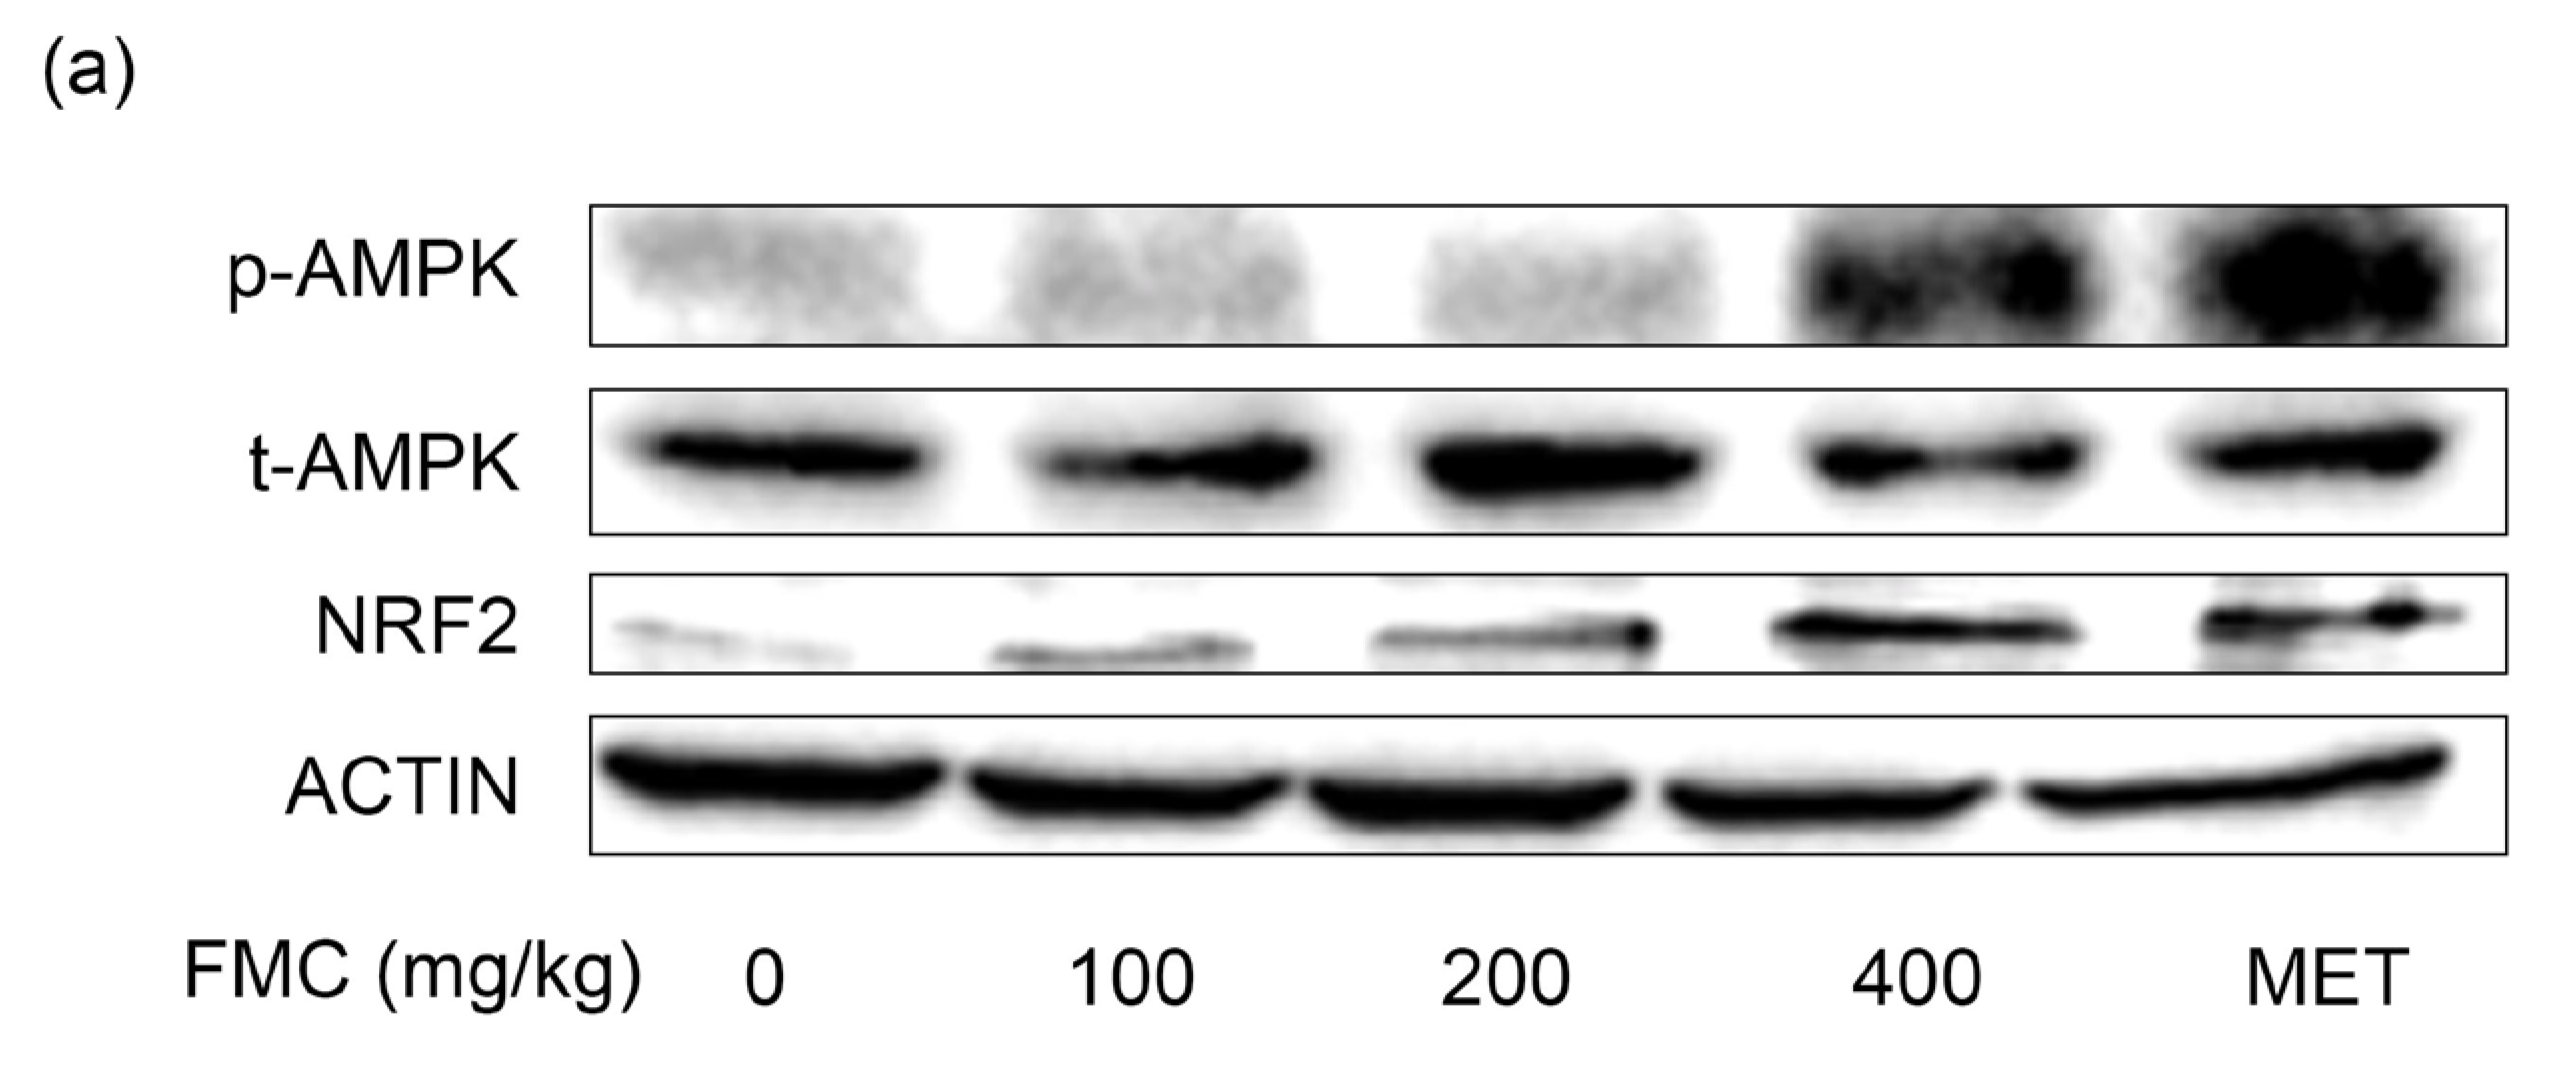
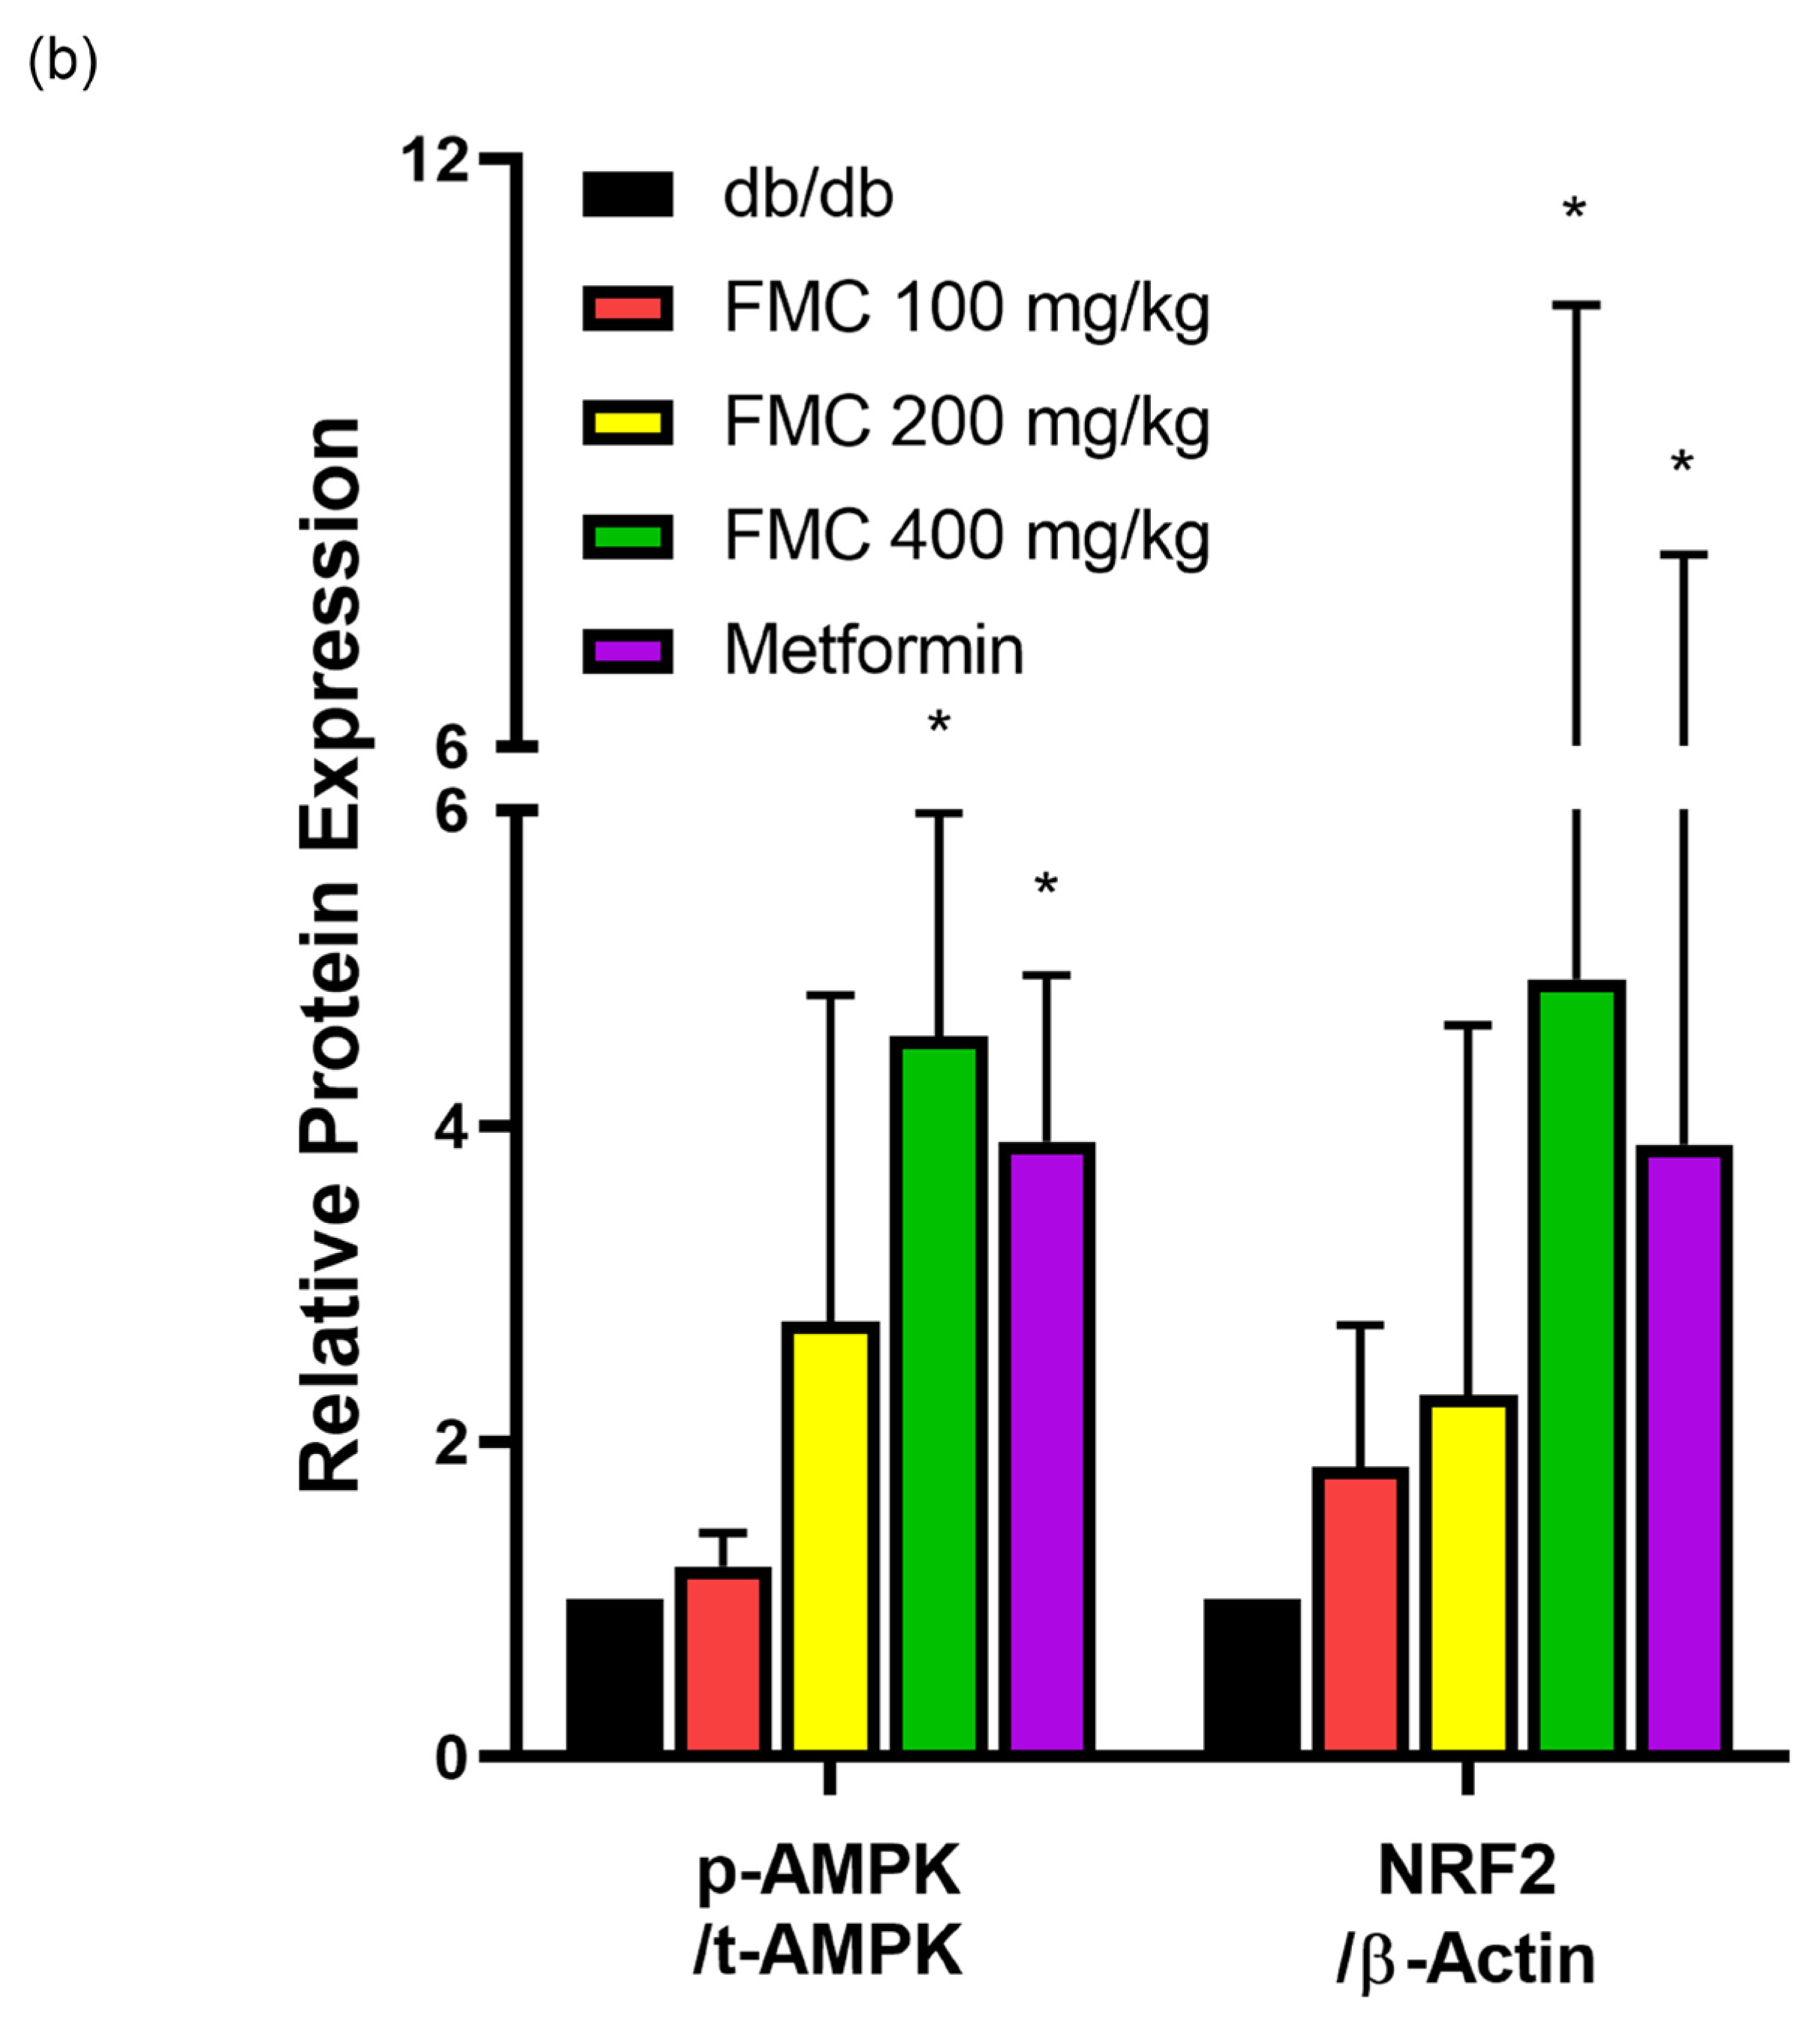
3.7. FMC Induces AMP-Activated Protein Kinase (AMPK) Phosphorylation and NRF2 Expression in Liver Tissues of db/db Mice
4. Discussion
Supplementary Materials
Author Contributions
Funding
Institutional Review Board Statement
Informed Consent Statement
Data Availability Statement
Conflicts of Interest
References
- Saeedi, P.; Petersohn, I.; Salpea, P.; Malanda, B.; Karuranga, S.; Unwin, N.; Colagiuri, S.; Guariguata, L.; Motala, A.A.; Ogurtsova, K.; et al. Global and regional diabetes prevalence estimates for 2019 and projections for 2030 and 2045: Results from the International Diabetes Federation Diabetes Atlas, 9th edition. Diabetes Res. Clin. Pract. 2019, 157, 107843. [Google Scholar] [CrossRef] [PubMed] [Green Version]
- Talukdar, D.; Seenivasan, S.; Cameron, A.J.; Sacks, G. The association between national income and adult obesity prevalence: Empirical insights into temporal patterns and moderators of the association using 40 years of data across 147 countries. PLoS ONE 2020, 15, e0232236. [Google Scholar] [CrossRef] [PubMed]
- Wolosowicz, M.; Lukaszuk, B.; Chabowski, A. The Causes of Insulin Resistance in Type 1 Diabetes Mellitus: Is There a Place for Quaternary Prevention? Int. J. Environ. Res. Public Health 2020, 17, 8651. [Google Scholar] [CrossRef] [PubMed]
- Forouhi, N.G.; Wareham, N.J. Epidemiology of diabetes. Medicine 2014, 42, 698–702. [Google Scholar] [CrossRef] [Green Version]
- DeFronzo, R.A. Lilly lecture 1987. The triumvirate: Beta-cell, muscle, liver. A collusion responsible for NIDDM. Diabetes 1988, 37, 667–687. [Google Scholar] [CrossRef] [PubMed]
- DeFronzo, R.A.; Ferrannini, E. Regulation of hepatic glucose metabolism in humans. Diabetes Metab. Rev. 1987, 3, 415–459. [Google Scholar] [CrossRef]
- DeFronzo, R.A.; Gunnarsson, R.; Björkman, O.; Olsson, M.; Wahren, J. Effects of insulin on peripheral and splanchnic glucose metabolism in noninsulin-dependent (type II) diabetes mellitus. J. Clin. Invest. 1985, 76, 149–155. [Google Scholar] [CrossRef] [Green Version]
- Holman, R.R.; Paul, S.K.; Bethel, M.A.; Matthews, D.R.; Neil, H.A.W. 10-year follow-up of intensive glucose control in type 2 diabetes. N. Engl. J. Med. 2008, 359, 1577–1589. [Google Scholar] [CrossRef] [Green Version]
- Wolff, S.P.; Jiang, Z.Y.; Hunt, J.V. Protein glycation and oxidative stress in diabetes mellitus and ageing. Free. Radic. Biol. Med. 1991, 10, 339–352. [Google Scholar] [CrossRef]
- Coppey, L.J.; Gellett, J.S.; Davidson, E.P.; Dunlap, J.A.; Lund, D.D.; Yorek, M.A. Effect of antioxidant treatment of streptozotocin-induced diabetic rats on endoneurial blood flow, motor nerve conduction velocity, and vascular reactivity of epineurial arterioles of the sciatic nerve. Diabetes 2001, 50, 1927–1937. [Google Scholar] [CrossRef] [Green Version]
- Palmeira, C.M.; Santos, D.L.; Seiça, R.; Moreno, A.J.; Santos, M.S. Enhanced mitochondrial testicular antioxidant capacity in Goto-Kakizaki diabetic rats: Role of coenzyme Q. Am. J. Physiol. Cell Physiol. 2001, 281, C1023–C1028. [Google Scholar] [CrossRef]
- Hwang, Y.-C. Oral Antidiabetic Agents in Patients with Chronic Kidney Disease. J. Korean Diabetes 2011, 12, 194–197. [Google Scholar] [CrossRef] [Green Version]
- Bailey, C.J. Insulin resistance and antidiabetic drugs. Biochem. Pharmacol. 1999, 58, 1511–1520. [Google Scholar] [CrossRef]
- Zhang, B.B.; Moller, D.E. New approaches in the treatment of type 2 diabetes. Curr. Opin. Chem. Biol. 2000, 4, 461–467. [Google Scholar] [CrossRef] [PubMed]
- Bagg, W.; Plank, L.; Gamble, G.; Drury, P.; Sharpe, N.; Braatvedt, G. The effects of intensive glycaemic control on body composition in patients with type 2 diabetes. Diabetes Obes. Metab. 2001, 3, 410–416. [Google Scholar] [CrossRef] [PubMed]
- Aschner, P. Recent advances in understanding/managing type 2 diabetes mellitus. F1000Research 2017, 6, 1922. [Google Scholar] [CrossRef] [PubMed] [Green Version]
- Hadi, A.; Arab, A.; Hajianfar, H.; Talaei, B.; Miraghajani, M.; Babajafari, S.; Marx, W.; Tavakoly, R. The effect of fenugreek seed supplementation on serum irisin levels, blood pressure, and liver and kidney function in patients with type 2 diabetes mellitus: A parallel randomized clinical trial. Complement Ther. Med. 2020, 49, 102315. [Google Scholar] [CrossRef] [PubMed]
- Mahdavi-Roshan, M.; Salari, A.; Vakilpour, A.; Savar Rakhsh, A.; Ghorbani, Z. Rice bran oil could favorably ameliorate atherogenicity and insulin resistance indices among men with coronary artery disease: Post hoc analysis of a randomized controlled trial. Lipids Health Dis. 2021, 20, 153. [Google Scholar] [CrossRef]
- Agarie, S.; Shimoda, T.; Shimizu, Y.; Baumann, K.; Sunagawa, H.; Kondo, A.; Ueno, O.; Nakahara, T.; Nose, A.; Cushman, J.C. Salt tolerance, salt accumulation, and ionic homeostasis in an epidermal bladder-cell-less mutant of the common ice plant Mesembryanthemum crystallinum. J. Exp. Bot. 2007, 58, 1957–1967. [Google Scholar] [CrossRef]
- Agarie, S.; Kawaguchi, A.; Kodera, A.; Sunagawa, H.; Kojima, H.; Nose, A.; Nakahara, T. Potential of the Common Ice Plant, Mesembryanthemum crystallinum as a New High-Functional Food as Evaluated by Polyol Accumulation. Plant Prod. Sci. 2009, 12, 37–46. [Google Scholar] [CrossRef]
- Gao, Y.; Zhang, M.; Wu, T.; Xu, M.; Cai, H.; Zhang, Z. Effects of D-Pinitol on Insulin Resistance through the PI3K/Akt Signaling Pathway in Type 2 Diabetes Mellitus Rats. J. Agric. Food Chem. 2015, 63, 6019–6026. [Google Scholar] [CrossRef] [PubMed]
- Pak, Y.; Hong, Y.; Kim, S.; Piccariello, T.; Farese, R.V.; Larner, J. In vivo chiro-inositol metabolism in the rat: A defect in chiro-inositol synthesis from myo-inositol and an increased incorporation of chiro-[3H]inositol into phospholipid in the Goto-Kakizaki (G.K) rat. Mol. Cells 1998, 8, 301–309. [Google Scholar] [PubMed]
- Ibtissem, B.; Abdelly, C.; Sfar, S. Antioxidant and antibacterial properties of Mesembryanthemum crystallinum and Carpobrotus edulis extracts. Adv. Chem. Eng. Sci. 2012, 2, 359–365. [Google Scholar] [CrossRef] [Green Version]
- Nam, S.; Kang, S.; Kim, S.; Ko, K. Effect of fermented ice plant (Mesembryanthemum crystallinum L.) extracts against antioxidant, antidiabetic and liver protection. J. Life Sci. 2017, 27, 909–918. [Google Scholar]
- Lee, B.H.; Lee, C.C.; Wu, S.C. Ice plant (Mesembryanthemum crystallinum) improves hyperglycaemia and memory impairments in a Wistar rat model of streptozotocin-induced diabetes. J. Sci. Food Agric. 2014, 94, 2266–2273. [Google Scholar] [CrossRef]
- Burana, C.; Congtrakultien, M.; Kamthornsiriwimol, N. A Novel Growth and Development of Mesembryanthemum crystallinum (Aizoaceae) in Thailand. Int. Sci. J. Eng. Technol. 2020, 4, 1–5. [Google Scholar]
- Tembo-Phiri, C. Edible Fynbos Plants: A Soil Types and Irrigation Regime Investigation on Tetragonia Decumbens and Mesembryanthemum Crystallinum. Ph.D. Thesis, Stellenbosch University, Stellenbosch, South Africa, 2019. [Google Scholar]
- Loconsole, D.; Murillo-Amador, B.; Cristiano, G.; De Lucia, B. Halophyte common ice plants: A future solution to arable land salinization. Sustainability 2019, 11, 6076. [Google Scholar] [CrossRef] [Green Version]
- Park, W.Y.; Song, G.; Park, J.Y.; Kim, K.I.; Ahn, K.S.; Kwak, H.J.; Leem, J.; Um, J.Y.; Park, J. Fruit of Gardenia jasminoides Induces Mitochondrial Activation and Non-Shivering Thermogenesis through Regulation of PPARγ. Antioxidants 2021, 10, 1418. [Google Scholar] [CrossRef]
- Hong, M.; Kang, M.J.; Pak, S.; Han, I.-H.; Bae, H. Bee venom phospholipase A2 ameliorates amyotrophic lateral sclerosis by increasing regulatory T cell population. Adv. Tradit. Med. 2022, 22, 599–606. [Google Scholar] [CrossRef]
- Zhang, C.; Wu, W.; Xin, X.; Li, X.; Liu, D. Extract of ice plant (Mesembryanthemum crystallinum) ameliorates hyperglycemia and modulates the gut microbiota composition in type 2 diabetic Goto-Kakizaki rats. Food Funct. 2019, 10, 3252–3261. [Google Scholar] [CrossRef]
- Burke, S.J.; Batdorf, H.M.; Burk, D.H.; Noland, R.C.; Eder, A.E.; Boulos, M.S.; Karlstad, M.D.; Collier, J.J. db/db Mice Exhibit Features of Human Type 2 Diabetes That Are Not Present in Weight-Matched C57BL/6J Mice Fed a Western Diet. J. Diabetes Res. 2017, 2017, 8503754. [Google Scholar] [CrossRef] [PubMed] [Green Version]
- Stancoven, A.; McGuire, D.K. Preventing macrovascular complications in type 2 diabetes mellitus: Glucose control and beyond. Am. J. Cardiol. 2007, 99, 5h–11h. [Google Scholar] [CrossRef]
- Gerich, J.E. Clinical significance, pathogenesis, and management of postprandial hyperglycemia. Arch. Intern. Med. 2003, 163, 1306–1316. [Google Scholar] [CrossRef] [PubMed] [Green Version]
- Wilcox, G. Insulin and insulin resistance. Clin. Biochem. Rev. 2005, 26, 19. [Google Scholar]
- Sherwani, S.I.; Khan, H.A.; Ekhzaimy, A.; Masood, A.; Sakharkar, M.K. Significance of HbA1c test in diagnosis and prognosis of diabetic patients. Biomark. Insights 2016, 11, BMI-S38440. [Google Scholar] [CrossRef] [PubMed]
- Yun, W.J. Relationship between glycemic control and diabetic retinopathy. J. Korean Geriatr. Soc. 2010, 14, 234–241. [Google Scholar] [CrossRef]
- Kadowaki, T.; Yamauchi, T.; Kubota, N.; Hara, K.; Ueki, K.; Tobe, K. Adiponectin and adiponectin receptors in insulin resistance, diabetes, and the metabolic syndrome. J. Clin. Investig. 2006, 116, 1784–1792. [Google Scholar] [CrossRef] [Green Version]
- Spranger, J.; Kroke, A.; Möhlig, M.; Bergmann, M.M.; Ristow, M.; Boeing, H.; Pfeiffer, A.F. Adiponectin and protection against type 2 diabetes mellitus. Lancet 2003, 361, 226–228. [Google Scholar] [CrossRef]
- Choi, S.-I.; Lee, H.-A.; Han, J.-S. Retraction: Gynura procumbens extract improves insulin sensitivity and suppresses hepatic gluconeogenesis in C57BL/KsJ-db/db mice. Nutr. Res. Pract. 2019, 13, 76. [Google Scholar] [CrossRef]
- Erlandsen, S.L.; Hegre, O.D.; Parsons, J.A.; McEvoy, R.; Elde, R. Pancreatic islet cell hormones distribution of cell types in the islet and evidence for the presence of somatostatin and gastrin within the D cell. J. Histochem. Cytochem. 1976, 24, 883–897. [Google Scholar] [CrossRef] [Green Version]
- Lefèbvre, P. Diabetes as a paracrinopathy of the islets of Langerhans. Eur. Endocrinol. 2011, 7, 79–82. [Google Scholar] [CrossRef]
- Bae, U.J.; Park, S.H.; Jung, S.Y.; Park, B.H.; Chae, S.W. Hypoglycemic effects of aqueous persimmon leaf extract in a murine model of diabetes. Mol. Med. Rep. 2015, 12, 2547–2554. [Google Scholar] [CrossRef] [PubMed] [Green Version]
- Salih, N.D.; Azmi, N.; Gopalan, H.K. The protective effects of Phaleria macrocarpa leaves methanol extract on pancreatic islets histology in streptozotocin—Induced diabetic rats. Sci. Int. 2015, 27, 4219–4224. [Google Scholar]
- Li, J.; Du, H.; Zhang, M.; Zhang, Z.; Teng, F.; Zhao, Y.; Zhang, W.; Yu, Y.; Feng, L.; Cui, X.; et al. Amorphous solid dispersion of Berberine mitigates apoptosis via iPLA(2)β/Cardiolipin/Opa1 pathway in db/db mice and in Palmitate-treated MIN6 β-cells. Int. J. Biol. Sci. 2019, 15, 1533–1545. [Google Scholar] [CrossRef] [Green Version]
- Keles, U.; Ow, J.R.; Kuentzel, K.B.; Zhao, L.N.; Kaldis, P. Liver-derived metabolites as signaling molecules in fatty liver disease. Cell. Mol. Life Sci. 2022, 80, 4. [Google Scholar] [CrossRef] [PubMed]
- Okazaki, H.; Goldstein, J.L.; Brown, M.S.; Liang, G. LXR-SREBP-1c-phospholipid transfer protein axis controls very low density lipoprotein (VLDL) particle size. J. Biol. Chem. 2010, 285, 6801–6810. [Google Scholar] [CrossRef] [Green Version]
- Jiang, Y.; Liu, L.; Li, H.; Wang, J.M.; Steinle, J.J. Insulin Signal Transduction is Impaired in the Type 2 Diabetic Retina. J. Diabetes Clin. Res. 2020, 2, 12–15. [Google Scholar]
- Matzinger, M.; Fischhuber, K.; Pölöske, D.; Mechtler, K.; Heiss, E.H. AMPK leads to phosphorylation of the transcription factor Nrf2, tuning transactivation of selected target genes. Redox Biol. 2020, 29, 101393. [Google Scholar] [CrossRef]
- Jayanthy, G.; Subramanian, S. RA abrogates hepatic gluconeogenesis and insulin resistance by enhancing IRS-1 and AMPK signalling in experimental type 2 diabetes. RSC Adv. 2015, 5, 44053–44067. [Google Scholar] [CrossRef]
- Wang, Q.; Liu, S.; Zhai, A.; Zhang, B.; Tian, G. AMPK-Mediated Regulation of Lipid Metabolism by Phosphorylation. Biol. Pharm. Bull. 2018, 41, 985–993. [Google Scholar] [CrossRef] [Green Version]
- Goel, S.; Singh, R.; Singh, V.; Singh, H.; Kumari, P.; Chopra, H.; Sharma, R.; Nepovimova, E.; Valis, M.; Kuca, K.; et al. Metformin: Activation of 5′ AMP-activated protein kinase and its emerging potential beyond anti-hyperglycemic action. Front. Genet. 2022, 13, 1022739. [Google Scholar] [CrossRef]
- Lee, S.Y.; Choi, H.D.; Yu, S.N.; Kim, S.H.; Park, S.K.; Ahn, S.C. Biological activities of Mesembryanthemum crystallinum (ice plant) extract. J. Life Sci. 2015, 25, 638–645. [Google Scholar] [CrossRef] [Green Version]
- Pintaudi, B.; Di Vieste, G.; Bonomo, M. The Effectiveness of Myo-Inositol and D-Chiro Inositol Treatment in Type 2 Diabetes. Int. J. Endocrinol. 2016, 2016, 9132052. [Google Scholar] [CrossRef] [Green Version]
- Yoshida, K.; Yamaguchi, M.; Morinaga, T.; Ikeuchi, M.; Kinehara, M.; Ashida, H. Genetic modification of Bacillus subtilis for production of D-chiro-inositol, an investigational drug candidate for treatment of type 2 diabetes and polycystic ovary syndrome. Appl. Environ. Microbiol. 2006, 72, 1310–1315. [Google Scholar] [CrossRef] [Green Version]
- Wang, B.; Chandrasekera, P.C.; Pippin, J.J. Leptin- and leptin receptor-deficient rodent models: Relevance for human type 2 diabetes. Curr. Diabetes Rev. 2014, 10, 131–145. [Google Scholar] [CrossRef] [Green Version]
- Röder, P.V.; Wu, B.; Liu, Y.; Han, W. Pancreatic regulation of glucose homeostasis. Exp. Mol. Med. 2016, 48, e219. [Google Scholar] [CrossRef] [Green Version]
- Pratley, R.E. The early treatment of type 2 diabetes. Am. J. Med. 2013, 126, S2–S9. [Google Scholar] [CrossRef] [PubMed]
- Basu, R.; Barosa, C.; Jones, J.; Dube, S.; Carter, R.; Basu, A.; Rizza, R.A. Pathogenesis of prediabetes: Role of the liver in isolated fasting hyperglycemia and combined fasting and postprandial hyperglycemia. J. Clin. Endocrinol. Metab. 2013, 98, E409–E417. [Google Scholar] [CrossRef] [PubMed] [Green Version]
- Beck-Nielsen, H.; Hother-Nielsen, O.; Staehr, P. Is hepatic glucose production increased in type 2 diabetes mellitus? Curr. Diabetes Rep. 2002, 2, 231–236. [Google Scholar] [CrossRef]
- Hu, X.-Y.; Li, Y.; Li, L.-Q.; Zheng, Y.; Lv, J.-H.; Huang, S.-C.; Zhang, W.; Liu, L.; Zhao, L.; Liu, Z. Risk factors and biomarkers of non-alcoholic fatty liver disease: An observational cross-sectional population survey. BMJ Open 2018, 8, e019974. [Google Scholar] [CrossRef] [Green Version]
- Mazzotti, A.; Caletti, M.T.; Marchignoli, F.; Forlani, G.; Marchesini, G. Which treatment for type 2 diabetes associated with non-alcoholic fatty liver disease? Dig. Liver Dis. 2017, 49, 235–240. [Google Scholar] [CrossRef] [PubMed]
- Shimomura, I.; Matsuda, M.; Hammer, R.E.; Bashmakov, Y.; Brown, M.S.; Goldstein, J.L. Decreased IRS-2 and Increased SREBP-1c Lead to Mixed Insulin Resistance and Sensitivity in Livers of Lipodystrophic and ob/ob Mice. Mol. Cell 2000, 6, 77–86. [Google Scholar] [CrossRef]
- Sajan, M.P.; Standaert, M.L.; Rivas, J.; Miura, A.; Kanoh, Y.; Soto, J.; Taniguchi, C.M.; Kahn, C.R.; Farese, R.V. Role of atypical protein kinase C in activation of sterol regulatory element binding protein-1c and nuclear factor kappa B (NFκB) in liver of rodents used as a model of diabetes, and relationships to hyperlipidaemia and insulin resistance. Diabetologia 2009, 52, 1197–1207. [Google Scholar] [CrossRef] [PubMed] [Green Version]
- Zhang, Z.; Liu, H.; Liu, J. Akt activation: A potential strategy to ameliorate insulin resistance. Diabetes Res. Clin. Pract. 2019, 156, 107092. [Google Scholar] [CrossRef] [PubMed]
- Huang, X.; Liu, G.; Guo, J.; Su, Z. The PI3K/AKT pathway in obesity and type 2 diabetes. Int. J. Biol. Sci. 2018, 14, 1483–1496. [Google Scholar] [CrossRef] [Green Version]
- Yuan, Q.; Zhan, B.; Chang, R.; Du, M.; Mao, X. Antidiabetic Effect of Casein Glycomacropeptide Hydrolysates on High-Fat Diet and STZ-Induced Diabetic Mice via Regulating Insulin Signaling in Skeletal Muscle and Modulating Gut Microbiota. Nutrients 2020, 12, 220. [Google Scholar] [CrossRef] [Green Version]
- He, C.-J.; Ma, L.-Q.; Iqbal, M.S.; Huang, X.-J.; Li, J.; Yang, G.-Z.; Ihsan, A. Veratrilla baillonii Franch exerts anti-diabetic activity and improves liver injury through IRS/PI3K/AKT signaling pathways in type 2 diabetic db/db mice. J. Funct. Foods 2020, 75, 104204. [Google Scholar] [CrossRef]
- Towler, M.C.; Hardie, D.G. AMP-activated protein kinase in metabolic control and insulin signaling. Circ. Res. 2007, 100, 328–341. [Google Scholar] [CrossRef]
- Ha, J.; Lee, S. Role of AMPK in the regulation of cellular energy metabolism. J. Korean Endocr. Soc. 2010, 25, 9–17. [Google Scholar] [CrossRef] [Green Version]
- Viollet, B.; Foretz, M.; Guigas, B.; Horman, S.; Dentin, R.; Bertrand, L.; Hue, L.; Andreelli, F. Activation of AMP-activated protein kinase in the liver: A new strategy for the management of metabolic hepatic disorders. J. Physiol. 2006, 574, 41–53. [Google Scholar] [CrossRef]
- Fu, A.; Eberhard, C.E.; Screaton, R.A. Role of AMPK in pancreatic beta cell function. Mol. Cell Endocrinol. 2013, 366, 127–134. [Google Scholar] [CrossRef] [PubMed]
- Ferrannini, E. The target of metformin in type 2 diabetes. N. Engl. J. Med. 2014, 371, 1547–1548. [Google Scholar] [CrossRef] [PubMed] [Green Version]
- Hasanvand, A. The role of AMPK-dependent pathways in cellular and molecular mechanisms of metformin: A new perspective for treatment and prevention of diseases. Inflammopharmacology 2022, 30, 775–788. [Google Scholar] [CrossRef] [PubMed]


Disclaimer/Publisher’s Note: The statements, opinions and data contained in all publications are solely those of the individual author(s) and contributor(s) and not of MDPI and/or the editor(s). MDPI and/or the editor(s) disclaim responsibility for any injury to people or property resulting from any ideas, methods, instructions or products referred to in the content. |
© 2023 by the authors. Licensee MDPI, Basel, Switzerland. This article is an open access article distributed under the terms and conditions of the Creative Commons Attribution (CC BY) license (https://creativecommons.org/licenses/by/4.0/).
Share and Cite
Kim, H.-L.; Jung, Y.; Kim, H.I.; Sung, N.-Y.; Kim, M.-J.; Han, I.-J.; Kim, G.; Nho, E.Y.; Park, S.-Y.; Han, Y.; et al. Antidiabetic Effect of Fermented Mesembryanthemum crystallinum L. in db/db Mice Involves Regulation of PI3K-Akt Pathway. Curr. Issues Mol. Biol. 2023, 45, 6415-6431. https://doi.org/10.3390/cimb45080405
Kim H-L, Jung Y, Kim HI, Sung N-Y, Kim M-J, Han I-J, Kim G, Nho EY, Park S-Y, Han Y, et al. Antidiabetic Effect of Fermented Mesembryanthemum crystallinum L. in db/db Mice Involves Regulation of PI3K-Akt Pathway. Current Issues in Molecular Biology. 2023; 45(8):6415-6431. https://doi.org/10.3390/cimb45080405
Chicago/Turabian StyleKim, Hye-Lin, Yunu Jung, Hyo In Kim, Nak-Yun Sung, Min-Jee Kim, In-Jun Han, Geon Kim, Eun Yeong Nho, Sang-Yun Park, Yohan Han, and et al. 2023. "Antidiabetic Effect of Fermented Mesembryanthemum crystallinum L. in db/db Mice Involves Regulation of PI3K-Akt Pathway" Current Issues in Molecular Biology 45, no. 8: 6415-6431. https://doi.org/10.3390/cimb45080405