Article

Molecular Evaluation of the Impact of Polymorphic Variants in Apoptotic (Bcl-2/Bax) and Proinflammatory Cytokine (TNF-α/IL-8) Genes on the Susceptibility and Progression of Myeloproliferative Neoplasms: A Case-Control Biomarker Study

1
Department of Medical Laboratory Technology (FAMS), University of Tabuk, Tabuk 71491, Saudi Arabia
2
Division of Molecular Biology, Prince Fahd Chair for Biomedical Research, University of Tabuk, Tabuk 71491, Saudi Arabia
3
Community College, University of Tabuk, Tabuk 71491, Saudi Arabia
*
Author to whom correspondence should be addressed.
Internship Trainee.
Curr. Issues Mol. Biol. 2023, 45(5), 3933-3952; https://doi.org/10.3390/cimb45050251
Submission received: 23 March 2023 / Revised: 18 April 2023 / Accepted: 20 April 2023 / Published: 2 May 2023
(This article belongs to the Special Issue Molecular Mechanisms of Leukemia)

Abstract

:
The regulation of apoptosis (the programmed cell death) is dependent on the crucial involvement of BCL2 and BAX. The Bax-248G>A and Bcl-2-938 C>A polymorphic variations in the promoter sequences of the Bax and Bcl-2 gene have been recently associated with low Bax expression, progression to advanced stages, treatment resistance, and shortened overall survival rate in some hematological malignancies, including chronic myeloid leukemia (CML) and other myeloproliferative neoplasms. Chronic inflammation has been linked to various stages of carcinogenesis wherein pro-inflammatory cytokines play diverse roles in influencing cancer microenvironment leading to cell invasion and cancer progression. Cytokines such as TNF-α and IL-8 have been implicated in cancer growth in both solid and hematological malignancies with studies showing their elevated levels in patients. Genomic approaches have in recent years provided significant knowledge with the regard to the association of certain SNPs (single nucleotide polymerphisms) either in a gene or its promoter that can influence its expression, with the risk and susceptibility to human diseases including cancer. This study has investigated the consequences of promoter SNPs in apoptosis genes Bax-248G>A (rs4645878)/Bcl-2-938C>A (rs2279115) and pro-inflammatory cytokines TNF-α rs1800629 G>A/IL-8 rs4073 T>A on the risk and susceptibility towards hematological cancers. The study design has 235 individuals both male and female enrolled as subjects that had 113 cases of MPDs (myeloproliferative disorders) and 122 healthy individuals as controls. The genotyping studies were conducted through ARMS PCR (amplification-refractory mutation system PCR). The Bcl-2-938 C>A polymorphism showed up in 22% of patients in the study, while it was observed in only 10% of normal controls. This difference in genotype and allele frequency between the two groups was significant (p = 0.025). Similarly, the Bax-248G>A polymorphism was detected in 6.48% of the patients and 4.54% of the normal controls, with a significant difference in genotype and allele frequency between the groups (p = 0.048). The results suggest that the Bcl-2-938 C>A variant is linked to an elevated risk of MPDs in the codominant, dominant, and recessive inheritance models. Moreover, the study indicated allele A as risk allele which can significantly increase the risk of MPDs unlike the C allele. In case of Bax gene covariants, these were associated with an increased risk of MPDs in the codominant inheritance model and dominant inheritance model. It was found that the allele A significantly enhanced the risk of MPDs unlike the G allele. The frequencies of IL-8 rs4073 T>A in patients was found to be TT (16.39%), AT (36.88%) and AA (46.72%), compared to controls who were more likely to have frequencies of TT (39.34%), AT (37.70%) and AA (22.95%) as such, respectively. There was a notable overrepresentation of the AA genotype and GG homozygotes among patients compared to controls in TNF-α polymorphic variants, with 6.55% of patients having the AA genotype and 84% of patients being GG homozygotes, compared to 1.63% and 69%, respectively in controls. The data from the current study provide partial but important evidence that polymorphisms in apoptotic genes Bcl-2-938C>A and Bax-248G>A and pro-inflammatory cytokines IL-8 rs4073 T>A and TNF-α G>A may help predict the clinical outcomes of patients and determine the significance of such polymorphic variations in the risk of myeloproliferative diseases and their role as prognostic markers in disease management using a case-control study approach.

1. Introduction

The statistical figures show that blood cancers or hematological malignancies have a high incidence rate worldwide. In Western societies, leukemia is considered to represent a high incidence of blood cancer, affecting 4.2 per hundred thousand annually and globally, it represents 2.8% of all new cancer cases (300,000 cases/year) [1,2]. Evading apoptosis is the mainstay signature in blood cancers and also the modulation of proinflammatory cytokines that act as mediators of cancer microenvironment and cancer progression. The mechanism of apoptosis defines a committed process of cell death that is used as a termination stage of the cell fate during certain damaging situations such as infections, DNA damage, or any morphological or phenotypic characteristic that might be harmful if the cell survives and proliferates [3,4]. When the cell cycle is abnormally interrupted, apoptosis may be evaded causing failure of the preventive responses resulting in disorders including cancers, autoimmune diseases, degenerative diseases, and psychiatric illnesses [5,6]. BCL-2 and BAX include the Bcl-2 family of protein members, which play a crucial role in the mechanisms related to mitochondrial dysfunction and programmed cell death [7,8]. Apoptosis is a delegated and sensitive process which primes via two distinct pathways: death receptor signaling and mitochondrial (BCL2-dependant) pathways [9]. In the mitochondrial cascade, over 20 BCL2 family proteins, including BCL-2 which is an anti-apoptotic protein have been shown to be involved in cell signaling pathways related to apoptosis. The Bcl-2 gene has been demonstrated to be highly expressed in blood cancers, and the level of Bcl-2 expression has been found to be elevated in the accelerated/blastic phase of CML cells compared to the chronic stage which might drive the progression to the advanced stages [10]. The Bcl-2 gene contains two promoters: P1 and P2. Some studies have reported that in case of P2, a pathogenic SNP (−938 C>A) correlates with altered expressions of the BCL-2 protein. The BCL-2 protein is thus crucial to apoptosis, and as such certain genotypes due to polymorphic variations may affect cell-death intrinsic pathways in a multitude of disorders [11,12,13,14]. It is understood that certain SNPs have the ability to influence disease progression and may also result in resistance to effective treatment. Interestingly, some other studies suggested the positive association for better overall survival of patients owing to the presence of certain Bcl-2 SNPs [15,16,17]. The BAX protein is encoded with a promoter and six exons [18]. The potential of this promoter lies in its ability to interact with a range of transcription factors and regulator proteins, such as the NF-κB binding site, p53 response element, the TATA box and the canonical E-box [18]. Several studies have found that Bax-248G>A genotype is linked with the risk of human cancer [19]. The BCL2 family proteins utilize BAX as an anti-apoptotic regulator and employ the pro-apoptotic BCL-2 proteins to disrupt the balance between cell death and survival in various cell death pathways. These proteins act as primary intracellular effectors [20,21]. SNPs related to Bcl-2/Bax gene promoters have been investigated in several studies on cancer initiation, development and progression. It has been reported that some SNPs such as Bax-248G>A(rs4645878) and (or) Bcl-2-938C>A (rs2279115) show alterations in the gene expression in a pathogenic-manner, for example, those found in acute lymphoblastic leukemia [14] and certain solid tumors [22,23]. The overexpression of Bcl-2 and underexpression of Bax, resulting from the genetic variants of the encoded genes, have been linked to the development of these cancers [24,25].
Chronic inflammation has been linked to various stages of carcinogenesis wherein pro-inflammatory cytokines have been shown to be expressed in tissues undergoing transformation and advanced stages of cancer including metastasis [26,27]. Several studies have also provided a link between pro-inflammatory cytokines and apoptosis in the pathology of certain diseases [28,29,30]. Mechanistic studies have shown the modulation of apoptosis related proteins such as BCL-2 and BAX with varying expression of IL-8 suggesting the involvement of Hsp60-IL-8 axis in apoptosis resistance in cancer [31]. Taken together, these studies provide evidence for the intricate interplay between apoptotic genes and proinflammatory cytokines in cancer, underscoring the necessity for additional research in this field. Cytokines which are functional proteins that have been known to act as the modulator of immune response and inflammation, have assumed novel roles as modulator of carcinogenesis due to their elevated levels which are associated with development and progression of cancer disease [32,33]. As the name suggests, the TNF-α was originally identified as a factor produced from activated T-lymphocytes, macrophages, and natural killer cells which can cause necrosis of the tumor cells; however, it has now been found to have a pleiotropic action mechanism that can influence various signal transduction pathways related to cell survival and death in addition to immunological cascades [34]. In addition to its role in influencing a tumor microenvironment in the case of solid malignancies, TNF- α has been found to be associated with adverse clinical manifestations of leukemia including extramedullary infiltration and resistance to chemotherapy [35]. It has been suggested that polymorphic gene variations in the TNF-α promoter region that include 308G/A and 238G/A, might possess the risk of different cancers including colorectal cancer by regulating TNF-α cytokine synthesis [36]. Interleukin-8 is another pro-inflammatory cytokine, which is largely acting as a chemo-attractant in inflammation targeting neutrophils to the site of inflammation [37]. A study on patients with acute myeloid leukemia has provided evidence of high IL-8 expression, which could be correlated with poor prognosis in certain AML subsets based on differences between genetic subgroups, due to its ability to act as mediator to influence cancer microenvironment [38]. Previous research has shown a noteworthy association between the expression of interleukin-8 and its receptor in individuals with myeloid and lymphoid leukemia [39]. Thus, it is evident that cytokines have clinico-biological implications in the induction and progression of hematological malignancies and are potential molecules as disease markers and therapeutic targets [40].
Genomic approaches have in recent years provided significant knowledge with the regard to the association of certain SNPs in either a gene or its promoter that can influence its expression, with the risk and susceptibility to human diseases including cancer [41]. This study has investigated the influence of promoter SNPs in apoptosis genes that included Bax-248G>A (rs4645878)/ Bcl-2-938C>A (rs2279115) and pro-inflammatory cytokines including TNF-α rs1800629 G>A/ IL-8 rs4073 T>A on hematological cancers that include CML and other MPDs, and hence, determine the significance of such polymorphic variations in the risk of myeloproliferative disorders and their role as prognostic markers in disease management.

2. Experimental Methods

2.1. Study Population

The cohort study included 235 subjects among which 113 were histologically as well as clinically confirmed cases of myeloproliferative disorders and 122 healthy controls as shown in Figure 1 below. Before sampling, patient consent papers were obtained from each leukemia patient. The patients were assigned from various Tabuk-area hospitals such as King Khaled Hospital, King Fahd Specialist Hospital and Armed Forces Hospital—Tabuk.

2.2. Inclusion and Exclusion Criteria

The study included 113 clinically confirmed cases of myeloproliferative disorders. Further validation was performed by bone marrow hyperplasia and associated clinical characteristics that included splenomegaly and hepatomegaly besides other confirmatory clinical findings. The study excluded the individuals (patients) with a history of any previous malignant conditions.

2.3. Peripheral Blood Collection from Controls and Patients Cohorts

To collect samples, 3 mL of peripheral blood was taken from all patients and controls in EDTA vials, and informed consent was obtained from each of them. Once the Institutional Ethics Committee approved the study (Approval no. UT-88-19-2019 Dated 24 November 2019), the samples were collected, stored and processed. For the healthy control group, individuals who came in for a routine check-up were selected.

2.4. Selection Criteria of Healthy Controls

To establish a group of healthy controls, 122 individuals between the ages of 20 and 50 who were visiting the hospital for routine check-ups were included in the study. The control group was chosen from the general population of the same geographic area. Socio-demographic variables such as age, sex, and lifestyle were recorded using a questionnaire, and regular medical check-ups were conducted, including tests such as complete blood count, kidney function test, liver function test, etc. Additionally, the participants’ medical history was also noted. Individuals who did not show any symptoms of illness and had no previous medical history of serious illnesses or chronic conditions were considered to be in good health.

2.5. Genomic DNA Extraction

To extract DNA from the peripheral blood, the DNeasy Blood Kit (Cat No. 69506) from Qiagen, Germany was used with the described protocol. The extracted DNA was solubilized in nuclease-free water and placed at 4 °C for the time it had to be used for analysis. The quality of the DNA obtained from the patients and healthy controls was evaluated through 1% agarose gel electrophoresis, while the quantity of the extracted DNA was estimated using a NanoDrop™ (Thermo Scientific, Waltham, MA, USA) by measuring absorbance at 260 nm and 280 nm.

2.6. Genotyping of Bcl-2-938 C>A, Bax G>A, TNF-α G>A and IL-8 T>A

The genotyping of SNPs for Bcl-2 rs2279115C>T, Bax−248G>A rs4645878, TNF-α rs1800629 G>A and IL-8 rs4073 T>A was performed using amplification-refractory mutation system PCR (ARMS-PCR). The Bax G (−248) A rs4645878 SNP ARMS primers were designed by using Primer 3 software. For Bcl-2 rs2279115C>T, ARMS primers were previously used by Butt et al. [42], for TNF-α rs1800629 G>A as well as for IL-8 rs4073 T>A SNPs, ARMS primers were previously used by Matheson et. al. [43]. The primer sequences have been listed in Table 1:

2.7. PCR Cocktail and Optimization Procedure by a Gradient PCR

In the ARMS-PCR, a final reaction volume of 25 μL was utilized. This included 50 ng of template DNA, Forward (Outer)-0.30 μL, Reverse (Outer)-0.30 μL, Forward (Inner)-0.20 μL, Reverse (Inner)-0.20 μL of 25 pmol each primer, and 10 μL of GoTaq® Green Master Mix from Promega, Fitchburg, WI, USA (cat no M7122). The reaction mixture also received 2 μL of DNA from either the patient or control sample, and nuclease-free ddH2O was added to adjust the final volume of the PCR tube to 25 μL. Data analysis determined that an optimal temperature of 58 °C was required for the Bcl-2-938 C>A rs2279115 SNP, which was tested with a gradient PCR thermocycler within a temperature range of 55 °C to 62 °C. Increasing the cycle number from 30 to 40 cycles significantly enhanced the yields of all three PCR products. Similarly, the optimal temperature for the Bax G (−248) A SNP was determined to be 68 °C, selected from the temperature range of 55 °C to 65 °C. These modifications, combined with a less competitive reaction from the control, demonstrate strong amplification of the mutant allele, as indicated by the intensity of the corresponding bands observed during agarose gel electrophoresis.

2.8. Thermocycling Conditions and Gel Electrophoresis

The amplification process involved an initial denaturation step at 95 °C for the first 10 min, followed by 45 cycles of amplification, consisting of 35 s at 95 °C, 40 s at 58 °C, and 45 s at 72 °C. This was then followed by a final extension step at 72 °C for 10 min. The PCR products after amplification were resolved through gel electrophoresis on a 2% agarose gel and observed using a UV transilluminator, Bio-Rad, Hercules, CA, USA with syber safe stain.

2.9. Statistical Analysis

To distinguish between the different groups, student’s two-sample t-test or one-way analysis of variance were employed for continuous variables, while the χ2 test was utilized for categorical variables such as deviations from Hardy–Weinberg disequilibrium. Furthermore, to evaluate the allelic and genotypic frequencies between the Bcl-2 and Bax gene groups, a Chi-square test was used. The potential relationships between the Bcl-2-938 C>A rs2279115 SNP and Bax G (−248) A SNP, TNF-α rs1800629 G>A and IL-8 rs4073 T>A genotypes and myeloproliferative leukaemia cases were assessed by estimating odds ratios, risk ratios and risk differences with 95% confidence intervals. A p-value of less than 0.05 was considered to be of significance. The analyses were performed using SPSS (Chicago, IL, USA) and Graph Pad Prism 8.4 software (San Diego, CA, USA).

3. Results

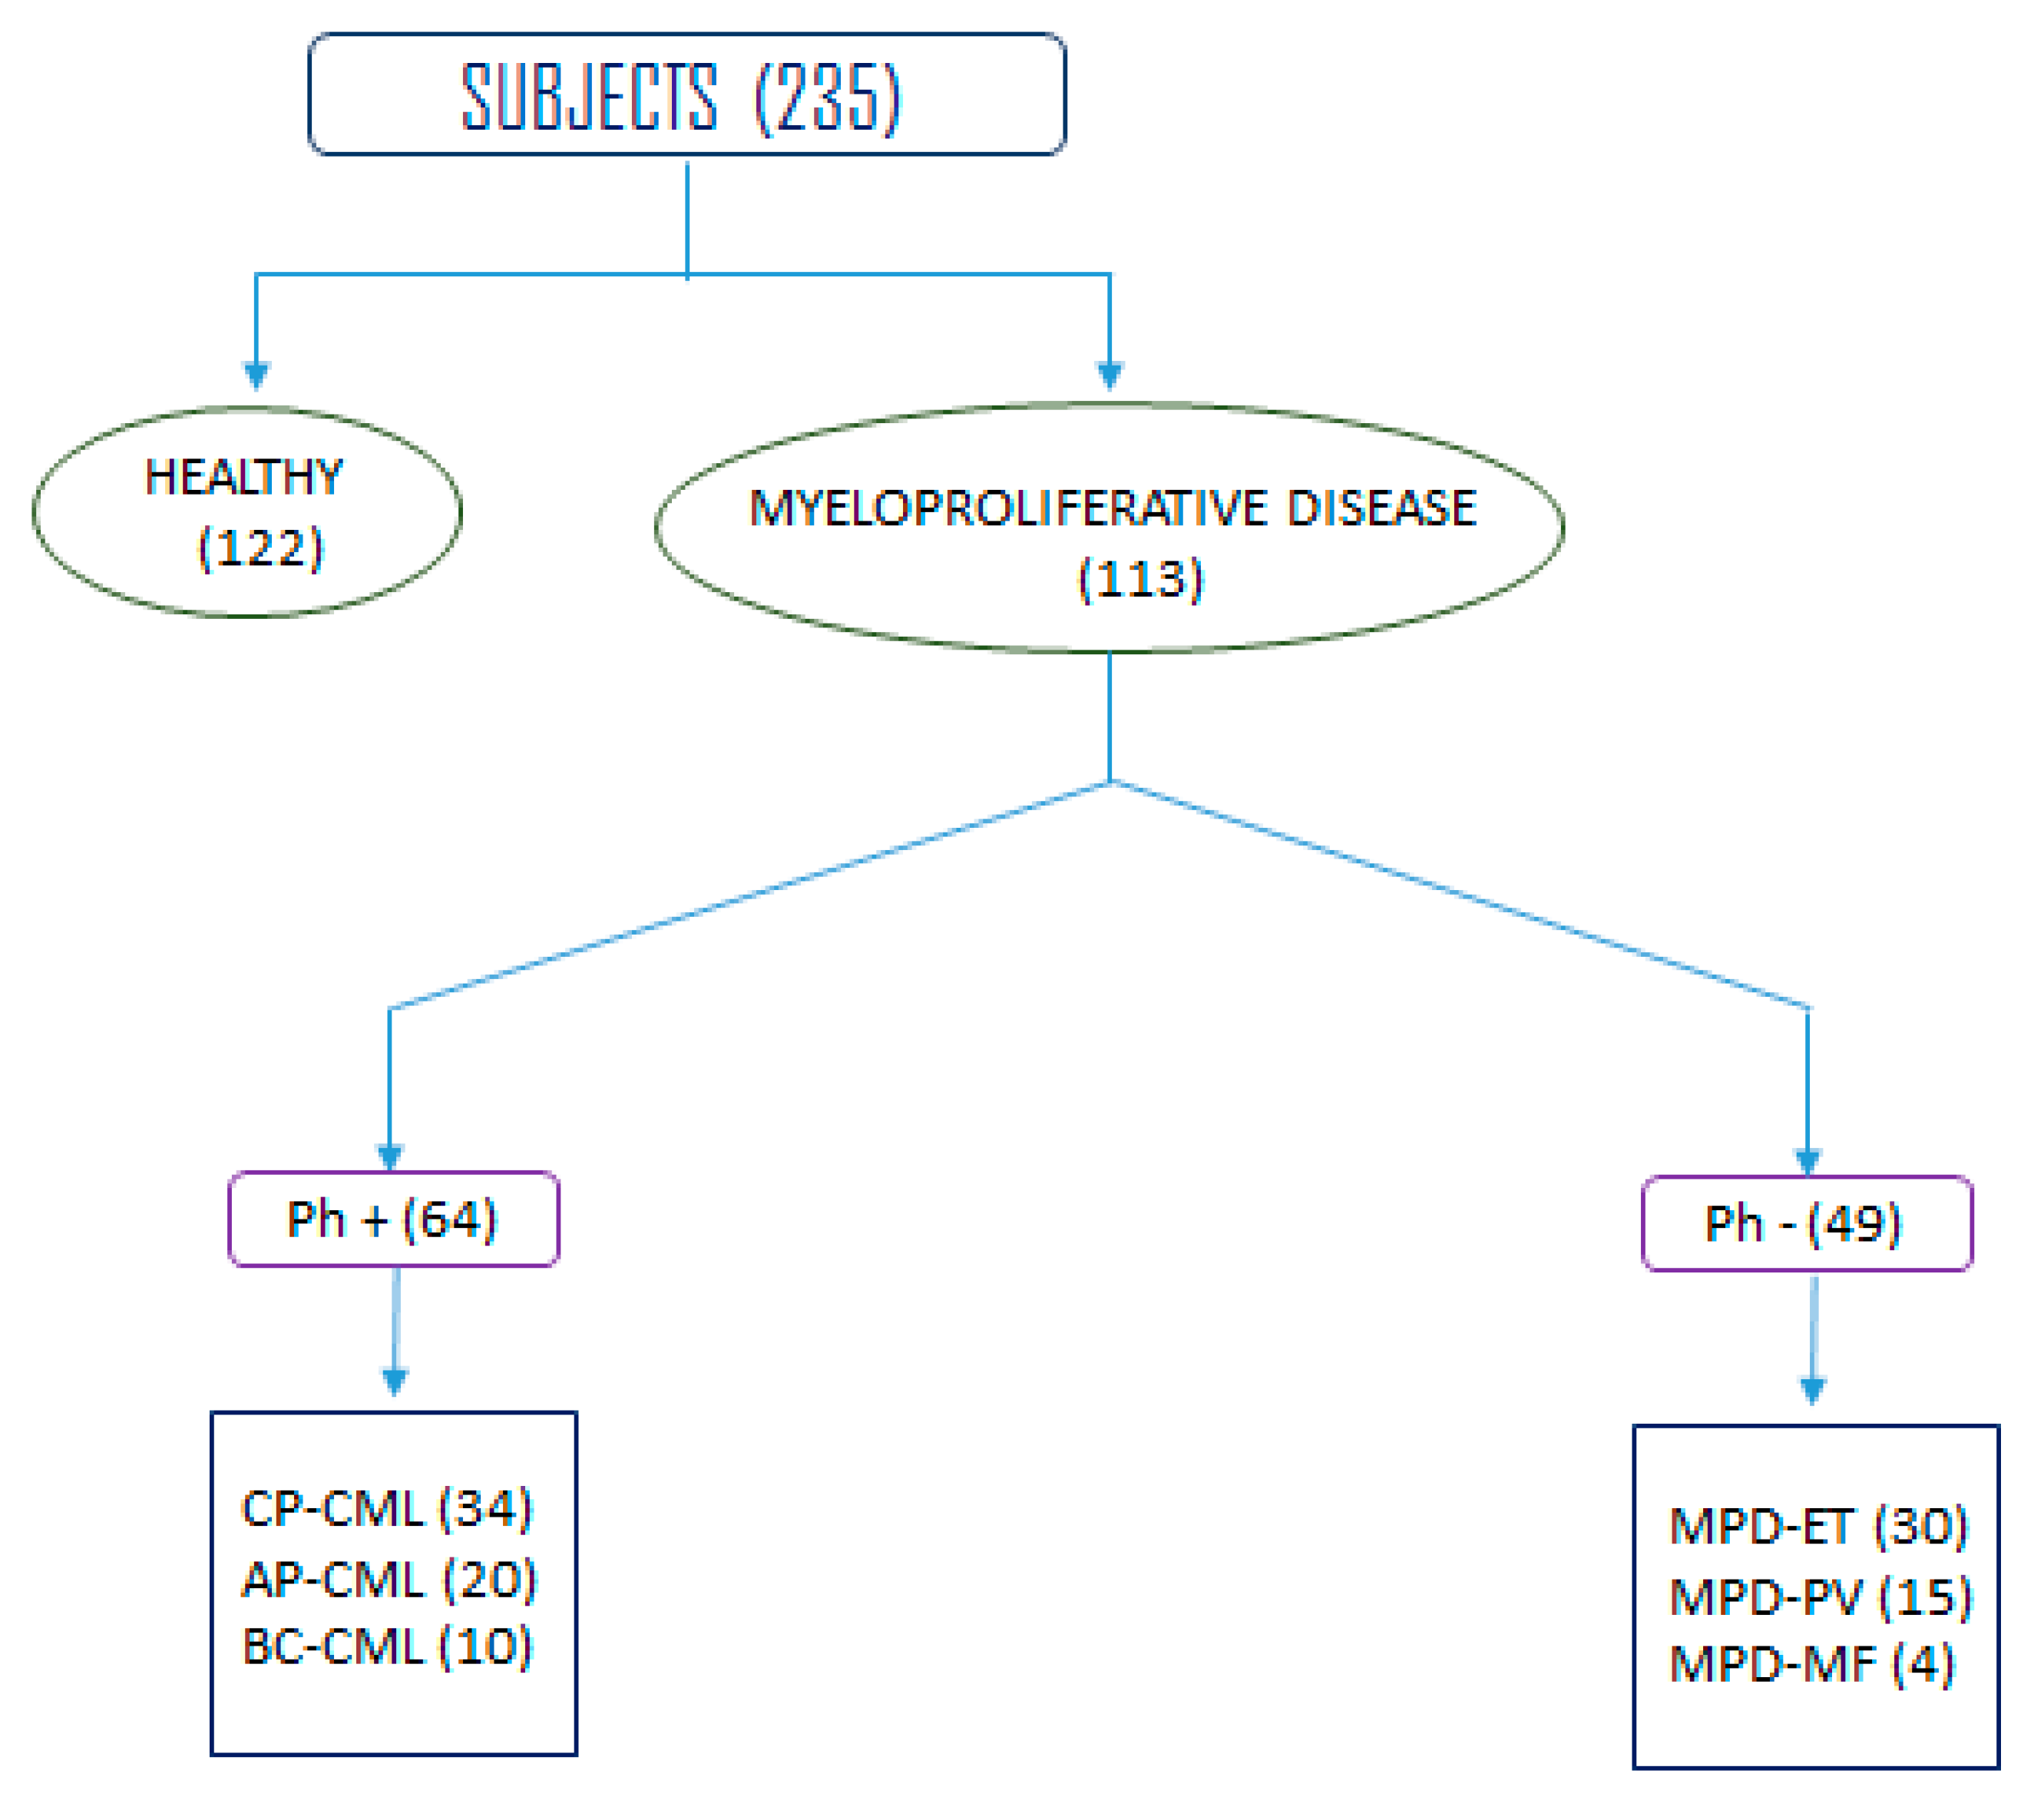
3.1. Demographic Characteristics of Study Population

The data regarding the demographics of the patients and controls are presented in Table 2. Of the study subjects, 82 (72.56%) were male patients, while 31 (27.44%) were female patients. Conversely, among the controls, 74 (60.65%) were males and 48 (39.34%) were females. The majority of the patient group (76, or 67.21%) were over the age of 40, while 37 (32.78%) were under 40. Among the 64 CML cases, 34 (53.12%) were in the early stage (chronic phases), 20 (31.25%) were in the accelerated phase, and 10 (15.62%) were in blast crisis. Additionally, of the patients with other myeloproliferative diseases, 30 had ET, 15 had PV, and 4 had myelofibrosis.

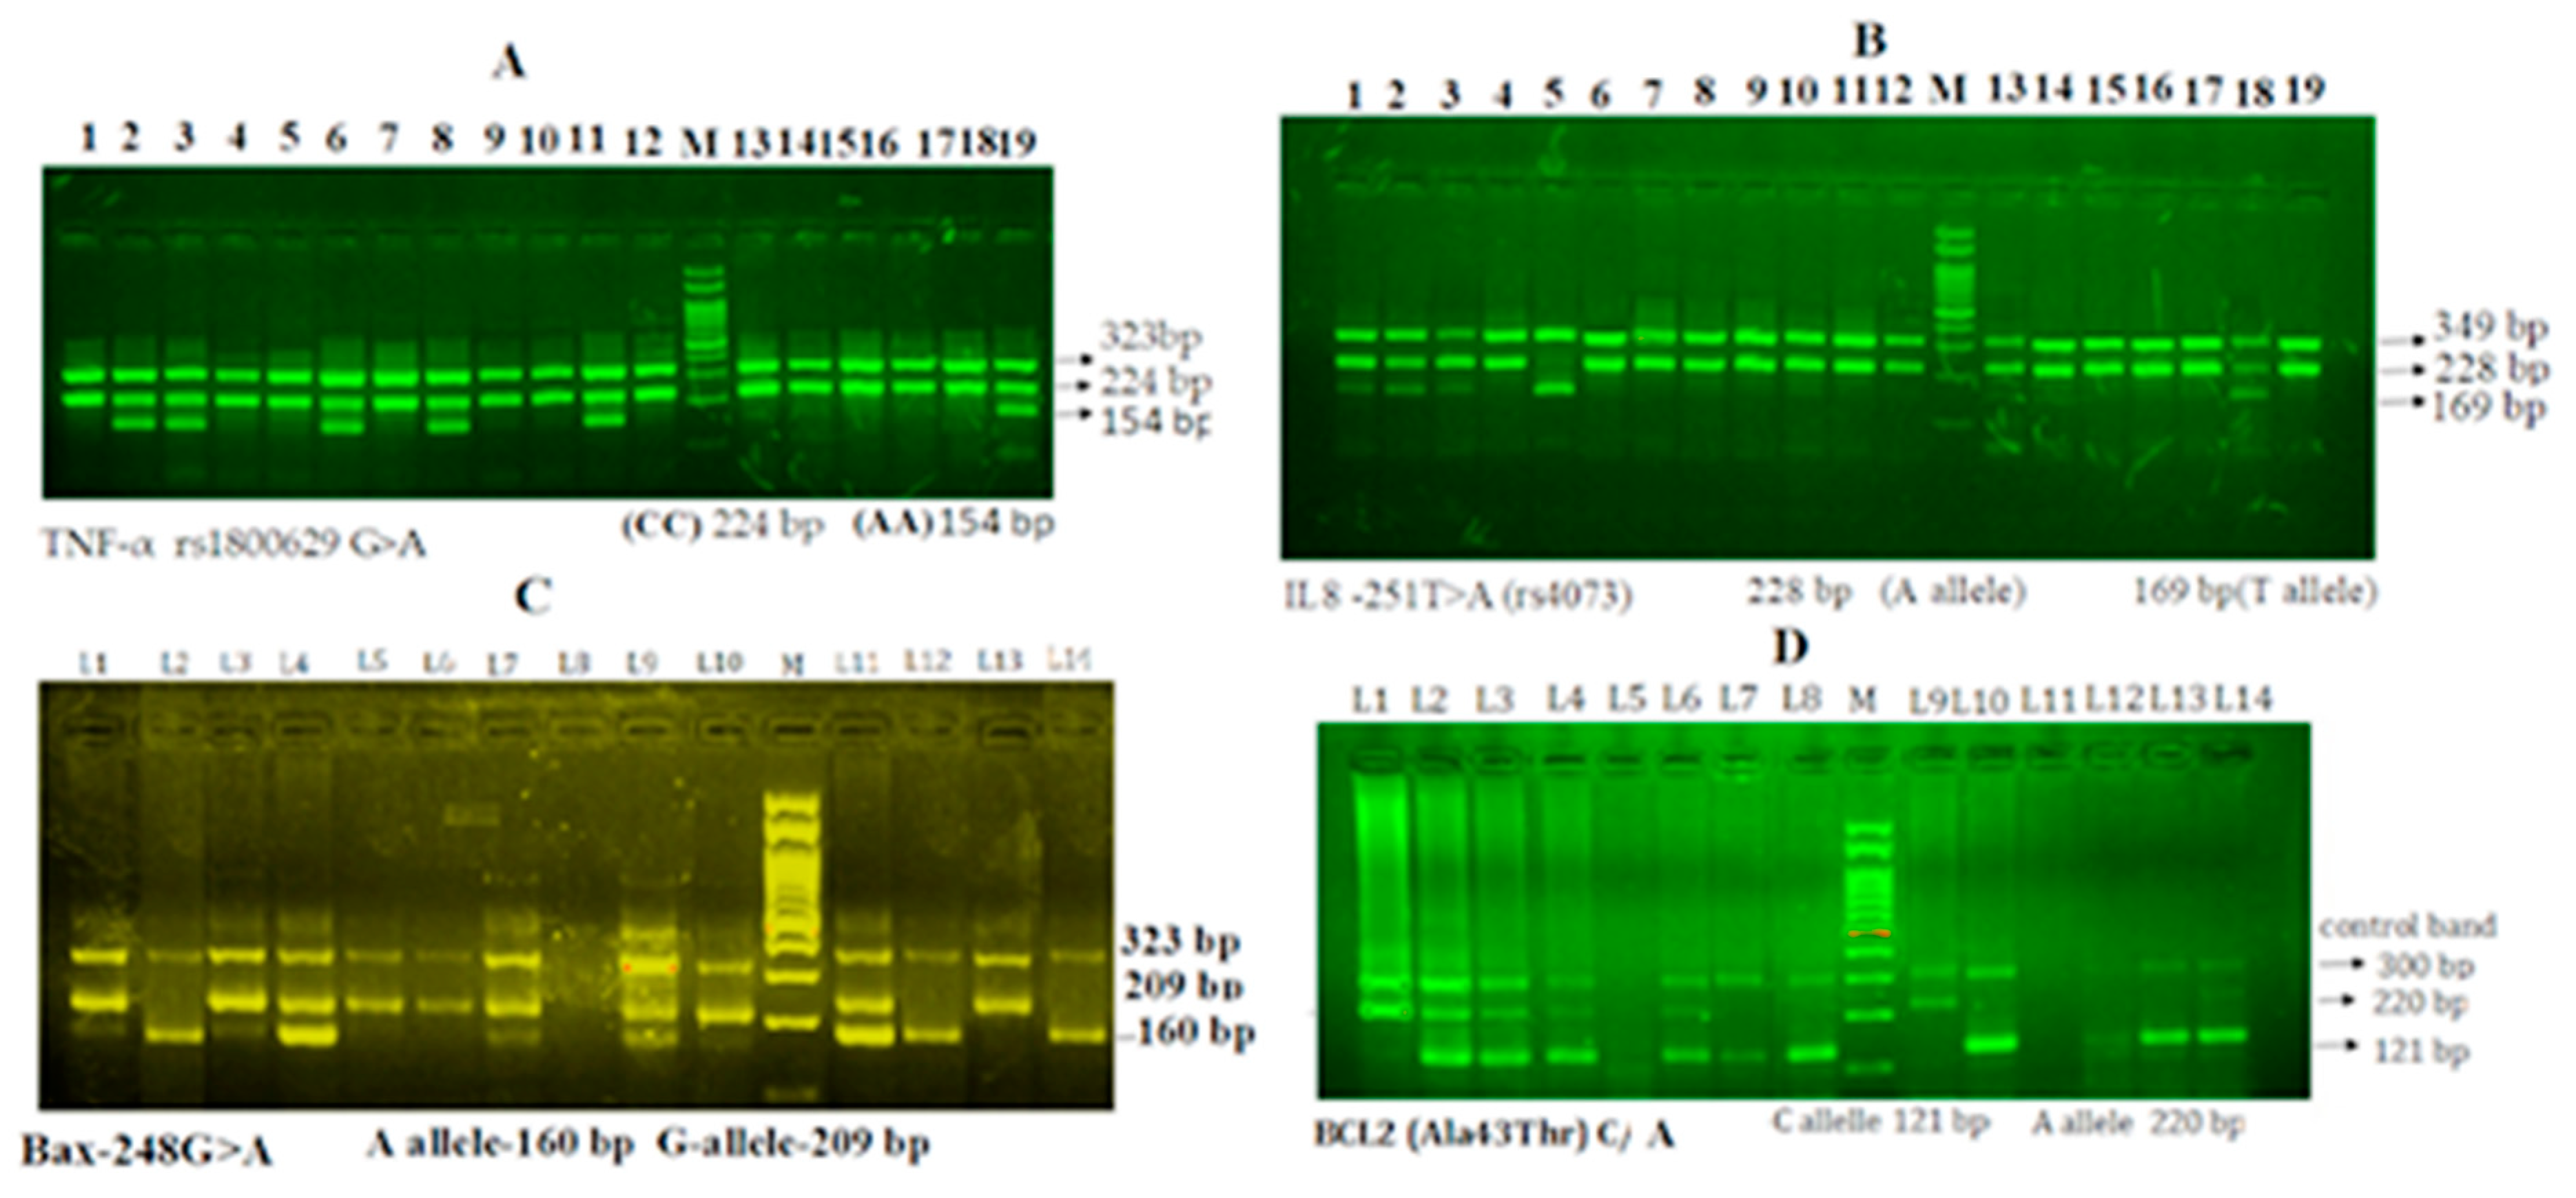
3.2. Genotyping and Gel Electrophoresis for the Identification of Alleles

Genotyping for the four tested genes was performed by using the amplification-refractory mutation system PCR (ARMS-PCR). Finally, the PCR products generated as a result of PCR amplification were resolved by agarose gel electrophoresis (2.5%) and the corresponding bands were identified for wild type or mutant allele as shown in Figure 2.

3.3. Gel Electrophoresis of TNF-α rs1800629 G>A Gene Amplification

The primers Fo and Ro were designed to flank the exon/intron of the TNF-α gene, which resulted in the generation of a 323 bp band. This band served as a control for assessing the integrity of the DNA. Additionally, when primers Fo and RI were used, a 224 bp band corresponding to the G allele was generated. Alternatively, primers FI and RO produced a 154 bp band from the A allele, as demonstrated in Figure 2A.

3.4. Gel Electrophoresis of Interleukin-8 rs4073 T>A Gene Amplification

The external primers Fo and Ro were utilized for the amplification of the external region of the IL-8 gene, generating a 349 bp band that served as a control for evaluating the quality of the DNA. Additionally, primers FO and RI produced a 228 bp band corresponding to the A allele, while primers FI and RO resulted in a 169 bp band corresponding to the T allele, as shown in Figure 2B.

3.5. Gel Electrophoresis of Bax G (−248) A Gene Amplification

To assess both the quality and quantity of the DNA, primers Fo and Ro of the Bax2 gene generated a 323 bp band. Additionally, primers FI and Ro were used to amplify the wild-type allele (G allele), which produced a 209 bp band. Alternatively, primers Fo and RI were used to produce a 160 bp band from the mutant A allele, as shown in Figure 2C.

3.6. Gel Electrophoresis of Bcl-2-938 C>A Gene Amplification

To ensure the quality and quantity of the DNA, primers Fo and Ro of the Bcl-2 gene generated a 300 bp band. Moreover, primers FI and Ro were utilized to amplify the wild-type allele (C allele), resulting in a 121 bp band. On the other hand, primers Fo and RI generated a 220 bp band from the mutant A allele, as demonstrated in Figure 2D.

3.7. Comparative Analysis of the Bcl-2-938 C>A rs2279115, Bax-248G>A, TNF-α rs1800629 G>A and Interleukin-8 rs4073 T>A (IL-8-251T>A) Genotypes in Myeloproliferative Leukemia Patients and Healthy Controls

Our results (Table 3) indicate significant differences in the occurrence of Bcl-2-938 C>A rs2279115 CC, CA, and AA genotypes between leukaemia patients and healthy controls (p = 0.025). Specifically, the frequency of the AA homozygote was higher in patients (22%) than in controls (10%), while the CC homozygote was more frequent in controls (34%) than in patients (49%). We also found that the A allele was more prevalent among patients (44%) than controls (31%), indicating it as a risk allele, while the C allele acted as a protective factor. Additionally, there were notable differences in the frequencies of Bax-248 G>A GG, GA, and AA genotypes between the two groups (p = 0.048), with the AA genotype being more common in patients (6.48%) and the GG homozygote being more prevalent in controls (41.66%). Furthermore, we observed significant differences in the frequencies of IL-8 rs4073 T>A between leukaemia patients and healthy controls (p < 0.0001), with patients having higher frequencies of A allele (0.75 vs. 0.61) and AA genotype, while healthy individuals had higher frequencies of the TT genotype and T allele, indicating their protective effect against the disease. Finally, we found a statistically significant difference in the frequencies of TNF-α rs1800629 GG, GA, and AA genotypes between leukaemia patients and healthy controls (p = 0.048), with the AA and GG homozygote being more common among patients (7.96% and 83.18%, respectively). However, the G allele appeared to be a risk allele with higher frequency (fG) reported among patients (0.87) compared to control (0.84), while the A allele seemed to be protective with higher frequency (fA) reported among control (0.16) compared to the patients (0.13).

3.8. Logistic Regression Analysis of Bcl-2-938 C>A in Leukemia Patients

Table 4 presents the results from an unconditional logistic regression that aimed to investigate the link between genotypes and the risk of myeloproliferative leukemia. According to the analysis, there was a correlation between the Bcl-2-AA genotype and a higher likelihood of leukemia. The extent of this risk depended on the number of alleles present. In terms of the codominant model, individuals with the AA genotype of the Bcl-2 gene had a greater vulnerability to leukemia with an odds ratio (OR) of 3.17 (95% confidence interval (CI): 1.33–7.53), a relative risk (RR) of 1.88 (95% CI: 1.09–3.25), with a significant p-value (<0.009). The dominant model (CA+AA) showed a significant association between this genotype and susceptibility to leukemia with an OR of 1.86 (95% CI: 1.05–3.29), RR of 1.35 (95% CI: 1.030–1.77), and p-value of <0.03. Furthermore, the recessive model (CC+CA) compared to the AA genotype suggested an increased susceptibility to leukemia with an OR of 2.53 (95% CI: 1.13–5.68), RR of 1.71 (95% CI: 1.006–2.92), and p-value of <0.02. Finally, the A allele was linked to an increased risk of leukemia with an OR of 1.79 (95% CI: 1.18–2.69), RR of 135 (95% CI: 1.08–1.68), and p-value of <0.007.

3.9. Logistic Regression Analysis of Bax-248 G>A in Leukemia Patients

To estimate the relationship between genotypes and myeloproliferative leukemia risk, an unconditional logistic regression was employed and presented in Table 5. The results showed that the genotype GG for Bax-248 G>A SNP has a significant association to an enhanced risk of leukemia. In the codominant model, the risk was observed with an odds ratio (OR) of 2.0 (1.12–3.57), a relative risk (RR) of 1.43 (1.045–1.95) and p-value of less than 0.017. Similarly, the dominant model (GA+AA vs. GG) was also related to a higher degree of risk to leukemia disease, with an OR of 1.98 (1.14–3.45), RR of 1.43 (1.05–1.91) and p-value of less than 0.014. However, no significant association was detected in the recessive model (GG+GA vs. AA). Our findings indicate that the allele A for Bax-248 G>A SNP has an association with a greater risk of leukemia, with an OR of 1.63 (1.03–2.58), RR of 1.29 (1.00–1.67), and a p value of less than 0.035.

3.10. Logistic Regression Analysis of IL-8 rs4073 T>A Genotypes to Predict the Risk of Leukemia

Our research found a strong correlation between the IL-8 rs4073 TT genotype and leukemia vulnerability in the codominant model, with an OR of 2.25 (95%) CI = (1.1433 to 4.434), RR = 1.35 (95%) CI = (1.0562 to 1.738) and p < 0.018 (Table 6). In the codominant inheritance model, there was a robust association between the IL-8rs4073 TA genotypes and the risk of leukemia, with an OR = 4.7 (95%) CI (2.379 to 9.64), RR = 2.07 (95%) CI (1.48 to 2.898) and p < 0.0001. The dominant inheritance model also showed a strong correlation between the IL-8 rs4073 TT and (TA+AA) genotypes and leukemia susceptibility, with an OR = 3.20 (95%) CI (1.73 to 5.92), RR= 1.62 (95%) CI 1.29 to 2.04) and p < 0.0002. Additionally, an intriguing finding was the correlation between the IL-8 rs4073 AA and (TT+TA) genotypes and leukemia vulnerability with an OR = 2.96 (95%) CI (1.6953 to 5.112), RR = 1.76 (95%) CI (1.276 to 2.447) and p < 0.0001 in the recessive inheritance model. In the allelic comparison, the IL-8 rs4073 -A allele was associated with leukemia susceptibility with an OR of 2.59, (95% CI) (1.7857 to 3.767), RR 1.56, and p < 0.001 (Table 6).

3.11. Logistic Regression Analysis of TNF-α rs1800629 G>A Genotypes to Predict the Risk of Leukemia

Our examination demonstrated a significant linkage between the TNF-α-AA genetic makeup and the susceptibility to myeloproliferative leukemia under the codominant model. The odds ratio was 4.78 (95% CI: 1.008–22.73), the relative risk was 2.83 (95% CI: 0.803–10.005), and the p-value was less than 0.048 (as shown in Table 7). We also observed a strong correlation between the TNF-α rs1800629 AA and TNF-α-(GA+GG) genotypes with leukemia susceptibility in the recessive inheritance model. The odds ratio was 5.14 (95% CI: 1.08–24.33), the relative risk was 2.93 (95% CI: 0.8036–10.334), and the p-value was less than 0.038. In comparison, the TNF-α-A allele was not significantly related to leukemia susceptibility in allelic comparison, with an odds ratio of 1.33 (95% CI: 0.756–2.37), a relative risk of 1.15, and a p-value of less than 0.32.

3.12. Genotypes Association with Clinico-Pathological Features of the Leukemia Patients

Table 8 demonstrates that the study identified a significant variance in the Bcl-2-938 C>A genotypes for different stages of CML, notably between chronic and accelerated phases. Nonetheless, there were no substantial differences found in the frequency of genotypes in relation to age and gender. Likewise, the correlation between Bcl-2-938 C>A genotypes and various types of MPD proved to be insignificant. Patients in CP revealed a higher degree of heterozygosity of CA genotype (60%) than the AP (25%) and BC phase (46%). The AP phase had a greater frequency of AA genotype compared to the CP (25%) and BC phase (15%). In the BC phase, the frequency of CC genotype was shown to be 38.46% in contrast to the CP-phase (20%) and AP-Phase (50%). Notably, there was a statistically significant variance in the frequencies of Bcl-2-938 C>A genotypes between CP-Phase and AP-Phase (p < 0.04). The analysis also indicates a significant difference in the frequencies of Bax-248 G>A genotypes for the age of the leukemia patients, with a higher frequency of the AA genotype among older patients. However, there was no significant correlation with gender, CML stages or different types of MPD. A greater frequency of the AA genotype was also observed in the blastic phase. The TNF-α rs1800629 G>A genotypes showed a significant difference between the CP-CML vs. BC-CML but a non-significant difference between CP-CML and AP-CML. Significant differences were observed in the frequencies of TNF-α rs1800629 G>A genotypes to age and gender. No significant correlation was reported between TNF-α rs1800629 genotypes and MPD groups. The study also found a significant difference in the frequencies of IL-8 rs4073 T>A genotypes to age and gender, but no significant correlation with CML stages or other MPDs. The comparative analysis of different genotypes did not reveal any significant differences between Ph+ and Ph− patients (Table 9). It is important to note that while Ph−chromosome positivity is important in leukemias, there are different Ph transcripts with distinct clinical and genetic associations. This can make the Ph+ and Ph− groups of patients even more heterogeneous in terms of interpreting results.

4. Discussion

According to the WHO classification of the hematopoietic neoplasm, the major myeloid subclasses include chronic myeloproliferative disorders (MPDs) which represent a heterogeneous group of neoplastic diseases that could be subdivided based on the presence of the Philadelphia chromosome (Ph+) such as CML and others which are Philadelphia chromosome negative (Ph−) myeloproliferative disorders which include essential thrombocytopenia, polycythemia verra and myelofibrosis [44]. It is observed that different phases of CML have varying degree of prognosis as patients progressing from the chronic phase (which responds well to TKI therapy) to the accelerated phase and blast crisis have shown poor clinical outcomes [45]. Studies have proposed that the genetic drivers in the myeloid cell lineage are significant in influencing the progression of CML to advanced clinical stages [46,47]. These myeloproliferative neoplasms represent a heterogeneous group which can present in various disease phenotypes and have the potential to transform into one another [48]. The non-CML MPDs are considered to be genetically heterogeneous though these are believed to be related as the aberrant clone arising from a progenitor which is a multipotent hematopoietic stem cell [49]. It is in the subsequent clonal expansions that accumulation of genetic alterations results in committing the cells towards a specific MPD. The most frequent type of genetic variation found in the human genome is Single Nucleotide Polymorphisms (SNPs). This refers to alterations in a single base pair of a nucleotide that varies from one individual to another. Significant functional effects can arise from SNPs found in the promoter regions of genes, as these regions regulate gene expression. These specific SNPs can act as markers for diagnosing and predicting the prognosis of cancer, as they influence gene function and expression, ultimately impacting disease susceptibility and responsiveness to treatment. Gene regulations causing the quantitative and qualitative variations in the product can be greatly influenced by variations in the allele in the promoter region of target genes which might alter the transcription factor-binding site. A multitude of SNPs have been implicated in carcinogenesis and these have been shown to effectively influence cellular mechanisms such as apoptosis which is inherently utilized to get rid of cells with the potential to develop into cancer [50,51].
Apoptosis refers to a process whereby cells undergo programmed cell death, aiming to get rid of unwanted or unhealthy cells in the body. However, the effect inflammation has on apoptosis can either be positive or negative depending on the circumstances. In some scenarios, inflammation can aid apoptosis by eliminating damaged cells caused by infections or acute injuries. On the other hand, chronic inflammation can hinder apoptosis, resulting in the accumulation of weird or abnormal cells in the body, increasing the risk of cancer and other ailments. Inflammation thwarts apoptosis by stimulating signaling pathways that encourage cell growth and survival, thus preventing cell death. This may lead to the persistence of unusual cells that should have undergone apoptosis, promoting the growth of cancer cells. All in all, it is apparent that the correlation between inflammation and apoptosis is intricate and also contingent on the conditions. BCL-2 protein has numerous roles in cellular pathways that are related to cell death or cell survival as well as act as important factors in resistance to cancer therapeutics. There are instances where polymorphisms in the Bcl-2 gene have been shown to alter its anti-apoptotic role thereby promoting cell death and aiding in targeted therapies [25,52]. Our study examined the P2 promoter polymorphisms of the Bcl-2 gene. This functions as a negative regulator element in the process. There was no significant difference in the genotype and allelic frequencies of the Bcl-2-938 C>A (rs2279115) polymorphism between healthy controls and PV or ET. In case of CML, Bcl-2 gene polymorphic variation with control was significant. Since the expression of the gene is elevated in CML, it has been earlier proposed as a marker in post-chemotherapy prognosis of myeloid leukemia. It has been observed that the Bcl-2-938 C>A gene variation is statistically related to overall survival and remission rates in leukemia [15]. Moreover, a study also reported a significant correlation between the Bcl-2-938 gene polymorphism and the susceptibility to CML disease [53]. The pro-apoptotic roles of the Bax gene to other collaborative genes, such as Bcl-2 and p53, have renewed the interest in Bax gene modifications and the related outcome in cancer. Bax has been widely researched on numerous types of cancers, including pancreatic cancer [54], colon cancer [55,56], esophageal cancer [57,58], pulmonary cancer [59,60], squamous head and neck cancer [61], prostate cancer [62], ovarian cancer [63], and breast cancer [64]. The Bax gene has been involved in the suppression of tumors due to its role in promoting the programmed cell death. The experimental deletions of the Bax gene have been shown to be associated with the incidence of lymphoid hyperplasia and thus it is regarded as an important suppressor against hematopoietic neoplasms [65,66,67,68]. There was no significant difference in the genotype and allelic frequencies of Bax-248 G>A (rs4645878) polymorphisms between healthy controls and PV or ET patients. This finding is consistent with studies on solid cancers, as reported by Alam et al. in 2019 [69]. Although Bax rs4645878 does not seem to play a role in carcinogenesis, it has been suggested that it may be associated with a poor prognosis in some cancers [70].
Higher serum levels of IL-8 have been seen in advanced stages and progression of various cancer types that include colorectal, breast cancer, prostate, pancreatic, melanoma, ovarian and renal cancer [71]. Studies in the literature demonstrate that most of the work has been conducted on the effect of proinflammatory cytokine IL-10 genomic variations on various cancers including hematological malignancies [72,73]. However, the effect of IL-8 polymorphic variations on the risk and susceptibility to various cancers, particularly leukemia, has been largely unexplored which gives credence to our attempt to characterize the IL-8 rs4073 T>A polymorphism in leukemia patients in comparison to healthy subjects. Interleukin-8 has been found to be overexpressed in breast cancer including HER2-positive cancers compared with normal breast tissue and has been shown to enhance breast cancer progression by promoting angiogenesis, cell invasion and distant colonization [74]. A meta-analysis of 33 studies, with 6192 cases in a systematic review, has recently reported the significance of IL-8 genetic polymorphism IL-8-251T>A (rs4073) as a risk factor in gastric cancer which was stratified based on ethnicity with such an association observed in Korean, Chinese and Brazilian patients though not among Japanese patients [75].
A recent study, which addressed IL-8 as a pro-tumorigenic cytokine that promotes cancer proliferation and migration, found IL-8 rs4073 AT and AA genotypes to have significantly lower prevalence in TNBC patients, while individuals with allele A showed a relatively decreased risk for breast cancer [71]. Our finding is contrary to this study where we have found that leukemia patients had a higher frequency of the A allele than healthy controls which makes it a risk allele for the disease. However, such a contradiction between solid and hematological malignancies needs further studies on the action mechanism of IL-8 in these cancer types as it is known to play a critical role in epithelial-mesenchymal transition for migration and metastasis of cancer cells in solid cancers [76], apart from the observed variations due to the ethnicity of the subjects under study. In patients (Mexican children) with neuroblastoma, the homozygous AA genotype of rs4073 IL-8 appeared more frequently along with a high serum levels IL-8, which were associated with lower overall survival and the finding was further confirmed on the basis of an adverse prognosis in a multivariate model [77]. The pro-inflammatory cytokine TNF-α has originally been linked to necrosis in chemically induced sarcomas in mice and later with an ability to cause apoptosis of tumor cells through TNFR1 [78,79]. Over time, evidence also emerged to support some studies that showed TNF-α promoting cancer growth and progression [80]. The contrary roles could possibly be explained as a concentration-dependent phenomenon where a very high concentration of the cytokine acts as anti-tumor agent, whereas as in lower concentrations it helps the cancer cells to sustain, grow and proliferate. The cytokine has also been observed to be involved in inducing dedifferentiation processes leading to tumor relapse such as in case of a melanoma patient treated with ACT [81]. Moreover, the role of TNF-α has been well established in the metastatic pathway of EMT in various solid cancers including lung and breast cancer [82,83]. In the case of hematological malignancies, TNF-α has been found to support the cellular microenvironment promoting progression of acute leukemia and its relapse. A recent study by Verma et al. [84] has demonstrated higher levels of the cytokine in T-ALL cases, which was followed by AML and B-ALL when compared to the control. However, the study observed a significant reduction in the serum TNF-α level in patients with acute leukemia with the start of chemotherapy [84]. A previous study on polymorphic variation of TNF–α rs1800629 (–308 G>A) in leukemia demonstrated that the frequency of the rs1800629 GA genotype was high in the patient group as compared to healthy controls and it was associated with high risk of adult B-ALL [85]. Similarly, another study found statistically significant associations of TNF-α rs1800629 SNP in AML subtypes with a higher frequency of variant genotypes in AML de novo cases [86]. The TNF-α AA homozygous variant genotype also demonstrated significant risks of the development of pediatric ALL in a study though this association was not observed in adult ALL [87]. Our study provides an insight into the plausible roles of polymorphic gene variations of some important candidate genes in the risk and susceptibility to human myeloproliferative malignancies. Moreover, such a genetic heterogeneity within a given population has been emerging as a novel genomic marker and a tool for personalized medicine for therapeutics as well as for prognosis of the disease.

5. Concluding Remarks

The data from the current study provide partial but important evidence that polymorphisms in apoptotic genes Bcl-2-938C>A and Bax-248G>A and pro-inflammatory cytokines IL-8 rs4073 T>A and TNF-α rs1800629 G>A may help predict the clinical outcomes of patients with leukemia. However, within the study the two major classes of MPD that included CML (Ph+) and Non-CML MPDs (Ph−) did not show any significant relationship when accounted for the distribution of the genotypes. The scope of MPDs is larger with regard to progression to the advanced stage as most of these have the potential to transform into acute myelogenous leukemia (AML). In fact, the diagnosis of CML-BC if not presented as a monitored prognosis in CML patients, possesses a substantial challenge in order to be differentiated from AML and might even mimic leukemia with lymphoid origin [88]. It is important to mention that certain genetic abnormalities drive the clonal evolution and blastic transformation of CML and the resulting resistance to TKIs therapy [89,90]. Our report has presented some interesting preliminary findings, which could be further validated in larger cohorts and diverse ethnic populations.

Author Contributions

Conceptualization, M.S.M., R.M. and M.F.U.; Methodology, R.M. and O.A.; Analysis, R.M.; M.F.U. and F.J.T.; Investigation, M.S.M.; O.A. and R.M., Supervision; R.M. and M.F.U., Project administration, F.J.T. and R.M., Writing, review and editing, R.M.; M.F.U., M.S.M. and F.J.T. All authors have read and agreed to the published version of the manuscript.

Funding

This work was supported by grants from the Deanship of Scientific Research (S-1440-0333), University of Tabuk. Saudi Arabia. We are highly thankful to the University of Tabuk and DSR for supporting our research study.

Institutional Review Board Statement

The study was conducted in accordance with the Declaration of Helsinki, and approved by the Ethics Committee of University of Tabuk (UT-88-19-2019 Dated 24 November 2019).

Informed Consent Statement

Informed consent was obtained from all subjects involved in the study.

Data Availability Statement

The data presented in this study are available within this open access article. Any further queries can be sent to the corresponding author.

Conflicts of Interest

The authors declare no conflict of interest.

Correction Statement

This article has been republished with a minor correction to the Funding statement. This change does not affect the scientific content of the article.

References

  1. Bray, F.; Ferlay, J.; Soerjomataram, I.; Siegel, R.L.; Torre, L.A.; Jemal, A. Global cancer statistics 2018: GLOBOCAN estimates of incidence and mortality worldwide for 36 cancers in 185 countries. CA Cancer J. Clin. 2018, 68, 394–424. [Google Scholar] [CrossRef] [Green Version]
  2. IARC. Global Cancer Observatory: Cancer Today. 2020. Available online: http://gco.iarc.fr/today/home (accessed on 21 November 2021).
  3. Autret, A.; Martin, S.J. Emerging Role for Members of the Bcl-2 Family in Mitochondrial Morphogenesis. Mol. Cell 2009, 36, 355–363. [Google Scholar] [CrossRef] [PubMed]
  4. Basu, A. The interplay between apoptosis and cellular senescence: Bcl-2 family proteins as targets for cancer therapy. Pharmacol. Ther. 2021, 230, 107943. [Google Scholar] [CrossRef] [PubMed]
  5. Cory, S.; Adams, J.M. The Bcl2 family: Regulators of the cellular life-or-death switch. Nat. Rev. Cancer 2002, 2, 647–656. [Google Scholar] [CrossRef] [PubMed]
  6. Kaur, D.; Deshmukh, R. Chapter 2—Physiology of cellular demise: Apoptosis, necrosis, and autophagy. In Clinical Perspectives and Targeted Therapies in Apoptosis; Sodhi, R.K., Madan, J., Eds.; Academic Press: Cambridge, MA, USA, 2021; pp. 23–78. [Google Scholar]
  7. Llambi, F.; Moldoveanu, T.; Tait, S.W.; Bouchier-Hayes, L.; Temirov, J.; McCormick, L.L.; Dillon, C.P.; Green, D.R. A Unified Model of Mammalian BCL-2 Protein Family Interactions at the Mitochondria. Mol. Cell 2011, 44, 517–531. [Google Scholar] [CrossRef] [PubMed] [Green Version]
  8. Strasser, A.; Cory, S.; Adams, J.M. Deciphering the rules of programmed cell death to improve therapy of cancer and other diseases. EMBO J. 2011, 30, 3667–3683. [Google Scholar] [CrossRef] [PubMed]
  9. Hengartner, M.O. The biochemistry of apoptosis. Nature 2000, 407, 770–776. [Google Scholar] [CrossRef]
  10. Handa, H.; Hegde, U.P.; Kotelnikov, V.M.; Mundle, S.D.; Dong, L.M.; Burke, P.; Rose, S.; Gaskin, F.; Raza, A.; Preisler, H.D. Bcl-2 and c-myc expression, cell cycle kinetics and apoptosis during the progression of chronic myelogenous leukemia from diagnosis to blastic phase. Leuk. Res. 1997, 21, 479–489. [Google Scholar] [CrossRef]
  11. Bachmann, H.S.; Otterbach, F.; Callies, R.; Nückel, H.; Bau, M.; Schmid, K.W.; Siffert, W.; Kimmig, R. The AA Genotype of the Regulatory BCL2 Promoter Polymorphism (−938C>A) Is Associated with a Favorable Outcome in Lymph Node–Negative Invasive Breast Cancer Patients. Clin. Cancer Res. 2007, 13, 5790–5797. [Google Scholar] [CrossRef] [Green Version]
  12. Heubner, M.; Wimberger, P.; Otterbach, F.; Kasimir-Bauer, S.; Siffert, W.; Kimmig, R.; Nuckel, H. Association of the AA genotype of the Bcl-2 (-938C > A) promoter polymorphism with better survival in ovarian cancer. Int. J. Biol. Markers 2009, 24, 223–229. [Google Scholar] [CrossRef]
  13. Hirata, H.; Hinoda, Y.; Nakajima, K.; Kikuno, N.; Suehiro, Y.; Tabatabai, Z.L.; Ishii, N.; Dahiya, R. The bcl2 −938CC Genotype Has Poor Prognosis and Lower Survival in Renal Cancer. J. Urol. 2009, 182, 721–727. [Google Scholar] [CrossRef] [PubMed]
  14. Künkele, A.; Grosse-Lordemann, A.; Schramm, A.; Eggert, A.; Schulte, J.H.; Bachmann, H.S. The BCL2-938 C > A promoter polymorphism is associated with risk group classification in children with acute lymphoblastic leukemia. BMC Cancer 2013, 13, 452. [Google Scholar] [CrossRef] [PubMed] [Green Version]
  15. Moon, J.H.; Sohn, S.K.; Lee, M.-H.; Jang, J.H.; Kim, K.; Jung, C.W.; Kim, D.H. BCL2 gene polymorphism could predict the treatment outcomes in acute myeloid leukemia patients. Leuk. Res. 2010, 34, 166–172. [Google Scholar] [CrossRef]
  16. El Hindy, N.; Bachmann, H.S.; Lambertz, N.; Adamzik, M.; Nückel, H.; Worm, K.; Zhu, Y.; Sure, U.; Siffert, W.; Sandalcioglu, I.E. Association of the CC genotype of the regulatory BCL2 promoter polymorphism (−938C>A) with better 2-year survival in patients with glioblastoma multiforme. J. Neurosurg. 2011, 114, 1631–1639. [Google Scholar] [CrossRef] [PubMed]
  17. Masago, K.; Togashi, Y.; Fujita, S.; Nagai, H.; Sakamori, Y.; Okuda, C.; Kim, Y.H.; Mishima, M. Effect of the BCL2 Gene Polymorphism on Survival in Advanced-Stage Non-Small Cell Lung Cancer Patients Who Received Chemotherapy. Oncology 2013, 84, 214–218. [Google Scholar] [CrossRef]
  18. Chou, D.; Miyashita, T.; Mohrenweiser, H.W.; Ueki, K.; Kastury, K.; Druck, T.; von Deimling, A.; Huebner, K.; Reed, J.C.; Louis, D.N. The Bax gene maps to the glioma candidate region at 19q13.3, but is not altered in human gliomas. Cancer Genet. Cytogenet. 1996, 88, 136–140. [Google Scholar] [CrossRef]
  19. Sahu, S.K.; Choudhuri, T. Lack of Association between Bax Promoter (-248G>A) Single Nucleotide Polymorphism and Susceptibility towards Cancer: Evidence from a Meta-Analysis. PLoS ONE 2013, 8, e77534. [Google Scholar] [CrossRef]
  20. Bukholm, I.K.; Nesland, J.M. Protein expression of p53, p21 (WAF1/CIP1), Bcl-2, Bax, cyclin D1 and pRb in human colon carcinomas. Virchows Arch.-Int. J. Pathol. 2000, 436, 224–228. [Google Scholar] [CrossRef]
  21. Linjawi, A.; Kontogiannea, M.; Halwani, F.; Edwardes, M.; Meterissian, S. Prognostic significance of p53, Bcl-2, and Bax expression in early breast cancer. J. Am. Coll. Surg. 2004, 198, 83–90. [Google Scholar] [CrossRef]
  22. Dorjgochoo, T.; Xiang, Y.-B.; Long, J.; Shi, J.; Deming, S.; Xu, W.-H.; Cai, H.; Cheng, J.; Cai, Q.; Zheng, W.; et al. Association of Genetic Markers in the BCL-2 Family of Apoptosis-Related Genes with Endometrial Cancer Risk in a Chinese Population. PLoS ONE 2013, 8, e60915. [Google Scholar] [CrossRef]
  23. Li, W.; Qian, C.; Wang, L.; Teng, H.; Zhang, L. Association of BCL2-938C>A genetic polymorphism with glioma risk in Chinese Han population. Tumor Biol. 2014, 35, 2259–2264. [Google Scholar] [CrossRef]
  24. Starczynski, J.; Pepper, C.; Pratt, G.; Hooper, L.; Thomas, A.; Milligan, D.; Bentley, P.; Fegan, C. Common Polymorphism G(-248)A in the Promoter Region of the bax Gene Results in Significantly Shorter Survival in Patients With Chronic Lymphocytic Leukemia Once Treatment Is Initiated. J. Clin. Oncol. 2005, 23, 1514–1521. [Google Scholar] [CrossRef] [PubMed]
  25. Zhang, N.; Li, X.; Tao, K.; Jiang, L.; Ma, T.; Yan, S.; Yuan, C.; Moran, M.S.; Liang, F.; Haffty, B.G.; et al. BCL-2 (-938C > A) polymorphism is associated with breast cancer susceptibility. BMC Med. Genet. 2011, 12, 48. [Google Scholar] [CrossRef] [Green Version]
  26. Singh, N.; Baby, D.; Rajguru, J.P.; Patil, P.B.; Thakkannavar, S.S.; Pujari, V.B. Inflammation and cancer. Ann. Afr. Med. 2019, 18, 121–126. [Google Scholar] [CrossRef]
  27. Lan, T.; Chen, L.; Wei, X. Inflammatory Cytokines in Cancer: Comprehensive Understanding and Clinical Progress in Gene Therapy. Cells 2021, 10, 100. [Google Scholar] [CrossRef]
  28. Grunnet, L.G.; Aikin, R.; Tonnesen, M.F.; Paraskevas, S.; Blaabjerg, L.; Størling, J.; Rosenberg, L.; Billestrup, N.; Maysinger, D.; Mandrup-Poulsen, T. Proinflammatory cytokines activate the intrinsic apoptotic pathway in beta-cells. Diabetes 2009, 58, 1807–1815. [Google Scholar] [CrossRef] [PubMed] [Green Version]
  29. Place, D.E.; Kanneganti, T.-D. Cell death–mediated cytokine release and its therapeutic implications. J. Exp. Med. 2019, 216, 1474–1486. [Google Scholar] [CrossRef]
  30. Dettmer, R.; Niwolik, I.; Cirksena, K.; Yoshimoto, T.; Tang, Y.; Mehmeti, I.; Gurgul-Convey, E.; Naujok, O. Proinflammatory cytokines induce rapid, NO-independent apoptosis, ex-pression of chemotactic mediators and interleukin-32 secretion in human pluripotent stem cell-derived beta cells. Diabetologia 2022, 65, 829–843. [Google Scholar] [CrossRef] [PubMed]
  31. Kumar, S.; O’Malley, J.; Chaudhary, A.K.; Inigo, J.R.; Yadav, N.; Kumar, R.; Chandra, D. Hsp60 and IL-8 axis promotes apoptosis resistance in cancer. Br. J. Cancer 2019, 121, 934–943. [Google Scholar] [CrossRef] [PubMed]
  32. Landskron, G.; De la Fuente, M.; Thuwajit, P.; Thuwajit, C.; Hermoso, M.A. Chronic Inflammation and Cytokines in the Tumor Microenvironment. J. Immunol. Res. 2014, 2014, 149185. [Google Scholar] [CrossRef] [PubMed] [Green Version]
  33. Amin, M.N.; Siddiqui, S.A.; Ibrahim, M.; Hakim, M.L.; Ahammed, M.S.; Kabir, A.; Sultana, F. Inflammatory cytokines in the pathogenesis of cardiovascular disease and cancer. SAGE Open Med. 2020, 8, 2050312120965752. [Google Scholar] [CrossRef]
  34. Montfort, A.; Colacios, C.; Levade, T.; Andrieu-Abadie, N.; Meyer, N.; Ségui, B. The TNF Paradox in Cancer Progression and Im-munotherapy. Front. Immunol. 2019, 10, 1818. [Google Scholar] [CrossRef] [Green Version]
  35. Zhou, X.; Li, Z.; Zhou, J. Tumor necrosis factor α in the onset and progression of leukemia. Exp. Hematol. 2017, 45, 17–26. [Google Scholar] [CrossRef]
  36. Min, L.; Chen, D.; Qu, L.; Shou, C. Tumor Necrosis Factor-A Polymorphisms and Colorectal Cancer Risk: A Meta-Analysis. PLoS ONE 2014, 9, e85187. [Google Scholar] [CrossRef] [PubMed]
  37. Bernhard, S.; Hug, S.; Stratmann, A.E.P.; Erber, M.; Vidoni, L.; Knapp, C.L.; Thomaß, B.D.; Fauler, M.; Nilsson, B.; Ekdahl, K.N.; et al. Interleukin 8 Elicits Rapid Physiological Changes in Neutrophils That Are Altered by Inflammatory Conditions. J. Innate Immun. 2021, 13, 225–241. [Google Scholar] [CrossRef] [PubMed]
  38. Kuett, A.; Rieger, C.; Perathoner, D.; Herold, T.; Wagner, M.; Sironi, S.; Sotlar, K.; Horny, H.-P.; Deniffel, C.; Drolle, H.; et al. IL-8 as mediator in the microenvironment-leukaemia network in acute myeloid leukaemia. Sci. Rep. 2015, 5, 18411. [Google Scholar] [CrossRef] [Green Version]
  39. Tobler, A.; Moser, B.; Dewald, B.; Geiser, T.; Studer, H.; Baggiolini, M.; Fey, M.F. Constitutive Expression of Interleukin-8 and its Re-ceptor in Human Myeloid and Lymphoid Leukemia. Blood 1993, 82, 2517–2525. [Google Scholar] [CrossRef] [PubMed] [Green Version]
  40. Allegra, A.; Musolino, C.; Tonacci, A.; Pioggia, G.; Casciaro, M.; Gangemi, S. Clinico-Biological Implications of Modified Levels of Cytokines in Chronic Lymphocytic Leukemia: A Possible Therapeutic Role. Cancers 2020, 12, 524. [Google Scholar] [CrossRef] [Green Version]
  41. Lello, L.; Raben, T.G.; Yong, S.Y.; Tellier, L.C.; Hsu, S.D. Genomic Prediction of 16 Complex Disease Risks Including Heart Attack, Diabetes, Breast and Prostate Cancer. Sci. Rep. 2019, 9, 15286. [Google Scholar] [CrossRef] [Green Version]
  42. Butt, H.; Khalid, A.; Yaqoob, M. Polymorphisms of BCL2 Gene in Acute Lymphoblastic Leukemia Patients in Pa-kistan and Screening of Phytochemicals to Overcome its Expression. Biol. Med. 2017, 10, 424. [Google Scholar] [CrossRef]
  43. Matheson, M.C.; Ellis, J.A.; Raven, J.; Walters, E.H.; Abramson, M.J. Association of IL8, CXCR2 and TNF-alpha polymorphisms and airway disease. J. Hum. Genet. 2006, 51, 196–203. [Google Scholar] [CrossRef] [PubMed] [Green Version]
  44. Jurlander, J. Hematological Malignancies, Leukemias and Lymphomas. In Encyclopedia of Cancer; Schwab, M., Ed.; Springer: Berlin/Heidelberg, Germany, 2011; pp. 1640–1644. [Google Scholar] [CrossRef]
  45. Senapati, J.; Jabbour, E.; Kantarjian, H.; Short, N.J. Pathogenesis and management of accelerated and blast phases of chronic myeloid leukemia. Leukemia 2023, 37, 5–17. [Google Scholar] [CrossRef] [PubMed]
  46. Popp, H.D.; Kohl, V.; Naumann, N.; Flach, J.; Brendel, S.; Kleiner, H.; Weiss, C.; Seifarth, W.; Saussele, S.; Hofmann, W.K.; et al. DNA damage and dna damage response in chronic myeloid leukemia. Int. J. Mol. Sci. 2020, 21, 1177. [Google Scholar] [CrossRef] [PubMed] [Green Version]
  47. Abdulmawjood, B.; Costa, B.; Roma-Rodrigues, C.; Baptista, P.V.; Fernandes, A.R. Genetic Biomarkers in Chronic Myeloid Leukemia: What Have We Learned So Far? Int. J. Mol. Sci. 2021, 22, 12516. [Google Scholar] [CrossRef]
  48. Provan, D.; Gribben, J. Molecular Hematology; John Wiley & Sons: New York, NY, USA, 2010. [Google Scholar]
  49. Spivak, J.L. The chronic myeloproliferative disorders: Clonality and clinical heterogeneity. Semin. Hematol. 2004, 41, 1–5. [Google Scholar] [CrossRef]
  50. Bonzheim, I.; Geissinger, E.; Chuang, W.Y.; Roth, S.; Strobel, P.; Marx, A.; Reimer, P.; Wilhelm, M.; Puppe, B.; Rosenwald, A.; et al. Analysis of single nucleotide polymorphisms in the FAS and CTLA-4 genes of pe-ripheral T-cell lymphomas. J. Hematop. 2008, 1, 11–21. [Google Scholar] [CrossRef] [Green Version]
  51. Knoefel, L.F.; Werle-Schneider, G.; Dally, H.; Müller, P.J.; Edler, L.; Bartsch, H.; Tuengerthal, S.; Heussel, C.P.; Reinmuth, N.; Thomas, M.; et al. Polymorphisms in the Apoptotic Pathway Gene BCL-2 and Survival in Small Cell Lung Cancer. J. Thorac. Oncol. 2011, 6, 183–189. [Google Scholar] [CrossRef] [Green Version]
  52. Bachmann, H.S.; Heukamp, L.C.; Schmitz, K.J.; Hilburn, C.F.; Kahl, P.; Buettner, R.; Nückel, H.; Eisenhardt, A.; Rübben, H.; Schmid, K.W.; et al. Regulatory BCL2 promoter polymorphism (−938C>A) is associated with adverse outcome in patients with prostate carcinoma. Int. J. Cancer 2011, 129, 2390–2399. [Google Scholar] [CrossRef]
  53. Kim, D.H.; Xu, W.; Ma, C.; Liu, X.; Siminovitch, K.; Messner, H.A.; Lipton, J.H. Genetic variants in the candidate genes of the apoptosis pathway and susceptibility to chronic myeloid leukemia. Blood 2009, 113, 2517–2525. [Google Scholar] [CrossRef] [Green Version]
  54. Pirocanac, E.C.; Nassirpour, R.; Yang, M.; Wang, J.; Nardin, S.R.; Gu, J.; Fang, B.; Moossa, A.; Hoffman, R.M.; Bouvet, M. Bax-Induction Gene Therapy of Pancreatic Cancer. J. Surg. Res. 2002, 106, 346–351. [Google Scholar] [CrossRef] [Green Version]
  55. Sturm, I.; Kohne, C.H.; Wolff, G.; Petrowsky, H.; Hillebrand, T.; Hauptmann, S.; Lorenz, M.; Dorken, B.; Daniel, P.T. Analysis of the p53/Bax pathway in colorectal cancer: Low Bax is a negative prognostic factor in patients with resected liver metastases. J. Clin. Oncol. 1999, 17, 1364–1374. [Google Scholar] [CrossRef] [PubMed]
  56. Miquel, C.; Borrini, F.; Grandjouan, S.; Aupérin, A.; Viguier, J.; Velasco, V.; Duvillard, P.; Praz, F.; Sabourin, J.-C. Role of bax Mutations in Apoptosis in Colorectal Cancers With Microsatellite Instability. Am. J. Clin. Pathol. 2005, 123, 562–570. [Google Scholar] [CrossRef] [PubMed]
  57. Kang, S.Y.; Han, J.H.; Lee, K.J.; Choi, J.-H.; Park, J.I.; Kim, H.I.; Lee, H.-W.; Jang, J.H.; Park, J.S.; Kim, H.C.; et al. Low Expression of Bax Predicts Poor Prognosis in Patients with Locally Advanced Esophageal Cancer Treated with Definitive Chemoradiotherapy. Clin. Cancer Res. 2007, 13, 4146–4153. [Google Scholar] [CrossRef] [Green Version]
  58. Sun, L.; Wei, L.Y.; Wei, L.; Li, D.M. Correlation between Bax gene polymorphisms and esophagus cancer. Oncol. Lett. 2018, 16, 7097–7101. [Google Scholar] [CrossRef] [Green Version]
  59. Porebska, I.; Wyrodek, E.; Kosacka, M.; Adamiak, J.; Jankowska, R.; Harłozińska-Szmyrka, A. Apoptotic markers p53, Bcl-2 and Bax in primary lung cancer. Vivo 2006, 20, 599–604. [Google Scholar]
  60. Jeong, S.H.; Lee, H.W.; Han, J.H.; Kang, S.Y.; Choi, J.-H.; Jung, Y.M.; Choi, H.; Oh, Y.T.; Park, K.J.; Hwang, S.C.; et al. Low Expression of Bax Predicts Poor Prognosis in Resected Non-small Cell Lung Cancer Patients with Non-squamous Histology. Jpn. J. Clin. Oncol. 2008, 38, 661–669. [Google Scholar] [CrossRef]
  61. Chen, K.X.; Hu, Z.B.; Wang, L.E.; Sturgis, E.M.; El-Naggar, A.K.; Zhang, W.; Wei, Q.Y. Single-nucleotide poly-morphisms at the TP53-binding or responsive promoter regions of Bax and Bcl-2 genes and risk of squamous cell carcinoma of the head and neck. Carcinogenesis 2007, 28, 2008–2012. [Google Scholar] [CrossRef]
  62. Anvari, K.; Toussi, M.S.; Kalantari, M.; Naseri, S.; Shahri, M.K.; Ahmadnia, H.; Katebi, M.; Pashaki, A.S.; Dayani, M.; Broumand, M. Expression of Bcl-2 and Bax in Advanced or Metastatic Prostate Carcinoma. Urol. J. 2012, 9, 381–388. [Google Scholar] [CrossRef]
  63. Yigit, S.; Demir, L.; Tarhan, M.O.; Cabuk, F.K.; Ellidokuz, H.; Erten, C.; Somali, I.; Dirican, A.; Cakalagaoglu, F.; Çakalaǧaoǧlu, F. The clinicopathological significance of Bax and Bcl-2 protein expression with tumor infiltrating lymphocytes in ovarian carcinoma. Neoplasma 2012, 59, 475–485. [Google Scholar] [CrossRef] [PubMed]
  64. Lopes-Costa, P.V.; dos Santos, A.R.; da Silva, B.B. The effect of raloxifene on Bax protein expression in breast carcinomas of postmenopausal women. Diagn. Cytopathol. 2012, 40, 570–574. [Google Scholar] [CrossRef] [PubMed]
  65. Knudson, C.M.; Tung, K.S.K.; Tourtellotte, W.G.; Brown, G.A.J.; Korsmeyer, S.J. Bax-Deficient Mice with Lymphoid Hyperplasia and Male Germ Cell Death. Science 1995, 270, 96–99. [Google Scholar] [CrossRef]
  66. Yin, C.; Knudson, C.M.; Korsmeyer, S.J.; Van Dyke, T. Bax suppresses tumorigenesis and stimulates apoptosis in vivo. Nature 1997, 385, 637–640. [Google Scholar] [CrossRef]
  67. Peng, H.; Aiello, A.; Packham, G.; Isaacson, P.G.; Pan, L. Infrequent bax gene mutations in B-cell lymphomas. J. Pathol. 1998, 186, 378–382. [Google Scholar] [CrossRef]
  68. Torrealba, N.; Rodríguez-Berriguete, G.; Vera, R.; Fraile, B.; Olmedilla, G.; Martínez-Onsurbe, P.; Sánchez-Chapado, M.; Paniagua, R.; Royuela, M. Homeostasis: Apoptosis and cell cycle in normal and pathological prostate. Aging Male 2021, 23, 335–345. [Google Scholar] [CrossRef]
  69. Alam, M.; Kashyap, T.; Mishra, P.; Panda, A.K.; Nagini, S.; Mishra, R. Role and regulation of pro-apoptotic Bax in oral squamous cell carcinoma and drug resistance. Head Neck-J. Sci. Spec. Head Neck 2019, 41, 185–197. [Google Scholar]
  70. Feng, Y.; Chen, X.L.; Zheng, Y.; Liu, Q.; Chen, H.W.; Cai, Y.H.; Cao, L.X.; Lai, X.L.; Pan, L.L.; Li, Y.; et al. Prognostic value and susceptibility of Bax rs4645878 polymorphism in cancer A systematic review and meta-analysis. Medicine 2018, 97, 8. [Google Scholar] [CrossRef] [PubMed]
  71. Wang, Y.-C.; Wang, Z.-H.; Yen, J.-H.; Shen, Y.-C.; Shen, T.-C.; Chang, W.-S.; Su, C.-H.; Chen, K.-Y.; Yen, C.-M.; Lee, H.-T.; et al. The Contribution of Interleukin-8 Rs4073 Genotypes to Triple Negative Breast Cancer Risk in Taiwan. Anticancer Res. 2022, 42, 3799–3806. [Google Scholar] [CrossRef] [PubMed]
  72. Zhu, Z.; Liu, J.-B.; Liu, X.; Qian, L. Association of interleukin 10 rs1800896 polymorphism with susceptibility to breast cancer: A meta-analysis. J. Int. Med. Res. 2020, 48, 0300060520904863. [Google Scholar] [CrossRef] [PubMed]
  73. Abdalhabib, E.K.; Alzahrani, B.; Saboor, M.; Hamza, A.; Elfaki, E.M.; Alanazi, F.; Alenazy, O.F.; Algarni, A.; Ibrahim, I.K.; Mohamed, A.H.; et al. IL-10 rs1800896 Polymorphism: A Risk Factor for Adult Acute Lymphoblastic Leukemia. Pharm. Pers. Med. 2022, 15, 809–815. [Google Scholar] [CrossRef]
  74. Singh, J.K.; Simões, B.M.; Howell, S.J.; Farnie, G.; Clarke, R. Recent advances reveal IL-8 signaling as a potential key to targeting breast cancer stem cells. Breast Cancer Res. BCR 2013, 15, 210. [Google Scholar] [CrossRef] [Green Version]
  75. Moghimi, M.; Dastgheib, S.A.; Heiranizadeh, N.; Zare, M.; Sheikhpour, E.; Neamatzadeh, H. Association of il-8 -251t>a (rs4073) polymorphism with susceptibility to gastric cancer: A systematic review and meta-analysis based on 33 case-control studies. Arq. Gastroenterol. 2020, 57, 91–99. [Google Scholar] [CrossRef] [PubMed] [Green Version]
  76. Fernando, R.I.; Castillo, M.D.; Litzinger, M.; Hamilton, D.H.; Palena, C. IL-8 signaling plays a critical role in the epitheli-al-mesenchymal transition of human carcinoma cells. Cancer Res. 2011, 71, 5296–5306. [Google Scholar] [CrossRef] [Green Version]
  77. Moreno-Guerrero, S.S.; Ramírez-Pacheco, A.; Rocha-Ramírez, L.M.; Hernández-Pliego, G.; Eguía-Aguilar, P.; Escobar-Sánchez, M.A.; Reyes-López, A.; Juárez-Villegas, L.E.; Sienra-Monge, J.J.L. Association of Genetic Polymorphisms and Serum Levels of IL-6 and IL-8 with the Prognosis in Children with Neuroblastoma. Cancers 2021, 13, 529. [Google Scholar] [CrossRef] [PubMed]
  78. Carswell, A.E.; Old, L.J.; Kassel, R.L.; Green, S.; Fiore, N.; Williamson, B. An endotoxin-induced serum factor that causes necrosis of tumors. Proc. Natl. Acad. Sci. USA 1975, 72, 3666–3670. [Google Scholar] [CrossRef] [PubMed] [Green Version]
  79. Tartaglia, L.A.; Ayres, T.; Wong, G.H.; Goeddel, D.V. A novel domain within the 55 kd TNF receptor signals cell death. Cell 1993, 74, 845–853. [Google Scholar] [CrossRef] [PubMed]
  80. Li, B.; Vincent, A.; Cates, J.; Brantley-Sieders, D.M.; Polk, D.B.; Young, P.P. Low Levels of Tumor Necrosis Factor α Increase Tumor Growth by Inducing an Endothelial Phenotype of Monocytes Recruited to the Tumor Site. Cancer Res. 2009, 69, 338–348. [Google Scholar] [CrossRef] [Green Version]
  81. Mehta, A.; Kim, Y.J.; Robert, L.; Tsoi, J.; Comin-Anduix, B.; Berent-Maoz, B.; Cochran, A.J.; Economou, J.S.; Tumeh, P.C.; Puig-Saus, C.; et al. Immunotherapy Resistance by Inflammation-Induced Dedifferentiation. Cancer Discov. 2018, 8, 935–943. [Google Scholar] [CrossRef] [PubMed] [Green Version]
  82. Li, C.W.; Xia, W.; Huo, L.; Lim, S.O.; Wu, Y.; Hsu, J.L.; Chao, C.-H.; Yamaguchi, H.; Yang, N.-K.; Ding, Q.; et al. Epithelial-mesenchymal transition induced by TNF-α requires NF-κB-mediated transcriptional upregulation of Twist1. Cancer Res. 2012, 72, 1290–1300. [Google Scholar] [CrossRef] [Green Version]
  83. Liao, S.-J.; Luo, J.; Li, D.; Zhou, Y.-H.; Yan, B.; Wei, J.-J.; Tu, J.-C.; Li, Y.-R.; Zhang, G.-M.; Feng, Z.-H. TGF-β1 and TNF-α synergistically induce epithelial to mesenchymal transition of breast cancer cells by enhancing TAK1 activation. J. Cell Commun. Signal. 2019, 13, 369–380. [Google Scholar] [CrossRef]
  84. Verma, S.; Singh, A.; Yadav, G.; Kushwaha, R.; Ali, W.; Verma, S.P.; Singh, U. Serum Tumor Necrosis Factor-Alpha Levels in Acute Leukemia and Its Prognostic Significance. Cureus 2022, 14, e24835. [Google Scholar] [CrossRef]
  85. Abdalhabib, E.K.; Algarni, A.; Saboor, M.; Alanazi, F.; Ibrahim, I.K.; Alfeel, A.H.; Alanazi, A.M.; Alanazi, A.M.; Alruwaili, A.M.; Alanazi, M.H.; et al. Association of TNF-α rs1800629 with Adult Acute B-Cell Lymphoblastic Leukemia. Genes 2022, 13, 1237. [Google Scholar] [CrossRef] [PubMed]
  86. Bănescu, C.; Tripon, F.; Trifa, A.P.; Crauciuc, A.G.; Moldovan, V.G.; Bogliş, A.; Benedek, I.; Dima, D.; Cândea, M.; Duicu, C.; et al. Cytokine rs361525, rs1800750, rs1800629, rs1800896, rs1800872, rs1800795, rs1800470, and rs2430561 SNPs in relation with prognostic factors in acute myeloid leukemia. Cancer Med. 2019, 8, 5492–5506. [Google Scholar] [CrossRef] [PubMed] [Green Version]
  87. Abd El-Aziz, S.M.; Alkhiary, W.; Mokhtar, N.; Talaab, M. Tumor necrosis factor-α (TNF-α) − 308 G/A and lymphotoxin-α (LT-α) +252 A/G genetic polymorphisms in Egyptian acute lymphoblastic leukemia. Comp. Clin. Pathol. 2018, 27, 363–369. [Google Scholar] [CrossRef]
  88. Liu, K.; Hu, J.; Wang, X.; Li, L. Chronic myeloid leukemia blast crisis presented with AML of t(9;22) and t(3;14) mimicking acute lymphocytic leukemia. J. Clin. Lab. Anal. 2019, 33, e22961. [Google Scholar] [CrossRef] [PubMed] [Green Version]
  89. Ochi, Y.; Yoshida, K.; Huang, Y.J.; Kuo, M.C.; Nannya, Y.; Sasaki, K.; Mitani, K.; Hosoya, N.; Hiramoto, N.; Ishikawa, T.; et al. Clonal evolution and clinical implications of genetic abnormalities in blastic transfor-mation of chronic myeloid leukaemia. Nat. Commun. 2021, 12, 2833. [Google Scholar] [CrossRef]
  90. Alarcón-Payer, C.; Sánchez Suárez, M.D.M.; Martín Roldán, A.; Puerta Puerta, J.M.; Jiménez Morales, A. Impact of Genetic Polymorphisms and Biomarkers on the Effectiveness and Toxicity of Treatment of Chronic Myeloid Leukemia and Acute Myeloid Leukemia. J. Pers. Med. 2022, 12, 1607. [Google Scholar] [CrossRef]
Figure 1. Characterization of human subjects enrolled in the study.
Cimb 45 00251 g001
Figure 2. Gel electrophoresis of Bcl-2-938 C>A rs2279115 SNP and Bax G (−248) A SNP, TNF-α rs1800629 G>A and IL-8 rs4073 T>A gene polymorphisms. (A) TNF-α: M-100 bp DNA ladder, Heterozygous-CA-P2,P3,P6,P8,P1,P18 and homozygous AA-0 and homozygous CC-P1,P4,P5,P6,P8 to P10 and P12 and P13-P17. (B) IL-8: M-100 bp DNA ladder, Heterozygous-TA-P1,P2,P3,P18 and homozygous TT-P5 and homozygous AA-P4, P6 to p17 and P19. (C) Bax: M-100 bp DNA ladder, Heterozygous-GA-P1,P3,P4,P7,P9,P11 and homozygous AA-P2,P12,P14 and homozygous GG-P5,P6,P10 and P13. (D) Bcl-2: M-100 bp DNA ladder, Heterozygous-GA-P1,P2,P3,P5,P14 and homozygous CC-P8,P10,P12,P13 and homozygous AA-P1,P9.
Cimb 45 00251 g002
Table 1. ARMS primers for Genotyping.
DirectionARMS Primer SequenceAnnealing TemptProduct Size
Bax G(−248) A rs4645878 gene polymorphism
Bax FO5′-CCT GGA AGC ATG CTA TTT TGGGCCT-3′65 °C 323 bp
Bax RO5′-ACG TGA GAG CCC CGC TGA ACG T-3′
Bax FI-G5′-GGC ATT AGA GCT GCG ATT GGA CTG G-3′ 209 bp
Bax RI-A5′-AGTGGCGCCGTCCAACAGCAGT-3′ 160 bp
Bcl-2-938 C>A rs2279115 gene polymorphism
Bcl-2-FO5′-CCG GCT CCT TCA TCG TCT CC-3′58 °C 300 bp
Bcl-2-RO5′-CCC AGG AGA GAG ACA GGG GAA AT-3′
Bcl-2-FI-A5′-AATAAAACCCTCCCCCACCACCT-3′ 220 bp
Bcl-2-RI-C5′-CCCTTCTCGGCAATTTACACGC-3′ 121 bp
TNF-α rs1800629 G>A gene polymorphism
TNF-αF05′-ACC CAA ACA CAG GCC TCA GGACTCAACA-3′62 °C323 bp
TNF-αR05′-TGGAGGCAATAGCTTTTGAGGGGCAGGA-3′
TNF-αFI-A5′-AGTTGGGGACACGCAAGCATGAAGGATA-3′ 154 bp
TNF-α RI-C5′-TAGGACCCTGGAGGCTAGACCCCGTACC-3′ 224 bp
IL8-251T>A (rs4073) gene polymorphism
IL8-Fo5′-CAT GAT AGC ATC TGT AAT TAA CTG-3′58 °C 349 bp
IL8-Ro5′-CACAATTTGGTGAATTATCAAA-3′
IL8-FI-A5′-GTTATCTAGAAATAAAAAAGCATACAA-3′ 228 bp
IL8-RI-T5′-CTCATCTTTTCATTATGTCAGA-3′ 169 bp
Fo—outer forward primer; FI—Inner forward primer; Ro—outer reverse primer; RI—outer reverse primer.
Table 2. Characterization of the demographic features of the study population.
Patients (113)Controls (122)
AgeN = %N = %
>4076 (67.21%)80 (65.57%)
<4037 (32.78%)42 (34.42%)
GenderN = %N = %
Males82 (72.56%)74 (60.65%)
Females31 (27.44%)48 (39.34%)
Frequency of different stages of CML (Ph+)
N = 64
Chronic phase CML 34 (53.12%)
Accelerated phase CML 20 (31.25%)
Blast crisis CML 10 (15.62%)
Frequency of other MPDs (Ph−)
MPD TYPEN = 49
Essential thrombocytopenia 30 (61.22%)
Polycythemia verra 15 (30.61%)
Myelofibrosis 04 (8.16%)
Table 3. Analytical comparison of the genotypes associated with myeloproliferative leukemia patients and healthy controls.
Bcl-2-938 C>A rs2279115
Study
Population
N=CC %CA %AA %C alleleA alleleDFX2p Value
Patients10034 (34.0%)44 (44.0%)22 (22.0%)0.560.4427.320.025
Healthy controls10049 (49.0%)41 (41.0%)10 (10.0%)0.670.31
Bax-248G>A
N=GG %GA %AA %G alleleA alleleDFX2p value
Patients10856 (51.85%)45 (41.66%)07 (6.48%)0.730.2726.230.048
Healthy controls11075 (68.50%)30 (27.27%)5 (4.54%)0.820.18
IL-8 rs4073 T>A
SubjectsN=TTATAATADfX2p value
Patients11319 (16.81%)41 (36.28%)53 (56.90%)0.250.75220.240.0001
Healthy controls12248 (39.34%)46 (37.70%)28 (22.95%)0.3961
TNF-α rs1800629 G>A
SubjectsN=GGGAAAGADfX2p value
Patients11394 (83.18%)10 (8.84%)09 (7.96%)0.870.1327.640.021
Healthy controls122100 (69.67%)20 (28.68%)02 (1.63%)0.840.16
Table 4. Association of Bcl-2-938 C>A genotypes with the risk of leukemia (Multivariate analysis).
ControlsPatients
Genotypes(N = 100)(N = 100)Odd Ratio (95% CI)Risk Ratio (95% CI)p Value
Codominant
Bcl-2 (CC)49 (49.0%)34 (34.0%)(ref.)(ref.)
Bcl-2 (CA)41 (41.0%)44 (44.0%)1.540 (0.840–2.840)1.220 (0.920–1.620)0.160
Bcl-2 (AA)10 (10.0%)22 (49.0%)3.170 (1.330–7.530)1.880 (1.090–3.250)0.009
Dominant
Bcl-2 (CC)49 (49.0%)34 (34.0%)(ref.)(ref.)
Bcl-2 (CA + AA)51 (51.0%)66 (66.0%)1.860 (1.050–3.290)1.350 (1.030–1.770)0.030
Recessive
Bcl-2 (CC + CA)90 (90.0%)78 (78.0%)(ref.)(ref.)
Bcl-2 (AA)10 (10.0%)22 (22.0%)2.530 (1.130–5.680)1.710 (1.006–2.920)0.020
Allele
Bcl-2 (C)139 (69.50%)112 (56.0%)(ref.)(ref.)
Bcl-2 (A)61 (30.50%)88 (44.0%)1.790 (1.180–2.690)1.350 (1.08–1.68)0.005
Table 5. Association of Bax-248G>A genotypes with the risk of leukemia (Multivariate analysis).
GenotypesControlsPatientsOdd Ratio (95% CI)Risk Ratio (95% CI)p Value
Inheritance Model(N = 110)%(N = 108)%
Codominant
Bax (GG)7568.18%5651.85%(ref.)(ref.)
Bax (GA)3027.27%4541.66%2.0 (1.12–3.57)1.43 (1.045–1.95)0.01
Bax (AA)054.54%074.68%1.87 (0.56–6.21)1.37 (0.69–2.72)0.30
Dominant
Bax (GG)7568.185651.85 %(ref.)(ref.)
Bax (GA + AA)3531.825248.15 %1.98 (1.14–3.45)1.43 (1.05–1.91)0. 01
Recessive
Bax (GG + GA)10595.4510193.52%(ref.)(ref.)
Bax (AA)054.55076.48 %1.45 (0.44–4.73)1.23 (0.61–2.42)0.53
Allele
Bax (G)18081.8215773.36%(ref.)(ref.)
Bax (A)4018.185726.63%1.63 (1.03–2.58)1.29 (1.00–1.67)0.035
Table 6. Association of IL-8 rs4073 T>A genotypes with the risk of leukemia (Multivariate analysis).
Genotypes
Inheritance Model
Controls
(N = 122)
Patients
(N = 113)
Odd Ratio (95% CI)Risk Ratio (95% CI)p Value
Codominant
IL-8 (TT)4819(ref.)(ref.)
IL-8 (TA)46412.25 (1.1433 to 4.434)1.35 (1.0562 to 1.738)0.018
IL-8 (AA)28534.7 (2.3714 to 9.642)2.07 (1.4820 to 2.898)0.0001
Dominant
IL-8 (TT)4819(ref.)(ref.)
IL-8-(TA + AA)74943.20 (1.7395 to 5.920)1.62 (1.2956 to 2.041)0.0002
Recessive
IL-8 (TT + TA)9460(ref.)(ref.)
IL-8- (AA)28532.96 (1.6953 to 5.112)1.76 (1.2706 to 2.447)0.0001
Allele
IL-8 (T)14279(ref.)(ref.)
IL-8-A1021472.59 (1.78057 to 3.7657)1.56 (1.314 to 1.871)0.0001
Over Dominant
IL-8 (TT + AA)7672(ref.)(ref.)
IL-8 (TA)46410.94 (0.5536 to 1.5924)0.97 (0.758 to 1.2723)0.82
Table 7. Association of TNF-α rs1800629 G>A genotypes with the risk of leukemia (Multivariate analysis).
GenotypesControlsPatientsOdd Ratio (95% CI)Risk Ratio (95% CI)p Value
Inheritance Model(N = 122)(N = 113)
Codominant
TNF-α (GG)10094(ref.)(ref.)
TNF-α (GA)20110.58 (0.2661 to 1.286)0.79 (0.5951 to 1.072)0.182
TNF-α (AA)02084.78 (1.0081 to 22.732)2.83 (0.8034 to 10.005)0.048
Dominant
TNF-α (GG)10094(ref.)(ref.)
TNF-α (GA+AA)22190.96 (0.4960 to 1.885)0.98 (0.7153 to 1.353)0.92
Recessive
TNF-α (GA+GG)120105(ref.)(ref.)
TNF-α (AA)02095.14 (1.0867 to 24.337)2.93 (0.8324 to 10.336)0.038
Allele
TNF-α (G)220199(ref.)(ref.)
TNF-α (A)24291.33 (0.7526 to 2.371)1.15 (0.8507 to 1.580)0.32
Over dominant
TNF-α-(GG+AA)102105(ref.)(ref.)
TNF-α (GA)20080.53 (0.2438 to 1.170)0.76 (0.5684 to 1.026)0.11
Table 8. Association of genotypes with clinical characteristic of the MPDs.
Bcl-2-938 C>A genotypes
GenderN = 100CC %CA %(AA) %DfX2p Value
Age>406020 (33.33%)30 (50%)10 (16.66%)23.190.20
<404014 (35%)14 (35%)12 (30%)
GenderMales7828 (35.89%)36 (46.15%)14 (17.95%)24.890.08
Females2206 (27.27%)08 (36.36%)08 (36.36%)
StageCP-CML255 (20%)15 (60%)5 (20%)25.430.04
AP-CML2010 (50%)5 (25%)5 (25%)
CP-CML255 (20%)15 (60%)5 (20%)21.50.47
MPD typesBC-CML135 (38.46%)6 (46.15%)2 (15.38%)
MPD ET156 (0.4%)5 (33.33%)4 (26.67%)0.6440.95
MPD PV125 (41.67%)5 (41.67%)2 (16.67%)
MPD MF063 (0.5%)2 (33.33%)1 (16.67%)
Bax-248G>A genotypes
N = 108GG (56)GA (45)AA (07)DfX2p value
Age>406326 (41.26%)35 (55.55%)02 (3.17%)212.820.001
<404530 (66.66%)10 (22.22%)05 (11.11%)
GenderMales7336 (49.32%)33 (45.21%)03 (4.11%)22.830.24
Females3520 (57.14%)12 (34.29%)04 (11.43%)
StageCP-CML3014 (46.67%)13 (43.33%)03 (1%)20.310.98
AP-CML1406 (42.86%)07 (0.5%)01 (7.14%)
CP-CML3014 (46.67%)13 (43.33%)03 (1%)20.150.92
BC-CML1004 (40%)05 (50%)01 (10%)
MPD typesMPD ET3018 (6%)11 (36.67%)1 (3.33%)40.800.93
MPD PV1610 (62.5%)05 (31.25%)1 (6.25%)
MPD MF0402 (0.5%)2 (0.5%)0 (0%)
TNF-α rs1800629 G>A genotypes
N = 113GG94GA10AA09DfX2p value
Age>407670 (92.10%)02 (3.94%)04 (5.26%)14.4920.0007
<403724 (64.86%)8 (21.62%)05 (13.51%)
GenderMales8272 (87.80%)08 (9.75%)02 (3.65%)12.520.0019
Females3122 (70.96%)02 (9.67%)07 (19.35%)
StageCP-CML3427 (79.41%)04 (11.76%)03 (8.82%)1.0420.59
AP-CML2018 (90%)01 (5%)01 (5%)
CP-CML3427 (79.41%)04 (11.76%)03 (8.82%)7.3220.025
BC-CML105 (50%)05 (50%)00 (0%)
MPD typesMPD ET3024 (80%)3 (10%)03 (10%)4.5640.332
MPD PV1511 (73.33%)3 (20%)1 (6.66%)
MPD MF042 (50%)2 (50%)0 (0%)
IL-8 rs4073 T>A genotypes
N = 113TT19TA41AA53DfX2p value
Age>407608 (10.52%)31 (40.78%)37 (48.68%)6.9120.031
<403711 (29.72%)10 (27%)16 (43.24%)
GenderMales828 (9.75%)33 (40.24%)41 (50%)10.7620.004
Females3111 (35.48%)8 (25.80%)12 (38.70%)
StageCP-CML3406 (17.64%)12 (35.29%)16 (47.05%)20.320.85
AP-CML2003 (15%)06 (30%)11 (55%)
CP-CML3406 (17.64%)12 (35.29%)16 (47.05%)24.320.11
BC-CML1005 (50%)02 (20%)03 (30%)
MPD typesMPD ET3002 (6.66%)16 (53.33%)12 (40%)4.2140.37
MPD PV1502 (13.33%)04 (26.66%)9 (60%)
MPD MF0401 (25%)01 (25%)02 (50%)
Table 9. Comparative association of the gene polymorphisms between Ph+ and Ph− cases of MPD.
Association of Bcl-2-938 gene polymorphism
N = 91CC(34)CA (38)AA (19)DfX2p value
Ph (+) patients5820261220.280.86
Ph (−) patients33141207
Association of Bax-248G>A gene polymorphism
N = 94GG(44)GA(43)AA(07)DfX2p value
Ph (+) patients5424250520.720.69
Ph (−) patients40201802
Association of TNF-α rs1800629 G>A polymorphism
N = 113GG87GA18AA08DfX2p value
Ph (+) patients6450100420.180.91
Ph (−) patients49370804
Association of IL-8 rs4073 T>A gene polymorphism
N = 112TT19TA41AA53DfX2p value
Ph (+) patients6313203022.80.24
Ph (−) patients49052123
Disclaimer/Publisher’s Note: The statements, opinions and data contained in all publications are solely those of the individual author(s) and contributor(s) and not of MDPI and/or the editor(s). MDPI and/or the editor(s) disclaim responsibility for any injury to people or property resulting from any ideas, methods, instructions or products referred to in the content.

