
The Potential Association between E2F2, MDM2 and p16 Protein Concentration and Selected Sociodemographic and Clinicopathological Characteristics of Patients with Oral Squamous Cell Carcinoma
 , , , , , ,
Abstract
:1. Introduction
2. Materials and Methods
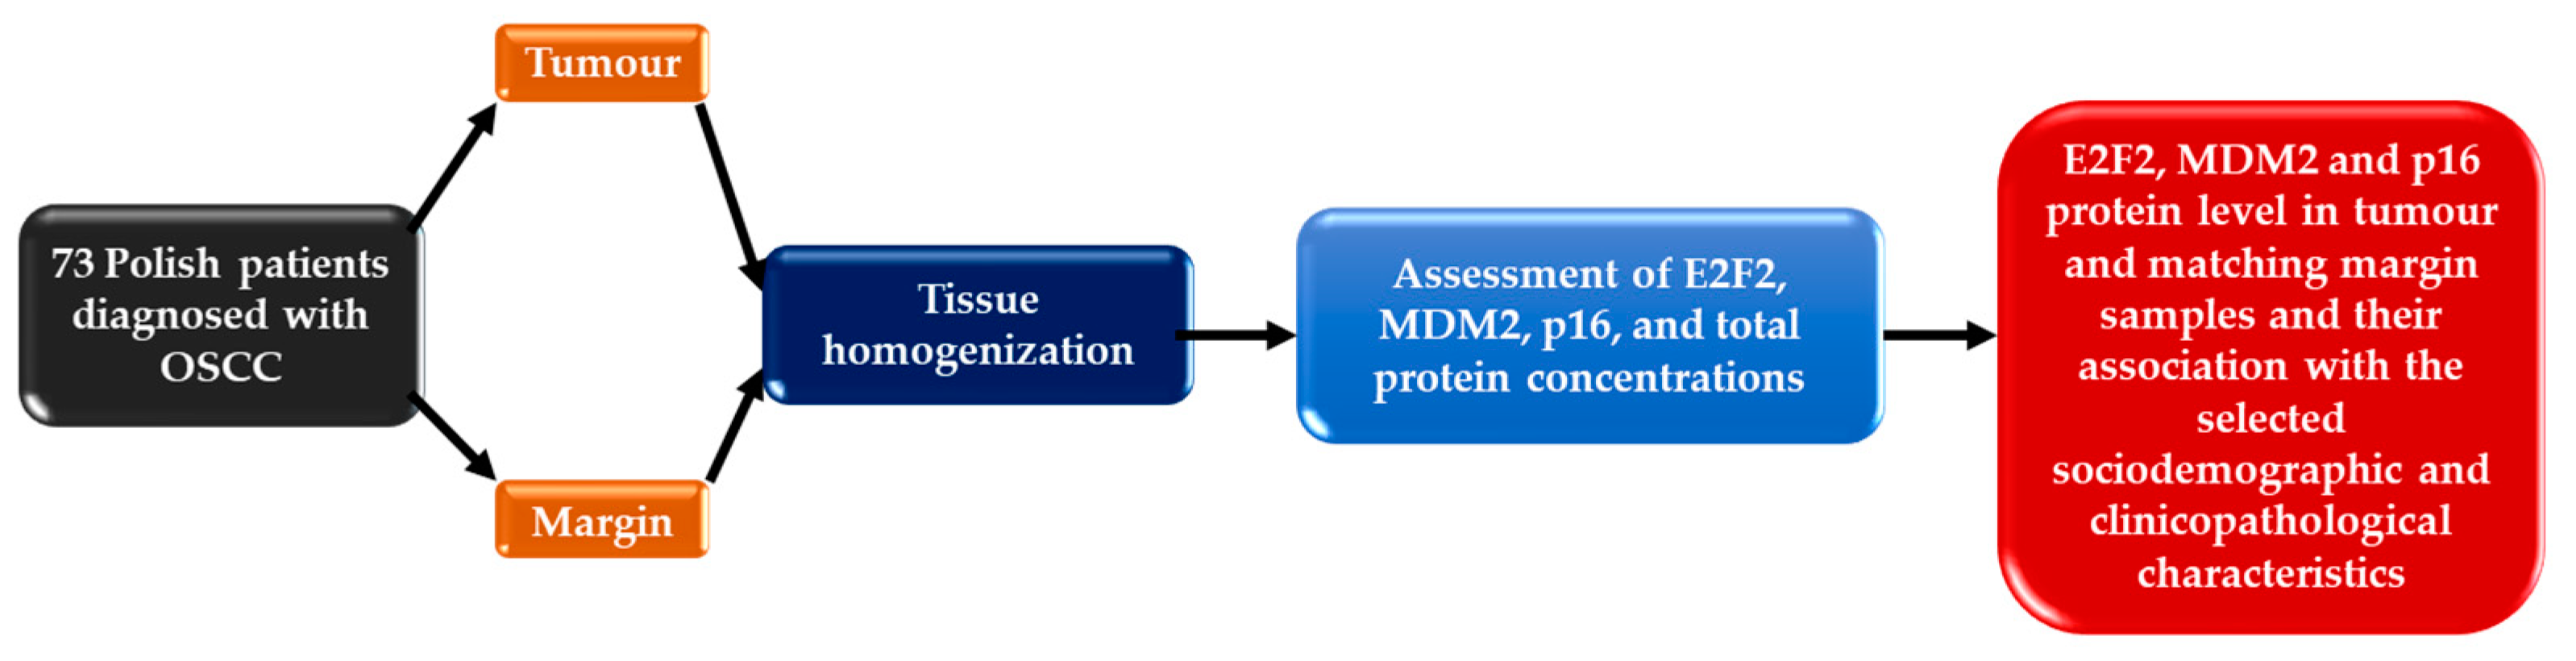
2.1. Patient and Samples
2.2. E2F2, MDM2 and p16 Protein Concentration Evaluation
2.3. HPV 16 Detection
2.4. Statistical Analyses
3. Results
4. Discussion
5. Conclusions
Author Contributions
Funding
Institutional Review Board Statement
Informed Consent Statement
Data Availability Statement
Conflicts of Interest
References
- Sung, H.; Ferlay, J.; Siegel, R.L.; Laversanne, M.; Soerjomataram, I.; Jemal, A.; Bray, F. Global Cancer Statistics 2020: GLOBOCAN Estimates of Incidence and Mortality Worldwide for 36 Cancers in 185 Countries. CA Cancer J. Clin. 2021, 71, 2096–2249. [Google Scholar] [CrossRef] [PubMed]
- Pérez-Sayáns, M.; Somoza-Martín, J.M.; Barros-Angueira, F.; Reboiras-López, M.D.; Gándara Rey, J.M.; García-García, A. Genetic and molecular alterations associated with oral squamous cell cancer (Review). Oncol. Rep. 2009, 22, 1277–1282. [Google Scholar] [CrossRef] [PubMed] [Green Version]
- Asthana, S.; Labani, S.; Kailash, U.; Sinha, D.N.; Mehrotra, R. Association of Smokeless Tobacco Use and Oral Cancer: A Systematic Global Review and Meta-Analysis. Nicotine Tob. Res. 2019, 21, 1162–1171. [Google Scholar] [CrossRef] [PubMed]
- Chamoli, A.; Gosavi, A.S.; Shirwadkar, U.P.; Wangdale, K.V.; Behera, S.K.; Kurrey, N.K.; Kalia, K.; Mandoli, A. Overview of oral cavity squamous cell carcinoma: Risk factors, mechanisms, and diagnostics. Oral Oncol. 2021, 121, 105451. [Google Scholar] [CrossRef] [PubMed]
- Hoes, L.; Dok, R.; Verstrepen, K.J.; Nuyts, S. Ethanol-Induced Cell Damage Can Result in the Development of Oral Tumors. Cancers 2021, 13, 3846. [Google Scholar] [CrossRef]
- Pignatelli, P.; Romei, F.M.; Bondi, D.; Giuliani, M.; Piattelli, A.; Curia, M.C. Microbiota and Oral Cancer as A Complex and Dynamic Microenvironment: A Narrative Review from Etiology to Prognosis. Int. J. Mol. Sci. 2022, 23, 8323. [Google Scholar] [CrossRef]
- Ausoni, S.; Boscolo-Rizzo, P.; Singh, B.; Da Mosto, M.C.; Spinato, G.; Tirelli, G.; Spinato, R.; Azzarello, G. Targeting cellular and molecular drivers of head and neck squamous cell carcinoma: Current options and emerging perspectives. Cancer Metastasis Rev. 2016, 35, 413–426. [Google Scholar] [CrossRef] [Green Version]
- Fischer, M.; Müller, G.A. Cell cycle transcription control: DREAM/MuvB and RB-E2F complexes. Crit. Rev. Biochem. Mol. Biol. 2017, 52, 638–662. [Google Scholar] [CrossRef] [Green Version]
- Wang, Y.; Zhao, J.; Zhang, C.; Wang, P.; Huang, C.; Peng, H. MDM2 promotes the proliferation and inhibits the apoptosis of pituitary adenoma cells by directly interacting with p53. Endokrynol. Pol. 2020, 71, 425–431. [Google Scholar] [CrossRef]
- Kent, L.N.; Leone, G. The broken cycle: E2F dysfunction in cancer. Nat. Rev. Cancer. 2019, 19, 326–338. [Google Scholar] [CrossRef]
- Roskoski, R., Jr. Cyclin-dependent protein serine/threonine kinase inhibitors as anticancer drugs. Pharmacol. Res. 2019, 139, 471–488. [Google Scholar] [CrossRef] [PubMed]
- Li, L.; Wang, S.; Zhang, Y.; Pan, J. The E2F transcription factor 2: What do we know? Biosci. Trends. 2021, 15, 83–92. [Google Scholar] [CrossRef] [PubMed]
- Du, K.; Sun, S.; Jiang, T.; Liu, T.; Zuo, X.; Xia, X.; Liu, X.; Wang, Y.; Bu, Y. E2F2 promotes lung adenocarcinoma progression through B-Myb- and FOXM1-facilitated core transcription regulatory circuitry. Int. J. Biol. Sci. 2022, 18, 4151–4170. [Google Scholar] [CrossRef] [PubMed]
- Almeida, J.; Mota, I.; Skoda, J.; Sousa, E.; Cidade, H.; Saraiva, L. Deciphering the Role of p53 and TAp73 in Neuroblastoma: From Pathogenesis to Treatment. Cancers 2022, 14, 6212. [Google Scholar] [CrossRef] [PubMed]
- Ye, J.; Liang, R.; Bai, T.; Lin, Y.; Mai, R.; Wei, M.; Ye, X.; Li, L.; Wu, F. RBM38 plays a tumor-suppressor role via stabilizing the p53-mdm2 loop function in hepatocellular carcinoma. J. Exp. Clin. Cancer Res. 2018, 37, 212. [Google Scholar] [CrossRef]
- Hou, H.; Sun, D.; Zhang, X. The role of MDM2 amplification and overexpression in therapeutic resistance of malignant tumors. Cancer Cell Int. 2019, 22, 216. [Google Scholar] [CrossRef] [Green Version]
- Onel, K.; Cordon-Cardo, C. MDM2 and prognosis. Mol. Cancer Res. 2004, 2, 1–8. [Google Scholar] [CrossRef]
- Agarwal, P.; Sandey, M.; DeInnocentes, P.; Bird, R.C. Tumor suppressor gene p16/INK4A/CDKN2A-dependent regulation into and out of the cell cycle in a spontaneous canine model of breast cancer. J. Cell Biochem. 2013, 114, 1355–1363. [Google Scholar] [CrossRef]
- Pinkiewicz, M.; Dorobisz, K.; Zatoński, T. Human Papillomavirus-Associated Head and Neck Cancers. Where are We Now? A Systematic Review. Cancer Manag. Res. 2022, 14, 3313–3324. [Google Scholar] [CrossRef]
- De Wispelaere, N.; Rico, S.D.; Bauer, M.; Luebke, A.M.; Kluth, M.; Büscheck, F.; Hube-Magg, C.; Höflmayer, D.; Gorbokon, N.; Weidemann, S.; et al. High prevalence of p16 staining in malignant tumors. PLoS ONE 2022, 17, e0262877. [Google Scholar] [CrossRef]
- Slaughter, D.P.; Southwick, H.W.; Smejkal, W. Field cancerization in oral stratified squamous epithelium; clinical implications of multicentric origin. Cancer 1953, 6, 963–968. [Google Scholar] [CrossRef] [PubMed]
- Braakhuis, B.J.; Tabor, M.P.; Kummer, J.A.; Leemans, C.R.; Brakenhoff, R.H. A genetic explanation of Slaughter’s concept of field cancerization: Evidence and clinical implications. Cancer Res. 2003, 63, 1727–1730. [Google Scholar] [PubMed]
- Angadi, P.V.; Savitha, J.K.; Rao, S.S.; Sivaranjini, Y. Oral field cancerization: Current evidence and future perspectives. Oral. Maxillofac. Surg. 2012, 16, 171–180. [Google Scholar] [CrossRef] [PubMed]
- Brunner, M.; Ng, B.C.; Veness, M.J.; Clark, J.R. Comparison of the AJCC N staging system in mucosal and cutaneous squamous head and neck cancer. Laryngoscope 2014, 124, 1598–1602. [Google Scholar] [CrossRef] [PubMed]
- Rodrigues, P.C.; Miguel, M.C.; Bagordakis, E.; Fonseca, F.P.; De Aquino, S.N.; Santos-Silva, A.R.; Lopes, M.A.; Graner, E.; Salo, T.; Kowalski, L.P.; et al. Clinicopathological prognostic factors of oral tongue squamous cell carcinoma: A retrospective study of 202 cases. Int. J. Oral Maxillofac. Surg. 2014, 43, 795–801. [Google Scholar] [CrossRef]
- El-Naggar, A.K.; Chan, J.K.C.; Grandis, J.R.; Takata, T.; Slootweg, P.J. WHO Classification of Head and Neck Tumours International Agency for Research on Cancer (IARC), 4th ed.; IARC Publications: Lyon, France; World Health Organization: Geneva, Switzerland, 2017. [Google Scholar]
- Padhi, S.S.; Roy, S.; Kar, M.; Saha, A.; Roy, S.; Adhya, A.; Baisakh, M.; Banerjee, B. Role of CDKN2A/p16 expression in the prognostication of oral squamous cell carcinoma. Oral Oncol. 2017, 73, 27–35. [Google Scholar] [CrossRef]
- Yang, H.L.; Xu, C.; Yang, Y.K.; Tang, W.Q.; Hong, M.; Pan, L.; Chen, H.Y. ZNF750 exerted its Antitumor Action in Oral Squamous Cell Carcinoma by regulating E2F2. J. Cancer. 2021, 12, 7266–7276. [Google Scholar] [CrossRef]
- Yang, C.; Zhang, Z.C.; Liu, T.B.; Xu, Y.; Xia, B.R.; Lou, G. E2F1/2/7/8 as independent indicators of survival in patients with cervical squamous cell carcinoma. Cancer Cell Int. 2020, 12, 500. [Google Scholar] [CrossRef]
- Dong, Y.; Zou, J.; Su, S.; Huang, H.; Deng, Y.; Wang, B.; Li, W. MicroRNA-218 and microRNA-520a inhibit cell proliferation by downregulating E2F2 in hepatocellular carcinoma. Mol. Med. Rep. 2015, 12, 1016–1022. [Google Scholar] [CrossRef] [Green Version]
- Xie, L.; Li, T.; Yang, L.H. E2F2 induces MCM4, CCNE2 and WHSC1 upregulation in ovarian cancer and predicts poor overall survival. Eur. Rev. Med. Pharm. Sci. 2017, 21, 2150–2156. [Google Scholar]
- Zhou, X.; Tao, H. Overexpression of microRNA-936 suppresses non-small cell lung cancer cell proliferation and invasion via targeting E2F2. Exp. Ther. Med. 2018, 16, 2696–2702. [Google Scholar] [CrossRef] [Green Version]
- Gao, Y.; Ma, X.; Yao, Y.; Li, H.; Fan, Y.; Zhang, Y.; Zhao, C.; Wang, L.; Ma, M.; Lei, Z.; et al. miR-155 regulates the proliferation and invasion of clear cell renal cell carcinoma cells by targeting E2F2. Oncotarget 2016, 7, 20324–20337. [Google Scholar] [CrossRef] [PubMed] [Green Version]
- Shang, Y.; Zhang, Y.; Liu, J.; Chen, L.; Yang, X.; Zhu, Z.; Li, D.; Deng, Y.; Zhou, Z.; Lu, B.; et al. Decreased E2F2 Expression Correlates with Poor Prognosis and Immune Infiltrates in Patients with Colorectal Cancer. J. Cancer. 2022, 13, 653–668. [Google Scholar] [CrossRef] [PubMed]
- Liu, Q.; Song, C.; Li, J.; Liu, M.; Fu, L.; Jiang, J.; Zeng, Z.; Zhu, H. E2F2 enhances the chemoresistance of pancreatic cancer to gemcitabine by regulating the cell cycle and upregulating the expression of RRM2. Med. Oncol. 2022, 39, 124. [Google Scholar] [CrossRef]
- Szymonowicz, K.A.; Chen, J. Biological and clinical aspects of HPV-related cancers. Cancer Biol. Med. 2020, 17, 864–878. [Google Scholar] [CrossRef]
- Herok, M.; Wawrzynow, B.; Maluszek, M.J.; Olszewski, M.B.; Zylicz, A.; Zylicz, M. Chemotherapy of HER2- and MDM2-Enriched Breast Cancer Subtypes Induces Homologous Recombination DNA Repair and Chemoresistance. Cancers 2021, 13, 4501. [Google Scholar] [CrossRef]
- Karni-Schmidt, O.; Lokshin, M.; Prives, C. The Roles of MDM2 and MDMX in Cancer. Annu. Rev. Pathol. 2016, 11, 617–644. [Google Scholar] [CrossRef]
- Jeczen, R.; Skomra, D.; Cybulski, M.; Schneider-Stock, R.; Szewczuk, W.; Roessner, A.; Rechberger, T.; Semczuk, A. P53/MDM2 overexpression in metastatic endometrial cancer: Correlation with clinicopathological features and patient outcome. Clin. Exp. Metastasis 2007, 24, 503–511. [Google Scholar] [CrossRef]
- Nag, S.; Zhang, X.; Srivenugopal, K.S.; Wang, M.H.; Wang, W.; Zhang, R. Targeting MDM2-p53 interaction for cancer therapy: Are we there yet? Curr. Med. Chem. 2014, 21, 553–574. [Google Scholar] [CrossRef]
- Carroll, P.E.; Okuda, M.; Horn, H.F.; Biddinger, P.; Stambrook, P.J.; Gleich, L.L.; Li, Y.Q.; Tarapore, P.; Fukasawa, K. Centrosome hyperamplification in human cancer: Chromosome instability induced by p53 mutation and/or Mdm2 overexpression. Oncogene 1999, 18, 1935–1944. [Google Scholar] [CrossRef] [Green Version]
- Valentin-Vega, Y.A.; Barboza, J.A.; Chau, G.P.; El-Naggar, A.K.; Lozano, G. High levels of the p53 inhibitor MDM4 in head and neck squamous carcinomas. Hum. Pathol. 2007, 38, 1553–1562. [Google Scholar] [CrossRef] [PubMed] [Green Version]
- Mastronikolis, N.; Ragos, V.; Fotiades, P.; Papanikolaou, V.; Kyrodimos, E.; Chrysovergis, A.; Mastronikolis, S.; Tsiambas, E. mdm2 oncogene in laryngeal squamous cell carcinoma. J. BUON 2020, 25, 594–596. [Google Scholar]
- Friesland, S.; Kanter-Lewensohn, L.; Tell, R.; Munck-Wikland, E.; Lewensohn, R.; Nilsson, A. Expression of Ku86 confers favorable outcome of tonsillar carcinoma treated with radiotherapy. Head Neck 2003, 25, 313–321. [Google Scholar] [CrossRef] [PubMed]
- Rungraungrayabkul, D.; Panpradit, N.; Lapthanasupkul, P.; Kitkumthorn, N.; Klanrit, P.; Subarnbhesaj, A.; Sresumatchai, V.; Klongnoi, B.; Khovidhunkit, S.P. Detection of Human Papillomavirus and p16INK4a Expression in Thai Patients with Oral Squamous Cell Carcinoma. Head Neck Pathol. 2022, 16, 444–452. [Google Scholar] [CrossRef] [PubMed]
- Trinh, J.M.; Thomas, J.; Salleron, J.; Henrot, P. Differences in clinical and imaging characteristics between p16-positive non-smokers and p16-positive smokers or p16-negative patients in oropharyngeal carcinoma. Sci. Rep. 2021, 11, 3314. [Google Scholar] [CrossRef]
- Belobrov, S.; Cornall, A.M.; Young, R.; Koo, K.; Angel, C.; Wiesenfeld, D.; Rischin, D.; Garland, S.M.; McCullough, M. The role of human papillomavirus in p16-positive oral cancers. J. Oral. Pathol. Med. 2018, 47, 18–24. [Google Scholar] [CrossRef] [Green Version]
- Eder-Czembirek, C.; Sulzbacher, I.; Fuereder, T.; Selzer, E. P16 positivity and regression grade predict survival after neoadjuvant radiotherapy of OSCC. Oral diseases 2018, 24, 544–551. [Google Scholar] [CrossRef]
- Jitani, A.K.; Raphael, V.; Mishra, J.; Shunyu, N.B.; Khonglah, Y.; Medhi, J. Analysis of Human Papilloma Virus 16/18 DNA and its Correlation with p16 Expression in Oral Cavity Squamous Cell Carcinoma in North-Eastern India: A Chromogenic in-situ Hybridization Based Study. J. Clin. Diagn. Res. 2015, 9, EC04–EC07. [Google Scholar] [CrossRef]
- Bouland, C.; Dequanter, D.; Lechien, J.R.; Hanssens, C.; De Saint Aubain, N.; Digonnet, A.; Javadian, R.; Yanni, A.; Rodriguez, A.; Loeb, I.; et al. Prognostic Significance of a Scoring System Combining p16, Smoking, and Drinking Status in a Series of 131 Patients with Oropharyngeal Cancers. Int. J. Otolaryngol. 2021, 2021, 8020826. [Google Scholar] [CrossRef]
- Shyamsundar, V.; Thangaraj, S.V.; Krishnamurthy, A.; Vimal, S.; Kesavan, P.; Babu, A.; Kmk, M.; Ramshankar, V. Exome Sequencing with Validations and Expression of p16/CDKN2A Shows no Association with HPV in Oral Cancers. Asian Pac. J. Cancer Prev. 2022, 23, 191–200. [Google Scholar] [CrossRef]
- Zhang, D.; Song, J.; Zhang, X.; Bi, H. The value of p16INK4a immunostaining for high-grade squamous intraepithelial lesions in human papillomavirus-negative patients. BMC Womens Health. 2022, 22, 138. [Google Scholar] [CrossRef] [PubMed]
- Allameh, A.; Moazeni-Roodi, A.; Harirchi, I.; Ravanshad, M.; Motiee-Langroudi, M.; Garajei, A.; Hamidavi, A.; Mesbah-Namin, S.A. Promoter DNA Methylation and mRNA Expression Level of p16 Gene in Oral Squamous Cell Carcinoma: Correlation with Clinicopathological Characteristics. Pathol. Oncol Res. 2019, 25, 1535–1543. [Google Scholar] [CrossRef]
- De Lima, M.A.P.; Cavalcante, R.B.; Da Silva, C.G.L.; Nogueira, R.L.M.; Macedo, G.E.C.; De Galiza, L.E.; Pinheiro, J.V.; Maia Filho, P.H.B.; Santos, S.F.; Rabenhorst, S.H.B. Evaluation of HPV and EBV in OSCC and the expression of p53, p16, E-cadherin, COX-2, MYC, and MLH1. Oral Dis. 2022, 28, 1104–1122. [Google Scholar] [CrossRef] [PubMed]
- Emmett, S.; Jenkins, G.; Boros, S.; Whiteman, D.C.; Panizza, B.; Antonsson, A. Low prevalence of human papillomavirus in oral cavity squamous cell carcinoma in Queensland, Australia. ANZ J. Surg. 2017, 87, 714–719. [Google Scholar] [CrossRef] [PubMed]
- Ni, Y.; Zhang, X.; Wan, Y.; Dun Tang, K.; Xiao, Y.; Jing, Y.; Song, Y.; Huang, X.; Punyadeera, C.; Hu, Q. Relationship between p16 expression and prognosis in different anatomic subsites of OSCC. Cancer Biomark. 2019, 26, 375–383. [Google Scholar] [CrossRef] [PubMed]
- Sundberg, J.; Korytowska, M.; Burgos, P.M.; Blomgren, J.; Blomstrand, L.D.E.; Lara, S.; Sand, L.; Hirsch, J.M.; Holmberg, E.; Giglio, D.; et al. Combined Testing of p16 Tumour-suppressor Protein and Human Papillomavirus in Patients With Oral Leukoplakia and Oral Squamous Cell Carcinoma. Anticancer Res. 2019, 39, 1293–1300. [Google Scholar] [CrossRef]
- Yang, L.Q.; Xiao, X.; Li, C.X.; Wu, W.Y.; Shen, X.M.; Zhou, Z.T.; Fan, Y.; Shi, L.J. Human papillomavirus genotypes and p16 expression in oral leukoplakia and squamous cell carcinoma. Int. J. Clin. Exp. Pathol. 2019, 12, 1022–1028. [Google Scholar]
- Tokuzen, N.; Nakashiro, K.I.; Tojo, S.; Goda, H.; Kuribayashi, N.; Uchida, D. Human papillomavirus-16 infection and p16 expression in oral squamous cell carcinoma. Oncol. Lett. 2021, 22, 528. [Google Scholar] [CrossRef]
- Frohwitter, G.; Buerger, H.; Van Diest, P.J.; Korsching, E.; Kleinheinz, J.; Fillies, T. Cytokeratin and protein expression patterns in squamous cell carcinoma of the oral cavity provide evidence for two distinct pathogenetic pathways. Oncol. Lett. 2016, 12, 107–113. [Google Scholar] [CrossRef] [Green Version]
- Zafereo, M.E.; Xu, L.; Dahlstrom, K.R.; Viamonte, C.A.; El-Naggar, A.K.; Wei, Q.; Li, G.; Sturgis, E.M. Squamous cell carcinoma of the oral cavity often overexpresses p16 but is rarely driven by human papillomavirus. Oral Oncol. 2016, 56, 47–53. [Google Scholar] [CrossRef] [Green Version]
- Berdugo, J.; Rooper, L.M.; Chiosea, S.I. RB1, p16, and Human Papillomavirus in Oropharyngeal Squamous Cell Carcinoma. Head Neck Pathol. 2021, 15, 1109–1118. [Google Scholar] [CrossRef] [PubMed]
- Sritippho, T.; Chotjumlong, P.; Iamaroon, A. Roles of Human Papillomaviruses and p16 in Oral Cancer. Asian Pac. J. Cancer Prev. 2015, 16, 6193–6200. [Google Scholar] [CrossRef] [PubMed] [Green Version]


| Parameters | Patients, n (%) |
|---|---|
| Gender | |
| Men | 56 (76.7) |
| Women | 17 (23.3) |
| Smoking | |
| Smokers | 49 (67.1) |
| Non-smokers | 24 (32.9) |
| Alcohol consumption | |
| Drinker | 46 (63) |
| Non-drinker | 27 (37) |
| HPV status | |
| HPV-positive | 18 (24.7) |
| HPV-negative | 47 (64.4) |
| No data | 8 (10.9) |
| Histological grading | |
| G1 (Well differentiated) | 15 (20.6) |
| G2 (Moderately differentiated) | 38 (52) |
| G3 (Poorly differentiated) | 20 (27.4) |
| T classification | |
| T1 | 12 (16.4) |
| T2 | 27 (37) |
| T3 | 24 (32.9) |
| T4 | 10 (13.7) |
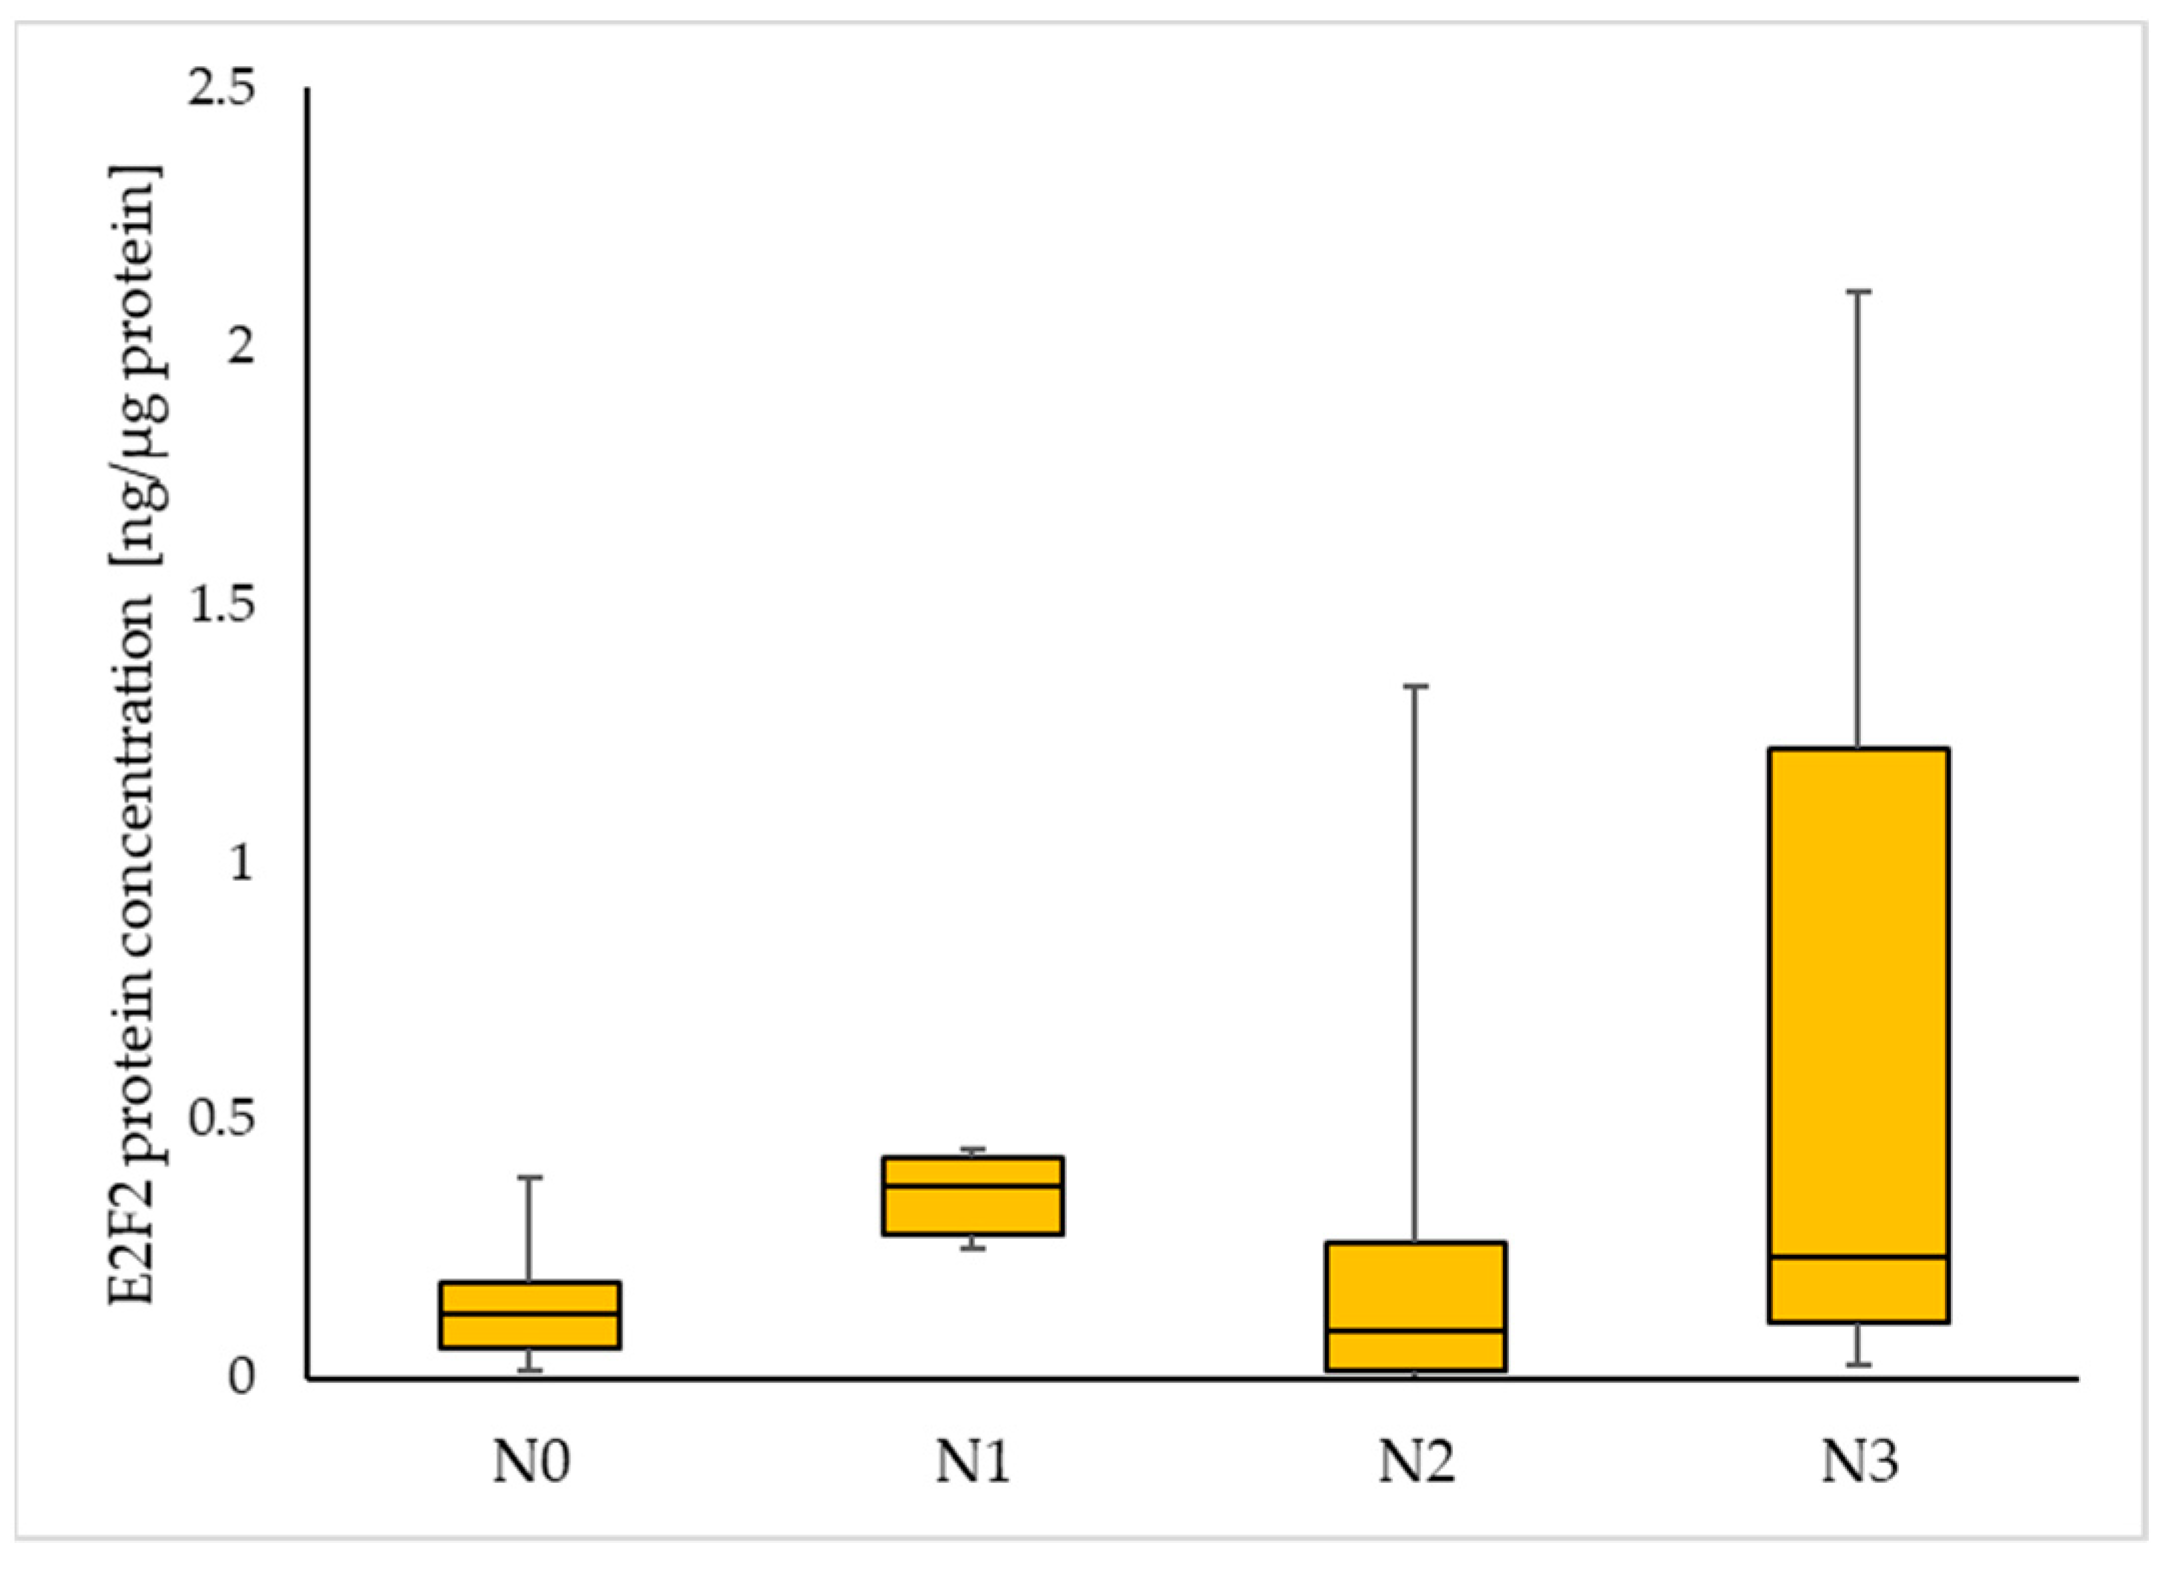
| Nodal status | |
| N0 | 36 (49.3) |
| N1 | 9 (12.3) |
| N2 | 22 (30.2) |
| N3 | 6 (8.2) |
| Protein Concentrations [ng/µg Protein] Me (Q1–Q3) | |||
|---|---|---|---|
| Tumour | Margin | p-Value | |
| E2F2 | 0.129 (0.056–0.247) | 0.082 (0.045–0.252) | 0.64 |
| MDM2 | 0.103 (0.033–0.215) | 0.049 (0.013–0.193 | 0.09 |
| p16 | 1.08 (0.714–1.51) | 0.859 (0.377–1.91) | 0.845 |
| Protein Concentrations [ng/µg Protein] Me (Q1–Q3) | ||||
|---|---|---|---|---|
| HPV-Positive | HPV-Negative | p-Value | ||
| E2F2 | Tumour | 0.056 (0.016–0.227) | 0.193 (0.107–0.330) | 0.03 |
| Margin | 0.079 (0.025–0.18) | 0.0845 (0.05–0.394) | 0.37 | |
| MDM2 | Tumour | 0.079 (0.033–0.254) | 0.104 (0.032–0.198) | 0.8 |
| Margin | 0.052 (0.01–0.149) | 0.049 (0.014–0.198) | 0.82 | |
| p16 | Tumour | 0.975 (0.379–1.576) | 1.094 (0.733–1.366) | 1.0 |
| Margin | 1.0205 (0.426–1.513) | 0.752 (0.376–2.193) | 1.0 | |
| Protein Concentrations [ng/µg Protein] Me (Q1–Q3) | ||||
|---|---|---|---|---|
| Smokers | Non-Smokers | p-Value | ||
| E2F2 | Tumour | 0.193 (0.065–0.365) | 0.12 (0.039–0.163) | 0.09 |
| Margin | 0.075 (0.039–0.191) | 0.132 (0.059–0.356) | 0.31 | |
| MDM2 | Tumour | 0.106 (0.035–0.234) | 0.079 (0.015–0.23) | 0.41 |
| Margin | 0.033 (0.012–0.114) | 0.15 (0.021–0.285) | 0.23 | |
| p16 | Tumour | 1.098 (0.716–1.687) | 1.094 (0.498–1.472) | 0.7 |
| Margin | 0.755 (0.386–1.404) | 1.652 (0.329–5.265) | 0.23 | |
| Drinkers | Non-drinkers | p-value | ||
| E2F2 | Tumour | 0.151 (0.062–0.249) | 0.125 (0.049–0.503) | 0.78 |
| Margin | 0.072 (0.028–0.249) | 0.12 (0.068–0.267) | 0.35 | |
| MDM2 | Tumour | 0.104 (0.0342–0.210) | 0.095 (0.019–0.237) | 0.62 |
| Margin | 0.033 (0.011–0.159) | 0.15 (0.036–0.322) | 0.08 | |
| p16 | Tumour | 0.967 (0.533–1.504) | 1.36 (1.072–2.548) | 0.09 |
| Margin | 0.737 (0.338–1.219) | 2.65 (0.867–5.89) | 0.01 | |
| Smokers and drinkers | Non-smokers and non-drinkers | p-value | ||
| E2F2 | Tumour | 0.177 (0.062–0.249) | 0.075 (0.031–0.122) | 0.05 |
| Margin | 0.083 (0.035–0.297) | 0.298 (0.128–0.376) | 0.12 | |
| MDM2 | Tumour | 0.104 (0.034–0.219) | 0.079 (0.010–0.30) | 0.6 |
| Margin | 0.02 (0.011–0.080) | 0.152 (0.025–0.357) | 0.08 | |
| p16 | Tumour | 0.975 (0.676–1.565) | 1.36 (1.153–1.51) | 0.29 |
| Margin | 0.745 (0.387–1.159) | 5.965 (1.50–11.854) | 0.01 | |
Disclaimer/Publisher’s Note: The statements, opinions and data contained in all publications are solely those of the individual author(s) and contributor(s) and not of MDPI and/or the editor(s). MDPI and/or the editor(s) disclaim responsibility for any injury to people or property resulting from any ideas, methods, instructions or products referred to in the content. |
© 2023 by the authors. Licensee MDPI, Basel, Switzerland. This article is an open access article distributed under the terms and conditions of the Creative Commons Attribution (CC BY) license (https://creativecommons.org/licenses/by/4.0/).
Share and Cite
Świętek, A.; Gołąbek, K.; Hudy, D.; Gaździcka, J.; Biernacki, K.; Miśkiewicz-Orczyk, K.; Zięba, N.; Misiołek, M.; Strzelczyk, J.K. The Potential Association between E2F2, MDM2 and p16 Protein Concentration and Selected Sociodemographic and Clinicopathological Characteristics of Patients with Oral Squamous Cell Carcinoma. Curr. Issues Mol. Biol. 2023, 45, 3268-3278. https://doi.org/10.3390/cimb45040213
Świętek A, Gołąbek K, Hudy D, Gaździcka J, Biernacki K, Miśkiewicz-Orczyk K, Zięba N, Misiołek M, Strzelczyk JK. The Potential Association between E2F2, MDM2 and p16 Protein Concentration and Selected Sociodemographic and Clinicopathological Characteristics of Patients with Oral Squamous Cell Carcinoma. Current Issues in Molecular Biology. 2023; 45(4):3268-3278. https://doi.org/10.3390/cimb45040213
Chicago/Turabian StyleŚwiętek, Agata, Karolina Gołąbek, Dorota Hudy, Jadwiga Gaździcka, Krzysztof Biernacki, Katarzyna Miśkiewicz-Orczyk, Natalia Zięba, Maciej Misiołek, and Joanna Katarzyna Strzelczyk. 2023. "The Potential Association between E2F2, MDM2 and p16 Protein Concentration and Selected Sociodemographic and Clinicopathological Characteristics of Patients with Oral Squamous Cell Carcinoma" Current Issues in Molecular Biology 45, no. 4: 3268-3278. https://doi.org/10.3390/cimb45040213