Article

Surface-Enhanced Raman Spectroscopy Using a Silver Nanostar Substrate for Neonicotinoid Pesticides Detection

by
Norhayati Abu Bakar
1,2,*,
Marco Fronzi
3 and
Joseph George Shapter
1,*
1
Australian Institute for Bioengineering and Nanotechnology, University of Queensland, St. Lucia, Brisbane, QLD 4072, Australia
2
Institute of Microengineering and Nanoelectronic, Universiti Kebangsaan Malaysia, UKM Bangi, Selangor 43600, Malaysia
3
School of Chemical and Biomedical Engineering, University of Melbourne, Parkville, VIC 3010, Australia
*
Authors to whom correspondence should be addressed.
Sensors 2024, 24(2), 373; https://doi.org/10.3390/s24020373
Submission received: 5 December 2023 / Revised: 4 January 2024 / Accepted: 6 January 2024 / Published: 8 January 2024
(This article belongs to the Special Issue Optical Sensors for Industry Applications)

Abstract

:
Surface-enhanced Raman spectroscopy (SERS) has been introduced to detect pesticides at low concentrations and in complex matrices to help developing countries monitor pesticides to keep their concentrations at safe levels in food and the environment. SERS is a surface-sensitive technique that enhances the Raman signal of molecules absorbed on metal nanostructure surfaces and provides vibrational information for sample identification and quantitation. In this work, we report the use of silver nanostars (AgNs) as SERS-active elements to detect four neonicotinoid pesticides (thiacloprid, imidacloprid, thiamethoxam and nitenpyram). The SERS substrates were prepared with multiple depositions of the nanostars using a self-assembly approach to give a dense coverage of the AgNs on a glass surface, which ultimately increased the availability of the spikes needed for SERS activity. The SERS substrates developed in this work show very high sensitivity and excellent reproducibility. Our research opens an avenue for the development of portable, field-based pesticide sensors, which will be critical for the effective monitoring of these important but potentially dangerous chemicals.

1. Introduction

Neonicotinoid pesticides, such as clothianidin, imidacloprid and thiamethoxam, have been restricted in the European Union but remain in use worldwide in the agricultural sector to meet the demands of population growth, urbanisation and market integration. Other neonicotinoid types commonly used to control pests are thiacloprid, dinotefuran, acetamiprid and sulfoxaflor. The demand for neonicotinoid pesticides for crop protection represents almost one-third of the global insecticide market due to their high insecticidal efficiency [1]. To control pests and reduce disease pressure on crops, the use of these pesticides as seed coatings in flowering crops is a widespread practice that can reduce overspray and spray drift. However, the pesticides used to treat the seeds can potentially be absorbed and spread through the tissue and reach pollen and nectars [2]. Then, insect pollinators such as honeybees and wild bees are exposed to the pesticides and bring them to their colonies [3]. The European Union announced a ban on the use of these chemicals after assessment studies from the European Food Safety Authority (EFSA) showed the negative effects of neonicotinoids on insect pollinators, including multiple responses on learning, memory performance and the feeding activity of bee species [4].
Neonicotinoid pesticides have similar chemical structures to nicotine and permanently bind with high infinity to nicotinic acetylcholine receptors in the insect central nervous system [5]. The active substances are neurotoxic and can overstimulate and disrupt the learning and memory behaviour of insect pollinators, resulting in brain damage. These negative impacts on the insect pollinators means they do not interact with crops as expected, affecting the yield and quality of the agricultural products, nutrient content and shelf life. Consequently, the decreasing value of pollinators’ services to agricultural systems leads to big effects on ecosystems and the world economy. Human and environmental exposure to the pesticides through release into the air, diffusion into water and relocation from seed to root, plant and nectar can mean that the pesticides linger for decades in the food chain, animals, humans and the environment. The impact of neonicotinoid pesticides on human health was investigated by Zhang’s group who reported neonicotinoid pesticide residue can be absorbed by the human body through surface water [6]. This can lead to memory loss, finger tremors, headaches, coughs, general fatigue and abdominal pain, as reported by Taira et al., who studied the neonicotinoid exposure in urine samples [7]. Hence, neonicotinoids are compounds of great concern because the active ingredients are systemic, persistent and have high solubility. Therefore, consistent monitoring and rigorous testing of pesticide residue are critical in all countries, especially developing countries.
Effective methods to detect the presence of pesticide residue in food and drinking water has been introduced owing to the increasing public awareness and government concern regarding pesticides’ impact on food security and human health. Tremendous techniques have been established for pesticide monitoring, such as liquid chromatography-mass spectroscopy (LC-MS), gas chromatography–mass spectroscopy (GC-MS), enzyme-linked immunoabsorbent assays and capillary electrophoresis. The Rawat group detected imidacloprid, clothianidin, acetamprid and thiamethoxam in vegetables with a limit of the detection (LOD) at 0.5 µg/mL using high-performance liquid chromatography (HPLC) fitted with a UV-Vis detector [8]. The detection of thiacloprid with an LOD as low as 0.003 ng/mL using a time-resolved fluorescent microsphereimmunochromatographic test strip was reported by the Xu group by using recombinant antibodies [9]. Capillary electrophoresis methods with tandem mass spectroscopy were studied by Carbonell-Rozas’ group for the detection of nine neonicotinoid pesticides with an LOD as low as 1.25 × 10⁻⁵ g/mL [10]. Generally, these techniques have high sensitivity and are established as a major tool for pesticide identification and qualification. But these analytical techniques are laborious and time consuming, costly, require sophisticated instruments and experienced staff. Many developing countries cannot afford the expensive instruments or do not own sufficient instruments for the monitoring of pesticide residue in food or the environment. In contrast, surface-enhanced Raman spectroscopy (SERS) offers faster analysis time, simpler protocols, low-cost operations and a field-deployable methodology for the identification and qualification of pesticide contamination. Several handheld Raman instruments are available from companies, such as Agilent Technologies, Bruker, Metrohm and Thermo Scientific, for the detection of low concentrations of materials typically in forensic situations. The production of commercial SERS substrates as ultrasensitive detectors as a sensing platform was developed by Nanova Inc. (Columbia, MO, USA), Hamamatsu Photonics (Hamamatsu city, Japan) and Renishaw Diagnostics (Glasgow, UK). However, this work seeks to establish an ultrasensitive detector that will allow the cheap, efficient, reliable mass production of sensing platforms, which would find applications in the detection of a wide range of toxins and other harmful chemicals. The outcomes will be precursors to significant steps towards the production of commercial sensors, which would help developing countries monitor a variety of environmentally harmful chemical species.
The discovery of Raman signal enhancement has opened the door for the first monitoring of single molecules in bioanalytics [11] and pesticides using surface-enhanced Raman spectroscopy (SERS) by simply adsorbing organophosphorus pesticides on a silver surface as a SERS-active substrate [12]. Many publications have shown that the SERS effect is a powerful tool for the identification and qualification of pesticide contamination on the basis of their unique vibrational characteristics [13,14,15]. SERS is a highly sensitive technique that enhances the Raman intensities of molecules more than after adsorption on plasmonic nanostructured surfaces [16,17]. Subsequently, SERS has been continuously used to identify pesticide contaminations in aqueous systems [18] and in seawater [19].
In previous work, we synthesized star-shaped silver nanostructures and fabricated SERS substrates to use SERS enhancement of the Raman signal to detect the neonicotinoid imidacloprid. We studied the best distribution of silver nanostars (AgNs) on glass surfaces by varying the number of layers of AgNs thin films. These SERS substrates are promising for use in the field because detection without complex sample preparation is critical for real-world use in analytical facilities or more importantly in the field. Critically, it is important that such a sensor is sensitive to many different pesticides. The residue of the four pesticides tested in this work has become a global issue as their residues have been found in a variety of food products and environmental samples. Many countries have detected the residue of these pesticides in soil [20], water [6] and food products [21]. In the current work, we studied the four neonicotinoid pesticides on AgNs thin films. The pesticides were deposited on the AgNs surface by a drop-casting technique to observe the sensitivity and reproducibility of SERS substrates towards the neonicotinoid pesticides. This AgNs substrate was found to be a good SERS-active substrate for all the molecules, giving large SERS enhancements and excellent reproducibility with a low relative standard derivation of SERS intensity.

2. Materials and Methods

2.1. Materials

The four neonicotinoid pesticides used for the SERS measurements were imidacloprid-pestanal, (Analytical standard, Sigma-Aldrich (Sydney, Australia)), thiamethoxam-pestanal, (Analytical standard, Sigma-Aldrich (Sydney, Australia)), thiacloprid-pestanal (Analytical standard, Sigma-Aldrich (Sydney, Australia)) and nitenpyram-pestanal, (Analytical standard, Sigma-Aldrich (Sydney, Australia)). The solvent for preparing the pesticide solutions was methanol (Analytical Reagent Grade, Chem-Supply Pty Ltd (Adelaide, Australia)) and deionized water. The chemicals for the preparation of silver nanostars (AgNs) are silver nitrate (≥99.0%, Sigma Aldrich (Sydney, Australia)), sodium hydroxide (≥98.0%, Chem-Supply Pty Ltd (Adelaide, Australia)), hydroxylamine 50 wt. % in water (Sigma Aldrich, Sydney, Australia) and trisodium citrate dehydrate (≥99.0%, Sigma Aldrich (Sydney, Australia)). Toluene, (Analytical Reagent Grade, Chem-Supply Pty Ltd, (Adelaide, Australia)) and n,n-dimethylformamide (≥99.8%, Sigma Aldrich (Sydney, Australia)) were used for the fabrication of monolayer AgNs films. These chemicals were used as received without any further purification.

2.2. Methodology

The synthesis of the colloidal silver nanostars (AgNs) and the fabrication of the silver nanostars film were described in our previous article [22]. Colloidal AgNs was prepared by a chemical reduction technique by mixing 2.0 mL of 6.0 × 10⁻² M hydroxylamine into 2.0 mL of 5 × 10⁻² M sodium hydroxide. This mixture was stirred, and the solution colour changed to dark grey after adding 9.0 mL of 1 × 10⁻³ M silver nitrate and 0.1 mL of 1% w/v trisodium citrate dehydrate into the solution. The colloidal suspension was centrifuged at 6000 rpm for 15 min. The pellet was collected and further used for the fabrication of SERS substrates. AgNs SERS substrates were prepared on glass surfaces using a self-assembly technique. The monolayer AgNs film was prepared by mixing 12.0 mL colloidal AgNs and 6.0 mL toluene to obtain the water–oil interface. The monolayer AgNs films were transferred onto the solid substrate by placing the silicon or glass substrate surface under the formed monolayer solution and the substrate was further dried at 60 °C for 1 h in an oven. This process was repeated multiple times to prepare 10 layers of AgNs films on the substrate surfaces.
Neonicotinoid pesticide solutions were prepared at 1 mg/mL concentration by dissolving 1 mg of the pesticides in 0.5 mL of methanol. The mixture was placed in an ultrasonic bath to dissolve the solid. After that, the pesticide solution was added to 0.5 mL of deionized water. This 1 mg/mL pesticide solution was used as the stock solution to prepare seven concentrations, namely 1 × 100, 1 × 10⁻¹, 1 × 10⁻², 1 × 10⁻³, 1 × 10⁻⁴, 1 × 10⁻⁵ and 1 × 10⁻⁶ mg/mL. These various concentrations were prepared by diluting 1 mg/mL of pesticide solutions with the appropriate amount of deionized water. For SERS measurements, the pesticide was dropped and dried on the AgNs surface and bare-glass surface.
The SERS measurements were performed using a Renishaw model InVia micro Raman spectrometer with 785 nm wavelength diode laser. The Raman spectra of the pesticide powders on glass slides were recorded using a 50× objective at 100% of the 167 mW power laser with 5-second integration time for reference spectra. The SERS spectra of the pesticides on the silver nanostars surface were collected using a 50x objective at 1% of the 167 mW power laser with 5-second integration time. SERS sensor properties such as sensitivity and reproducibility towards the pesticide detection were observed in this work. The reusability and stability of the SERS substrate were reported in a previous article [22].

2.3. Computional Model
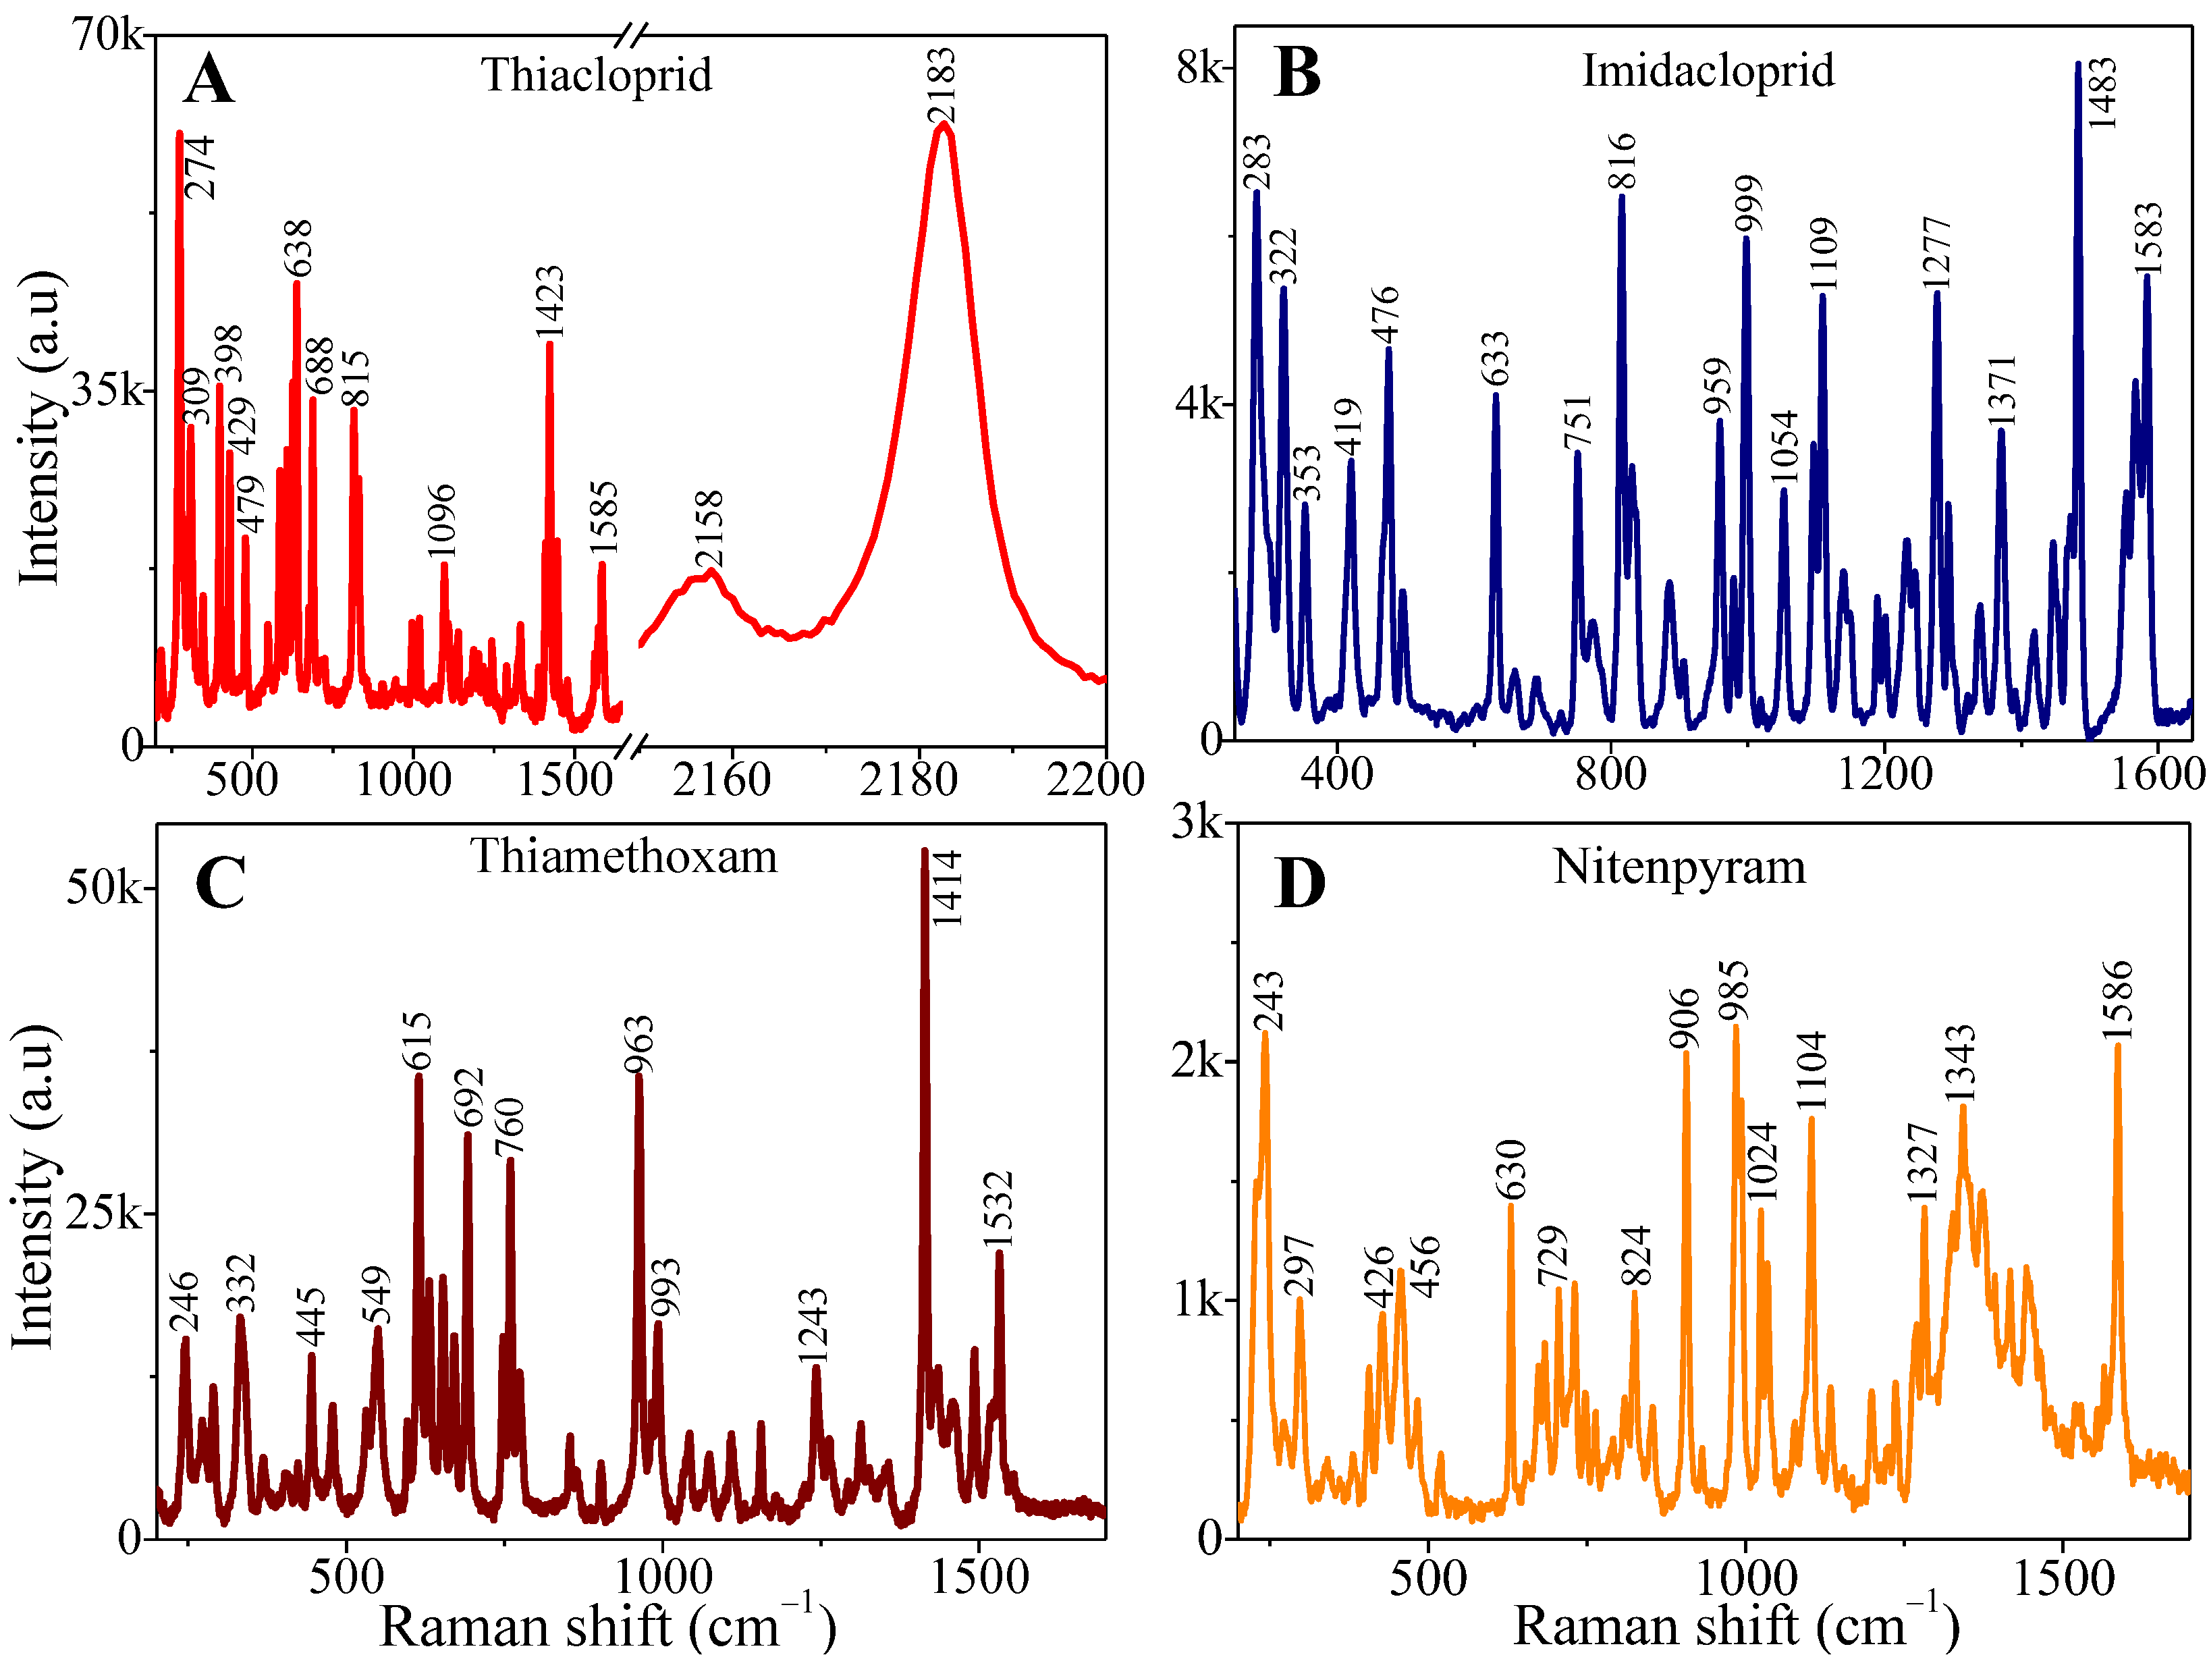
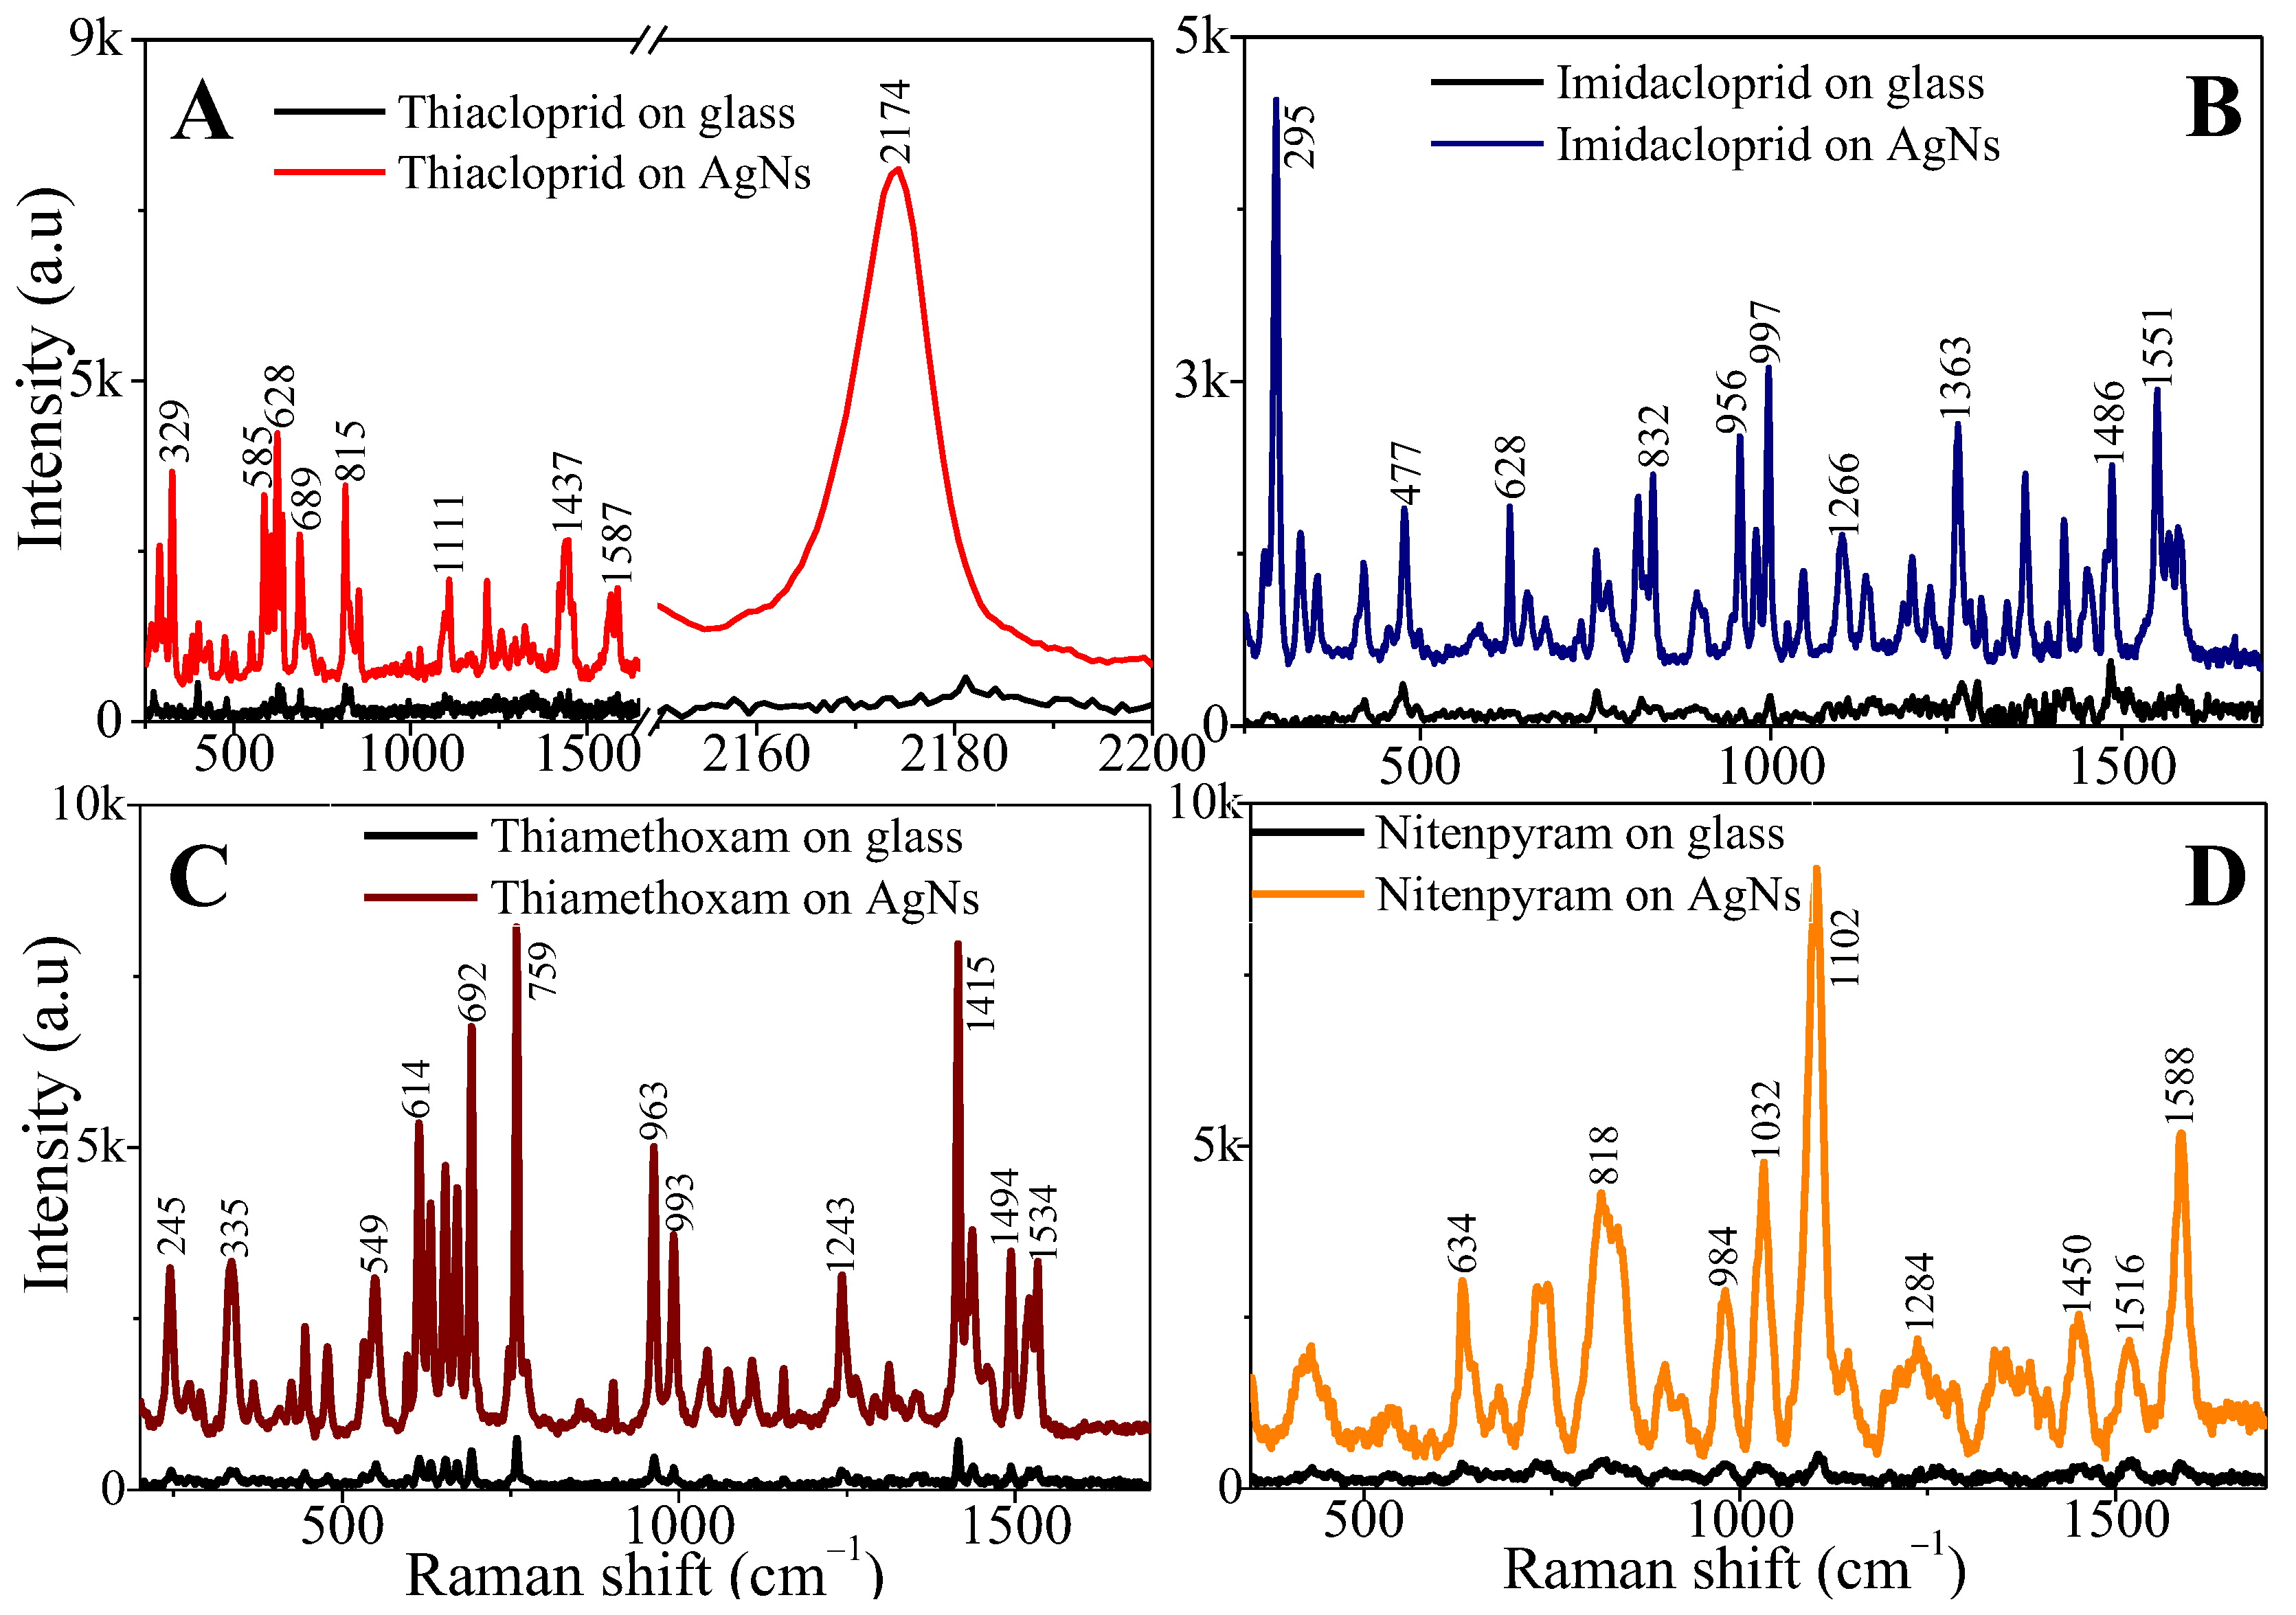
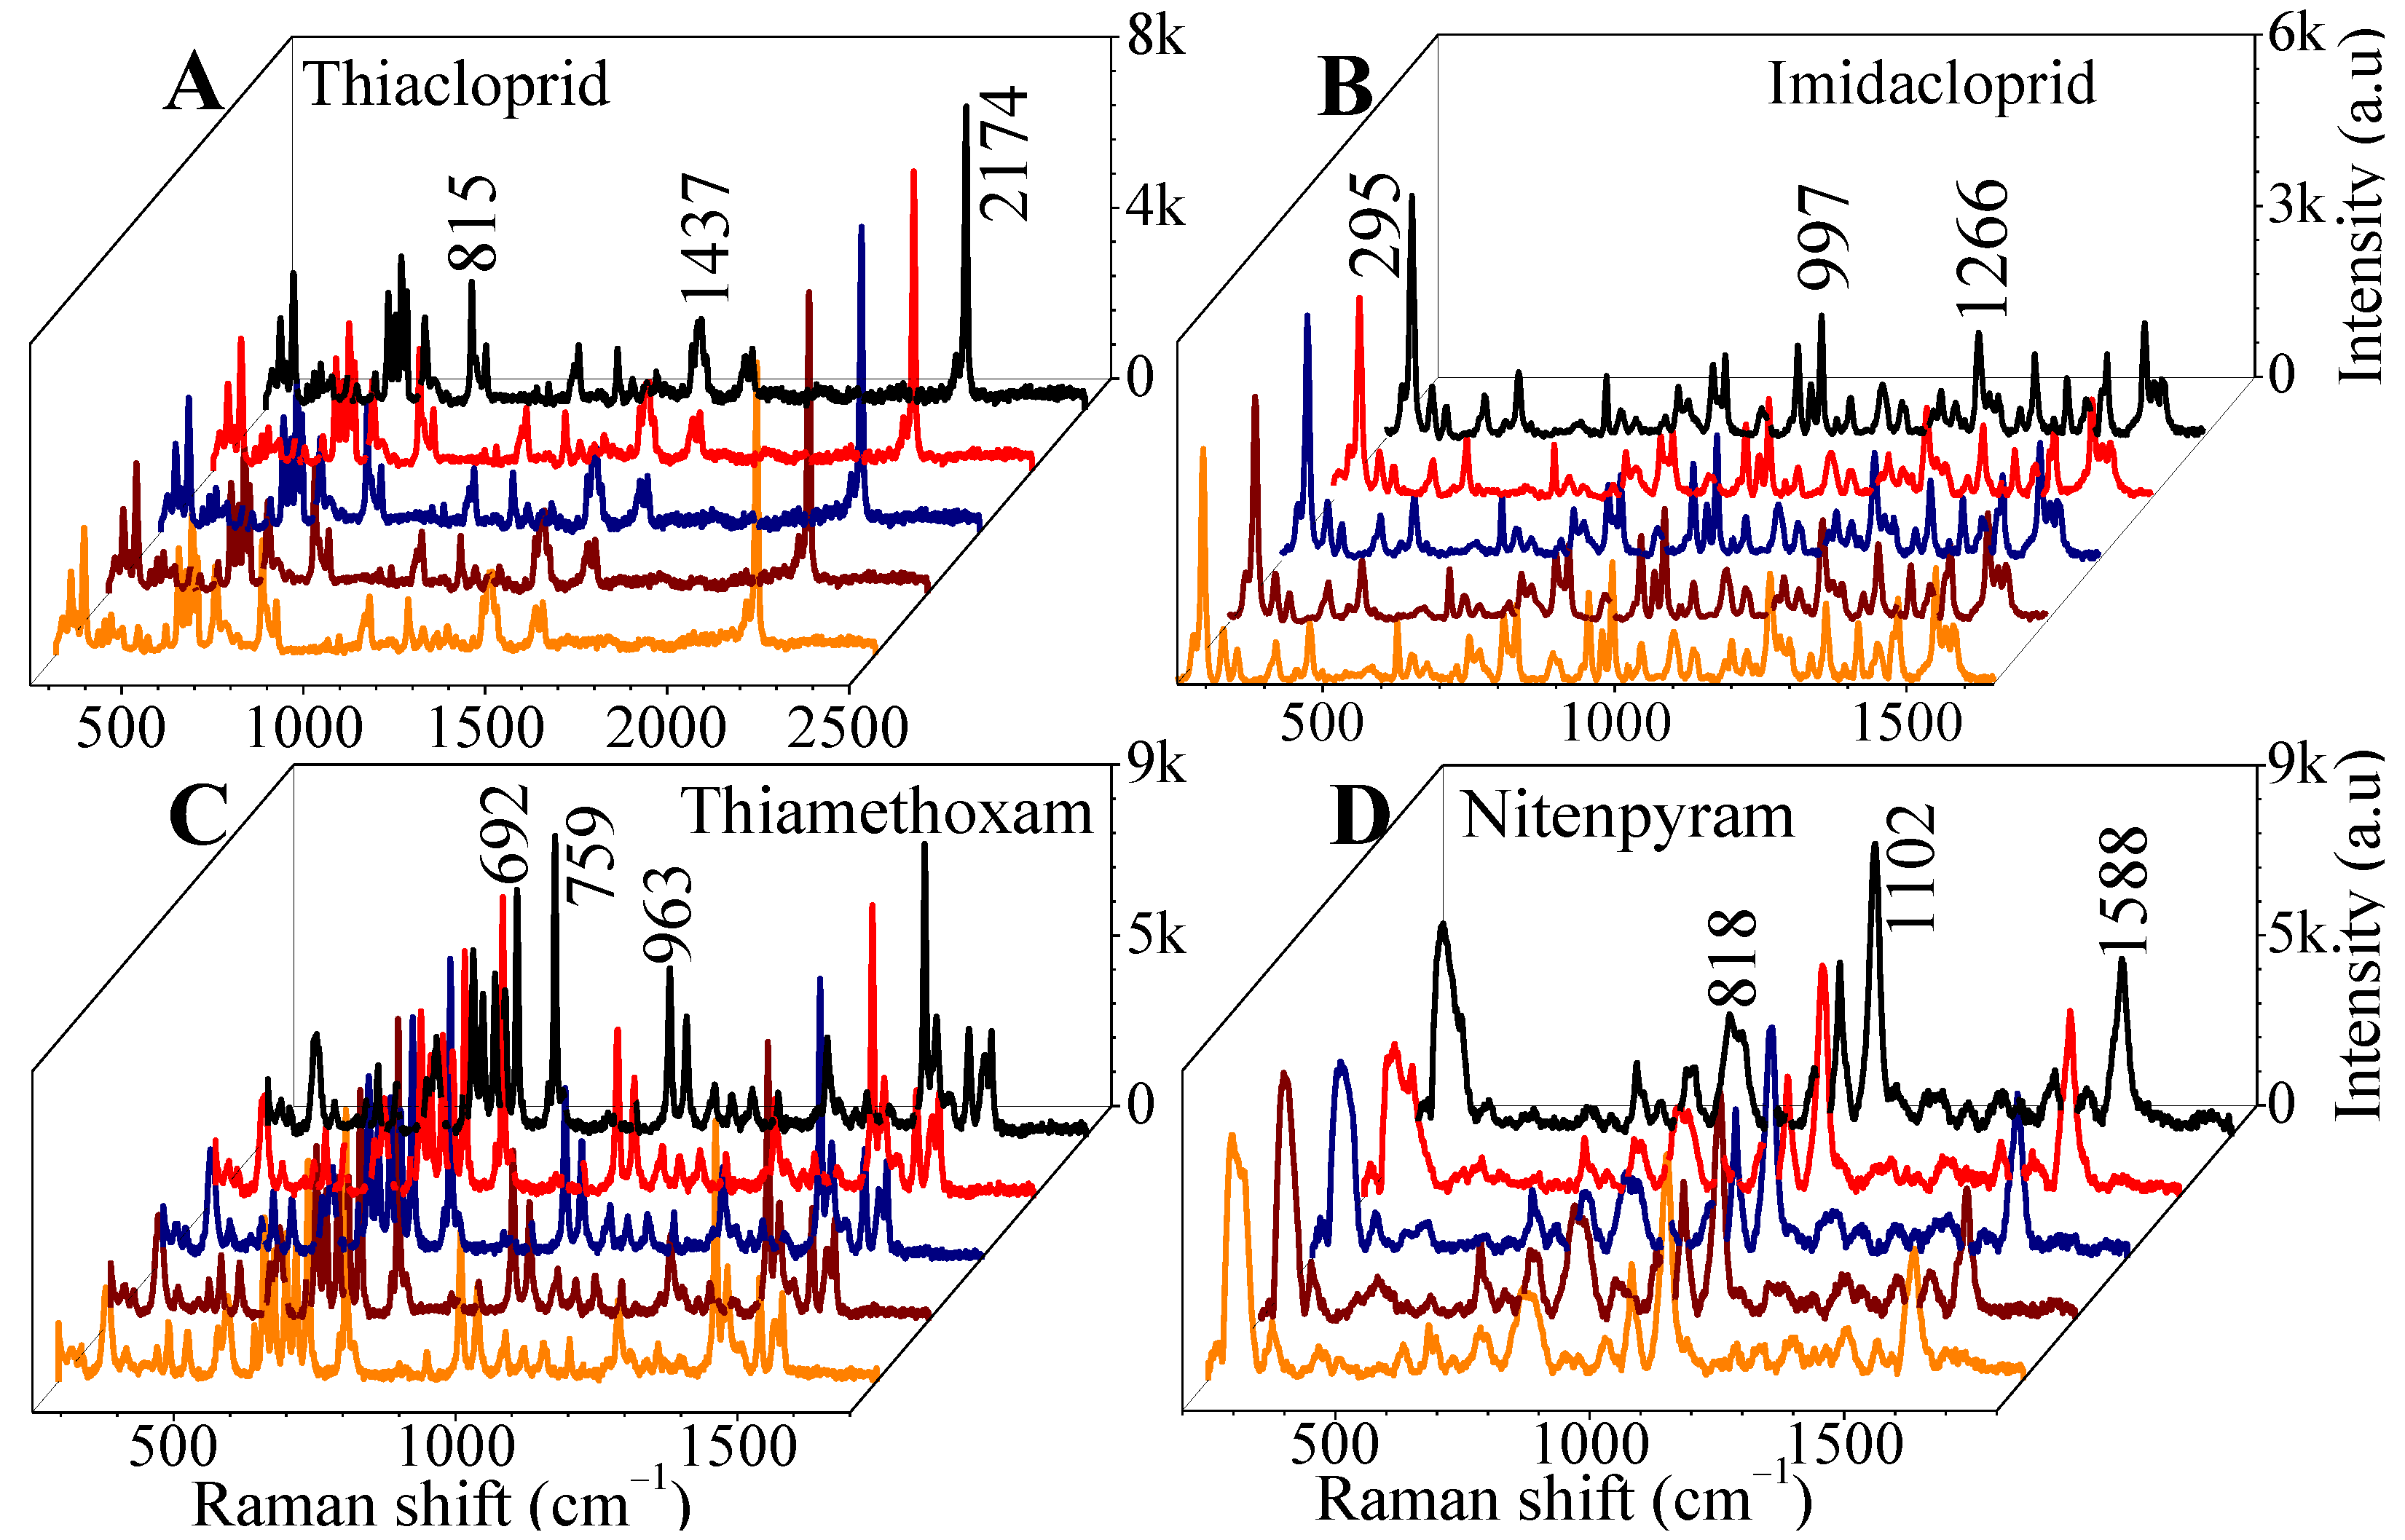
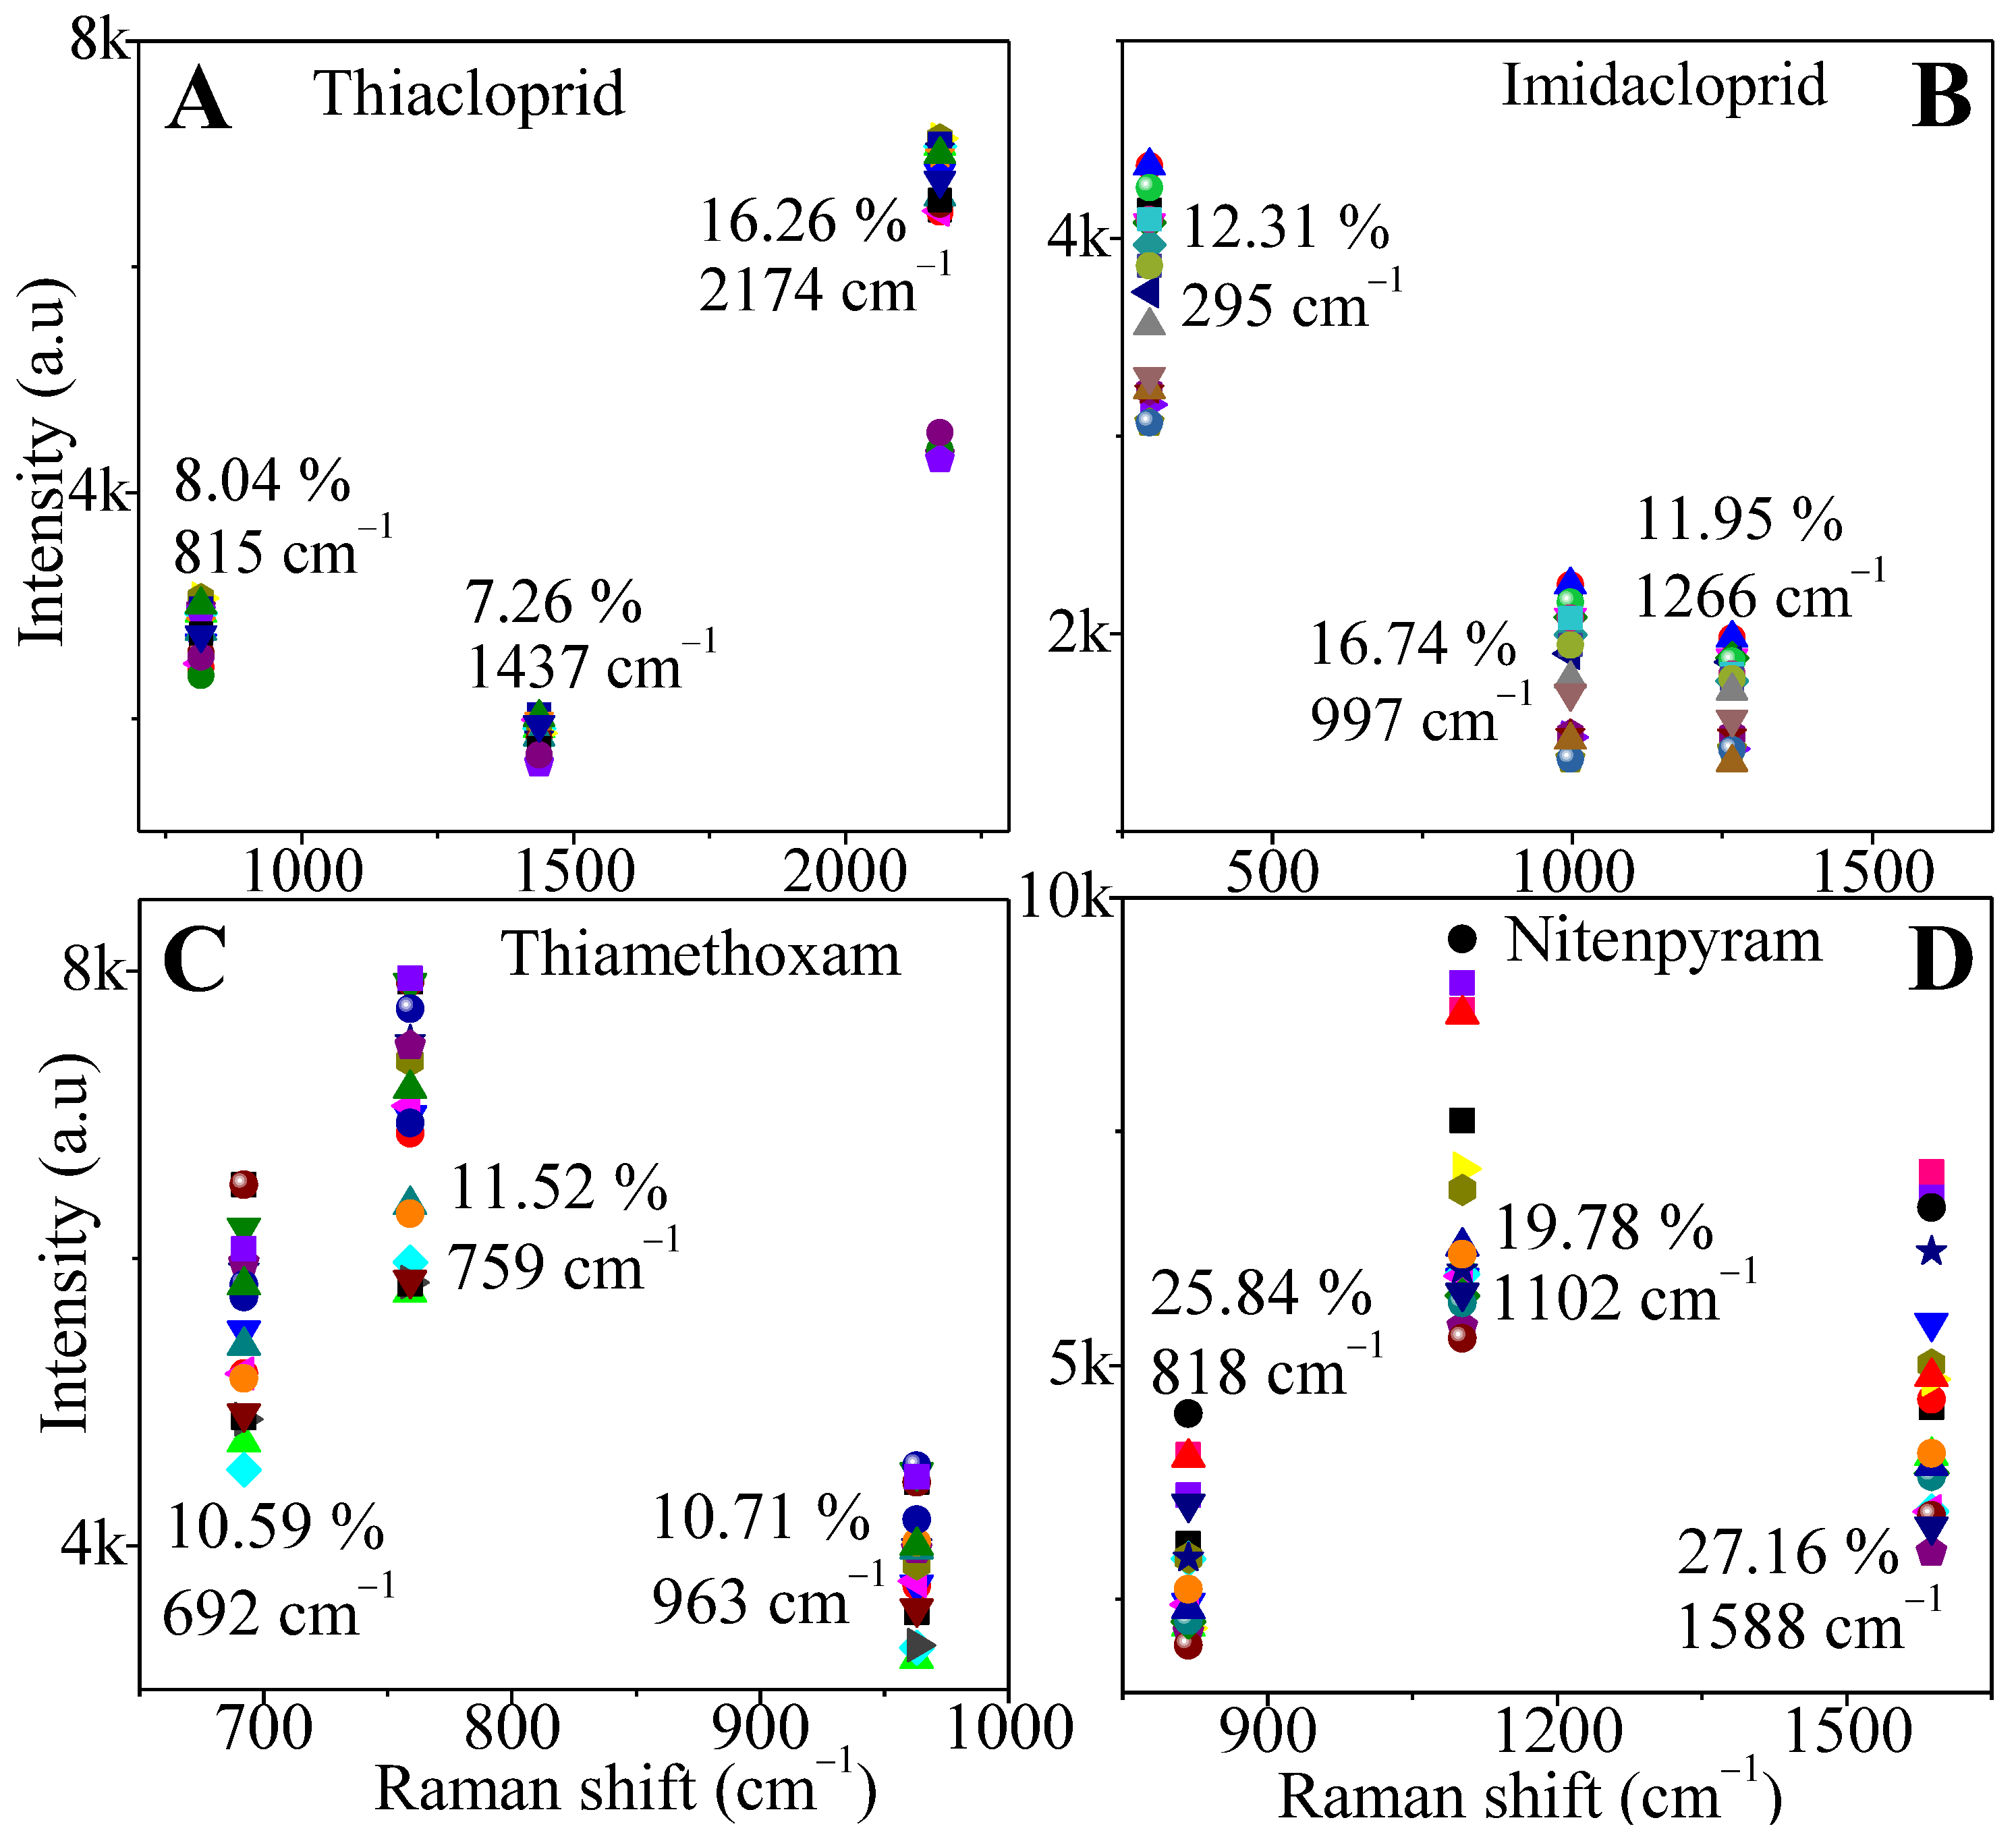
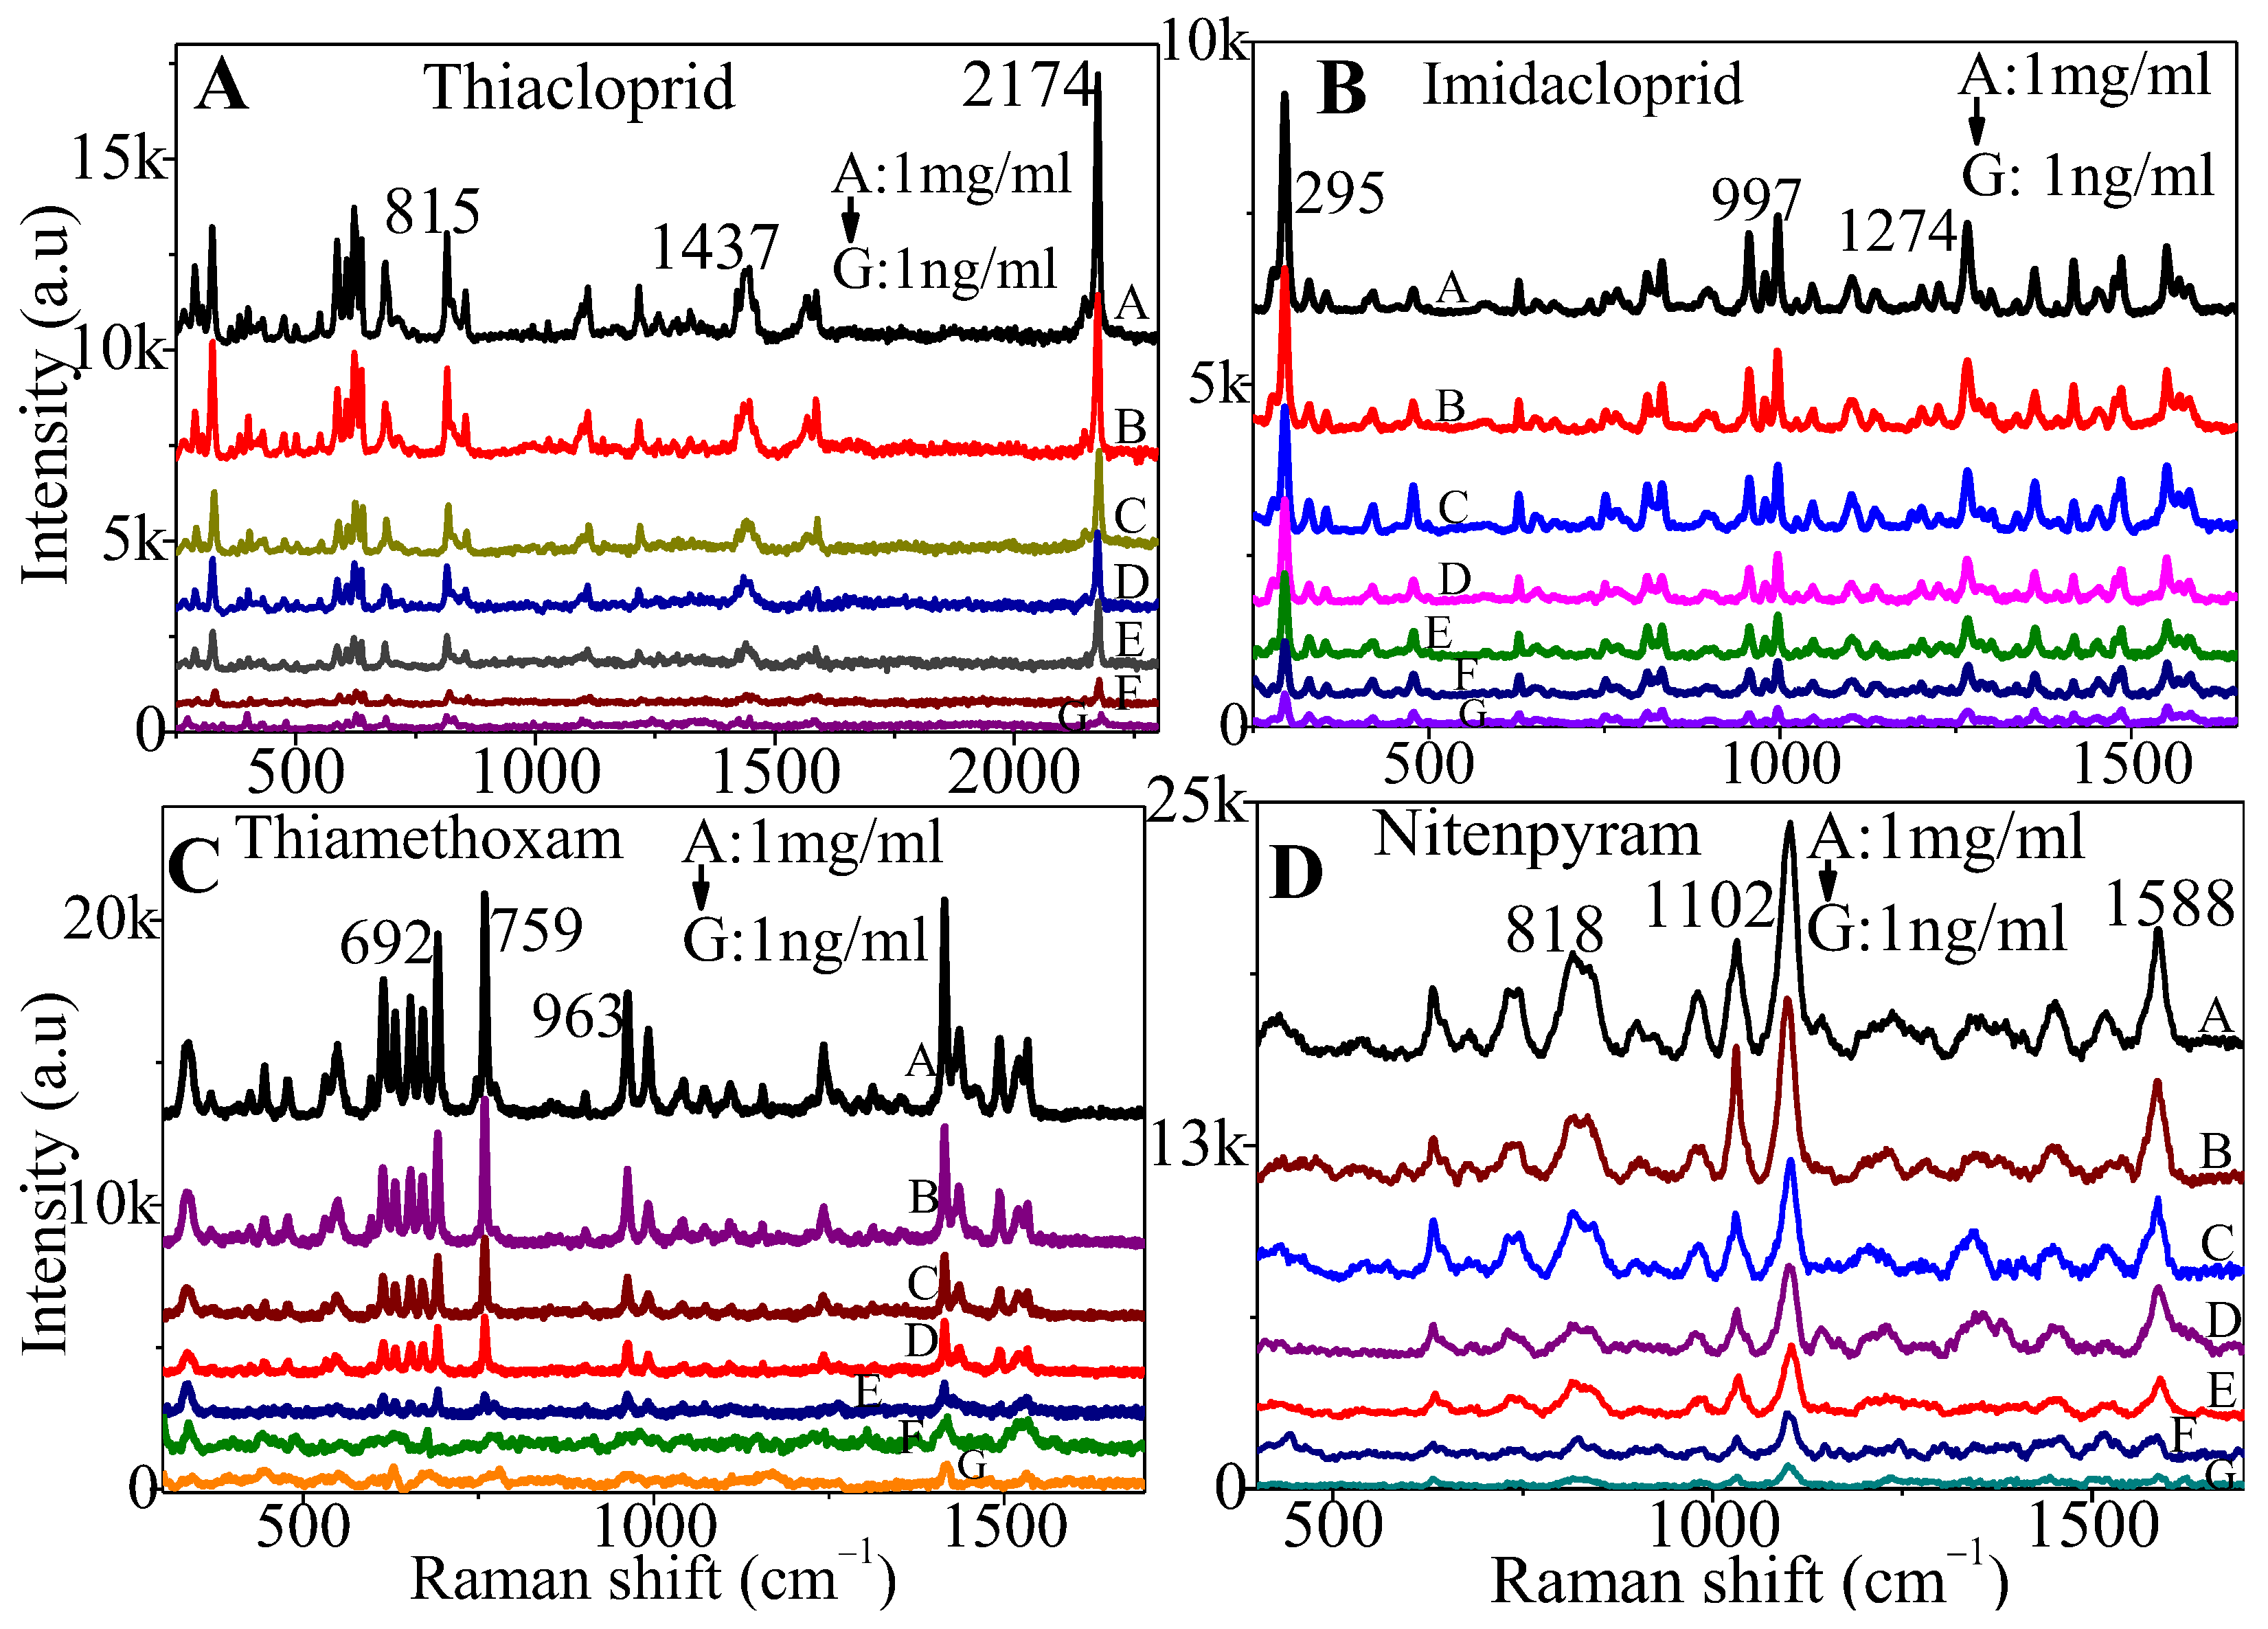
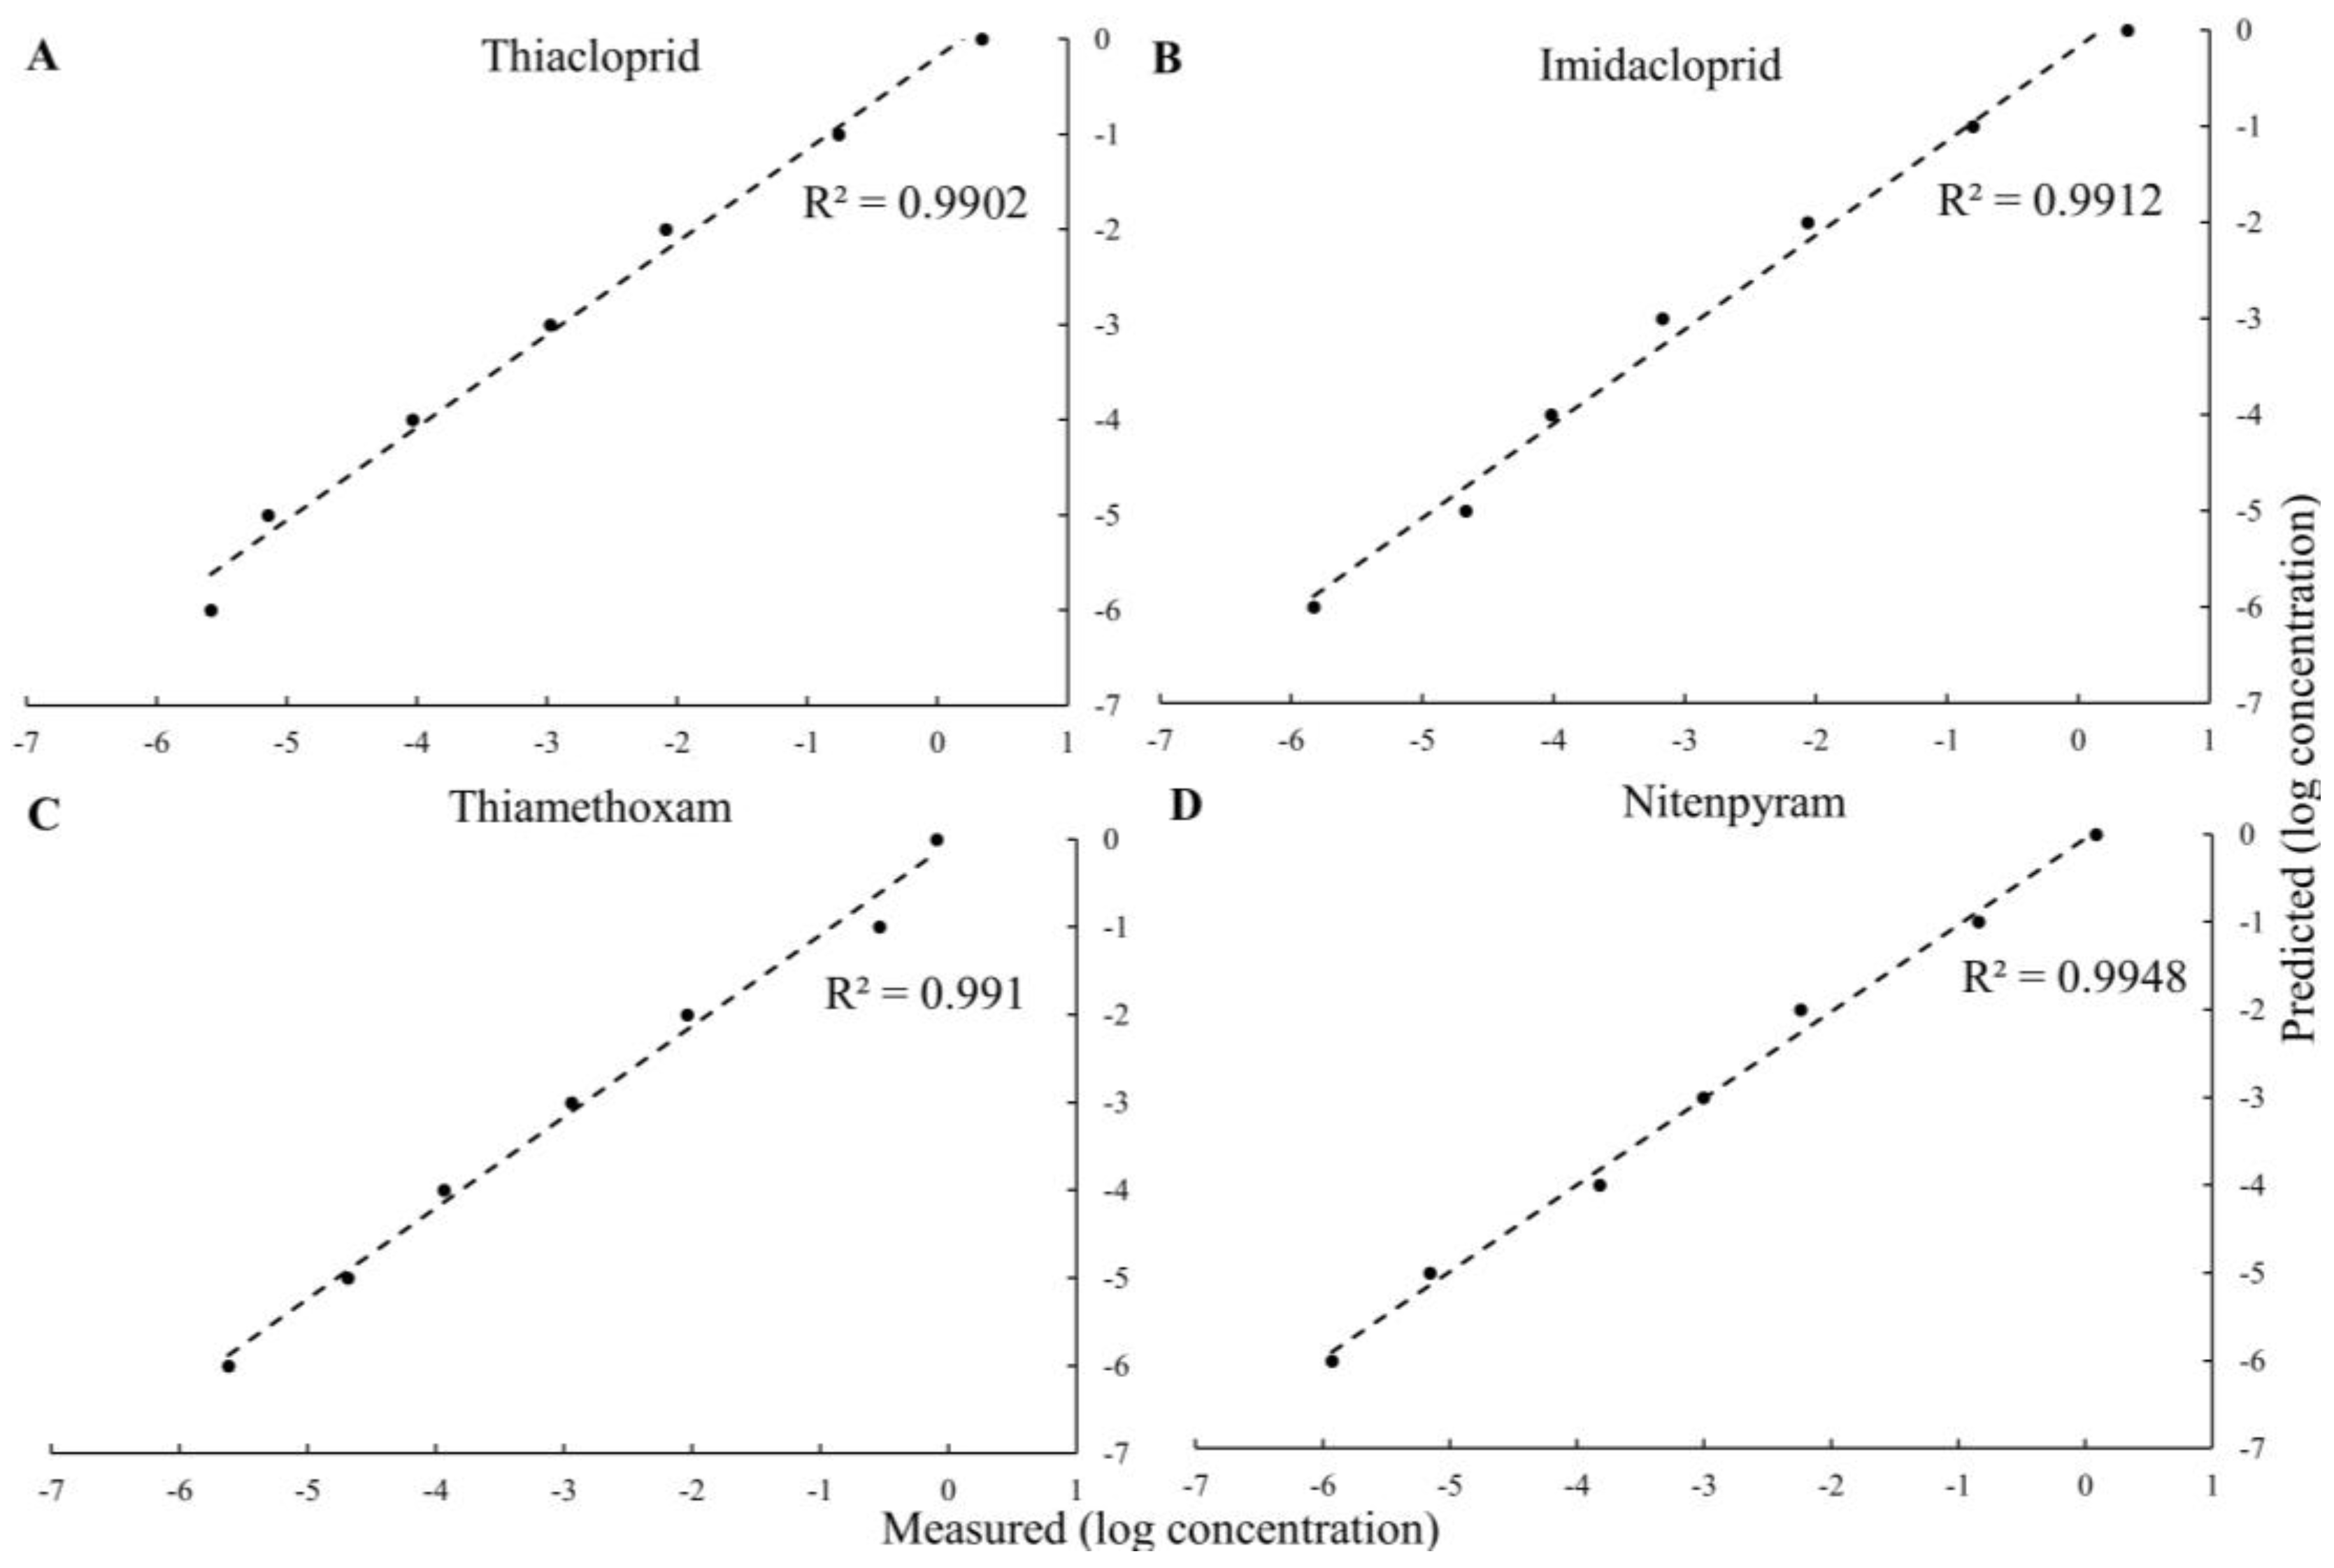
Partial Least Squares (PLS) regression was used to perform multivariate analysis on spectroscopic data. Python codes using the libraries numpy, scikit-learn and scipy were used for SG filtering and PLS regression. The SG filtering was implemented using the savgol_filter function from the scipy.signal module. PLS regression was carried out using the PLSRegression class from the sklearn.cross decomposition module while cross-validation predictions were made using the cross_val_predict function from sklearn.model selection.
A Savitzky–Golay filter was applied to smooth the spectra and calculate the first derivative of the spectra, which is used in the analysis. The optimal number of PLS components and the relevant wavelengths are determined by optimising the R2 and mean square error of cross-validated data. To improve the performance of the model, the values of the concentrations were transformed using the logarithm function, which helps to linearize the relationship between the predictor variables (spectra), and the response variable (concentration) reduces the effect of outliers and spreads the values out more evenly across the range of possible values. This improves the stabilization of the response variable and makes the model more sensitive to small changes at low concentrations. The regression graphs were plotted using Microsoft Excel 2010.

3. Results

In this report, we used a AgNs substrate prepared through 10 subsequential layer depositions of silver nanostars (AgNs) on a glass surface as the SERS substrate, as described in our previous article [22]. To comprehensively study the SERS performance for various neonicotinoid pesticides on the SERS substrates, we collected the Raman spectra of neonicotinoid pesticide powders for the reference of neonicotinoid characteristic peaks. Figure 1A–D show the Raman spectra of four neonicotinoid pesticide powders, namely thiacloprid, imidacloprid, thiamethoxam and nitenpyram. The characteristic Raman peaks for each pesticide were obvious. The chemical structures of these pesticides are attached in the SI, Figure S1.
The sensitivity of the SERS substrate was studied by observing the Raman spectrum of the pesticides on a glass surface and on the AgNs surface using the same solution concentration for the drop casting and same laser configuration but 100-times less power for the experiments on the SERS substrates. Figure 2A–D display the Raman spectra of the pesticides on the glass surface and on the AgNs surface at a concentration of 1 mg/mL. Based on the SERS spectra, the characteristic peaks of the pesticides on the AgNs surface match those observed for the pesticides on the glass surface. The observed characteristic peaks of the absorbed pesticides on silver nanostars are in good agreement with the observed characteristic peaks of pesticide powders. The details of the characteristic peaks for the pesticide powder, on glass surface and on AgNs, are discussed in the SI, Tables S1–S4. The intensity of the characteristic peaks of these pesticides at 1 mg/mL was clearly enhanced after the absorption of the pesticides on the silver surface compared to the low Raman intensity of the pesticides on bare glass surfaces at 1 mg/mL. To calculate the Enhancement Factor (EF) of SERS performance, some of the highest peaks at 2174 cm−1, 295 cm−1, 759 cm−1 and 1102 cm−1 were chosen for thiacloprid, imidacloprid, thiamethoxam and nitenpyram, respectively. The calculated EFs for thiacloprid, imidacloprid, thiamethoxam and nitenpyram detection were 3.61 × 10⁵, 2.86 × 10⁴, 9.53 × 10⁴ and 2.40 × 10⁵, respectively. There are a few EF formulae for EF calculations and, here, we chose the Analytical Enhancement Factor approach, as described by Ru et al.’s group [23]. These EF values were calculated using Formula (1).
E F = I S E R S / N S E R S I R a m a n / N R a m a n
where IRaman: intensity of non-SERS; ISERS: intensity of SERS; NRaman: average number of molecule for non-SERS that contributed the signal; and NSERS: average number of molecule for SERS that contributed the signal.
SERS enhancement happens through two mechanisms, namely an electromagnetic (EM) mechanism and a chemical (CM) mechanism [16,24,25]. The EM mechanism is generally observed on substrates rich in free electrons that can generate localized surface plasmon resonance (LSPR) upon excitation [26]. The CM mechanism can have three possible origins in a metal–molecule system, namely interfacial ground-state charge transfer, photoinduced charge transfer resonance and the electronic excitation resonance within the molecule itself [27]. In our experiments, the laser wavelength is 1.58 eV, while the pesticides examined have energy gaps ranging from 2.084 to 7.94 eV; thus, resonance Raman of the molecule itself is not possible [28]. The Fermi level of silver nanoparticles is generally about −4.26 eV [29], meaning that in all cases, the energy of the LUMO is higher than the Fermi level of AgNs, while the energy level of the HOMO is below the Fermi level. As shown in Table 1, the gaps between the levels for each molecule and the Ag Fermi level vary dramatically but, in all cases, significant SERS enhancement is observed. The large gaps between the LUMOs and the Fermi level mean that a photoinduced charge transfer resonance mechanism is unlikely [29]. Thus, this means that the most likely SERS enhancement mechanism is a combination of electromagnetic enhancement due to surface plasmon excitation in the metal nanoparticles [30] and interfacial ground-state charge transfer. These ground state interactions change the polarizability of the metal–molecule complex, leading to higher Raman cross-sections. Importantly, despite a range of HOMO energy levels of over 2.5 eV, the SERS substrate gives high enhancements for all the pesticides, highlighting the wide applicability of this approach to detect many species of environmental concern.
The detection reproducibility of the SERS substrate for the four pesticides was tested by collecting the SERS spectra of pesticides at 20 different spots on the same sample surface. Five spectra of five different spots for each of the four pesticides are plotted in Figure 3A–D. However, the full SERS spectra of 20 different spots for four pesticides on AgNs surfaces are provided in the SI, Figure S2. The three highest-intensity characteristic peaks for each pesticide were chosen to calculate the relative standard derivation (RSD) and observe the uniformity field enhancement of the SERS substrate.
Figure 4A–D show the SERS intensity versus Raman shift for the three highest-intensity characteristic peaks of the pesticides on the AgNs surface at 1 mg/mL concentration. Based on the RSD results, the AgNs created good local field enhancements for the SERS detection of these pesticides by showing major uniform enhancement. The absorption of pesticides on the uniform surface coverage of the silver nanostars clusters with their many spikes yields good SERS reproducibility. The calculated RSD for the four pesticides is as low as 7.26%, and the highest is 27.16%. The SERS substrate showed good reproducibility for thiacloprid detection and the low reproducibility for the nitenpyram detection.
We further studied the limit of detection of the SERS substrate for these pesticides. Figure 5A–D plot the SERS spectra for different concentrations, ranging from 1 ng/mL to 1 mg/mL of the four pesticides on the AgNs surface. We found that, as expected, a decreasing pesticide concentration gave decreasing SERS intensities. The characteristic peaks of these pesticides at lowest concentration on the AgNs surface are still observable. Using a signal-to-noise ratio of 2 to 1, the limits of detection (LOD) for thiacloprid, imidacloprid, thiamethoxam and nitenpyram were determined and found to be 1.72 × 10⁻⁶ mg/mL, 9.4 × 10⁻⁸ mg/mL, 4.83 × 10⁻⁶ mg/mL and 7.65 × 10⁻⁷ mg/mL, respectively, on the AgNs surface. The results from the Partial Least Squares (PLS) regression show excellent agreement for all pesticides tested, as shown in Figure 6A–D. These good correlations for these four pesticides show that the SERS substrates could be used to estimate pesticide residue in the environment and food products at very low concentrations, as required by the current limits set by regulatory agencies.

4. Discussion

The use of silver nanostars has not previously been observed for the detection of thiacloprid, thiamethoxam and nitenpyram pesticides. However, the detection of imidacloprid has been reported using a silver nanoflower [35] and gold-coated silver nanoflower SERS substrate [14]. The sensitivity observed using AgNs is similar to that observed with silver nanoflowers in terms of the limits of detection for imidacloprid using SERS substrates. However, the addition of gold to silver nanoflowers has been shown to improve the sensitivity by a factor of approximately 100. Other recent reports have used roughened silver [13] and palladium nanoparticles on meso-porous silicon [36] as SERS substrates, and they have exhibited very similar limits of detection for imidacloprid. This finding is beneficial for estimating the imidacloprid residue in food products, since the result is significantly lower than the current allowable limit of residue in fruit by the Chinese government, set at 1.91–3.91 mol/L (4.89 × 10⁻⁴ mg/mL to 10.0 × 10⁻⁴ mg/mL), and by the European Union at 0.5 mg/kg (5 × 10⁻⁴ mg/mL) [15].
A combination of silver and gold nanoparticles has been reported to detect thiacloprid with a limit of detection of 9.6 × 10⁻² mg/mL [37], 2.3 × 10⁻⁵ mg/mL in milk [38], 1.0 × 10⁻⁵ mg/mL in peach [39] and 4.0 × 10⁻⁴ mg/mL using silver and gold hydrosols [40]. Interestingly, the thiacloprid detected using AgNs is significantly lower than reported by other researchers, and the current allowable limit of residue in honey by the European Union is 200 µg/kg (2 × 10⁻⁴ mg/mL) [40]. Thiamethoxam has been detected using silver nanoparticle films at a limit of 3.7 × 10⁻¹ mg/mL [41], 3.0 × 10⁻⁴ mg/mL [42] and 3.0 × 10⁻⁶ mg/mL in fruit by silver nanoparticles decorated with cellulose and DNA [21]. Meanwhile, a gold-embedded chitosan SERS substrate had a similar LOD to this project at 1.0 × 10⁻⁶ mg/mL on fruit peels [43]. This value is significantly lower than the current allowable limit of thiacloprid residue in fruit by the United States Environmental Protection Agency of 2.0 × 10⁻⁵ mg/mL to 6.0 × 10⁻³ mg/mL [43]. One article reporting the use of a silver dendrite with a fern structure as the SERS substrate to detect nitenpyram in apple surfaces had an LOD of 1.2 × 10⁻³ mg/mL [44]. The AgNs used in this project provided a more sensitive surface for low concentrations of nitenpyram. We also provide, in Table 2, the wider range of previous works toward the detection of pesticides, chemical traces and biomaterials in complex samples.

5. Conclusions

We detected four neonicotinoid pesticides on a silver nanostars (AgNs) surface using surface-enhanced Raman scattering. The developed SERS substrates with a dense coverage of the AgNs on a glass surface in this work show very high sensitivity and excellent reproducibility towards four types of neonicotinoid pesticides (thiacloprid, imidacloprid, thiamethoxam and nitenpyram) in a detection range from 1 ng/mL to 1 mg/mL. The results revealed that the AgNs surface is sensitive to four types of pesticides, and the calculated EFs for thiacloprid, imidacloprid, thiamethoxam and nitenpyram detection were 3.61 × 10⁵, 2.86 × 10⁴, 9.53 × 10⁴ and 2.40 × 10⁵, respectively. The range of electronic properties of the four compounds tested suggests that this system will have wide-ranging use for the detection of many molecules. The use of silver nanostars as a SERS-active element to detect these four neonicotinoid pesticides without complex sample preparation is critical for real-world use in analytical facilities or, more importantly, in the field. The data presented clearly detail the sensor sensitivity and reproducibility—all critical for analytical use. Additionally, the very high sensitivity demonstrated means there is no doubt that the sensor would still provide strong signals using a handheld Raman instrument, meaning that use in the field by non-experts is without doubt feasible. Importantly, based on these experiments, the sensor will have a long shelf life and still provide very high sensitivity to a wide range of molecules, making it ideal for field use, where a range of molecular species will be present.

Supplementary Materials

The following supporting information can be downloaded at: https://www.mdpi.com/article/10.3390/s24020373/s1, Figure S1: molecule structures for 4 types of neonicotinoid pesticides; Figure S2: SERS measurement of 1 mg/mL of neonicotinoids pesticide for 20 spots on the 10 layers AgNs substrate (A) thiacloprid, (B) imidacloprid, (C) thiamethoxam and (D) nitenpyram; Table S1: the vibrational assignment for the characteristic peaks of thiacloprid powder, SERS signal of thiacloprid and DFT calculation; Table S2: the vibrational assignment for the characteristic peaks of imidacloprid powder, SERS signal of imidacloprid and DFT calculation; Table S3: the vibrational assignment for the characteristic peaks of thiamethoxam powder, SERS signal of thiamethoxam and DFT calculation; Table S4: the vibrational assignment for the characteristic peaks of nitenpyram powder, SERS signal of nitenpyram and DFT calculation.

Author Contributions

Formal analysis, N.A.B.; funding acquisition, J.G.S.; investigation, N.A.B.; methodology, N.A.B., M.F. and J.G.S.; resources, J.G.S.; software, M.F.; supervision, J.G.S.; visualization, N.A.B.; writing—original draft, N.A.B.; writing—review and editing, N.A.B. All authors have read and agreed to the published version of the manuscript.

Funding

This research was funded by the Australian Research Council, grant number DP200101217.

Institutional Review Board Statement

Not applicable.

Informed Consent Statement

Not applicable.

Data Availability Statement

Data will be made available on request.

Acknowledgments

Norhayati Abu Bakar would like to thank the Ministry of Higher Education, Malaysia, and Universiti Kebangsaan, Malaysia, for her fellowship. This characterisation work was supported by the Centre for Microscopy and Microanalysis (CMM), University of Queensland. This work was performed in part at the Queensland node of the Australian National Fabrication Facility, a company established under the National Collaborative Research Infrastructure Strategy to provide nano- and micro-fabrication facilities for Australia’s researchers.

Conflicts of Interest

The authors declare no conflicts of interest.

References

  1. Sparks, T.C.; Watson, G.B.; Loso, M.R.; Geng, C.; Babcock, J.M.; Thomas, J.D. Sulfoxaflor and the Sulfoximine Insecticides: Chemistry, Mode of Action and Basis for Efficacy on Resistant Insects. Pestic. Biochem. Physiol. 2013, 107, 1–7. [Google Scholar] [CrossRef] [PubMed]
  2. Obregon, D.; Pederson, G.; Taylor, A.; Poveda, K. The Pest Control and Pollinator Protection Dilemma: The Case of Thiamethoxam Prophylactic Applications in Squash Crops. PLoS ONE 2022, 17, e0267984. [Google Scholar] [CrossRef] [PubMed]
  3. Kessler, S.C.; Tiedeken, E.J.; Simcock, K.L.; Derveau, S.; Mitchell, J.; Softley, S.; Radcliffe, A.; Stout, J.C.; Wright, G.A. Bees Prefer Foods Containing Neonicotinoid Pesticides. Nature 2015, 521, 74–76. [Google Scholar] [CrossRef]
  4. Wood, T.J.; Goulson, D. The Environmental Risks of Neonicotinoid Pesticides: A Review of the Evidence Post 2013. Environ. Sci. Pollut. Res. 2017, 24, 17285–17325. [Google Scholar] [CrossRef] [PubMed]
  5. Buszewski, B.; Bukowska, M.; Ligor, M.; Staneczko-Baranowska, I. A Holistic Study of Neonicotinoids Neuroactive Insecticides—Properties, Applications, Occurrence, and Analysis. Environ. Sci. Pollut. Res. 2019, 26, 34723–34740. [Google Scholar] [CrossRef] [PubMed]
  6. Zhang, Q.; Li, Z.; Chang, C.H.; Lou, J.L.; Zhao, M.R.; Lu, C. Potential Human Exposures to Neonicotinoid Insecticides: A Review. Environ. Pollut. 2018, 236, 71–81. [Google Scholar] [CrossRef] [PubMed]
  7. Taira, K.; Fujioka, K.; Aoyama, Y. Qualitative Profiling and Quantification of Neonicotinoid Metabolites in Human Urine by Liquid Chromatography Coupled with Mass Spectrometry. PLoS ONE 2013, 8, e80332. [Google Scholar] [CrossRef]
  8. Rawat, K.; Srivastava, A.; Tandon, S.; Singh, G.P. Method Validation for Simultaneous Determination of Four Neonicotinoids in Vegetables by Liquid Chromatography. Anal. Sci. 2023, 39, 431–439. [Google Scholar] [CrossRef]
  9. Xu, J.; Sun, J.; Lu, X.; Wang, Y.; Zhang, Y.; Sun, X. A Highly Sensitive Fluorescence Immunochromatography Strip for Thiacloprid in Fruits and Vegetables Using Recombinant Antibodies. Talanta 2023, 256, 124258. [Google Scholar] [CrossRef]
  10. Carbonell-Rozas, L.; Horstkotte, B.; García-Campaña, A.M.; Lara, F.J. Sweeping-Micellar Electrokinetic Chromatography with Tandem Mass Spectrometry as an Alternative Methodology to Determine Neonicotinoid and Boscalid Residues in Pollen and Honeybee Samples. J. Chromatogr. A 2022, 1672, 463023. [Google Scholar] [CrossRef]
  11. Kneipp, J.; Kneipp, H.; Kneipp, K. SERS—A Single-Molecule and Nanoscale Tool for Bioanalytics. Chem. Soc. Rev. 2008, 37, 1052–1060. [Google Scholar] [CrossRef] [PubMed]
  12. Alak, A.M.; Vo-Dinh, T. Surface-Enhanced Raman Spectrometry of Organophosphorus Chemical Agents. Anal. Chem. 1987, 59, 2149–2153. [Google Scholar] [CrossRef] [PubMed]
  13. Creedon, N.; Lovera, P.; Moreno, J.G.; Nolan, M.; O’Riordan, A. Highly Sensitive SERS Detection of Neonicotinoid Pesticides. Complete Raman Spectral Assignment of Clothianidin and Imidacloprid. J. Phys. Chem. A 2020, 124, 7238–7247. [Google Scholar] [CrossRef] [PubMed]
  14. Zhu, A.; Xu, Y.; Ali, S.; Ouyang, Q.; Chen, Q. Au@Ag Nanoflowers Based SERS Coupled Chemometric Algorithms for Determination of Organochlorine Pesticides in Milk. LWT 2021, 150, 111978. [Google Scholar] [CrossRef]
  15. Pan, F.; Wu, H.; Tang, J.; Xiang, L.; Wei, J. Sensitive Detection of Imidacloprid at Ultra-Trace Level Utilizing Ratiometric Surface-Enhanced Raman Scattering Platform Based on C60 and Rhodamine 6G. Chem. Pap. 2022, 76, 5571–5578. [Google Scholar] [CrossRef]
  16. Zhang, Y.; Wang, Z.; Wu, L.; Pei, Y.; Chen, P.; Cui, Y. Rapid Simultaneous Detection of Multi-Pesticide Residues on Apple Using SERS Technique. Analyst 2014, 139, 5148–5154. [Google Scholar] [CrossRef]
  17. Augustine, S.; Sooraj, K.P.; Pachchigar, V.; Krishna, C.M.; Ranjan, M. SERS Based Detection of Dichlorvos Pesticide Using Silver Nanoparticles Arrays: Influence of Array Wavelength/Amplitude. Appl. Surf. Sci. 2021, 544, 148878. [Google Scholar] [CrossRef]
  18. Weißenbacher, N.; Lendl, B.; Frank, J.; Wanzenböck, H.D.; Mizaikoff, B.; Kellner, R. Continuous Surface Enhanced Raman Spectroscopy for the Detection of Trace Organic Pollutants in Aqueous Systems. J. Mol. Struct. 1997, 410–411, 539–542. [Google Scholar] [CrossRef]
  19. Murphy, T.; Lucht, S.; Schmidt, H.; Kronfeldt, H.-D. Surface-Enhanced Raman Scattering (SERS) System for Continuous Measurements of Chemicals in Sea-Water. J. Raman Spectrosc. 2000, 31, 943–948. [Google Scholar] [CrossRef]
  20. Li, X.; Bai, Y.; Zhu, W.; Shi, X.; Xu, S. The Endoplasmic Reticulum-Mitochondrial Crosstalk Is Involved in the Mitigation Mechanism of Eucalyptol on Imidacloprid Toxicity in Ctenopharyngodon Idellus Kidney Cells. Fish Shellfish Immunol. 2022, 127, 99–108. [Google Scholar] [CrossRef]
  21. Xu, X.; Hu, X.; Fu, F.; Liu, L.; Liu, X. DNA-Induced Assembly of Silver Nanoparticle Decorated Cellulose Nanofiber: A Flexible Surface-Enhanced Raman Spectroscopy Substrate for the Selective Charge Molecular Detection and Wipe Test of Pesticide Residues in Fruits. ACS Sustain. Chem. Eng. 2021, 9, 5217–5229. [Google Scholar] [CrossRef]
  22. Abu Bakar, N.; Shapter, J.G. Silver Nanostar Films for Surface-Enhanced Raman Spectroscopy (SERS) of the Pesticide Imidacloprid. Heliyon 2023, 9, e14686. [Google Scholar] [CrossRef] [PubMed]
  23. Le Ru, E.C.; Blackie, E.; Meyer, M.; Etchegoin, P.G. Surface Enhanced Raman Scattering Enhancement Factors:  A Comprehensive Study. J. Phys. Chem. C 2007, 111, 13794–13803. [Google Scholar] [CrossRef]
  24. Chu, H.O.; Song, S.; Li, C.; Gibson, D. Surface Enhanced Raman Scattering Substrates Made by Oblique Angle Deposition: Methods and Applications. Coatings 2017, 7, 26. [Google Scholar] [CrossRef]
  25. Xia, M. A Review on Applications of Two-Dimensional Materials in Surface-Enhanced Raman Spectroscopy. Spectrosc. Int. J. 2018, 2018, 4861472. [Google Scholar] [CrossRef]
  26. Cong, S.; Liu, X.; Jiang, Y.; Zhang, W.; Zhao, Z. Surface Enhanced Raman Scattering Revealed by Interfacial Charge-Transfer Transitions. Innovation 2020, 1, 100051. [Google Scholar] [CrossRef] [PubMed]
  27. Jensen, L.; Aikens, C.M.; Schatz, G.C. Electronic Structure Methods for Studying Surface-Enhanced Raman Scattering. Chem. Soc. Rev. 2008, 37, 1061–1073. [Google Scholar] [CrossRef]
  28. Hieu, T.D.; Chinh, N.T.; Nhung, N.T.A.; Quang, D.T.; Quang, D.D. SERS Chemical Enhancement by Copper—Nanostructures: Theoretical Study of Thiram Pesticide Adsorbed on Cu20 Cluster. Vietnam J. Chem. 2021, 59, 159–166. [Google Scholar] [CrossRef]
  29. Mai, Q.D.; Nguyen, H.A.; Phung, T.L.H.; Xuan Dinh, N.; Tran, Q.H.; Doan, T.Q.; Le, A.-T. Silver Nanoparticles-Based SERS Platform towards Detecting Chloramphenicol and Amoxicillin: An Experimental Insight into the Role of HOMO–LUMO Energy Levels of the Analyte in the SERS Signal and Charge Transfer Process. J. Phys. Chem. C 2022, 126, 7778–7790. [Google Scholar] [CrossRef]
  30. Selimoğlu, F.; Ayhan, M.E. Silver Nanoparticle Decorated Graphene-Based SERS Electrode towards Procalcitonin Detection. Vib. Spectrosc. 2023, 126, 103539. [Google Scholar] [CrossRef]
  31. Moreira, A.A.G.; De Lima-Neto, P.; Caetano, E.W.S.; Barroso-Neto, I.L.; Freire, V.N. Computational Electronic Structure of the Bee Killer Insecticide Imidacloprid. New J. Chem. 2016, 40, 10353–10362. [Google Scholar] [CrossRef]
  32. Dindorkar, S.S.; Patel, R.V.; Yadav, A. Unravelling the Interaction between Boron Nitride Nanosheets and Organic Pesticides through Density Functional Theory Studies. Colloids Surf. A Physicochem. Eng. Asp. 2022, 649, 129550. [Google Scholar] [CrossRef]
  33. Zhao, Z.; Shi, T.; Chu, Y.; Cao, Y.; Cheng, S.; Na, R.; Wang, Y. Comparison of the Interactions of Flupyrimin and Nitenpyram with Serum Albumins via Multiple Analysis Methods. Chemosphere 2022, 289, 133139. [Google Scholar] [CrossRef] [PubMed]
  34. Zhang, F.; Zhang, Y.; Ni, H.; Ma, K.; Li, R. Experimental and DFT Studies on the Vibrational, Electronic Spectra and NBO Analysis of Thiamethoxam. Spectrochim. Acta Part A Mol. Biomol. Spectrosc. 2014, 118, 162–171. [Google Scholar] [CrossRef] [PubMed]
  35. Chen, Q.; Hassan, M.M.; Xu, J.; Zareef, M.; Li, H.; Xu, Y.; Wang, P.; Agyekum, A.A.; Kutsanedzie, F.Y.H.; Viswadevarayalu, A. Fast Sensing of Imidacloprid Residue in Tea Using Surface-Enhanced Raman Scattering by Comparative Multivariate Calibration. Spectrochim. Acta Part A Mol. Biomol. Spectrosc. 2019, 211, 86–93. [Google Scholar] [CrossRef] [PubMed]
  36. Al-Syadi, A.M.; Faisal, M.; Harraz, F.A.; Jalalah, M.; Alsaiari, M. Immersion-Plated Palladium Nanoparticles onto Meso-Porous Silicon Layer as Novel SERS Substrate for Sensitive Detection of Imidacloprid Pesticide. Sci. Rep. 2021, 11, 9174. [Google Scholar] [CrossRef] [PubMed]
  37. Atanasov, P.A.; Nedyalkov, N.N.; Fukata, N.; Jevasuwan, W.; Subramani, T. Surface-Enhanced Raman Spectroscopy (SERS) of Neonicotinoid Insecticide Thiacloprid Assisted by Silver and Gold Nanostructures. Appl. Spectrosc. 2020, 74, 357–364. [Google Scholar] [CrossRef]
  38. Hussain, A.; Pu, H.; Sun, D.-W. Cysteamine Modified Core-Shell Nanoparticles for Rapid Assessment of Oxamyl and Thiacloprid Pesticides in Milk Using SERS. J. Food Meas. Charact. 2020, 14, 2021–2029. [Google Scholar] [CrossRef]
  39. Yaseen, T.; Pu, H.; Sun, D.-W. Fabrication of Silver-Coated Gold Nanoparticles to Simultaneously Detect Multi-Class Insecticide Residues in Peach with SERS Technique. Talanta 2019, 196, 537–545. [Google Scholar] [CrossRef]
  40. Cañamares, M.V.; Feis, A. Surface-Enhanced Raman Spectra of the Neonicotinoid Pesticide Thiacloprid. J. Raman Spectrosc. 2013, 44, 1126–1135. [Google Scholar] [CrossRef]
  41. Atanasov, P.A.; Nedyalkov, N.N.; Fukata, N.; Jevasuwan, W.; Subramani, T.; Terakawa, M.; Nakajima, Y. Surface-Enhanced Raman Spectroscopy (SERS) of Mancozeb and Thiamethoxam Assisted by Gold and Silver Nanostructures Produced by Laser Techniques on Paper. Appl. Spectrosc. 2019, 73, 313–319. [Google Scholar] [CrossRef] [PubMed]
  42. Gao, Y.; Xu, M.-L.; Xiong, J. Raman and SERS Spectra of Thiamethoxam and the Ag3–Thiamethoxam Complex: An Experimental and Theoretical Investigation. J. Environ. Sci. Health Part B 2019, 54, 665–675. [Google Scholar] [CrossRef] [PubMed]
  43. Fu, F.; Yang, B.; Hu, X.; Tang, H.; Zhang, Y.; Xu, X.; Zhang, Y.; Touhid, S.S.B.; Liu, X.; Zhu, Y.; et al. Biomimetic Synthesis of 3D Au-Decorated Chitosan Nanocomposite for Sensitive and Reliable SERS Detection. Chem. Eng. J. 2020, 392, 123693. [Google Scholar] [CrossRef]
  44. Wang, Q.; Liu, Y.; Bai, Y.; Yao, S.; Wei, Z.; Zhang, M.; Wang, L.; Wang, L. Superhydrophobic SERS Substrates Based on Silver Dendrite-Decorated Filter Paper for Trace Detection of Nitenpyram. Anal. Chim. Acta 2019, 1049, 170–178. [Google Scholar] [CrossRef] [PubMed]
  45. Kubackova, J.; Fabriciova, G.; Miskovsky, P.; Jancura, D.; Sanchez-Cortes, S. Sensitive Surface-Enhanced Raman Spectroscopy (SERS) Detection of Organochlorine Pesticides by Alkyl Dithiol-Functionalized Metal Nanoparticles-Induced Plasmonic Hot Spots. Anal. Chem. 2015, 87, 663–669. [Google Scholar] [CrossRef] [PubMed]
  46. Xu, Y.; Kutsanedzie, F.Y.H.; Hassan, M.; Zhu, J.; Ahmad, W.; Li, H.; Chen, Q. Mesoporous Silica Supported Orderly-Spaced Gold Nanoparticles SERS-Based Sensor for Pesticides Detection in Food. Food Chem. 2020, 315, 126300. [Google Scholar] [CrossRef]
  47. Eskandari, V.; Sahbafar, H.; Zeinalizad, L.; Mahmoudi, R.; Karimpour, F.; Hadi, A.; Bardania, H. Coating of Silver Nanoparticles (AgNPs) on Glass Fibers by a Chemical Method as Plasmonic Surface-Enhanced Raman Spectroscopy (SERS) Sensors to Detect Molecular Vibrations of Doxorubicin (DOX) Drug in Blood Plasma. Arab. J. Chem. 2022, 15, 104005. [Google Scholar] [CrossRef]
  48. Mayr, F.; Zimmerleiter, R.; Farias, P.M.A.; Bednorz, M.; Salinas, Y.; Galembek, A.; Cardozo, O.D.F.; Wielend, D.; Oliveira, D.; Milani, R. Sensitive and High Laser Damage Threshold Substrates for Surface-enhanced Raman Scattering Based on Gold and Silver Nanoparticles. Anal. Sci. Adv. 2023, 4, 335–346. [Google Scholar] [CrossRef]
  49. Baia, M.; Melinte, G.; Barbu-Tudoran, L.; Diamandescu, L.; Iancu, V.; Cosoveanu, V.; Danciu, V.; Baia, L. Highly Porous Nanocomposites Based on TiO2-Noble Metal Particles for Sensitive Detection of Water Pollutants by SERS. J. Phys. Conf. Ser. 2011, 304, 012059. [Google Scholar] [CrossRef]
  50. Quang, A.T.N.; Nguyen, T.A.; Van Vu, S.; Lo, T.N.H.; Park, I.; Vo, K.Q. Facile Tuning of Tip Sharpness on Gold Nanostars by the Controlled Seed-Growth Method and Coating with a Silver Shell for Detection of Thiram Using Surface Enhanced Raman Spectroscopy (SERS). RSC Adv. 2022, 12, 22815–22825. [Google Scholar] [CrossRef]
  51. Fernandes, T.; Fateixa, S.; Ferro, M.; Nogueira, H.I.S.; Daniel-da-Silva, A.L.; Trindade, T. Colloidal Dendritic Nanostructures of Gold and Silver for SERS Analysis of Water Pollutants. J. Mol. Liq. 2021, 337, 116608. [Google Scholar] [CrossRef]
  52. Guo, P.; Sikdar, D.; Huang, X.; Si, K.J.; Xiong, W.; Gong, S.; Yap, L.W.; Premaratne, M.; Cheng, W. Plasmonic Core–Shell Nanoparticles for SERS Detection of the Pesticide Thiram: Size- and Shape-Dependent Raman Enhancement. Nanoscale 2015, 7, 2862–2868. [Google Scholar] [CrossRef] [PubMed]
  53. Guselnikova, O.; Postnikov, P.; Elashnikov, R.; Miliutina, E.; Svorcik, V.; Lyutakov, O. Metal-Organic Framework (MOF-5) Coated SERS Active Gold Gratings: A Platform for the Selective Detection of Organic Contaminants in Soil. Anal. Chim. Acta 2019, 1068, 70–79. [Google Scholar] [CrossRef] [PubMed]
  54. Huang, D.; Zhao, J.; Wang, M.; Zhu, S. Snowflake-like Gold Nanoparticles as SERS Substrates for the Sensitive Detection of Organophosphorus Pesticide Residues. Food Control 2020, 108, 106835. [Google Scholar] [CrossRef]
  55. He, Y.; Xiao, S.; Dong, T.; Nie, P. Gold Nanoparticles for Qualitative Detection of Deltamethrin and Carbofuran Residues in Soil by Surface Enhanced Raman Scattering (SERS). Int. J. Mol. Sci. 2019, 20, 1731. [Google Scholar] [CrossRef]
  56. Lafuente, M.; Pellejero, I.; Clemente, A.; Urbiztondo, M.A.; Mallada, R.; Reinoso, S.; Pina, M.P.; Gandía, L.M. In Situ Synthesis of SERS-Active Au@ POM Nanostructures in a Microfluidic Device for Real-Time Detection of Water Pollutants. ACS Appl. Mater. Interfaces 2020, 12, 36458–36467. [Google Scholar] [CrossRef]
  57. Li, X.; Lin, X.; Lin, S.; Zhou, S.; Fang, G.; Zhao, H.; Wang, L.; Cong, S. From Dilute to Multiple Layers: Bottom-up Self-assembly of Rough Gold Nanorods as SERS Platform for Quantitative Detection of Thiram in Soil. Adv. Mater. Interfaces 2021, 8, 2100412. [Google Scholar] [CrossRef]
  58. Liou, P.; Nayigiziki, F.X.; Kong, F.; Mustapha, A.; Lin, M. Cellulose Nanofibers Coated with Silver Nanoparticles as a SERS Platform for Detection of Pesticides in Apples. Carbohydr. Polym. 2017, 157, 643–650. [Google Scholar] [CrossRef]
  59. Zeng, Y.; Ren, J.; Shen, A.; Hu, J. Field and Pretreatment-Free Detection of Heavy-Metal Ions in Organic Polluted Water through an Alkyne-Coded SERS Test Kit. ACS Appl. Mater. Interfaces 2016, 8, 27772–27778. [Google Scholar] [CrossRef]
  60. Zhang, D.; Liang, P.; Yu, Z.; Huang, J.; Ni, D.; Shu, H.; Dong, Q. The Effect of Solvent Environment toward Optimization of SERS Sensors for Pesticides Detection from Chemical Enhancement Aspects. Sensors Actuators B Chem. 2018, 256, 721–728. [Google Scholar] [CrossRef]
  61. He, Y.; Xiao, S.; Dong, T.; Nie, P. Gold Nanoparticles with Different Particle Sizes for the Quantitative Determination of Chlorpyrifos Residues in Soil by SERS. Int. J. Mol. Sci. 2019, 20, 2817. [Google Scholar] [CrossRef]
  62. Sitjar, J.; Liao, J.-D.; Lee, H.; Liu, B.H.; Fu, W. SERS-Active Substrate with Collective Amplification Design for Trace Analysis of Pesticides. Nanomaterials 2019, 9, 664. [Google Scholar] [CrossRef] [PubMed]
  63. Chen, D.; Zhu, X.; Huang, J.; Wang, G.; Zhao, Y.; Chen, F.; Wei, J.; Song, Z.; Zhao, Y. Polydopamine@Gold Nanowaxberry Enabling Improved SERS Sensing of Pesticides, Pollutants, and Explosives in Complex Samples. Anal. Chem. 2018, 90, 9048–9054. [Google Scholar] [CrossRef]
  64. Logan, N.; Haughey, S.A.; Liu, L.; Burns, D.T.; Quinn, B.; Cao, C.; Elliott, C.T. Handheld SERS Coupled with QuEChERs for the Sensitive Analysis of Multiple Pesticides in Basmati Rice. NPJ Sci. Food 2022, 6, 3. [Google Scholar] [CrossRef]
Figure 1. Raman spectrum of the neonicotinoid pesticide powders on bare glass substrates using 100% power laser: (A) thiacloprid; (B) imidacloprid; (C) thiamethoxam; (D) nitenpyram.
Sensors 24 00373 g001
Figure 2. SERS spectra of neonicotinoid pesticides on AgNs surface using 1% power laser. The spectrum on glass surface is provided for reference using 1% power laser. (A) thiacloprid; (B) imidacloprid; (C) thiamethoxam; (D) nitenpyram.
Sensors 24 00373 g002
Figure 3. SERS measurement of four pesticides (1 mg/mL) for 5 different spots on the 10 layer AgNs substrate (a complete set of spectra from 20 spots is provided in the SI, Figure S2A). (A) thiacloprid; (B) imidacloprid; (C) thiamethoxam; (D) nitenpyram.
Sensors 24 00373 g003
Figure 4. RSD for three peaks of 1 mg/mL four neonicotinoid pesticides on the 10-layer AgNs substrate from the 20 different spots. (A) thiacloprid; (B) imidacloprid; (C) thiamethoxam; (D) nitenpyram.
Sensors 24 00373 g004
Figure 5. SERS measurement for different concentrations of neonicotinoids on the AgNs surface. (A) thiacloprid; (B) imidacloprid; (C) thiamethoxam; (D) nitenpyram.
Sensors 24 00373 g005
Figure 6. Plots of predicted concentrations vs. actual concentrations in the calibration sets for all four pesticides produced using the PLS regression. (A) thiacloprid; (B) imidacloprid; (C) thiamethoxam; (D) nitenpyram.
Sensors 24 00373 g006
Table 1. Energy levels for the pesticides detected using our SERS substrate. The range reported for imidacloprid is due to different conformers of the molecule [31].
PesticidesLUMO (eV)HOMO (eV)∆E (eV)EF SERSRef.
Imidacloprid−0.83 to −0.96−8.55 to −8.777.63 to 7.942.86 × 104[31]
Thiacloprid−1.21−6.685.473.61 × 105[32]
Nitenpyram−3.051−5.1362.0842.40 × 105[33]
Thiamethoxam−1.9398−7.14785.2089.53 × 104[34]
Table 2. The development of the SERS substrate for the determination of the pesticides and chemicals trace in complex samples.
Plasmonic NanostructureSensor ConfigurationAnalytical SensitivityLODAnalyteRef.
Metal nanoparticles (Au and Ag)Bifuntional molecule@Ag/Au10−4–10−8 M10−8 MOrganochlorine pesticides[45]
AuNPsAuNPs on mesoporous silica1–100 ng/mL10−12 MPesticides[46]
AgNPsAgNPs on glass fiber10−1–10−10 M10−10 MDoxorubicin drug[47]
Ag nanoplates and AuNPsAg nanoplates/AuNPs on aluminium foil0.05–1000 ppm34–63 ppbMelamine and R6G[48]
AgNPsTiO2@AgNPs10−1–10−5 M10−5 MAcrylamide and crystal violet[49]
Au nanostars coated silverAu nanostars@Ag0.01–5.0 ppm0.22 ppmThiram[50]
AgNPs and Au NPsAg:Au:poly(amidoamine) dendrimer10−4–10−7 M10−7 MThiram and ziram[51]
Au@Ag nanocubes and Au@Ag nanocuboidsAu@Ag core-shell10−6–10−11 M10−11 MThiram[52]
Au grating surfaceAu@metal organic framework (MOF)10−6–10−14 M10−12 MOrganophosphorus pesticides[53]
Branched AuNPsSnowflake-like AuNPs10−5–10−9 mol/L10−8 mol/LOrganophosphorus pesticides[54]
AuNPsAuNPs0.01–10 mg/L0.01 mg/LToxic insecticides[55]
Au nanostructuresAu@polyoxometalate nanostructures10−6–10−7 M10−7 MOrganophosphorus pesticide[56]
Au nanorods (AuNRs)Rough AuNRs0.0005–5 ppm0.0005 ppmThiram[57]
AgNPsCellulose nanofibers@AgNs1–100 ppm5 ppmThiabendazole[58]
AuNPsAlkyne-labeled AuNPs40 × 10−6–1 × 10⁻⁹ M10−8 MHeavy-metal ions[59]
AgNPsFlower-shaped AgNPs10−4–10−10 M10−10 MOrganophosphorus pesticides[60]
AuNPsAuNPs0.01–10 mg/L10−5 g/LChlorpyrifos[61]
AuNPsAuNPs/porous zirconia layer10−2–10−6 M10−6 MOrganophosphates pesticides[62]
Au nanowaxberrypolydopamine@Au nanowaxberry100 nM—1 pM10−12 MPesticides, pollutants and explosives[63]
AuNPsAuNPs10 ppb–100 ppm0.3 ppbAcephate, carbendazim, thiamethoxam and tricyclazole[64]
Disclaimer/Publisher’s Note: The statements, opinions and data contained in all publications are solely those of the individual author(s) and contributor(s) and not of MDPI and/or the editor(s). MDPI and/or the editor(s) disclaim responsibility for any injury to people or property resulting from any ideas, methods, instructions or products referred to in the content.

