
Equivalent Electromechanical Model for Quartz Tuning Fork Used in Atomic Force Microscopy
 , ,
, ,
Abstract
:1. Introduction
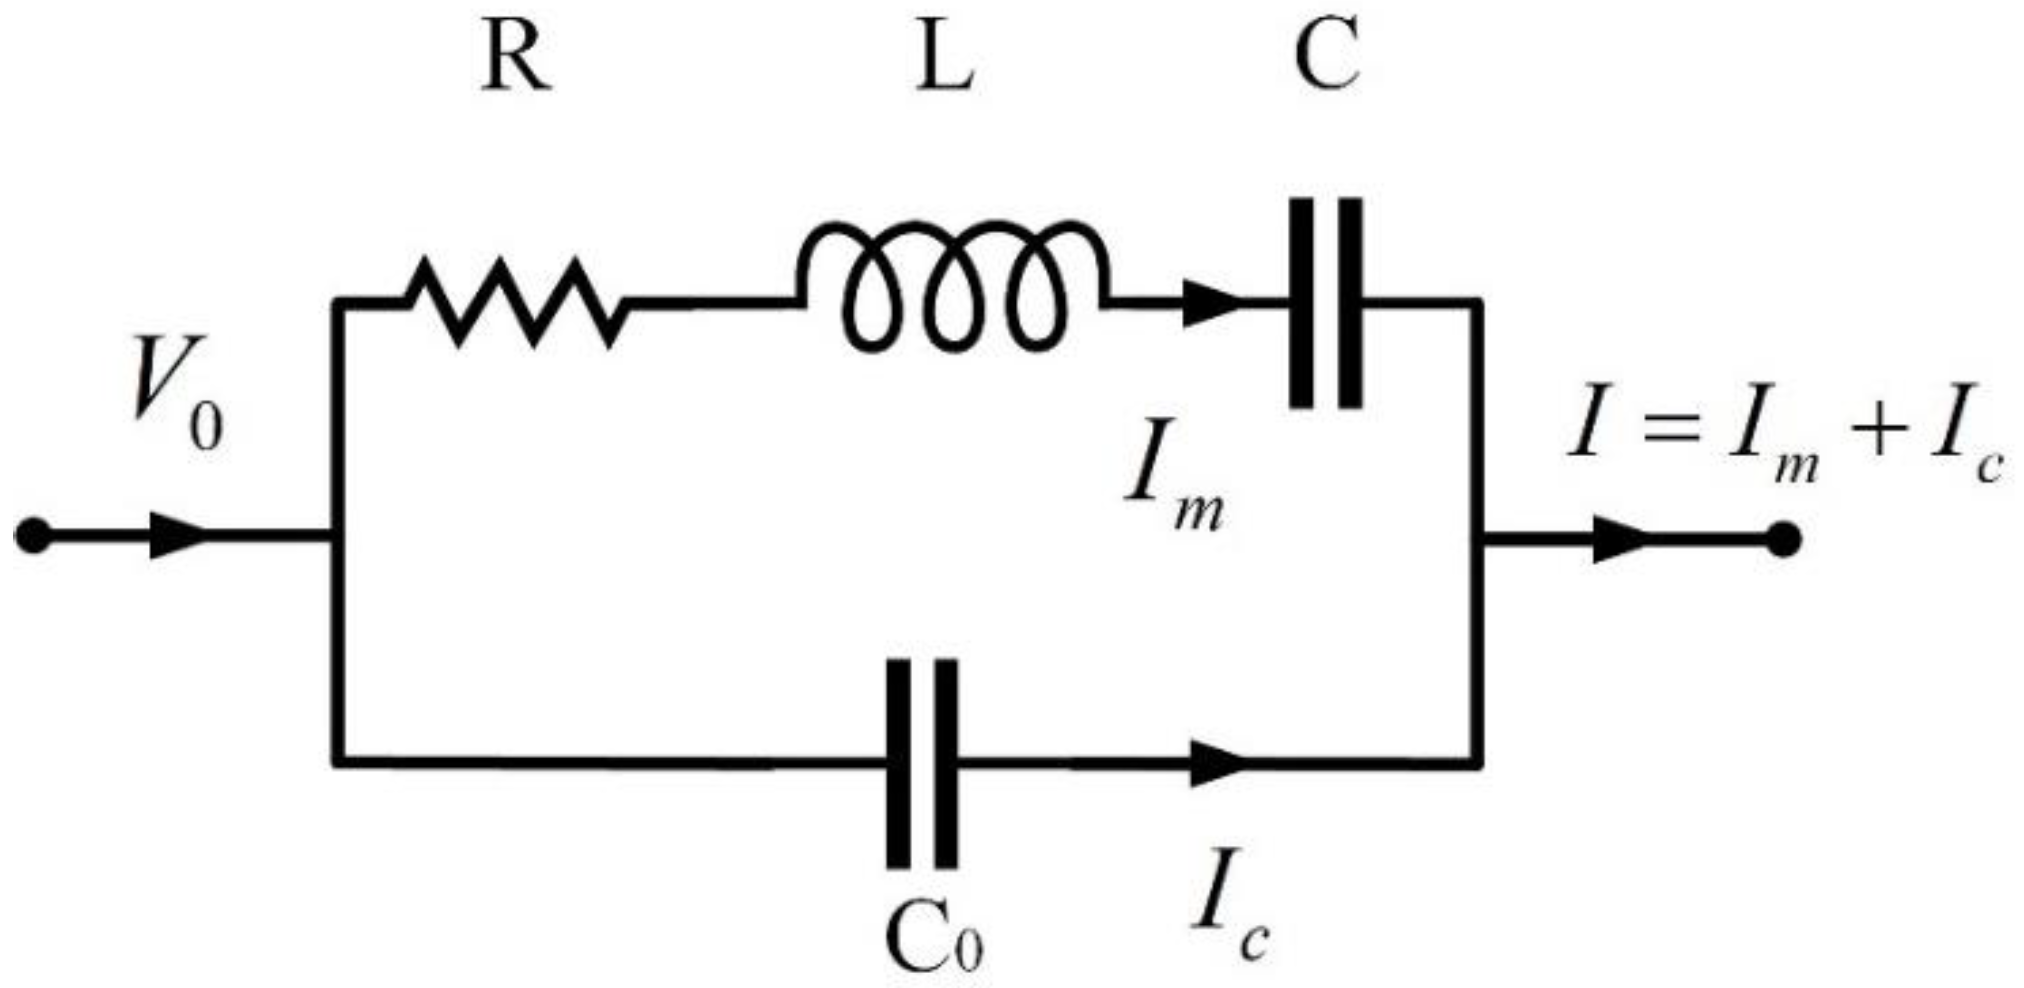
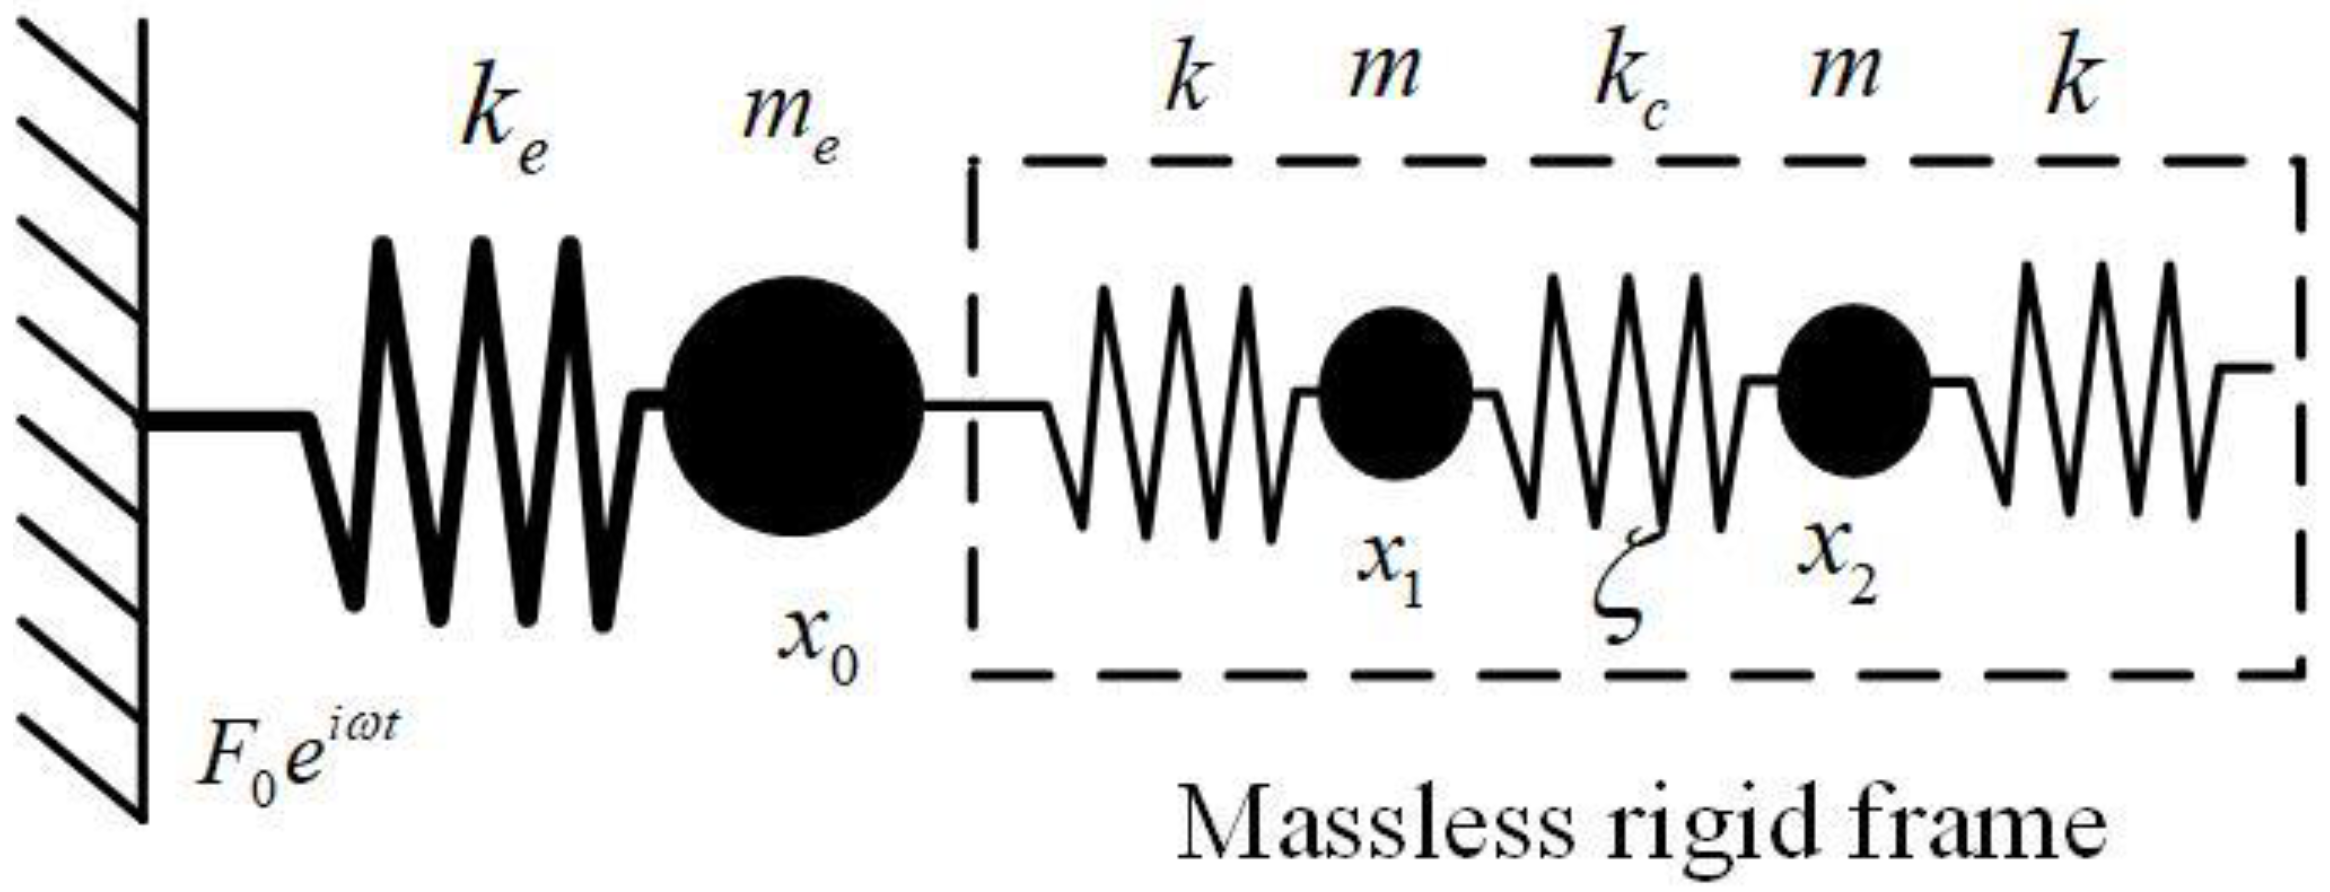
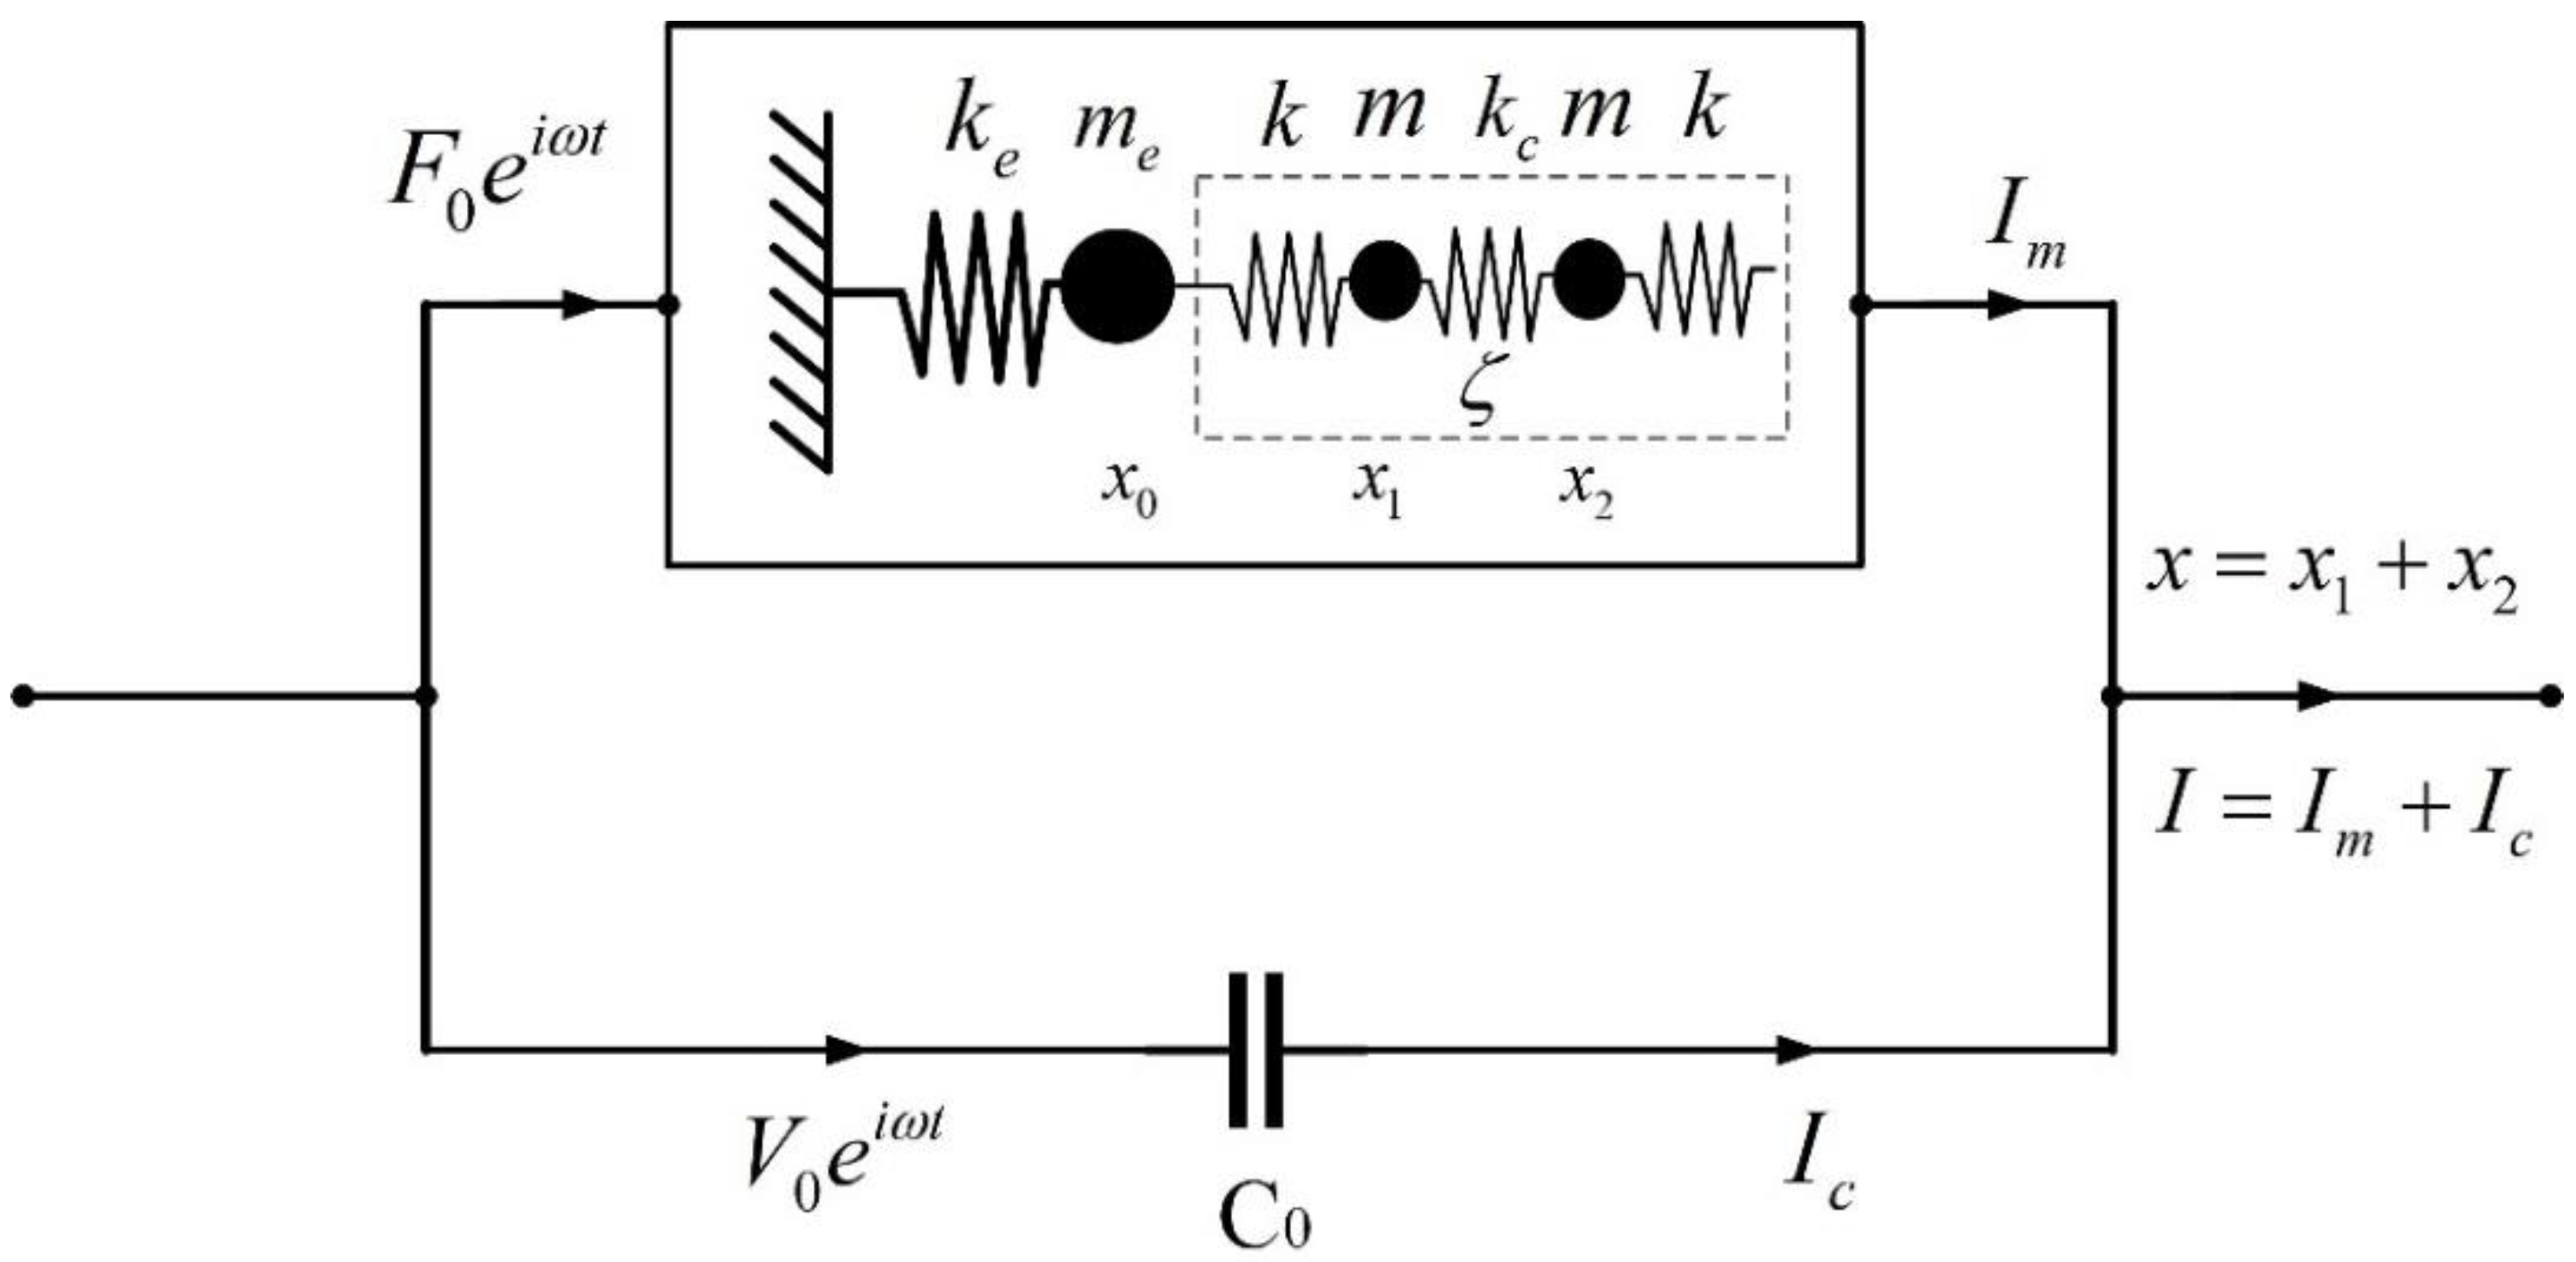
2. Electromechanical Model of QTF
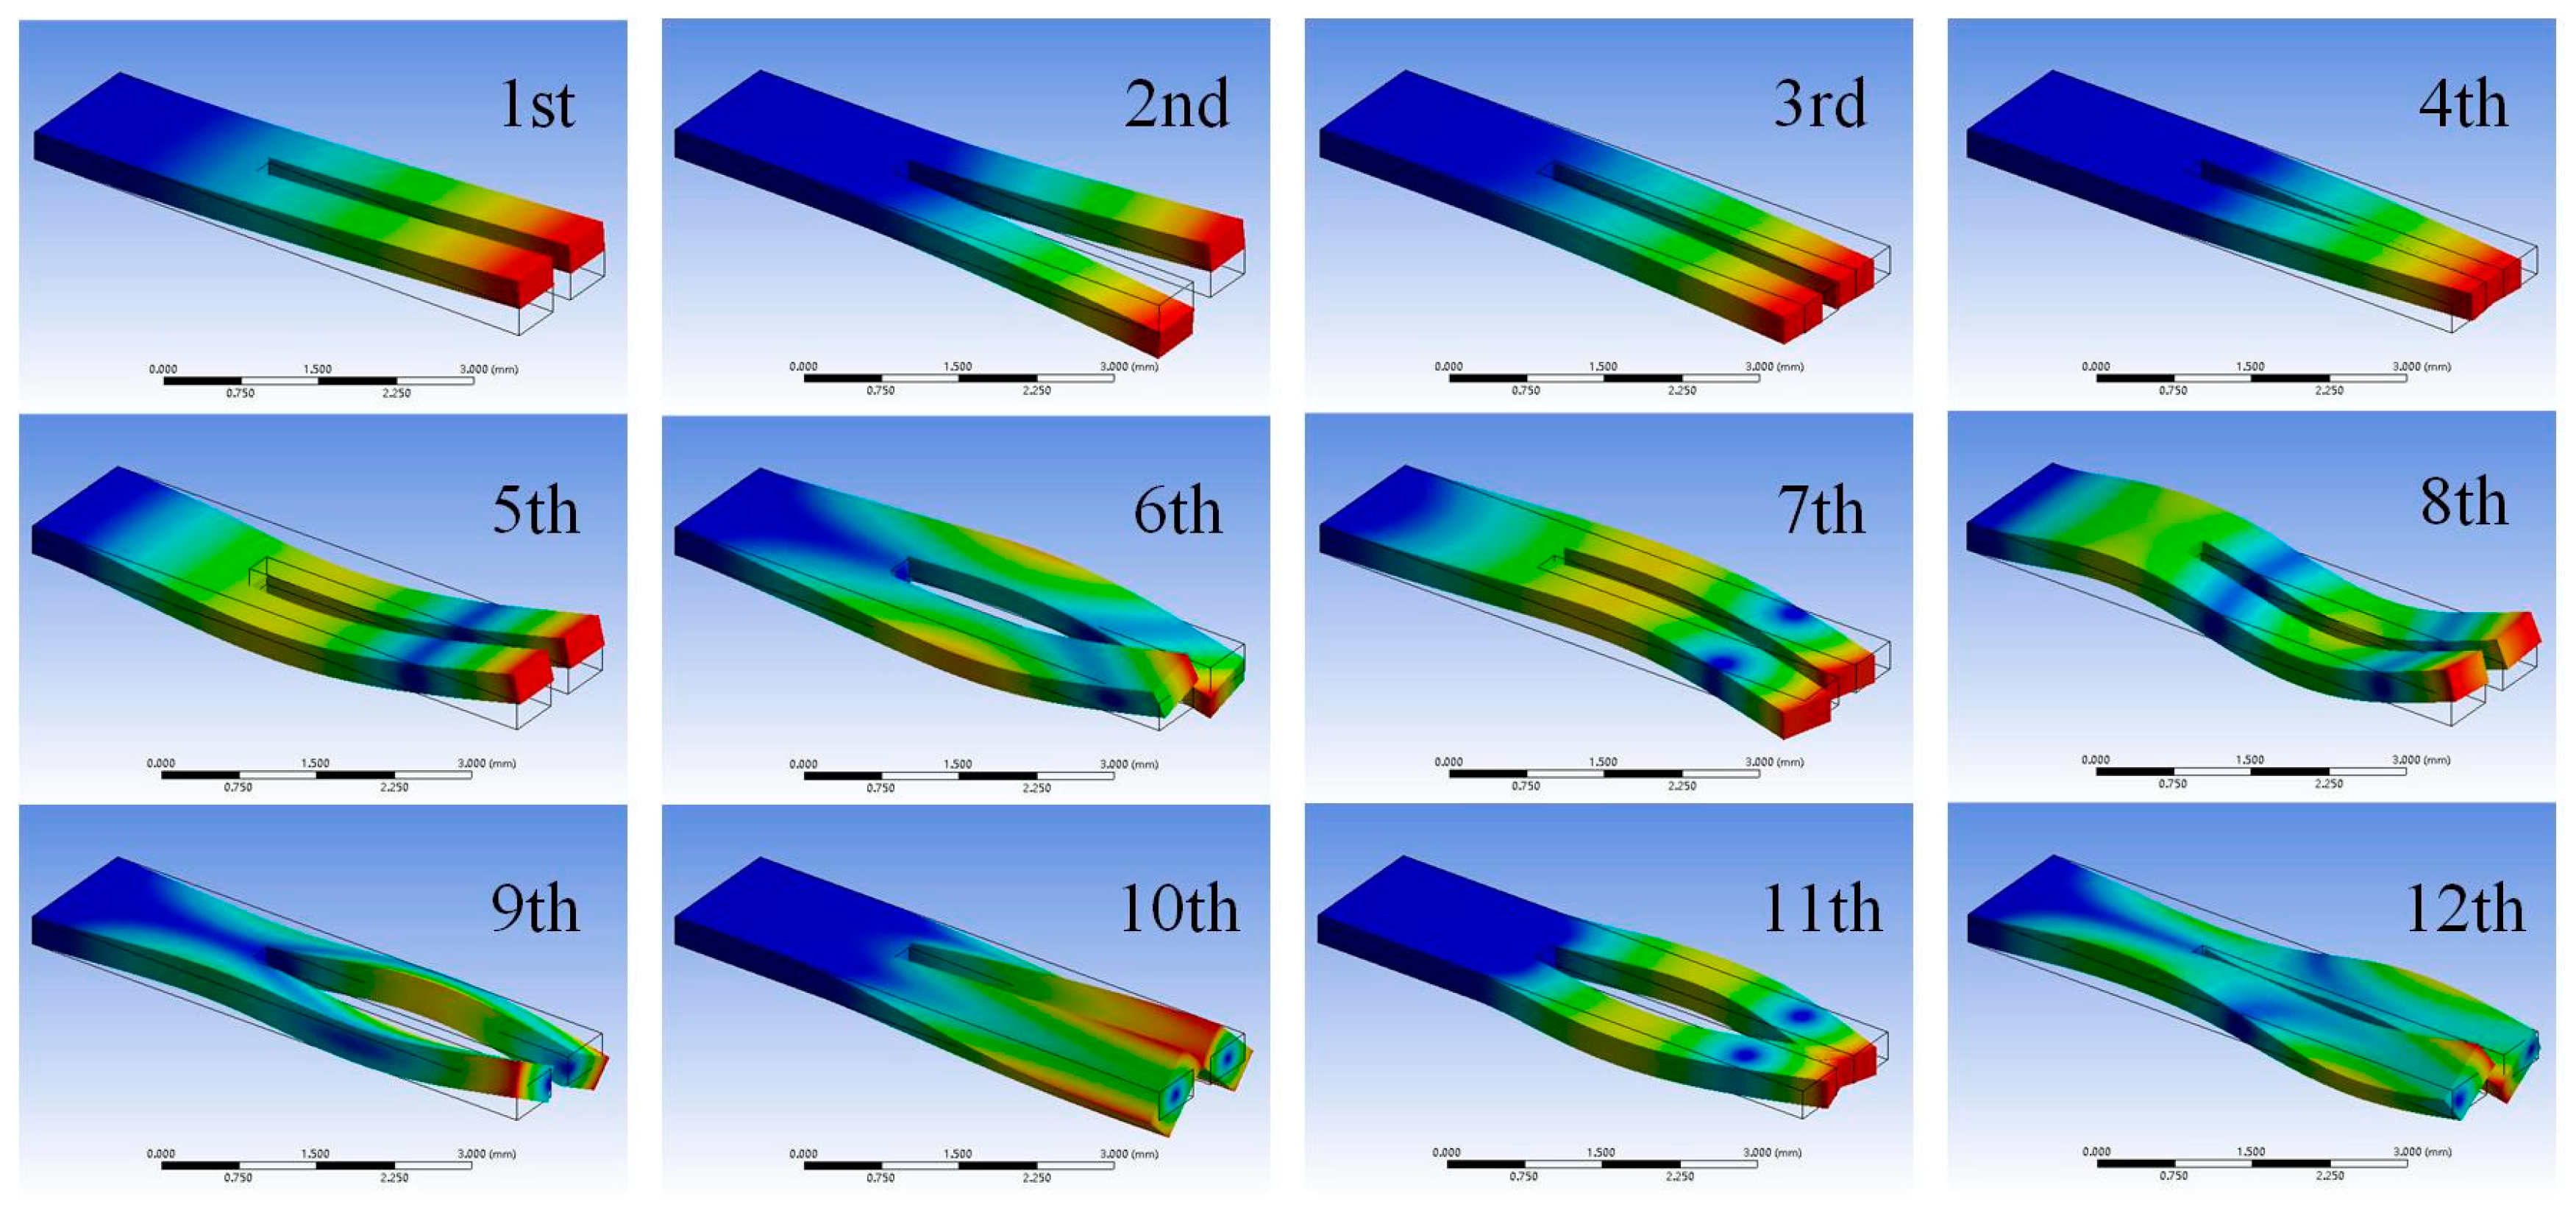
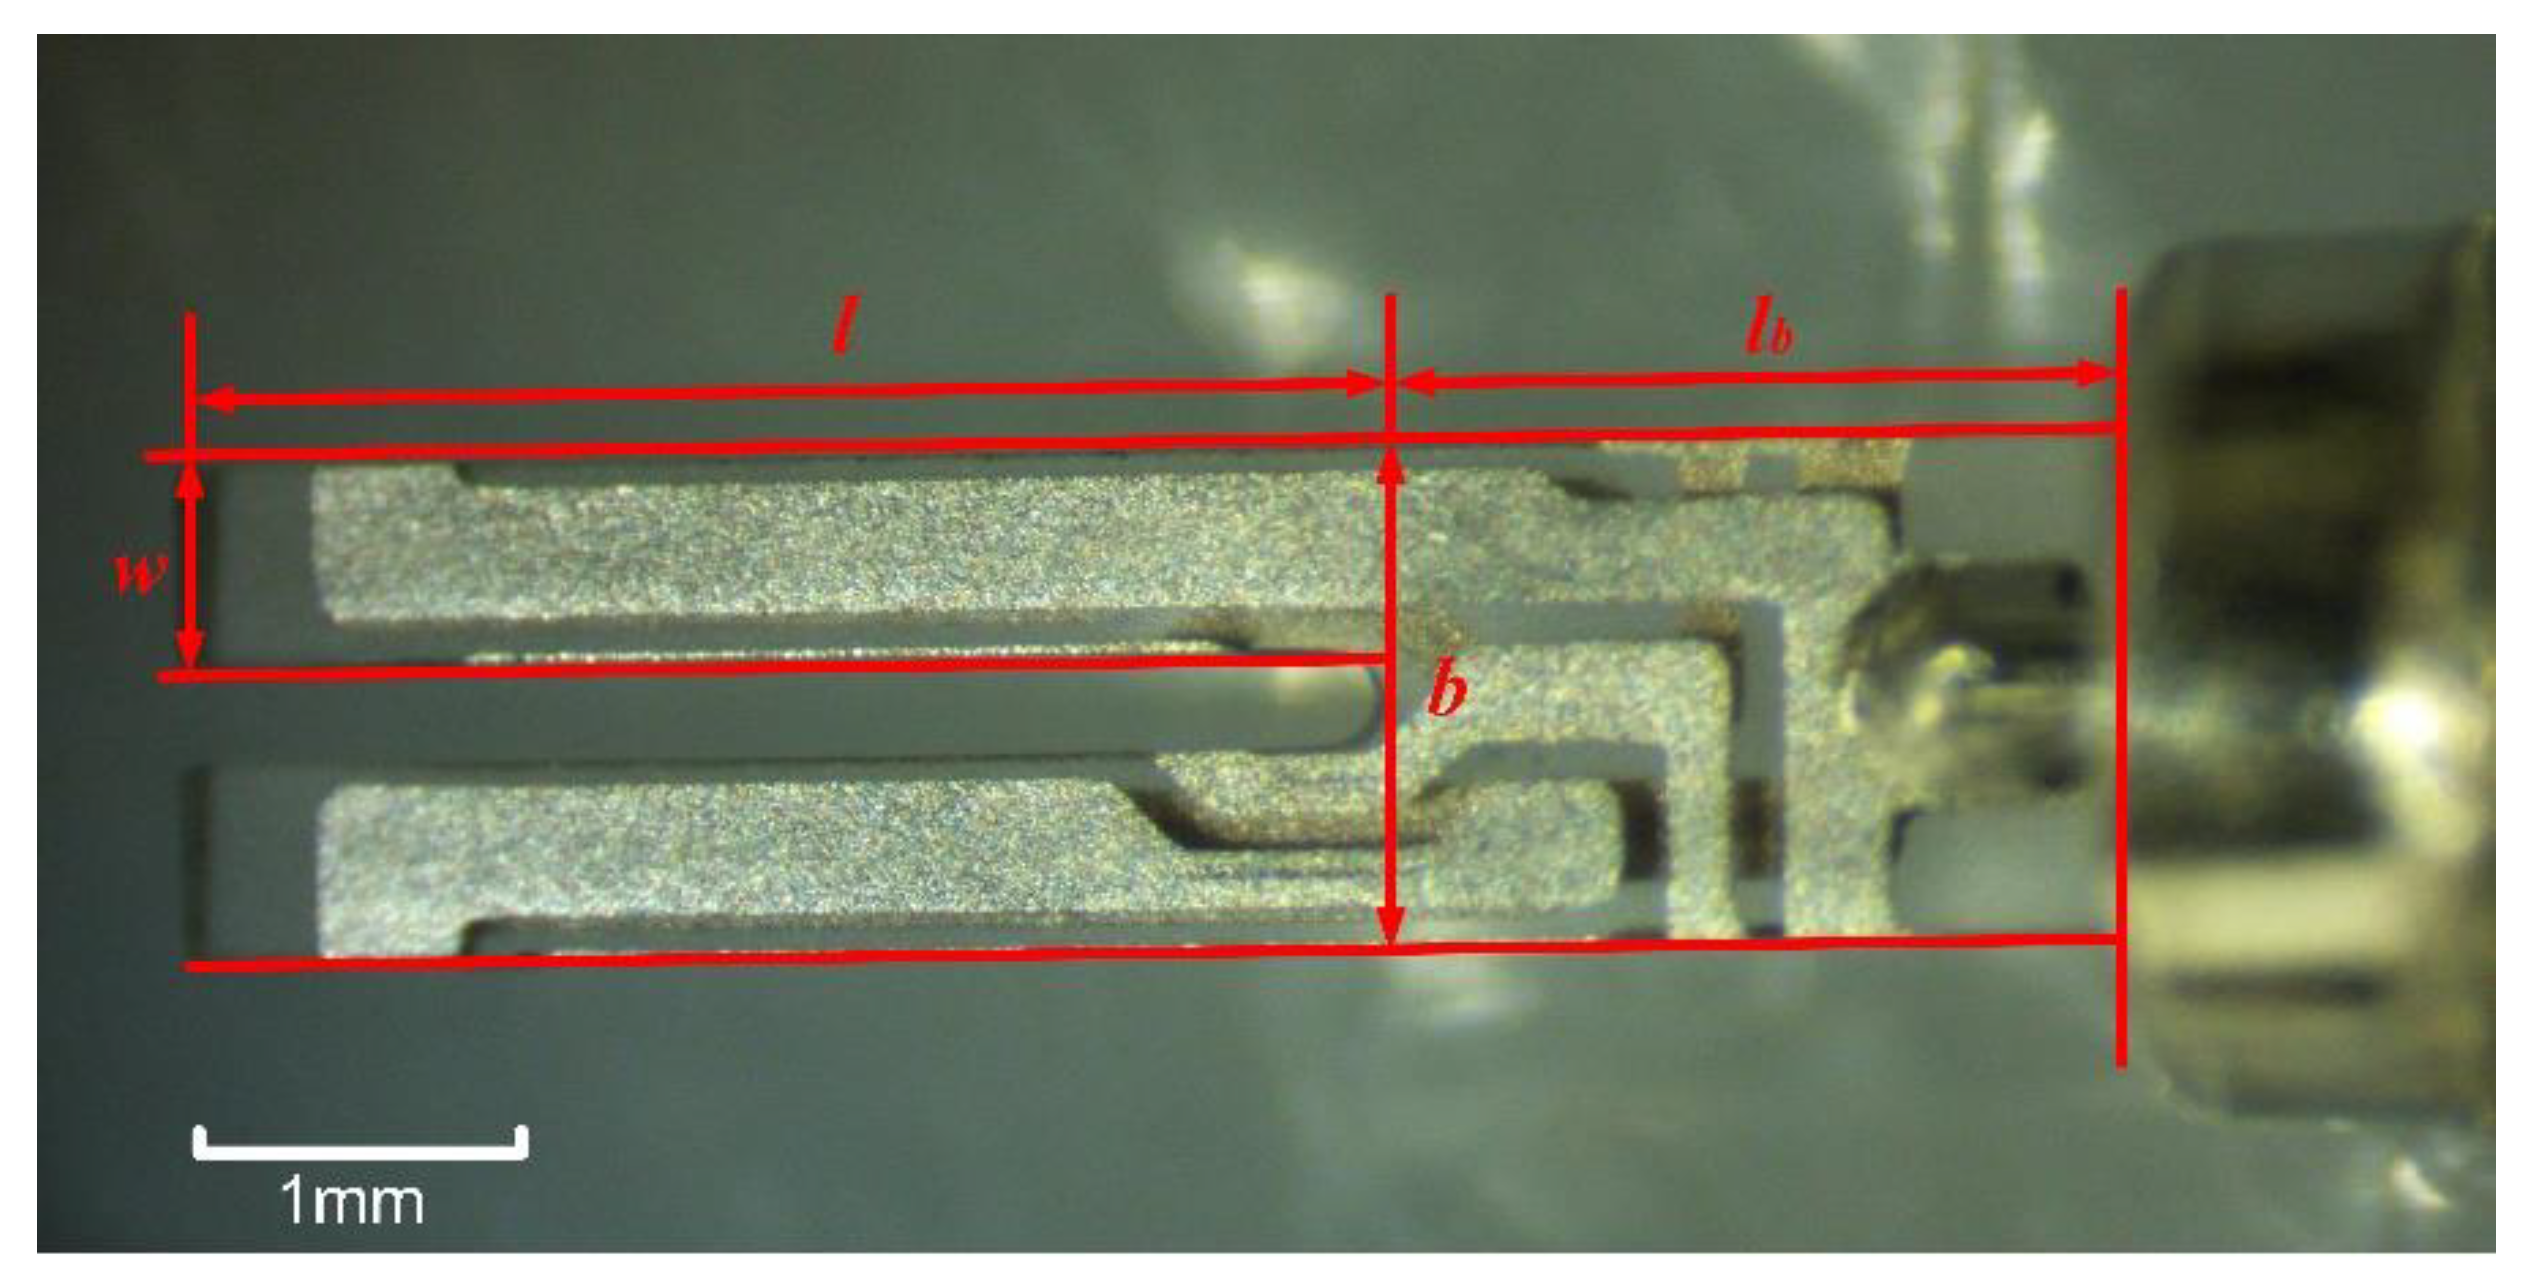
3. Finite Element Analysis
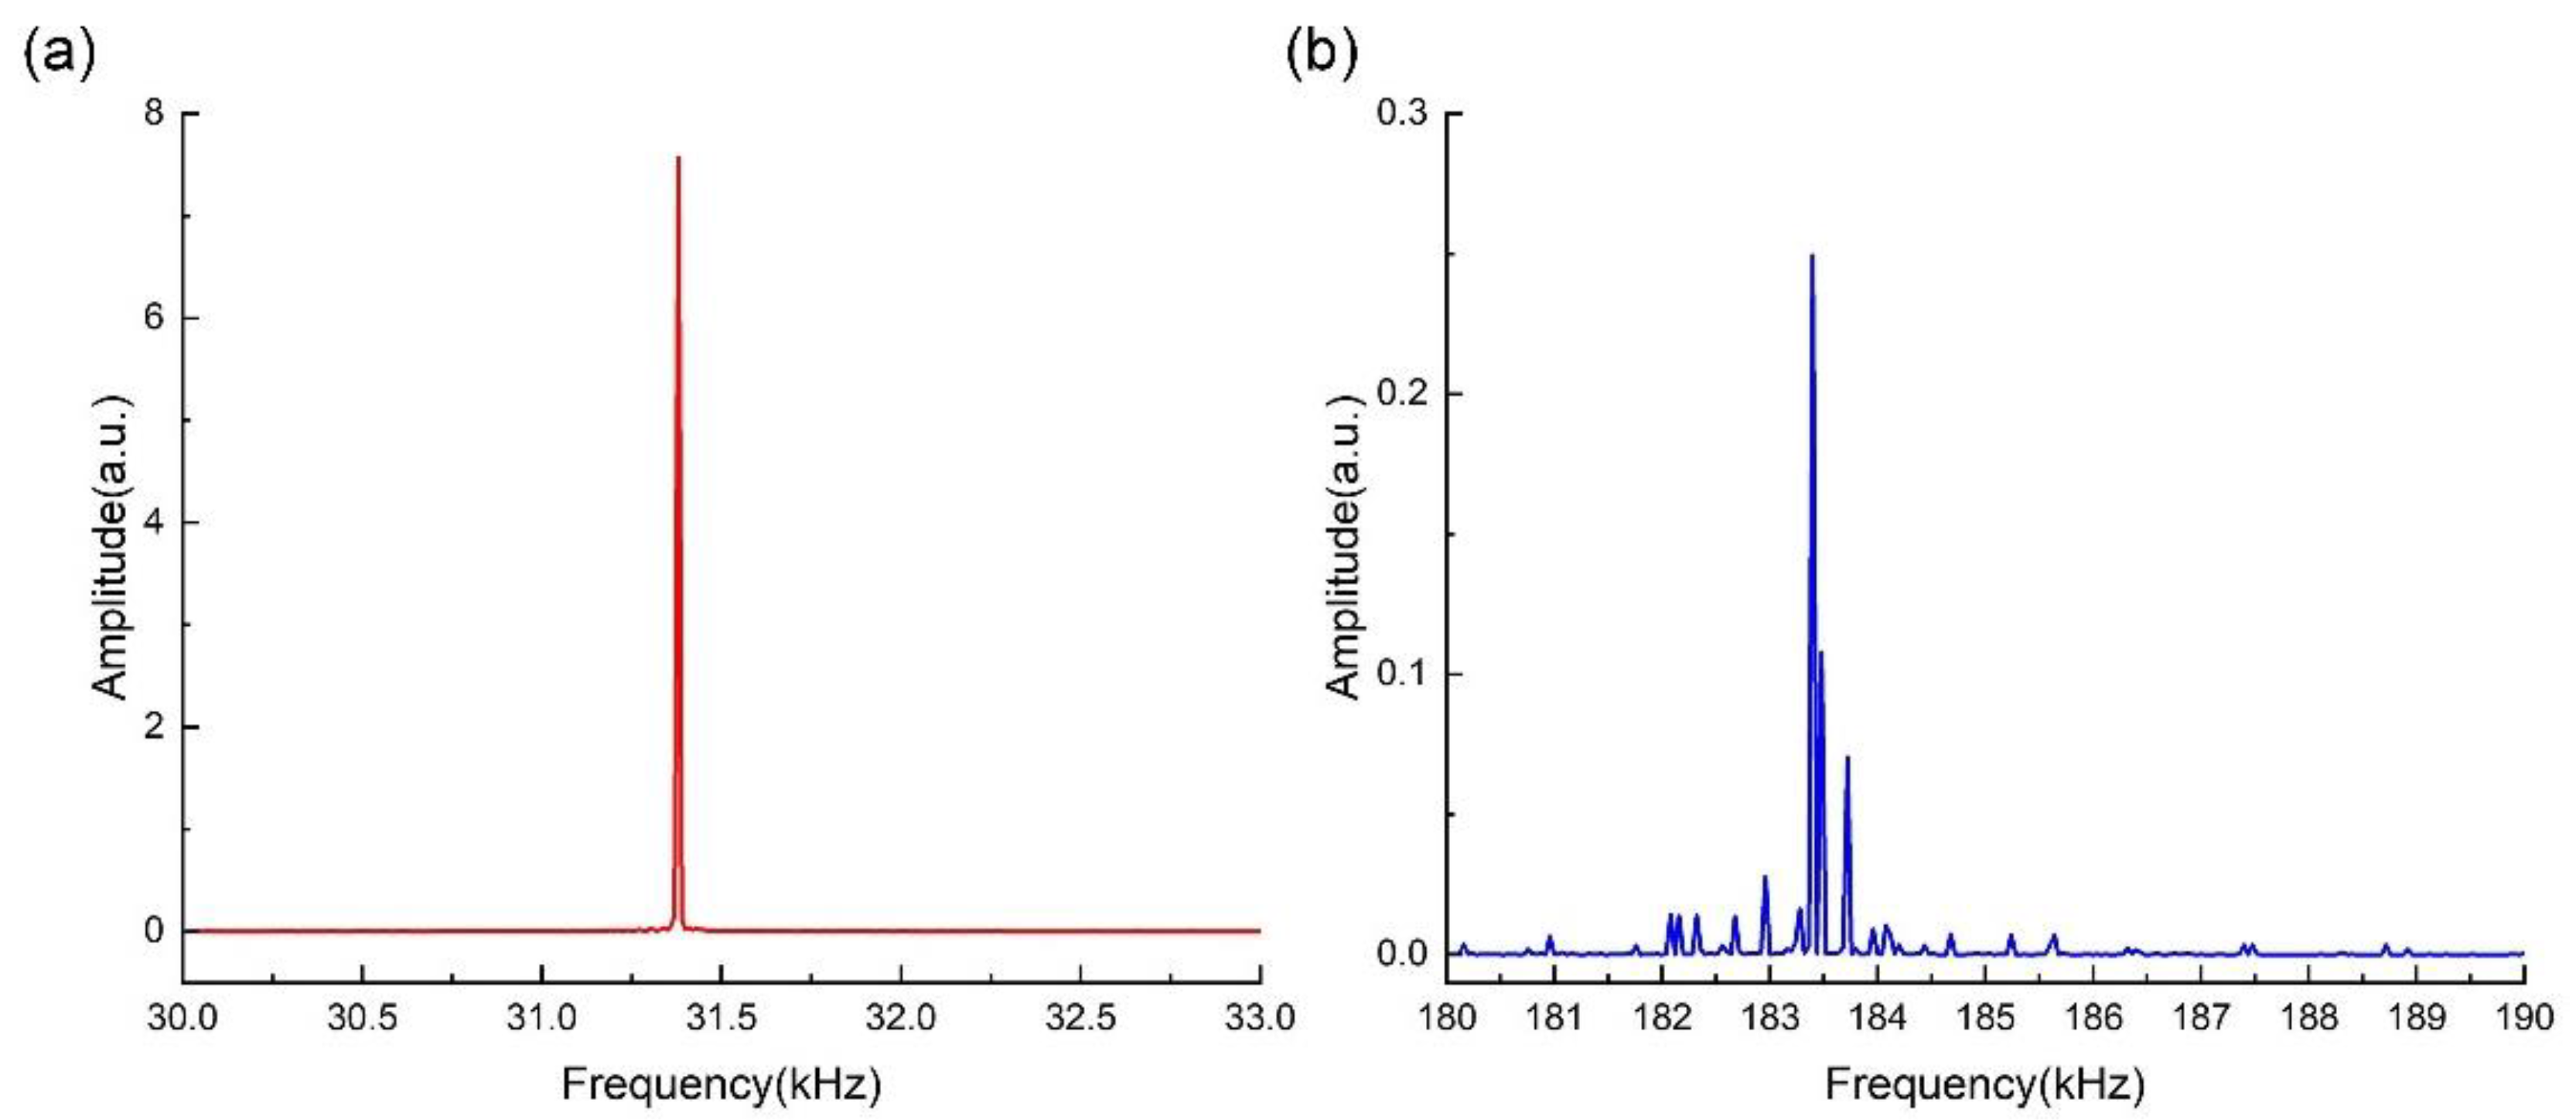
4. Experimental Tests
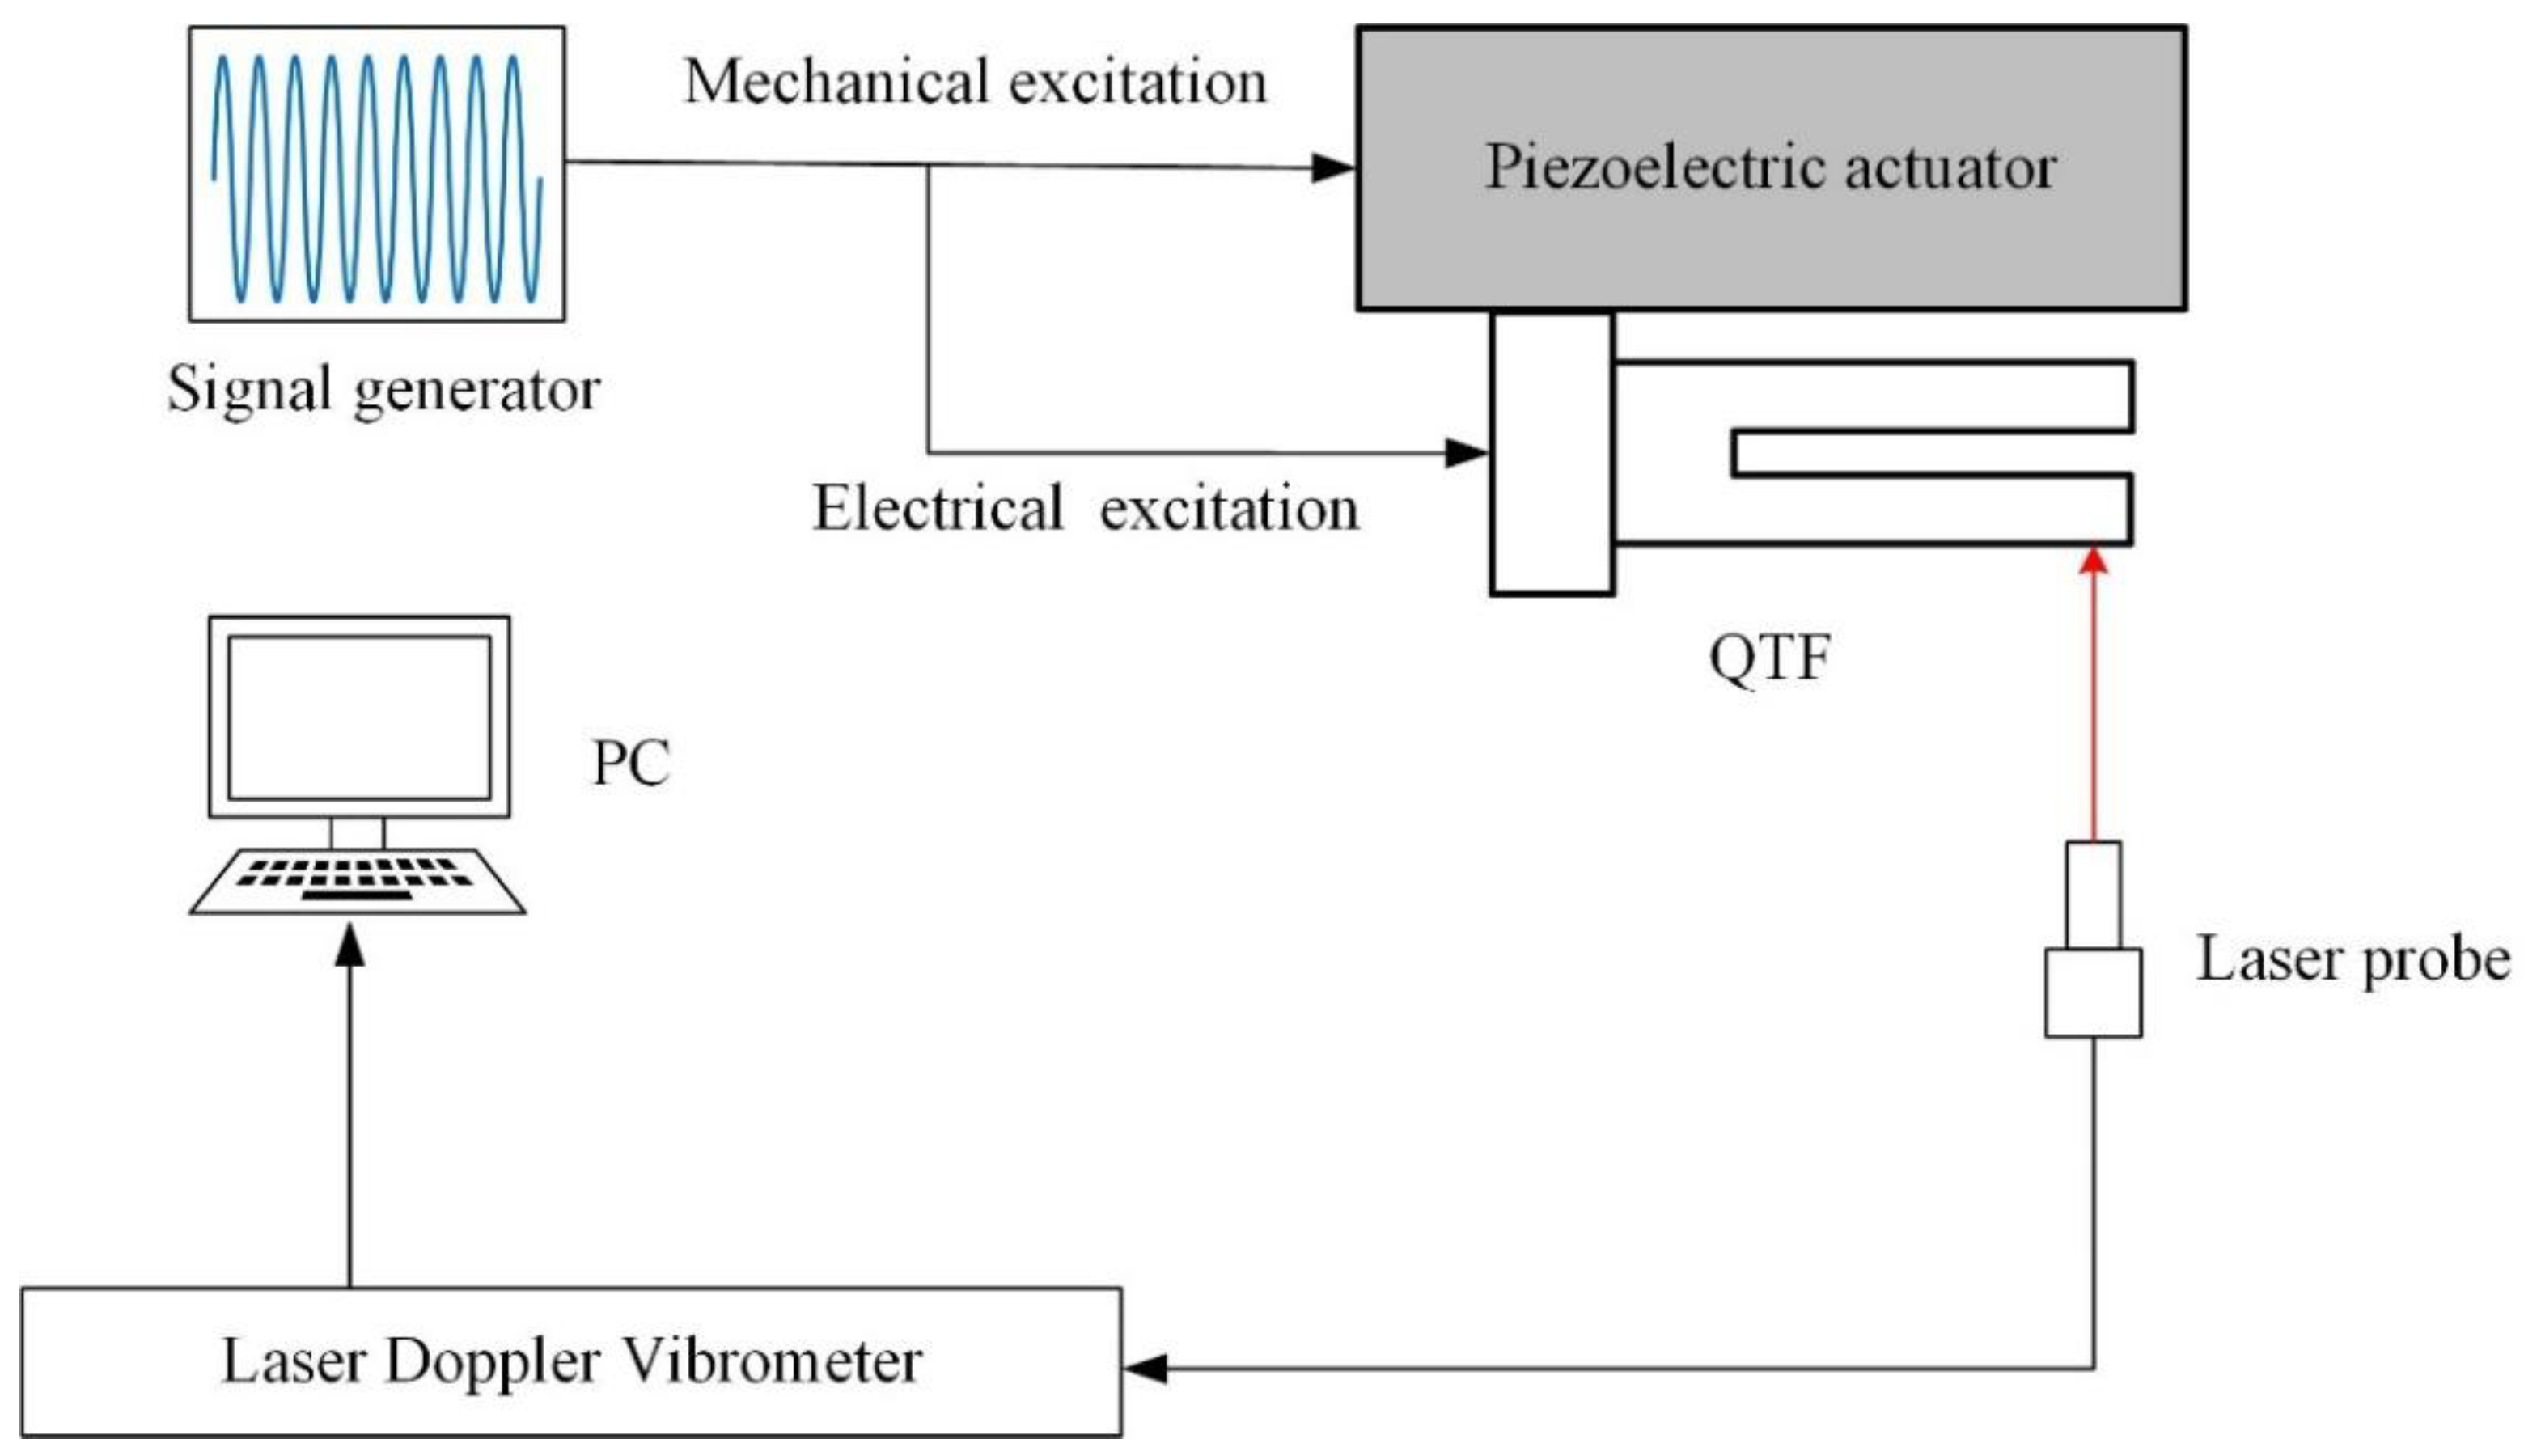
4.1. Setup
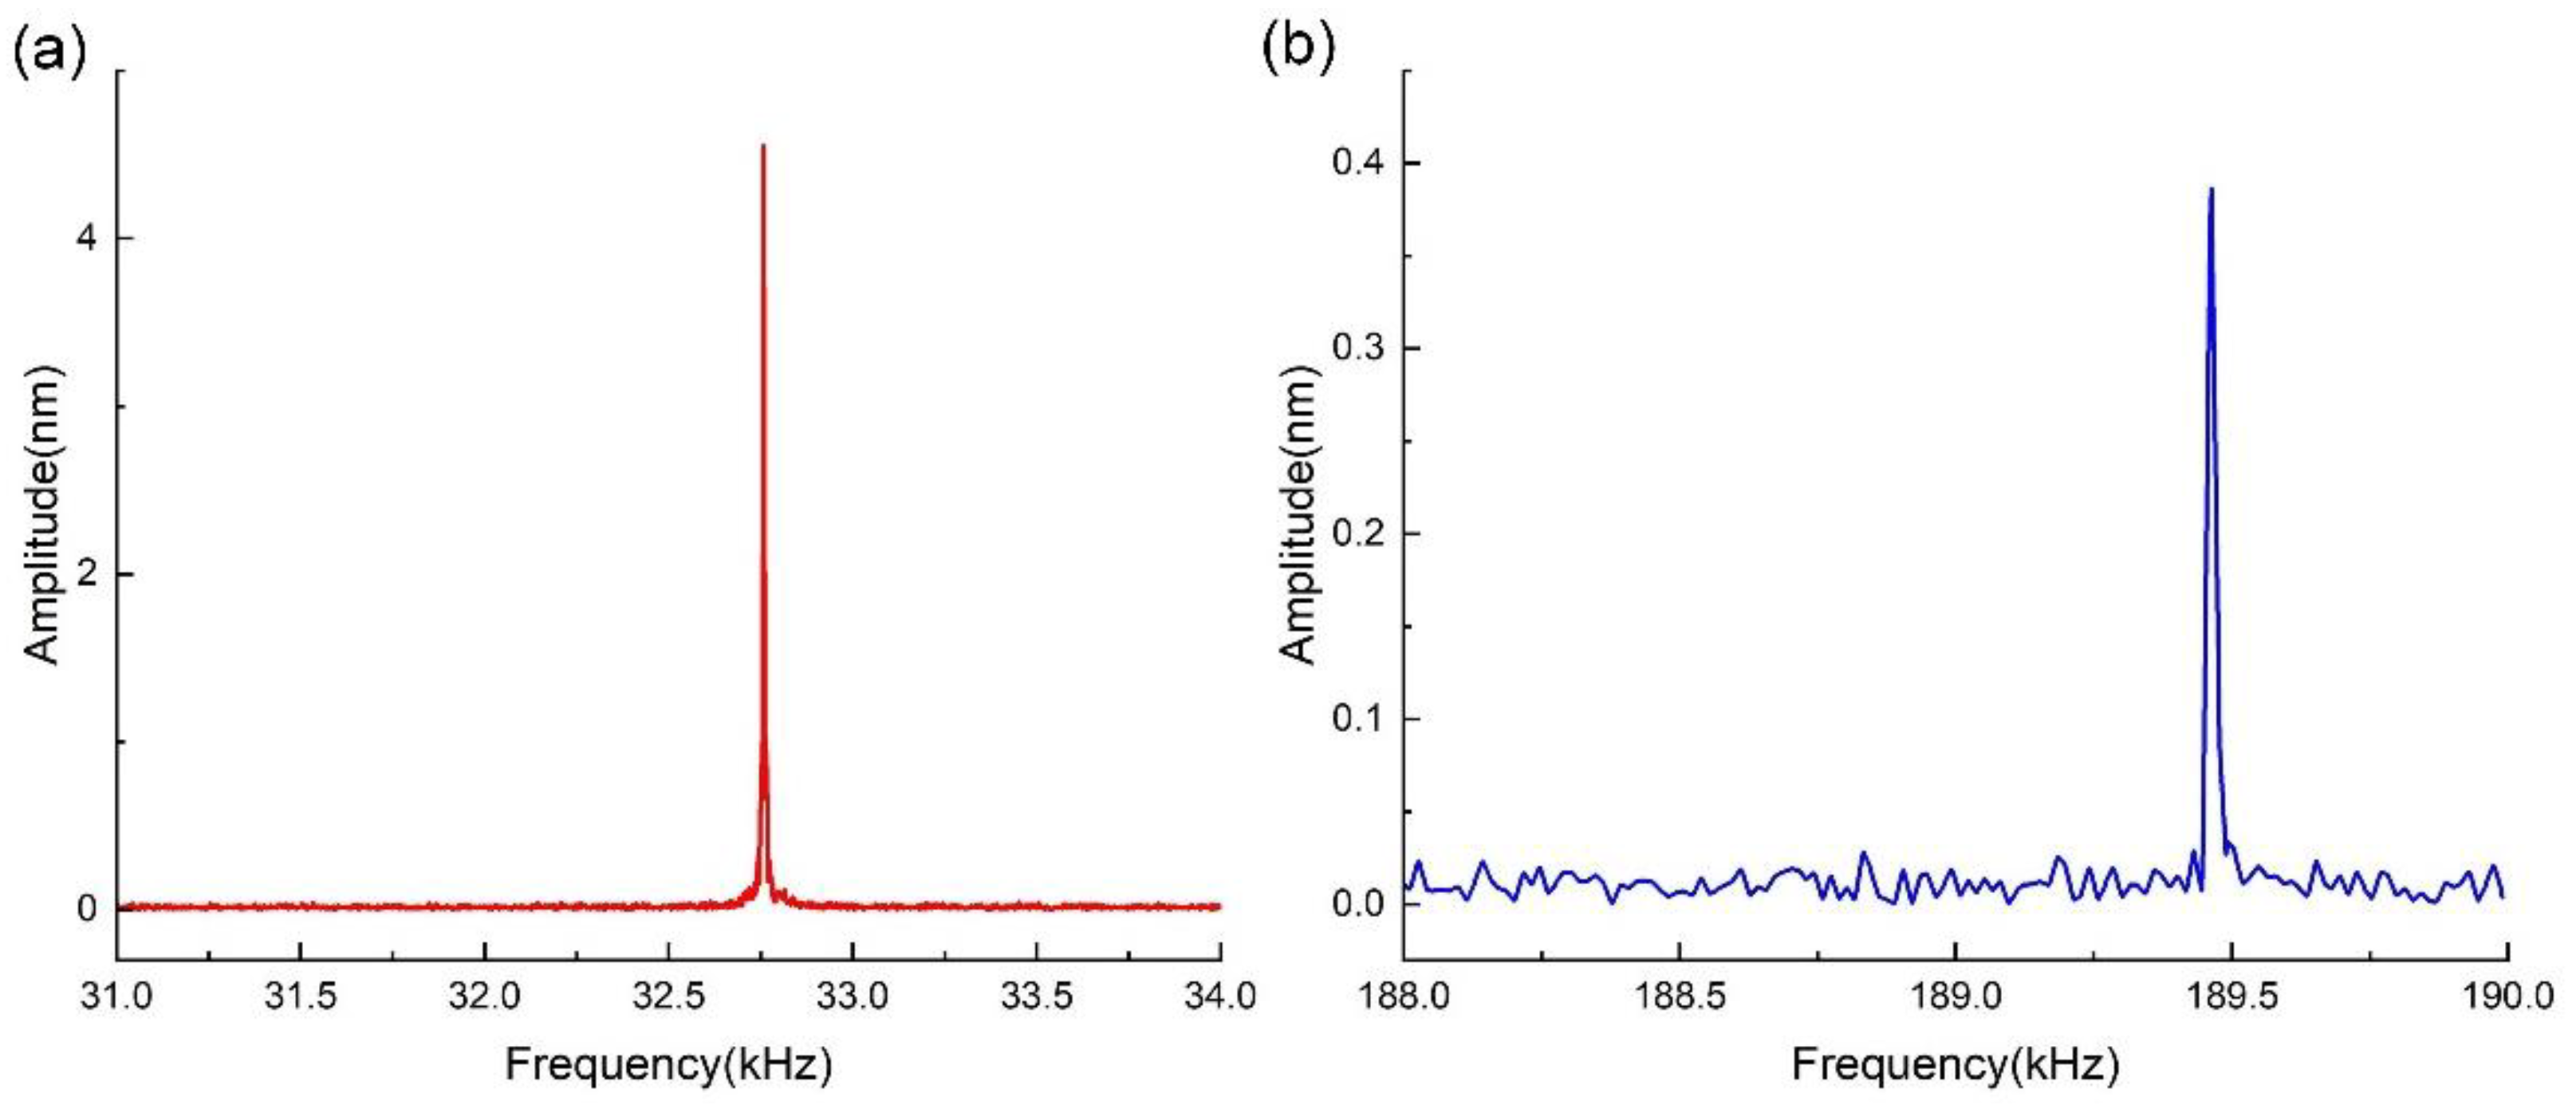
4.2. Dynamic Response Analysis
4.3. Discussion
5. Conclusions
Author Contributions
Funding
Data Availability Statement
Conflicts of Interest
References
- Binnig, G.; Quate, C.F.; Gerber, C. Atomic Force Microscope. Phys. Rev. Lett. 1986, 56, 930–933. [Google Scholar] [CrossRef] [Green Version]
- Abrahamians, J.O.; Van, L.P.; Regnier, S. Contributed Review: Quartz force sensing probes for micro-applications. Rev. Sci. Instrum. 2016, 87, 071502. [Google Scholar] [CrossRef] [Green Version]
- Hida, H.; Shikida, M.; Fukuzawa, K.; Murakami, S.; Sato, K.; Asaumi, K.; Iriye, Y.; Sato, K. Fabrication of a quartz tuning-fork probe with a sharp tip for AFM systems. Sens. Actuators A-Phys. 2008, 148, 311–318. [Google Scholar] [CrossRef]
- Chen, Y.L.; Xu, Y.H.; Shimizu, Y.; Matsukuma, H.; Gao, W. High quality-factor quartz tuning fork glass probe used in tapping mode atomic force microscopy for surface profile measurement. Meas. Sci. Technol. 2018, 29, 065014. [Google Scholar] [CrossRef]
- Zhang, Y.X.; Li, Y.Z.; Song, Z.H.; Lin, R.; Chen, Y.F.; Qian, J.Q. A High-Q AFM Sensor Using a Balanced Trolling Quartz Tuning Fork in the Liquid. Sensors 2018, 18, 1628. [Google Scholar] [CrossRef] [Green Version]
- Kosterev, A.A.; Bakhirkin, Y.A.; Curl, R.F.; Tittel, F.K. Quartz-enhanced photoacoustic spectroscopy. Opt. Lett. 2002, 27, 1902–1904. [Google Scholar] [CrossRef] [Green Version]
- Hu, Y.Q.; Qiao, S.D.; He, Y.; Lang, Z.T.; Ma, Y.F. Quartz-enhanced photoacoustic-photothermal spectroscopy for trace gas sensing. Opt. Express 2021, 29, 5121–5127. [Google Scholar] [CrossRef]
- Martínez, N.F.; Lozano, J.R.; Herruzo, E.T.; Garcia, F.; Richter, C.; Sulzbach, T.; Garcia, R. Bimodal atomic force microscopy imaging of isolated antibodies in air and liquids. Nanotechnology 2008, 19, 384011. [Google Scholar] [CrossRef]
- Jesse, S.; Kalinin S, V.; Proksch, R.; Baddorf, A.P.; Rodriguez, B.J. The band excitation method in scanning probe microscopy for rapid mapping of energy dissipation on the nanoscale. Nanotechnology 2007, 18, 435503. [Google Scholar] [CrossRef] [Green Version]
- Platz, D.; TholénE, A.; Pesen, D.; Haviland, D.B. Intermodulation atomic force microscopy. Appl. Phys. Lett. 2008, 92, 153106. [Google Scholar] [CrossRef] [Green Version]
- Tetard, L.; Passian, A.; Thundat, T. New modes for subsurface atomic force microscopy through nanomechanical coupling. Nat. Nanotechnol. 2010, 5, 105–109. [Google Scholar] [CrossRef]
- Rodriguez B, J.; Callahan, C.; Kalinin, S.V.; Proksch, R. Dual-frequency resonance-tracking atomic force microscopy. Nanotechnology 2007, 18, 475504. [Google Scholar] [CrossRef] [Green Version]
- Garcia, R.; Herruzo, E.T. The emergence of multifrequency force microscopy. Nat. Nanotechnol. 2012, 7, 217–226. [Google Scholar] [CrossRef] [Green Version]
- Giessibl, F.J. High-speed force sensor for force microscopy and profilometry utilizing a quartz tuning fork. Appl. Phys. Lett. 1998, 73, 3956–3958. [Google Scholar] [CrossRef]
- Tung, R.C.; Wutscher, T.; Martinez-Martin, D.; Reifenberger, R.G.; Giessibl, F.; Raman, A. Higher-order eigenmodes of qPlus sensors for high resolution dynamic atomic force microscopy. J. Appl. Phys. 2010, 107, 104508. [Google Scholar] [CrossRef] [Green Version]
- Oria, R.; Otero, J.; Gonzalez, L.; Botaya, L.; Carmona, M.; Puig-Vidal, M. Finite Element Analysis of Electrically Excited Quartz Tuning Fork Devices. Sensors 2013, 13, 7156–7169. [Google Scholar] [CrossRef] [Green Version]
- Gonzalez, L.; Oria, R.; Botaya, L.; Puig-Vidal, M.; Otero, J. Determination of the static spring constant of electrically-driven quartz tuning forks with two freely oscillating prongs. Nanotechnology 2015, 26, 055501. [Google Scholar] [CrossRef]
- Gao, F.L.; Li, X.D. Research on the Sensing Performance of the Tuning Fork-Probe as a Micro Interaction Sensor. Sensors 2015, 15, 24530–24552. [Google Scholar] [CrossRef]
- Lee, M.; Kim, B.; An, S.; Jhe, W. Dynamic Responses of Electrically Driven Quartz Tuning Fork and qPlus Sensor: A Comprehensive Electromechanical Model for Quartz Tuning Fork. Sensors 2019, 19, 2686. [Google Scholar] [CrossRef] [Green Version]
- Kim, B.; Jahng, J.; Khan, R.M.; Park, S.; Potma, E.O. Eigenmodes of a quartz tuning fork and their application to photoinduced force microscopy. Phys. Rev. B 2017, 95, 075440. [Google Scholar] [CrossRef] [Green Version]
- Zhang, X.F.; Gao, F.L.; Li, X.D. Sensing Performance Analysis on Quartz Tuning Fork-Probe at the High Order Vibration Mode for Multi-Frequency Scanning Probe Microscopy. Sensors 2018, 18, 336. [Google Scholar] [CrossRef] [Green Version]
- Chen, K.; Liu, Z.; Xie, Y.; Zhang, C.; Xu, G.; Song, W.; Xu, K. Numerical analysis of vibration modes of a qPlus sensor with a long tip. Beilstein J. Nanotechnol. 2021, 12, 82–92. [Google Scholar] [CrossRef]
- Dagdeviren, O.E.; Miyahara, Y.; Mascaro, A.; Enright, T.; Grutter, P. Amplitude Dependence of Resonance Frequency and its Consequences for Scanning Probe Microscopy. Sensors 2019, 19, 4510. [Google Scholar] [CrossRef] [Green Version]
- Castellanos-Gomez, A.; Agrait, N.; Rubio-Bollinger, G. Force-gradient-induced mechanical dissipation of quartz tuning fork force sensors used in atomic force microscopy. Ultramicroscopy 2011, 111, 186–190. [Google Scholar] [CrossRef] [Green Version]
- Labardi, M.; Lucchesi, M. Split quartz tuning fork sensors for enhanced sensitivity force detection. Meas. Sci. Technol. 2015, 26, 035101. [Google Scholar] [CrossRef]
- Naber, A. The tuning fork as sensor for dynamic force distance control in scanning near-field optical microscopy. J. Microsc.-Oxf. 1999, 194, 307–310. [Google Scholar] [CrossRef] [Green Version]
- Hua, B.C.; Qian, J.Q.; Wang, X.; Yao, J.E. Mechanical model of tuning forks used in scanning probe microscopes. Acta Phys. Sin. 2011, 60, 040702. [Google Scholar]
- Jahng, J.; Potma, E.O.; Lee, E.S. Tip-Enhanced Thermal Expansion Force for Nanoscale Chemical Imaging and Spectroscopy in Photoinduced Force Microscopy. Anal. Chem. 2018, 90, 11054–11061. [Google Scholar] [CrossRef]


| Parameters | Value (Unit: mm) |
|---|---|
| lb | 2.18 |
| b | 1.40 |
| t | 0.31 |
| l | 3.59 |
| w | 0.56 |
| Mode No. | Frequency/kHz | Mode No. | Frequency/kHz |
|---|---|---|---|
| 1 | 8.939 | 7 | 117.55 |
| 2 | 16.443 | 8 | 137.50 |
| 3 | 26.796 | 9 | 137.81 |
| 4 | 31.380 | 10 | 162.53 |
| 5 | 51.122 | 11 | 183.39 |
| 6 | 82.308 | 12 | 215.76 |
| Parameters | Calculation | Harmonic Simulation |
|---|---|---|
| f1/kHz | 31.38 | 31.38 |
| f2/kHz | 183.39 | 183.40 |
| Q1 | 7839 | 7550 |
| Q2 | 11,520 | 12,694 |
| A1/A2 | 11.95 | 11.41 |
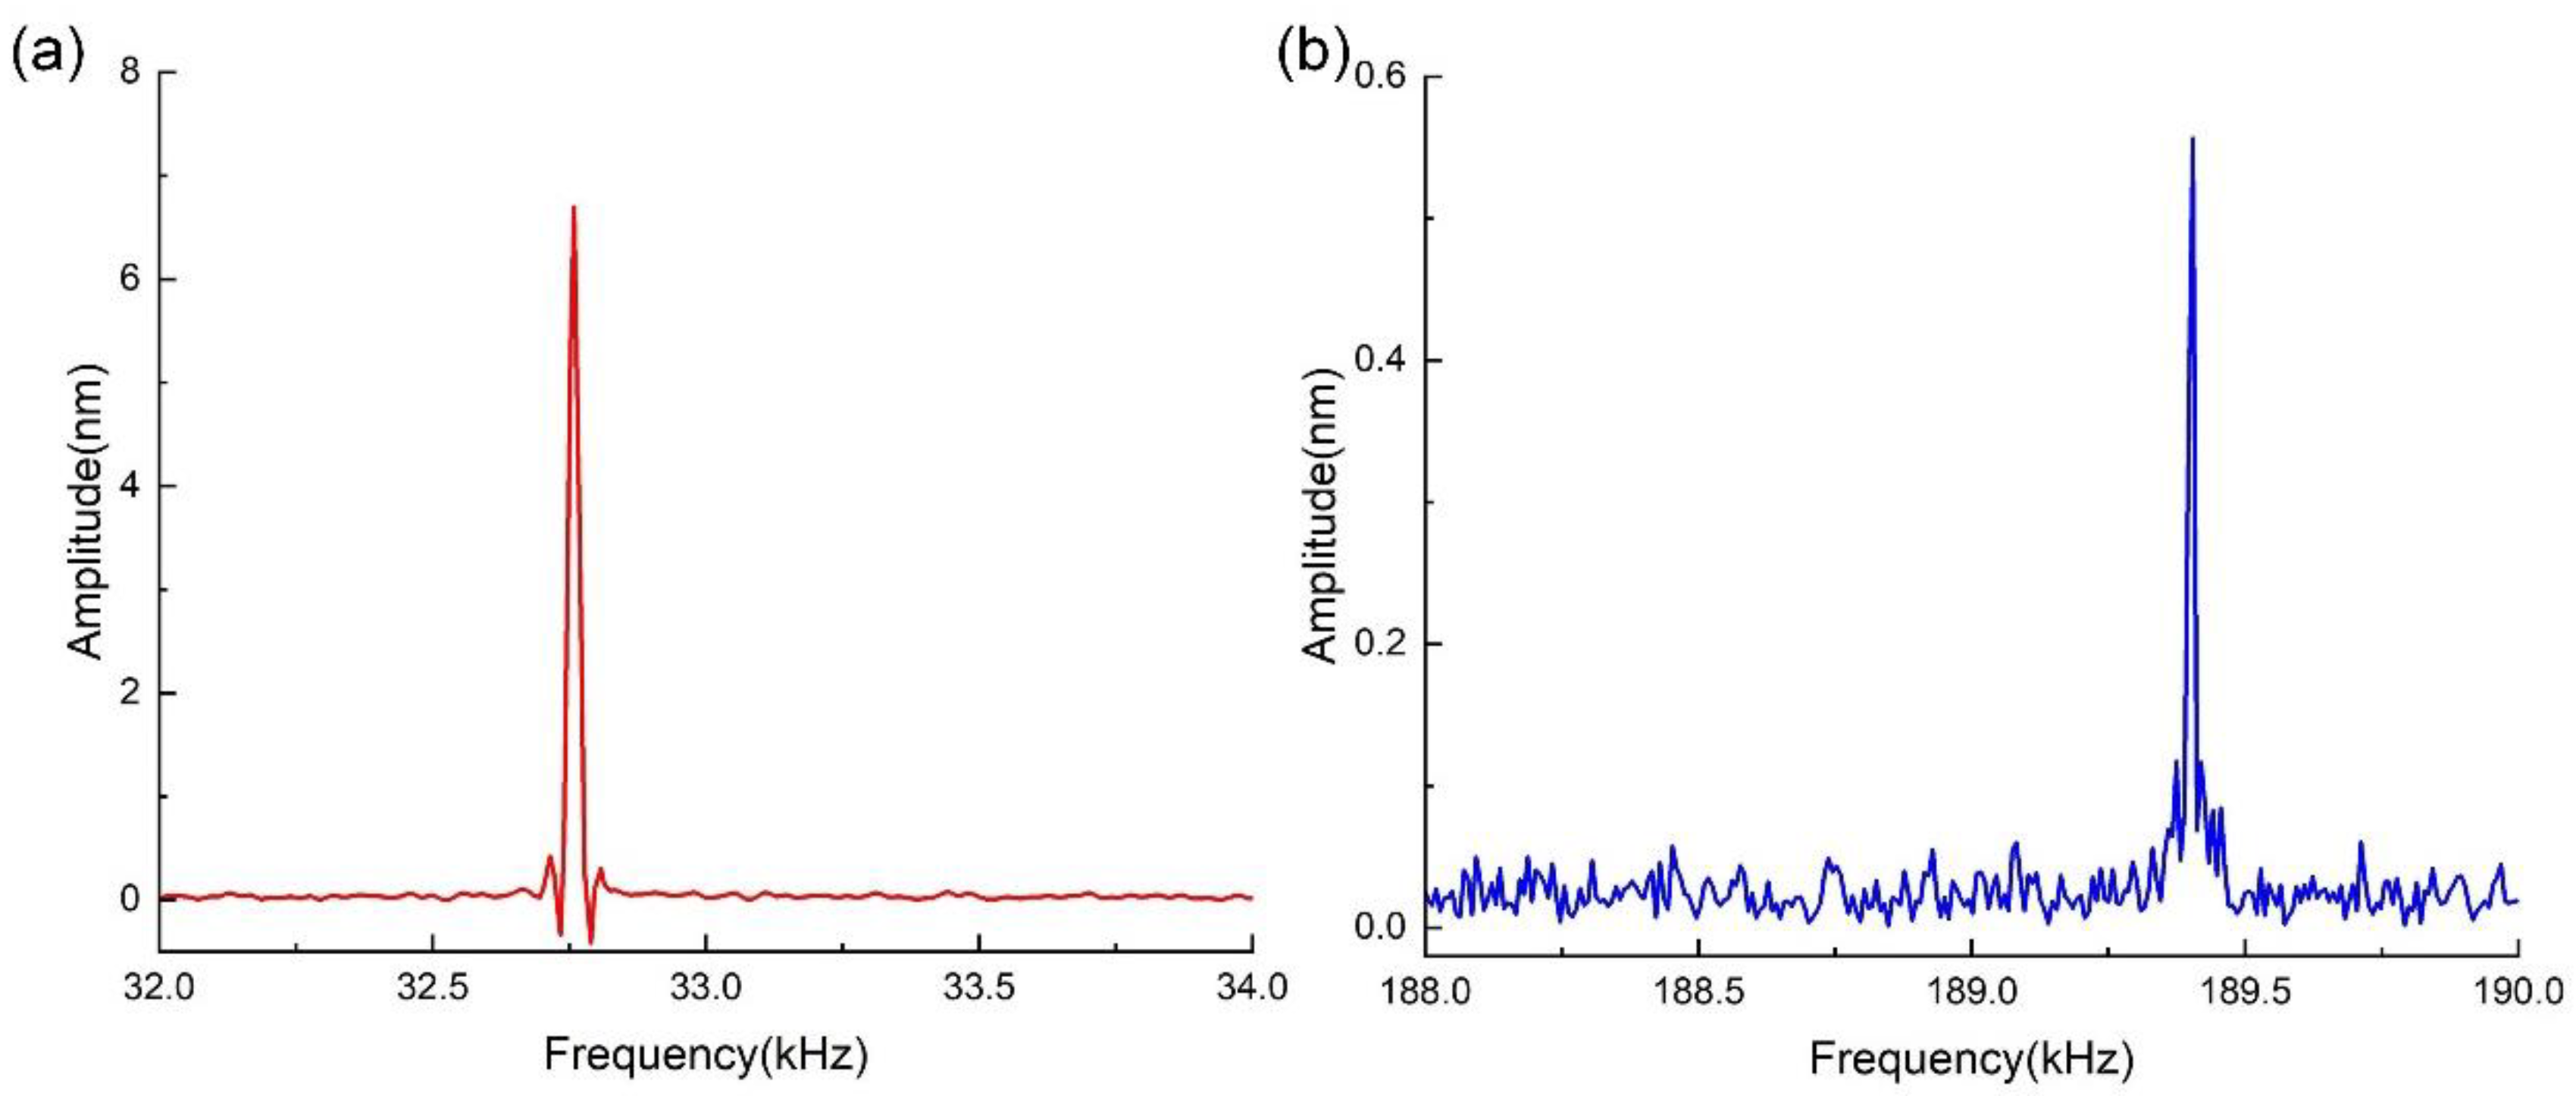
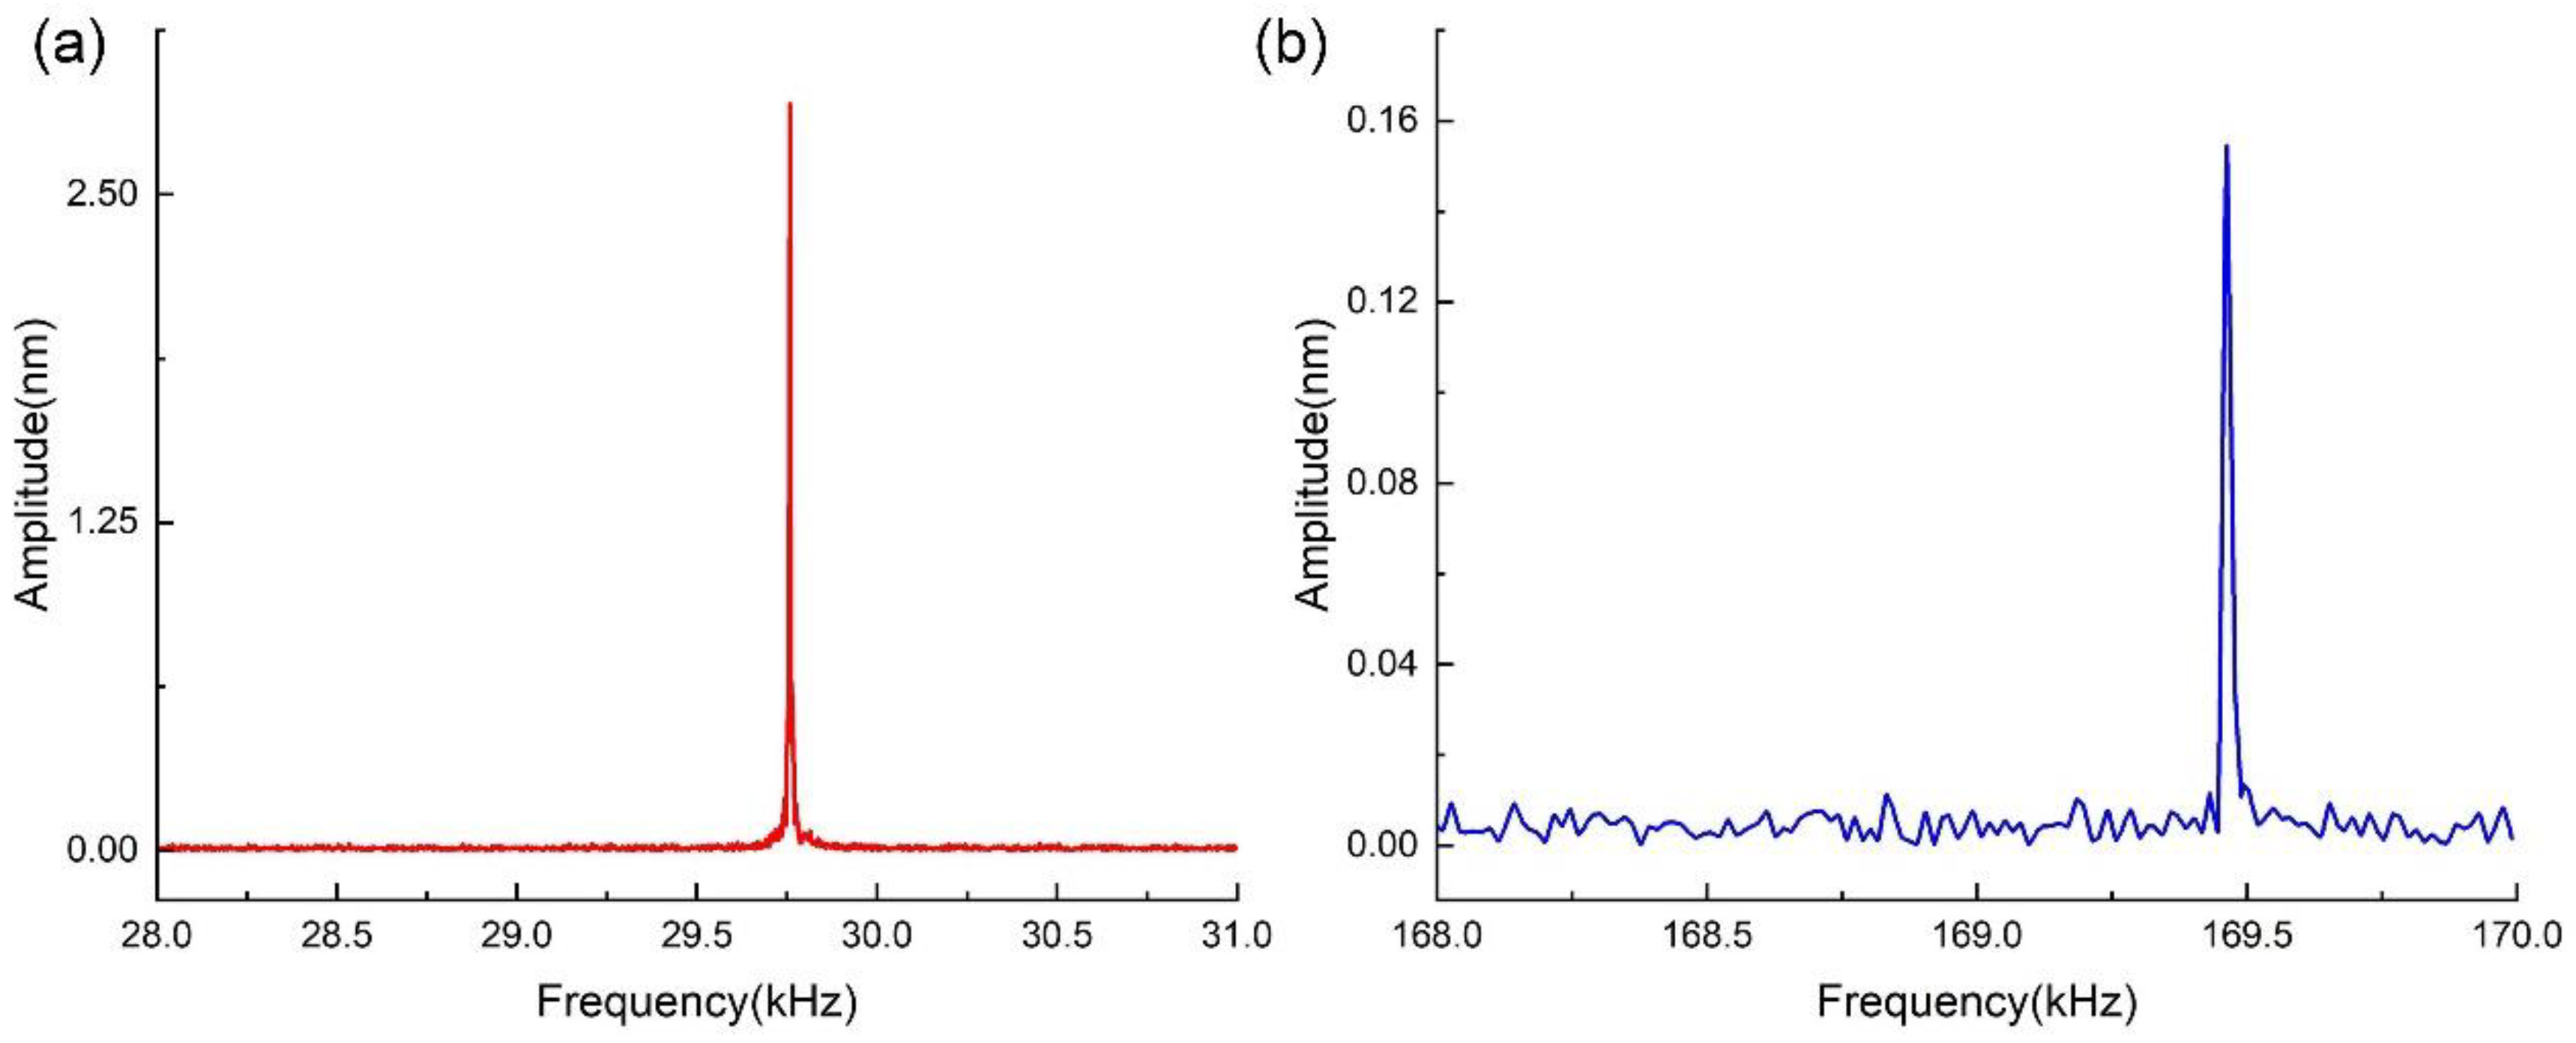
| Parameters | Calculation | Simulation | Test 1 | Test 2 | Test 3 |
|---|---|---|---|---|---|
| f1/kHz | 31.38 | 31.38 | 32.758 | 32.759 | 29.755 |
| f2/kHz | 183.39 | 183.40 | 189.463 | 189.404 | 169.485 |
| Q1 | 7839 | 7550 | 8190 | 8120 | 5110 |
| Q2 | 11,520 | 12,694 | 11,710 | 17,376 | 8527 |
| A1/A2 | 11.95 | 11.41 | 11.79 | 12.04 | 18.47 |
Disclaimer/Publisher’s Note: The statements, opinions and data contained in all publications are solely those of the individual author(s) and contributor(s) and not of MDPI and/or the editor(s). MDPI and/or the editor(s) disclaim responsibility for any injury to people or property resulting from any ideas, methods, instructions or products referred to in the content. |
© 2023 by the authors. Licensee MDPI, Basel, Switzerland. This article is an open access article distributed under the terms and conditions of the Creative Commons Attribution (CC BY) license (https://creativecommons.org/licenses/by/4.0/).
Share and Cite
Lin, R.; Qian, J.; Li, Y.; Cheng, P.; Wang, C.; Li, L.; Gao, X.; Sun, W. Equivalent Electromechanical Model for Quartz Tuning Fork Used in Atomic Force Microscopy. Sensors 2023, 23, 3923. https://doi.org/10.3390/s23083923
Lin R, Qian J, Li Y, Cheng P, Wang C, Li L, Gao X, Sun W. Equivalent Electromechanical Model for Quartz Tuning Fork Used in Atomic Force Microscopy. Sensors. 2023; 23(8):3923. https://doi.org/10.3390/s23083923
Chicago/Turabian StyleLin, Rui, Jianqiang Qian, Yingzi Li, Peng Cheng, Cheng Wang, Lei Li, Xiaodong Gao, and Wendong Sun. 2023. "Equivalent Electromechanical Model for Quartz Tuning Fork Used in Atomic Force Microscopy" Sensors 23, no. 8: 3923. https://doi.org/10.3390/s23083923