Article

State Evaluation of Self-Powered Wireless Sensors Based on a Fuzzy Comprehensive Evaluation Model

1
China Electric Power Research Institute Co., Ltd., Beijing 100192, China
2
State Grid Jiangxi Electric Power Co., Ltd., Power Supply Service Management Center, Nanchang 330032, China
3
College of Optoelectronic Engineering, Chongqing University, Chongqing 400044, China
*
Author to whom correspondence should be addressed.
Sensors 2023, 23(22), 9267; https://doi.org/10.3390/s23229267
Submission received: 11 October 2023 / Revised: 1 November 2023 / Accepted: 9 November 2023 / Published: 18 November 2023
(This article belongs to the Special Issue Sensors for Fault Detection and Condition Monitoring)

Abstract

:
The energy harvesters used in self-powered wireless sensing technology, which has the potential to completely solve the power supply problem of the sensing nodes from the source, usually require mechanical movement or operate in harsh environments, resulting in a significant reduction in device lifespan and reliability. Therefore, the influencing factors and failure mechanisms of the operating status of self-powered wireless sensors were analyzed, and an innovative evaluation index system was proposed, which includes 4 primary indexes and 13 secondary indexes, including energy harvesters, energy management circuits, wireless communication units, and sensors. Next, the weights obtained from the subjective analytic hierarchy process (AHP) and objective CRITIC weight method were fused to obtain the weights of each index. A self-powered sensor evaluation scheme (FE-SPS) based on fuzzy comprehensive evaluation was implemented by constructing a fuzzy evaluation model. The advantage of this scheme is that it can determine the current health status of the system based on its output characteristics. Finally, taking vibration energy as an example, the operational status of the self-powered wireless sensors after 200 h of operation was comprehensively evaluated. The experimental results show that the test self-powered wireless sensor had the highest score of “normal”, which is 0.4847, so the evaluation result was “normal”. In this article, a reliability evaluation strategy for self-powered wireless sensor was constructed to ensure the reliable operation of self-powered wireless sensors.

1. Introduction

With the penetration of the Internet of Things technology into every aspect of our lives, especially in various fields such as the home [1], manufacturing [2], medical [3], retail [4], and agriculture [5], wireless sensor nodes are also widely used, and the accompanying power supply issues are becoming increasingly prominent. The emergence of self-powered sensors has brought a new approach to this issue beyond battery power supply. Self-powered sensors collect energy from environments such as magnetic fields, electric fields [6], vibrations [7], and solar energy [8], and efficiently utilize energy through energy management circuits [9], effectively solving some power supply problems.
However, due to the characteristics of its mechanical structure and the impact of the operating environment, the reliability of self-powered wireless sensors gradually decreases over time during long-term operation, and can even not function properly. Self-powered sensors typically consist of energy collectors, energy management circuits, communication circuits, and sensors [10]. At present, most environmental micro-energy collectors mainly rely on mechanical motion for energy collection, and they may inevitably suffer mechanical damage or even failure during long-term use [11], leading to a decrease in the reliability of energy collection. Self-powered sensors typically require long-term use in environments with a strong electromagnetic [12], humidity [13], and high temperature [14]. Energy management circuits, due to their electrical characteristics, may suffer certain harm when used in harsh environments for a long time, thereby reducing the energy conversion efficiency of energy management circuits [15] and making the output power unstable [16]. Poor environments may reduce communication performance such as wireless communication distance [17]. For commonly used sensors such as temperature [18], pressure [19], and acceleration [20], environmental factors may also lead to a decrease in measurement accuracy and a change in measurement range. However, there are currently no complete and scientific evaluation indexes and comprehensive evaluation methods for self-powered wireless sensors. Most scholars only evaluate the various parts of self-powered wireless sensors [21,22,23,24,25], unable to make scientific and effective judgments on the operating status of self-powered wireless sensors that have been running for a long time, and thus unable to repair and replace them in a timely manner, resulting in the reliability and integrity of user data.
In response to the above issues, the FE-SPS evaluation method proposed in this article aims to fill the gap in the comprehensive evaluation method for the operational status of self-powered wireless sensors. By conducting reliability research based on actual operational data and expert experience from four aspects, i.e., energy harvesters, energy management circuits, wireless communication units, and temperature sensors, a common, simple, scientific, and complete evaluation system and model are constructed to make the evaluation results more accurate and closer to the actual situation. This model can provide timely supplementary suggestions for operation and maintenance personnel, and has reasonable engineering practicality.
This paper is divided into six parts: the first part is the introduction and the second part summarizes the general idea of the FE-SPS evaluation method. The third part introduces the construction of self-powered wireless sensor index system; the fourth part describes the index weighting method of subjective and objective fusion; the fifth part shows in detail the comprehensive evaluation process and experiment of self-powered wireless sensor based on fuzzy evaluation. The sixth part is the conclusion.

2. FE-SPS Evaluation Method

Figure 1 shows the overall block diagram of the FE-SPS evaluation method, which is divided into three steps. Step 1: By analyzing the factors affecting the status and failure mechanism of the self-powered wireless sensor, and selecting the key indexes according to the failure mechanism, the key index system including 4 first-level indexes and 13 second-level indexes was constructed. Step 2: Under the premise of considering subjective and objective weights, the nine-level scale analytic hierarchy process (AHP) and CRITIC weight method were integrated to obtain more comprehensive and scientific evaluation results. Step 3: The factor set and evaluation set were constructed according to the first-level index and the actual experiment scene, and then the corresponding membership degree model was constructed according to the attributes of each index to solve the membership degree matrix, and the membership degree matrix was fused with the fusion weight to obtain the evaluation result.

3. Construction of the Failure Mechanism and Index System of the Self-Powered Wireless Sensor

Self-powered wireless sensors can capture weak energy in the environment and convert it into usable energy.
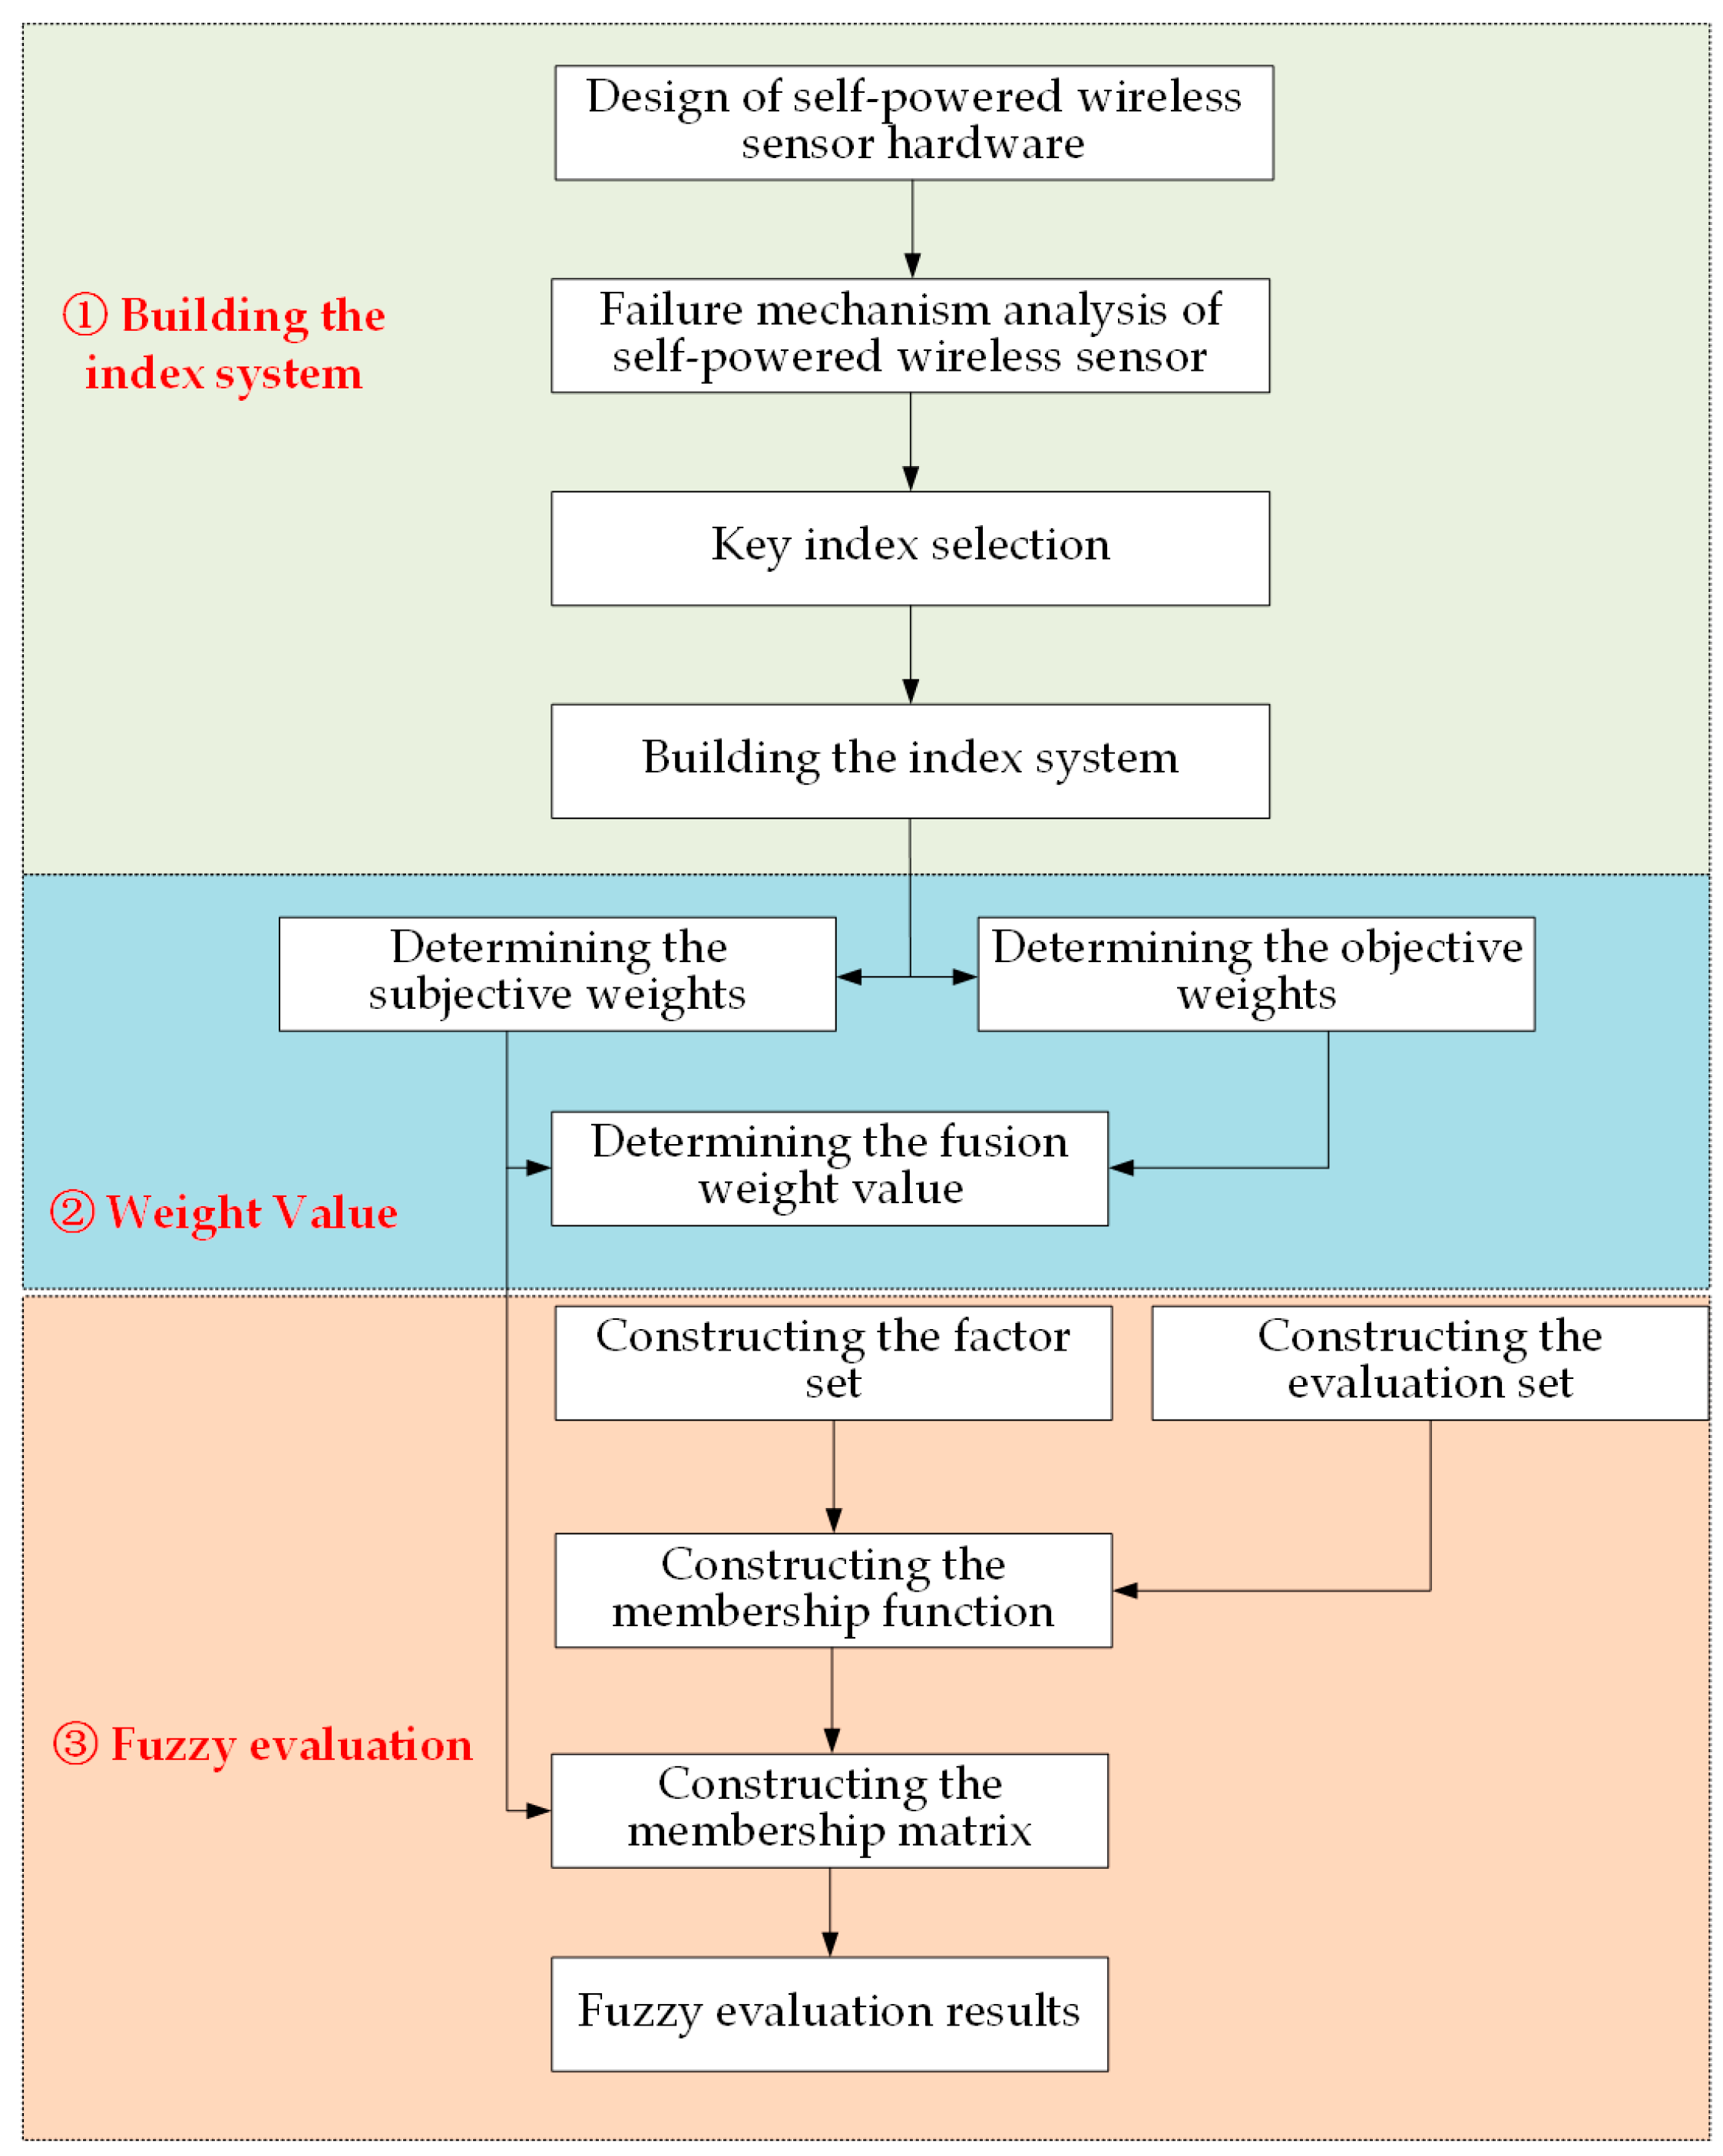
Due to the differences in the environmental energy and circuit methods used, various self-powered sensor systems need to include four parts: energy harvester, energy management circuit, communication mode, and a sensor to achieve the basic self-powered sensing function. Here, a research idea for the state evaluation of self-powered wireless sensors was presented, which could be modified according to the actual equipment used, and the linear vibration energy harvester was taken as an example to carry out related research.

3.1. Design of Self-Powered Wireless Sensors

3.1.1. Hardware Design of Self-Powered Wireless Sensors

The vibration energy harvester used in this article is an electromagnetic linear vibration energy harvester. Compared to piezoelectric and friction nanomotors, the electromagnetic vibration energy harvester has the characteristics of high output power and simple structure, which is easy to process. Figure 2 is the schematic diagram of the vibration energy harvester in this article, which uses a magnet to move back and forth to cut the magnetic induction line and generate energy. Its diameter is 21 mm, height 96 mm, and weight 85 g.

3.1.2. Energy Management Circuit, Wireless Communication Unit, Sensor

Figure 3 shows the design frame diagram and the physical diagram of the self-powered wireless sensor. The test results show that the open-circuit voltage, short-circuit current, and maximum output power of the electromagnetic vibration energy collector were 1.84 V, 12.64 mA, and 23.26 mW, respectively. Therefore, we chose the micro energy chip BQ25570 with a startup voltage as low as 600 mV as the front end of the vibration energy collection circuit to collect and boost the weak vibration energy to 3.6 V. It should be noted that the input of BQ25570 is alternating current (AC) energy, and the AC signal needs to be converted into a direct current (DC) pulsation signal through a rectification circuit. Then, a filtering capacitor CL was used to convert the DC pulsation signal into a DC signal. The capacitor CAP was used to store energy. When the stored energy reached the preset voltage, LTC2935 reset the microprocessor, and then the microprocessor enabled the DS18B20 and Lora module. LTC2935 was used for energy monitoring because the micro-energy in the environment cannot always meet the real-time wireless communication, which requires the energy to be stored and then released to power the load. Here, we used a supercapacitor of 0.33 μF.

3.1.3. Construction of the Testing Platform

In order to evaluate the output capability of self-powered wireless sensors after long-term operation, an experimental platform was built as shown in Figure 4, consisting of a vibration energy harvester, energy management circuit, vibration table, oscilloscope, and digital multimeter. Firstly, the vibration energy harvester was installed on the vibration table, which vibrated back and forth at a speed of 270 mm/s. Then, the digital multimeter was connected to the circuit in a series to measure the output current of the vibration energy harvester, while the oscilloscope was used to measure the voltage value at the moment. The temperature sensor was used to collect the temperature of the indoor environment, and transmits the data to the PC through the Lora wireless communication module for data storage. Among them, the test platform ran for 4 h a day, and a total of 200 h of data needed to be collected. The index parameters of the self-powered wireless sensor were measured every two hours, and the test location was Chongqing University, from June to July 2022.

3.2. Failure Mechanism and Key Indexes of the Vibration Energy Harvester

From Figure 2 and 
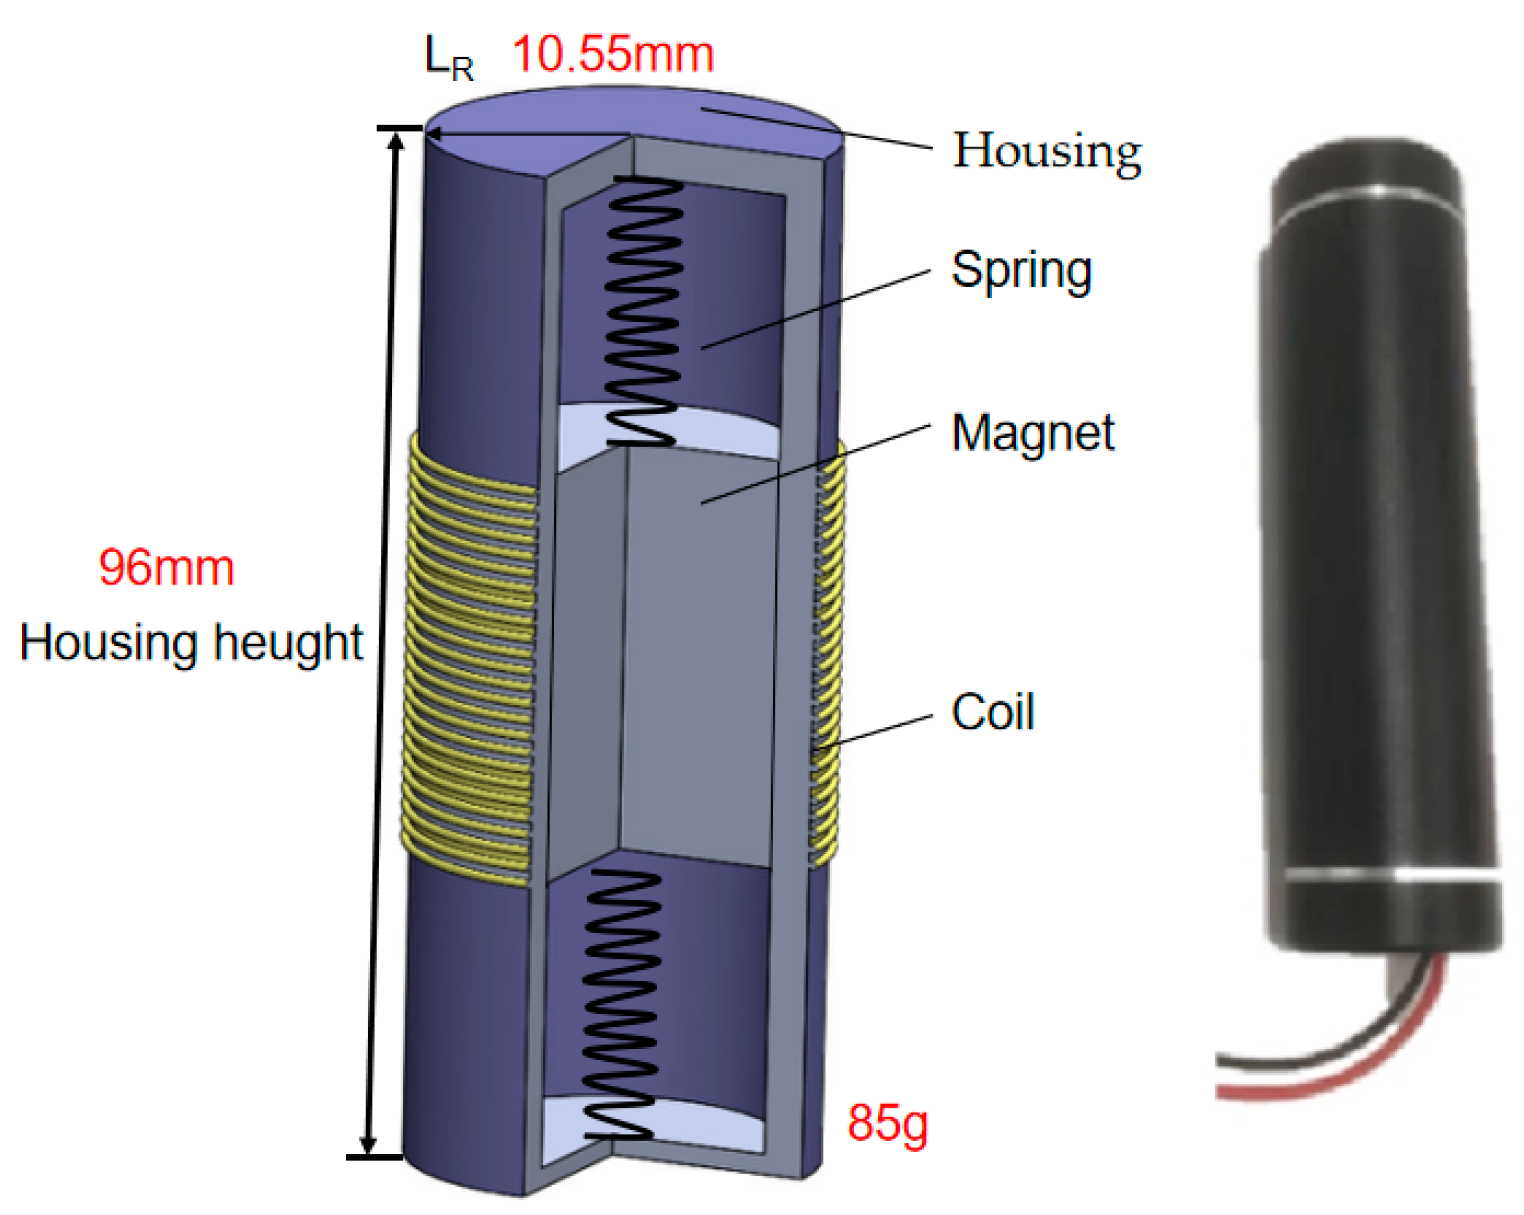
Figure 4, it can be seen that energy is generated by the back-and-forth movement of the internal magnet of the collector under the traction of the spring, cutting the magnetic induction line. This infers that the obstructed movement path of the magnet or changes in the spring’s elastic coefficient will affect the output of the energy harvester, and the repeated mechanical movements will cause wear and tear on the internal structure of the vibration energy harvester. If any connection between the shell, spring, and magnet breaks, it will cause the failure of the vibration energy harvester.
Due to the complete package of the energy harvester, the mechanical properties of the internal structure of the collector cannot be directly detected, but the health of the energy harvester can be inferred by measuring its electrical properties through the “black box principle”. Among them, changes in the impedance of the spring, shell–spring–magnet connection point, magnet, and coil can cause changes in the open circuit voltage, short circuit current, and equivalent impedance output power of the energy harvester. Based on these four parameters, the following indexes can be obtained:
1.
Open-circuit voltage deviation rate
The open-circuit voltage is used to reflect the highest voltage that the energy harvester can output, which is related to the vibration frequency and amplitude. When the vibration frequency and amplitude are the same, the open-circuit voltage of the same batch of energy harvesters should be equal. However, when internal components are damaged or fail, the open circuit voltage will change. If the open circuit voltage is too small, it will not be able to start the energy management circuit, and if it is too large, it may breakdown the energy management circuit. Therefore, the open-circuit voltage deviation rate is introduced here as one of the indexes to evaluate the health status of the energy harvester, which can be expressed by Formula (1):
σ E V = V 0 V t V 0 × 100 %
In the formula, σ E V is the open-circuit voltage deviation rate, V 0 refers to the open circuit voltage of the energy harvester at the factory, and V t is the open-circuit voltage of the energy harvester during testing.
2.
Short-circuit current deviation rate
The short-circuit current is used to reflect the maximum current that the energy harvester can output, which is affected by the vibration frequency and amplitude, as well as the load carrying capacity. If the short-circuit current is too small, it cannot drive the subsequent load. If internal components are damaged, their output capacity will change. The short-circuit current deviation rate is introduced as one of the indexes to evaluate the health status of the energy harvester, which can be expressed as:
σ E I = I 0 I t I 0 × 100 %
where σ E I is the short-circuit current deviation rate, I 0 refers to the short-circuit current of the energy harvester at the factory, and I t is the short-circuit current of the energy harvester during testing.
3.
Equivalent impedance deviation rate
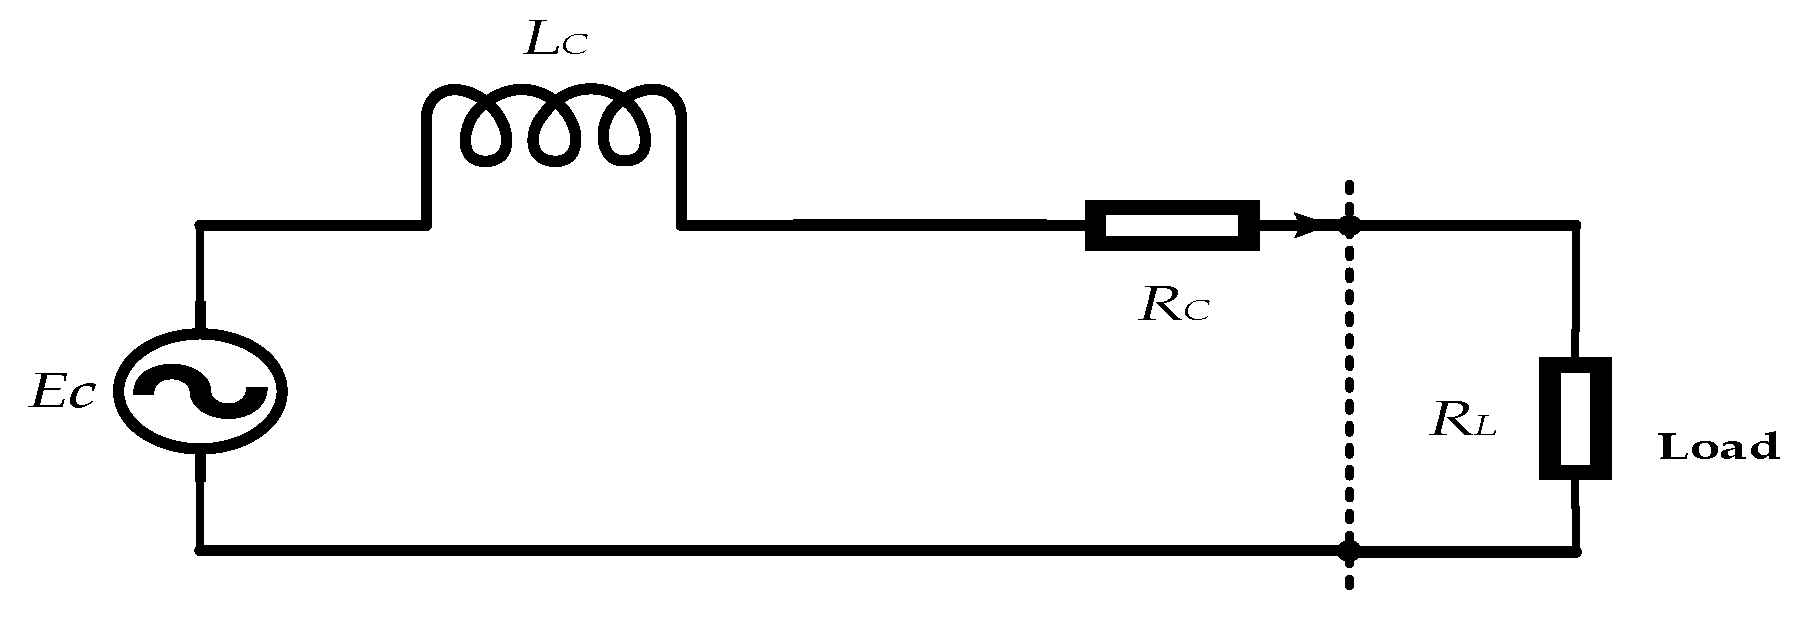
When self-powered wireless sensors leave the factory, impedance matching is often performed to ensure that the vibration energy harvester can output at maximum power, where the input impedance of the energy management circuit is equal to the output impedance of the energy harvester. However, when damage occurs inside the energy harvester, the equivalent impedance changes, resulting in a significant decrease in the output capacity of the vibration energy harvester. As shown in Figure 5, the equivalent circuit diagram of the vibration energy harvester is composed of equivalent inductance and equivalent resistance. The vibration energy harvester in this article was mainly used in the application scenario of transmission lines, with a low vibration frequency of 3 Hz–120 Hz. Therefore, the parameter that mainly affects the output performance of the vibration energy harvester is RC, and LC can be ignored. Here, the equivalent impedance deviation rate is introduced, which can be expressed by:
σ E B = R 0 R t R 0 × 100 %
In the formula, σ E B is the bandwidth deviation rate, R 0 is the resistance of the vibration energy harvester at the factory, and R t is the resistance of the energy harvester during testing.
4.
Output power stability
The output power is the product of the output voltage and current of the energy harvester under constant load conditions. Although the open circuit voltage and short circuit current may change when there is some internal damage, if the output power is stable within a certain range, it can still provide stable electricity for subsequent circuits. Therefore, the output power stability is introduced to describe the output energy stability of the energy harvester, which can be expressed as:
φ E = P max p min P ¯ × 100 %
In the formula, φ E is the stability of the output power of the energy harvester, P max is the maximum output power over a period of time, P min is the minimum output power during this period, and P ¯ is the average output power during this period.

3.2.1. Ability to Manage Circuit Failure Mechanisms and Key Indexes

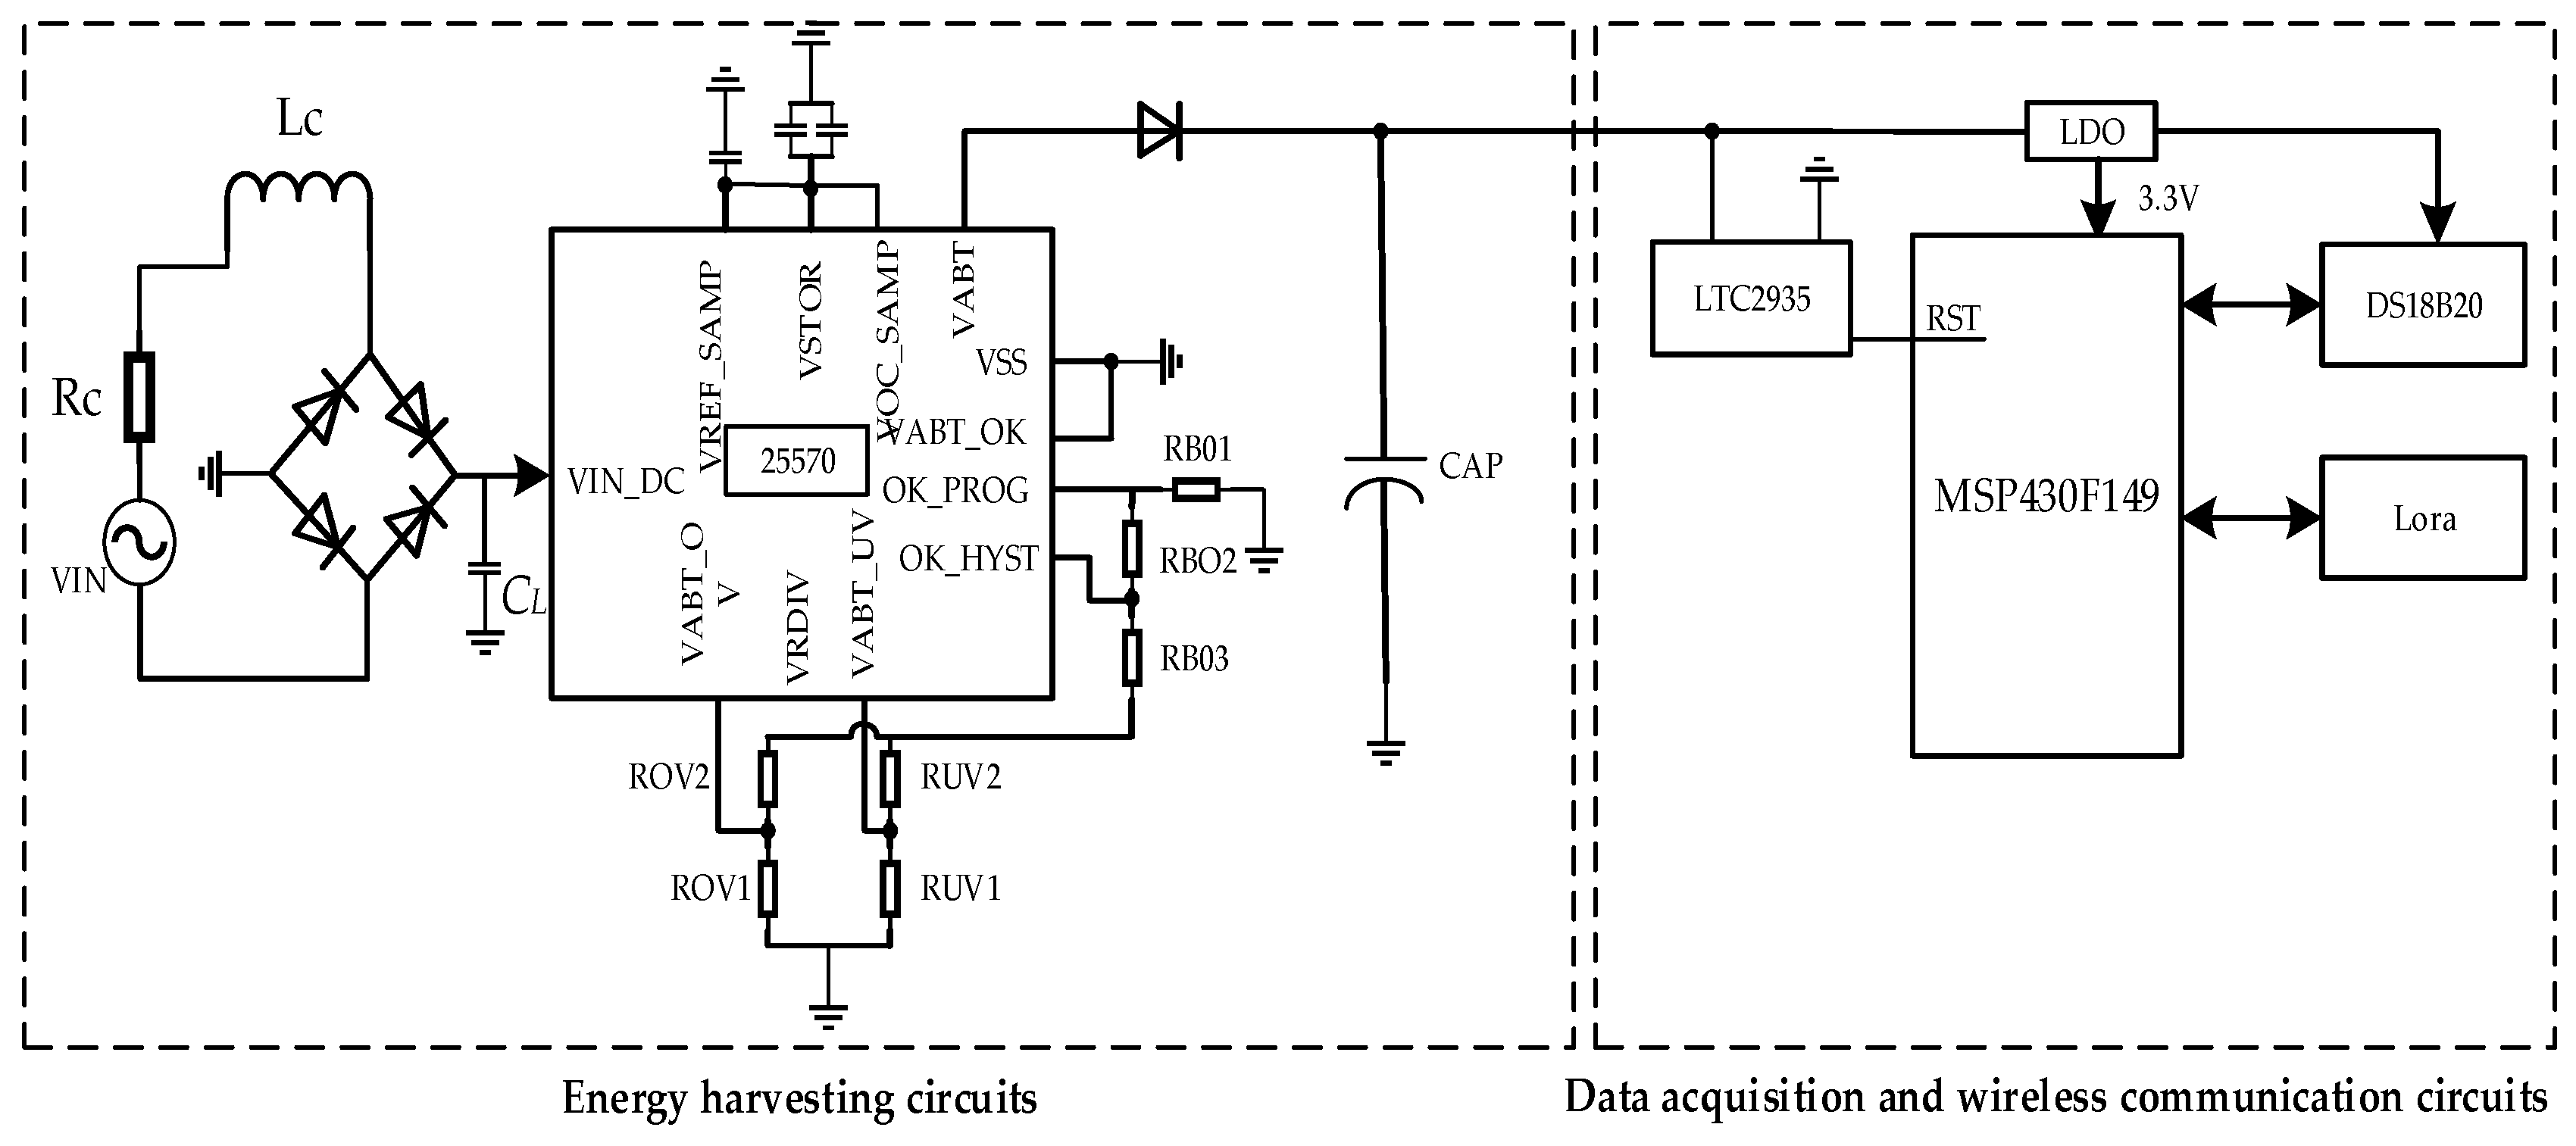
The main function of the energy management circuit is to collect the energy captured by the vibration energy harvester, and boost and store the weak energy. After stabilizing, it provides energy for sensors, microprocessors, and communication modules. Therefore, energy management circuits typically include environmental energy collection units, boost units, and voltage stabilizing circuits. If the self-powered sensor operates in environments such as high temperature, high temperature, high voltage, high electromagnetic, etc., for a long time, it is likely to cause cracks in the circuit packaging, dust layer in the air, water vapor, electromagnetic interference, and other factors can cause changes in the circuit capacitance and resistance, and even cause short circuits and circuit failure. Therefore, the running state of the energy management circuit can be described according to the following three indexes, including output voltage stability, output power stability and energy conversion efficiency.
1.
Output voltage stability
The stability of the output voltage of the energy management circuit is a necessary condition to ensure the accuracy of sensors, microprocessors, and wireless communication units, especially for analog sensors that require an analog-to-digital converter (ADC) for data collection. If the reference voltage of the ADC is unstable, it will greatly reduce the accuracy of the sensor. In addition, voltage instability can also lead to the misjudgment of microprocessors and increase the bit error rate and packet loss rate of wireless communication units. Therefore, the output voltage stability is introduced to evaluate the reliability of the energy management circuit, which can be expressed by the following formula:
σ C V = Δ V V ¯ × 100 %
In the formula, σ C V represents the stability of the output voltage over a period of time, Δ V is the range of output voltage of the energy pipeline circuit over a period of time, and V ¯ is the average value of the output voltage during this period.
2.
Circuit output power stability
The power stability of energy management circuits is similar to the definition of the power stability of energy harvesters, both of which are used to describe the degree of dispersion of the output power deviation from the average power value within a certain period of time. The stability of circuit output power is a necessary condition to ensure the normal and stable operation of sensors, microprocessors, and wireless communication units. Therefore, the concept of the output power stability is introduced for the energy management circuit, which can be expressed as:
φ C = P max p min P ¯ × 100 %
where φ C is the output power stability of the energy management circuit, P max is the maximum output power over a period of time, and P min is the minimum output power during this period.
3.
Energy conversion efficiency
Energy conversion efficiency, as one of the most important parameters for various energy collection chips, is naturally one of the key indexes for evaluating self-powered sensors. It can reflect the conversion efficiency of the management circuit in converting input energy into effective energy, and its expression is:
η C = P out P in × 100 %
In the formula, η C is the conversion efficiency of the energy management circuit, P o u t is the output power of the energy management circuit, and P i n is the input power of the energy management circuit.

3.2.2. Key Indexes of the Wireless Communication Unit Failure Mechanism

At present, wireless communication evaluation technology has been widely studied [26,27,28], and a high number of evaluation indexes have been proposed for the evaluation of sensor wireless communication. However, different usage conditions and communication methods have different indexes, so it is not necessary for us to include all indexes. Therefore, indexes need to be selected from the actual engineering background.
The wireless communication unit mainly includes the wireless communication chip and antenna part. Due to the fact that self-powered wireless sensors are usually placed in harsh environments, the antenna is easily damaged, which can lead to the attenuation of the communication distance of the wireless communication unit. At the same time, due to the unstable output voltage and power of the energy management circuit, it can lead to packet loss and bit error in wireless communication data. In addition, different data importance and real-time often require different duty cycles for communication. Therefore, the indexes constructed based on communication distance, packet loss rate, bit error rate, and communication cycle duty ratio are as follows:
1.
Communication distance attenuation rate
When the antenna is damaged, its reflection coefficient S11 will be greatly affected, which affects the resonant frequency of the antenna and leads to the attenuation of communication distance. Secondly, some sensors will be placed at the zero point of the communication distance, and once the communication distance of the wireless communication unit decreases, it will directly lead to the failure of the wireless sensor node. At the same time, the electromagnetic interference or the presence of walls in the layout location can also lead to a decrease in communication distance, resulting in information not being transmitted to the user in a timely manner. Therefore, the index of communication distance attenuation rate is introduced to evaluate the health state of the antenna, which can be expressed by the following formula:
d η = d max d t d max × 100 %
In the formula, d η is the attenuation rate of wireless communication distance, d max is the maximum communication distance marked by the manufacturer when leaving the factory, and d t is the communication distance at this time.
2.
Packet loss rate
The packet loss rate refers to the proportion of the actual number of received data packets to the theoretical number of data packets within a certain period of time. The reason for packet loss is similar to the communication distance. It can be represented by the following formula:
D T η = D T t h D T t D T t h × 100 %
where D T η is the packet loss rate of wireless communication, D T t h is the number of theoretically received data packets over a period of time, and D T t is the amount of data actually received over a period of time.
3.
Efficiency of data packets
The efficiency and error rate of data packets in this article are similar, referring to the proportion of data packets that are affected by environmental noise, fluctuations in energy management circuit voltage, and other factors during transmission, resulting in signal damage during transmission and generating data that cannot be recognized by users. It can be represented by the following formula:
σ S E R = D T a l l D T s e r D a l l × 100 %
In the formula, σ S E R is the efficiency of wireless communication data packets, D T a l l is the number of all data packets over a period of time, and D T s e r is the number of data packets that can be recognized by the user over a period of time.
4.
Communication timeliness
In general, the transmission power consumption of wireless communication units is high, reaching hundreds of milliamperes. However, the distribution of micro-energy in the environment is random in both time and space, resulting in the inability of the environment energy collected by wireless self-powered sensors to provide real-time power to the wireless communication system. Therefore, supercapacitors/lithium batteries are introduced as energy storage units, and data collection and transmission are carried out when the voltage of the energy storage unit reaches the voltage threshold. If the sending cycle time is too long, it will affect the user’s judgment of the event. Therefore, the communication timeliness index is introduced to evaluate the communication interval time to meet the needs of users. It can be represented by the following equation:
η T = Δ T r e f Δ T t Δ T r e f × 100 %
where η T is the wireless communication timeliness, Δ T r e f is the user specified wireless data transmission interval, and Δ T t is the actual wireless data transmission interval.

3.2.3. Selection of Sensor Indexes

Sensors can convert perceived physical signals into electrical signals, which is the source of signal acquisition. Therefore, it is necessary to ensure the accuracy of the sensor. Due to the susceptibility of sensors to the measurement environment, especially temperature, humidity, and electromagnetic environment, the sensitive units of the sensors are damaged, resulting in a decrease in the static and dynamic characteristics of the sensors. It is well known that the static characteristics of sensors include parameters such as range, sensitivity, and linearity. However, for users, the most important index is measurement accuracy, which can also reflect parameters such as sensor sensitivity and linearity. Therefore, we chose sensor measurement accuracy as a key index for evaluating the health status of sensors. On the other hand, when the conversion unit of the sensor is damaged, its sensing range will also decrease, so the measurement range is also one of the key parameters for sensor health evaluation.
1.
Measurement accuracy
Measurement accuracy, as one of the key indexes of sensor performance, determines the implementation of basic functions. It can be represented by the following formula:
σ s = D A t D A ref D A ref × 100 %
In the Formula (12), σ s is the measurement accuracy of the sensor, D A t is the actual value measured by users, and D A r e f is the value measured by the standard device.
2.
Measurement range
The measurement range refers to the difference between the maximum and minimum measurement values that can be measured by the sensor, which can be expressed by the following formula:
R A = Q max Q min
In the Formula (13), R A is the sensing range of the sensor, Q max is the maximum value that the sensor can measure, and Q min is the minimum value that the sensor can perceive.
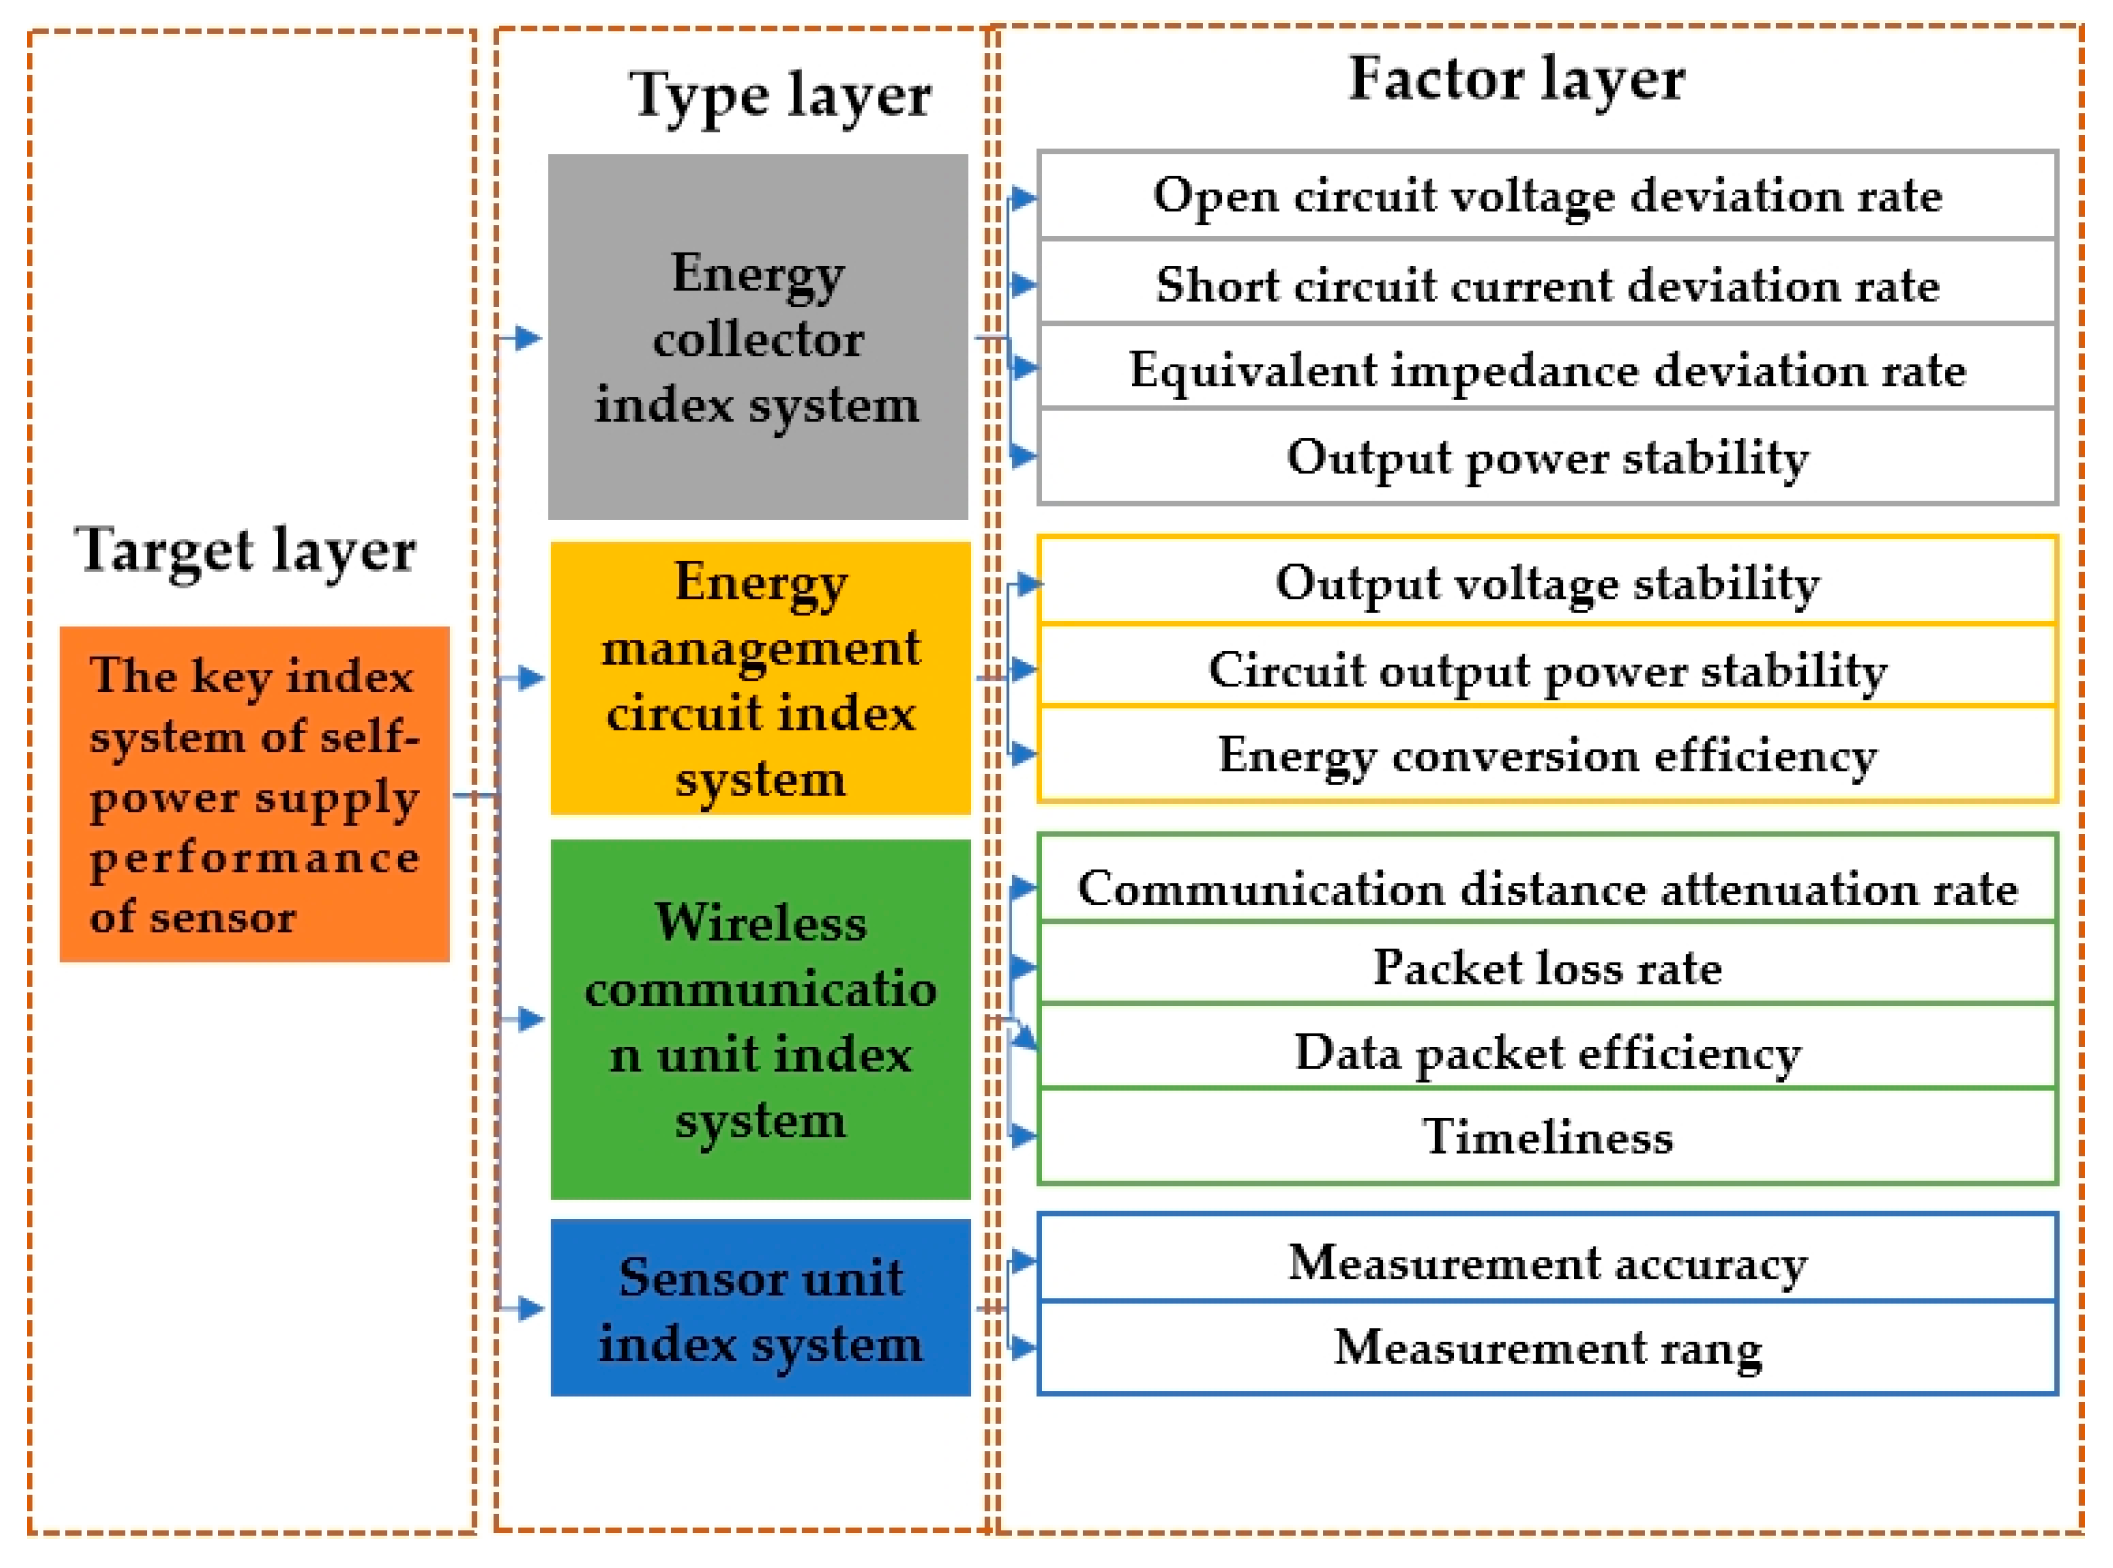
After the above analysis, the self-powered wireless sensor evaluation index system composed of the target layer, type layer, and factor layer was constructed as shown in Figure 6. Among them, the target layer is a Level 1 indicator, which is the evaluation result, used to provide the operational status of self-powered wireless sensors. The type is a Level 2 indicator, which is the type of evaluation, including the energy collector indicator, energy management circuit indicator, wireless communication unit indicator, and sensing unit indicator, used to classify and manage various indicators in the factor layer. The factor layer is a specific evaluation indicator used for the direct evaluation of objectives.

4. Index Weighting

Table 1 shows a comparison of classic subjective and objective weighting methods. From Table 1, it can be seen that the analytic hierarchy process (AHP) has the characteristics of simplicity and practicality, and the critical method can consider the variability of indicators while also taking into account the correlation between indicators. Therefore, we chose the AHP as the subjective weight and the critical method as the objective weight in this article. In order to balance the subjective weight of expert experience and the scientific nature of objective weight, a subjective and objective fusion method was adopted in this article to assign weights to various indicators in the evaluation system. We used the fusion weight of AHP and critical algorithm as the weighting method in this article, because the effectiveness and scientific nature of this method have been verified in many fields [29,30]. In the following research, we will further choose some novel weighting methods to obtain more efficient weights, such as the CILOS, IDOCRIW, FUCOM, LBWA, SAPEVO-M, and MEREC algorithms mentioned in the literature [31].

4.1. Index Weighting Based on AHP

The AHP is used to determine the subjective weight values of each index. To determine the subjective weight values, it is necessary to first construct a judgment matrix, where experts in this field compare the indexes of each layer in pairs and score the influencing factors of each layer based on the Santy1-9 scale method shown in Table 2 to obtain the judgment matrix of Equation (14) [32].
D = 1 1 5 1 2 1 6 5 1 5 3 2 1 5 1 1 4 6 1 3 4 1
In order to avoid logical errors in the judgment of the supervisor, it is necessary to conduct consistency checks on the obtained judgment matrix, namely:
C I = ( λ max n ) / ( n 1 )
C R = C I / R I
Among them, λ max is the maximum eigenvalue of the judgment matrix, n is the order of the matrix, and RI is the average random consistency value corresponding to n (Table 3). When the calculated CR < 0.1, the consistency test is passed.
Equation (14) is the judgment matrix of each factor in the type layer of the influencing factors. The calculated consistency parameter CR = 0.072 < 0.1 indicates that the consistency test has been passed. The other methods for constructing judgment matrices and consistency judgment are consistent with the above methods. After calculation, the consistency parameters CR of each factor layer are 0.0442, 0.0904, 0.0986, and 0, respectively.
After calculation, all the judgment matrices have passed the consistency test, and then the specific weights of each index need to be determined using the root square method.
ω ¯ i = j = 1 m a i j m
ω i = ω ¯ i j = 1 m ω ¯ j
where m is the order of the judgment matrix, a i j is the scale of the elements in the judgment matrix, ω i is the subjective weight of the i-th factor after normalization, and ω ¯ is the subjective weight of the i-th factor before normalization. The subjective weight values of various influencing factors obtained are shown in Figure 7.

4.2. Index Weighting Based on the CRITIC Weight Method

The objective weighting method used in this article is the CRITIC weight method, which takes into account both the variability of indicators and their interrelationships [27,28]. The computational steps are as follows:
1.
Normalize and standardize each indicator as shown in Equations (19) and (20):
x i j = X i j min ( X 1 j , X 2 j , , X n j ) max ( X 1 j , X 2 j , , X n j ) min ( X 1 j , X 2 j , , X n j )
x i j = max ( X 1 j , X 2 j , , X n j ) X i j max ( X 1 j , X 2 j , , X n j ) min ( X 1 j , X 2 j , , X n j )
Equations (19) and (20) represent the normalization and standardization processes for positive indicators and negative indicators, respectively. In these equations, X i j represents the j-th specific parameter of the i-th influencing factor in the factor layer, while x i j represents the parameter after normalization and standardization.
2.
Calculate the comparative strength between various indicators, with the calculation process described as Equation (21):
x ¯ j = 1 n i = 1 n x i j S j = i = 1 n ( x i j x ¯ j ) 2 n 1
In the equation, x ¯ j represents the mean value of each indicator, while S j represents the comparative strength of the indicators.
3.
Calculate the conflict of the indicators, with the calculation process described as Equation (22):
R j = i = 1 p ( 1 r i j )
In the equation, R j represents the conflict of indicator j, and r i j represents the correlation coefficient between the i-th and j-th factors.
4.
Calculate the total amount of information contained in a single indicator, with the calculation process described as Equation (23):
C j = S j × R j
In the Equation (23), C j represents the total amount of information contained in a single indicator.
5.
Normalize the total amount of information C j and obtain the objective weight values of each factor, with the calculation process described as Equation (24):
w j = C j j = 1 p C j
The objective weights obtained from 200 h of actual data testing are shown in Table 4.

4.3. Index Weighting for Subjective and Objective Integration

After obtaining the subjective and objective weight values of each factor in the evaluation system, in order to balance the subjective opinions of experts and the objective facts of the data, it is necessary to construct a fusion weight value ( W F ) that can reflect the weight information of subjective weight value ( W Z ) and objective weight value ( W K ). When the sum of distances from W F to W Z and W K is the smallest, it can be considered that the fusion weight value reflects the information of subjective and objective weight values to the greatest extent. The specific calculation process is as follows:
d x y = i = 1 n x i y i p 1 p , p 1
The initial fusion weight value is calculated using Equation (25), and then normalized to the formula as in Equation (26).
min D = i = 1 n W F i W Z i + W F i W K i
where W F i represents the fusion weight value after normalization, and W F 0 j represents the initial weight value.
W F i = W F 0 j j = 1 n W F 0 j
The weight values of each index after subjective and objective fusion are shown in Table 5.

5. Fuzzy Comprehensive Evaluation

Self-powered wireless sensors have numerous operating status parameters, and the operating mechanisms of each part are affected by various factors. Among them, factors related to device health status are mostly characterized by ambiguity and uncertainty, especially for self-powered wireless sensors, there is currently no mature and available index system. Therefore, a fuzzy evaluation model was constructed as shown in Figure 8 to evaluate the operational status of self-powered wireless sensors. The main idea is that a fuzzy comprehensive evaluation is an evaluation method based on the fuzzy mathematics theory. This evaluation method borrows the concept of membership function from fuzzy mathematics, fuzzifying the traditional evaluation method of indexes with fixed values as boundaries, and constructing a membership matrix through the characterization of the membership function. The weight values of each factor are multiplied by the membership matrix to obtain the overall membership evaluation [33]. At the same time, a combination of subjective and objective methods was used to determine the weight values of each factor in order to balance the authority and objectivity of the determined weights.
It is evaluated by measuring the output parameters of each index of the sensor. The evaluation process includes the hierarchical division of influencing factors, determination of subjective weight values of influencing factors, determination of objective weight values of influencing factors, determination of comprehensive weight values of influencing factors, determination of evaluation membership functions of each influencing factor, and giving comprehensive evaluation scores to self-powered sensors. The flowchart of the evaluation model proposed in this article is shown in Figure 8.
The steps for fuzzy comprehensive evaluation are as follows:
1.
Collection of raw parameters for evaluation indexes
The original data of each index at the 200th hour were taken as the data samples to evaluate the status of the self-powered wireless sensor. The specific data are shown in Table 6.
2.
Determine the set of factors
As can be seen from the above parts, the vibration energy harvester, energy management circuit, wireless communication unit, and sensor indexes can all evaluate the operating status of self-powered wireless sensors. Therefore, the factor set can be expressed as:
U = U 1 , U 2 , U 3 , U 4
The sub evaluation factors, U i , in the factor set can be expressed as:
U i = U i 1 , U i 2 , , U i j
where U i is the i-th evaluation factor among the main factors, and U i j is the j-th evaluation factor in the U i factor set.
3.
Determine the comment set
On the basis of summarizing the actual operating experience of self-powered wireless sensors, their operating states are specifically divided into four states: normal, attention, abnormal, and severe. Among them, “normal” indicates that the equipment is working normally and does not require maintenance or attention; “attention” indicates that the equipment is working normally, but requires regular attention and maintenance; “abnormal” indicates that although the equipment is currently functioning normally, but there is a significant risk and needs to be repaired or replaced as soon as possible; “severe” indicates that the device is no longer functioning properly and requires immediate repair and replacement. The comment set is represented as:
V = V 1 , V 2 , V 3 , V 4 = normal , attention , abnormal , severe
4.
Determine the standard values
In order to quantify the status of self-powered wireless sensors, there should be corresponding standard values for each evaluation factor, U i j , in various states of the evaluation set. This standard value can serve as an important boundary for distinguishing between good and bad indexes in the program. However, there is currently little research on the evaluation of self-powered wireless sensors, so there is no evaluation standard for self-powered wireless sensors, and there is also no standard value for the status of each evaluation index. Therefore, according to the regulations of the China National Grid for wireless sensors and self-powered sensors, the chip manual, the factory experiment data of each part, and the experts of the National Grid and Chongqing University, the standard values of self-powered wireless sensors based on vibration energy were formulated, as shown in Table 7.
5.
Construction of the membership matrix
The membership matrix is a matrix used to determine the degree of superiority or inferiority of specific indexes. Through this matrix, the degree to which a specific index belongs to a certain evaluation level can be understood. Before constructing the membership matrix, it is necessary to construct the membership function. Taking the evaluation object of this article as an example, when the parameters of some indexes fall at the intersection of the two standard values in Table 7, simply dividing them according to intervals will cause the evaluation results to be too extreme, which is not conducive to the comprehensive evaluation of the entire device. Therefore, based on the type of each index, its own membership function for each index was constructed, which can fully play the role of the index throughout the entire evaluation process. Based on the distribution pattern and attributes of the self-powered wireless sensor indexes in this article, the ridge distribution function model as shown in Figure 9 and Figure 10 was selected as the membership function. The indexes can be divided into two categories: cost-based indexes and benefit-based indexes, and their respective membership functions are as follows:
μ 1 ( x ) = 1 x a 1 1 2 1 2 sin π a 1 ( x a 2 ) a 1 < x a 3 0 x > a 3
μ 2 ( x ) = 0 x a 1 1 2 + 1 2 sin π 0.2 ( x a 2 ) a 1 < x < a 3 1 a 3 < x a 4 1 2 1 2 sin π 0.2 ( x a 5 ) a 4 < x < a 6 0 x a 6
μ 3 ( x ) = 0 x a 4 1 2 + 1 2 sin π 0.2 ( x a 5 ) a 4 < x < a 6 1 a 6 < x a 7 1 2 1 2 sin π 0.2 ( x a 8 ) a 7 < x < a 9 0 x a 9
μ 4 ( x ) = 0 x a 7 1 2 + 1 2 sin π a 1 ( x a 8 ) a 7 < x a 9 1 x > a 9
μ 1 ( x ) = 0 x a 3 1 2 + 1 2 sin π a 1 ( x a 8 ) a 3 < x a 1 1 x > a 1
μ 2 ( x ) = 0 x a 6 1 2 + 1 2 sin π 0.2 ( x a 5 ) a 6 < x < a 4 1 a 4 < x a 3 1 2 1 2 sin π 0.2 ( x a 2 ) a 3 < x < a 1 0 x a 1
μ 3 ( x ) = 0 x a 9 1 2 + 1 2 sin π 0.2 ( x a 8 ) a 9 < x < a 7 1 a 7 < x a 6 1 2 1 2 sin π 0.2 ( x a 5 ) a 6 < x < a 4 0 x a 4
μ 4 ( x ) = 1 x a 9 1 2 1 2 sin π a 1 ( x a 8 ) a 9 < x a 7 0 x > a 9
In the Formulas (35)–(38), x represents the true values of each index parameter, and a 1 ~ a 9 are the boundary values of the parameter, indicating which comment belongs to the boundary.
Next, it is necessary to classify the membership models of each index. The results of the membership models determined for each index in this article are shown in Table 8. The model classification in Table 8 was developed by experts from Chongqing University and then determined after consultation with experts from the State Grid of China.
Finally, in order to construct the membership matrix, the membership matrix is represented by R, and is constructed from the factor set U and the comment set V. Each factor in the matrix is determined by the membership function. At the same time, to ensure the consistency of the values in the membership matrix, it is necessary to normalize each row of the matrix. Each row of the membership matrix reflects the membership relationship of an evaluation factor to each review set, r i j is the membership relationship of the i factor u i to the j comment v i , and the specific value is determined by the membership function. The membership matrix R is as follows:
R = r 11 r n 1 r 1 m r n m = 0 0.92 1 1 1 1 0 1 0.71 0 0 0 0 1 0.08 0 0 0 0 1 0 0.34 1 0 0.03 1 0 0.2 0 0 0 0 0 0 0 0 1 0.97 0 0 0 0 0 0 0 0 0 0 0 0 0 0
6.
Calculate the evaluation results
After obtaining the subjective and objective fusion weight matrix, W, and membership matrix, R, in Table 5, the final evaluation vector B can be obtained by multiplying them:
B = w 1 , w 2 , , w n r 11 r n 1 r 1 m r n m = b 1 , b 2 , , b n = 0.4847 0.2681 0.2476 0
From the evaluation vector B, it can be seen that the membership level belonging to the “normal” level is the highest, with a comprehensive score of 0.4847. According to the principle of maximum membership, the final evaluation result is “normal”. This evaluation result is reasonable because the main factors causing equipment degradation are vibration and external environmental factors, and the testing environment in this article is a relatively ideal environment. On the other hand, from the test data, it can be seen that the main factor affecting the performance degradation of self-powered wireless sensors is the vibration energy harvester. After expert analysis, it is believed that the evaluation results are in line with the actual situation, so our evaluation method can scientifically reflect the operating status of self-powered wireless sensors.

6. Conclusions

In this work, the failure mechanism and degradation factors of self-powered sensors were analyzed, and it is concluded that the main factors causing equipment degradation are the mechanical structure movement of the equipment and the operating environment. A relatively scientific and complete evaluation index system has been comprehensively considered and constructed from four aspects: vibration energy harvesters, energy management circuits, wireless communication units, and sensors, including 4 types of primary indexes and 13 secondary indexes. A self-powered wireless sensor was designed using a vibration energy harvester as an example, and a vibration measurement platform was built. Long-term testing was conducted in a laboratory environment for 200 h.
The subjective weight value of each index was obtained using the Santy1-9 scale method, and the objective weight of each index was obtained using the critic weight method according to the 200 h of measured data. According to the principle of minimum distance, the sum of the Manhattan distances between the subjective and objective weight values and the fused weight values were used as the fitness function, and further normalization was carried out to obtain the fused weight values, preparing for the subsequent fuzzy comprehensive evaluation.
A factor set and evaluation set suitable for self-powered wireless bed devices were constructed using the fuzzy mathematics theory. The membership matrix was obtained by selecting and adapting ridge shaped membership functions based on the characteristics of each index. Finally, the subjective and objective weights were fused with the membership matrix to obtain the evaluation matrix, and according to the principle of maximum membership, the evaluation result of the self-powered wireless sensor after 200 h of operation was determined to be “normal”.

Author Contributions

Conceptualization, P.L. and J.Y.; methodology, S.X.; software, K.X.; validation, S.X., Q.L. and A.Y.; formal analysis, L.Z.; investigation, S.X.; resources, Q.L.; data curation, P.L.; writing—original draft preparation, K.X.; writing—review and editing, S.X.; visualization, J.Y.; supervision, J.Y.; project administration, A.Y.; funding acquisition, Q.L. All authors have read and agreed to the published version of the manuscript.

Funding

This research was funded by the State Grid Corporation of China under project “Research on reliability evaluation and electromagnetic compatibility of sensors for electric power application under typical environment”, project number: 5500-202155457A-0-0-00.

Institutional Review Board Statement

Not applicable.

Informed Consent Statement

Not applicable.

Data Availability Statement

The data used to support the findings of this study are included in the article.

Conflicts of Interest

Author Suqin Xiong and Qiuyang Li were employed by the company China Electric Power Research Institute Co., Ltd. Author Aichao Yang and Liang Zhu were employed by the company State Grid Jiangxi Electric Power Co., Ltd. The remaining authors declare that the research was conducted in the absence of any commercial or financial relationships that could be construed as a potential conflict of interest.

References

  1. Kwon, S.; Kim, H.S.; Kwon, K. At-home wireless sleep monitoring patches for the clinical assessment of sleep quality and sleep apnea. Sci. Adv. 2023, 9, eadg9671. [Google Scholar] [CrossRef] [PubMed]
  2. Altaf, M.A.; Ahn, J.; Khan, D. Usage of IR sensors in the HVAC systems, vehicle and manufacturing industries: A review. IEEE Sens. J. 2022, 22, 9164–9176. [Google Scholar] [CrossRef]
  3. Arakawa, T.; Dao, D.V.; Mitsubayashi, K. Biosensors and chemical sensors for healthcare monitoring: A review. IEEJ Trans. Electr. Electron. Eng. 2022, 17, 626–636. [Google Scholar] [CrossRef]
  4. Sharma, A.; Ranjit, R.; Kumar, N.; Kumar, M.; Giri, B.S. Nanoparticles based nanosensors: Principles and their applications in active packaging for food quality and safety detection. Biochem. Eng. J. 2023, 193, 108861. [Google Scholar] [CrossRef]
  5. Rayhana, R.; Xiao, G.G.; Liu, Z. Printed sensor technologies for monitoring applications in smart farming: A review. IEEE Trans. Instrum. Meas. 2021, 70, 9513419. [Google Scholar] [CrossRef]
  6. Gerhardt, M.; Zimoch, L.; Dorn, C. Self-powered Elementary Hybrid Magnetoelectric Sensor. Nano Energy 2023, 115, 108720. [Google Scholar] [CrossRef]
  7. Mahapatra, A.; Ajimsha, R.S.; Ittoop, M.O. Flexible ZnO: PVDF based Free Standing Piezoelectric Nanogenerator for Vibrational Energy Harvesting and Wearable Shoe Insole Pedometer Sensor. J. Alloys Compd. 2023, 960, 170898. [Google Scholar] [CrossRef]
  8. Páez-Montoro, A.; García-Valderas, M.; Olías-Ruíz, E. Solar energy harvesting to improve capabilities of wearable devices. Sensors 2022, 22, 3950. [Google Scholar] [CrossRef] [PubMed]
  9. Cao, X.; Zhou, H.; Zhou, Y. High Performance Rotary-Structured Triboelectric-Electromagnetic Hybrid Nanogenerator for Ocean Wind Energy Harvesting. Adv. Mater. Technol. 2023, 8, 2300327. [Google Scholar] [CrossRef]
  10. Gai, Y.; Wang, E.; Liu, M. A Self-Powered Wearable Sensor for Continuous Wireless Sweat Monitoring. Small Methods 2022, 6, 2200653. [Google Scholar] [CrossRef] [PubMed]
  11. Li, Y.; Li, J.; Yang, A. Electromagnetic vibrational energy harvester with microfabricated springs and flexible coils. IEEE Trans. Ind. Electron. 2020, 68, 2684–2693. [Google Scholar] [CrossRef]
  12. Yi, Z.; Gu, T.; Ma, Q. Exploration on Signal Processing Performance of Wireless Sensor in Electromagnetic Interference Environment. Wirel. Commun. Mob. Comput. 2022, 2022, 2970459. [Google Scholar] [CrossRef]
  13. Dong, W.; Li, W.; Guo, Y. Piezoresistive performance of hydrophobic cement-based sensors under moisture and chloride-rich environments. Cem. Concr. Compos. 2022, 126, 104379. [Google Scholar] [CrossRef]
  14. Niu, Y.; Dong, H.; Wang, H. Design and performance evaluation of an all-ceramic high-temperature test sensor. J. Alloys Compd. 2023, 938, 168561. [Google Scholar] [CrossRef]
  15. Zhong, J.; Zhong, Q.; Chen, G. Surface charge self-recovering electret film for wearable energy conversion in a harsh environment. Energy Environ. Sci. 2016, 9, 3085–3091. [Google Scholar] [CrossRef]
  16. Tan, S.; Li, Y.; Wang, X. Parameters Optimization of ASE Source for the Improvement of Optical Power Stability in Space Radiation Environment. J. Light. Technol. 2022, 40, 2612–2618. [Google Scholar] [CrossRef]
  17. Kar, P.; Roy, A.; Misra, S. On the effects of communication range shrinkage of sensor nodes in mobile wireless sensor networks due to adverse environmental conditions. IEEE Syst. J. 2016, 12, 2048–2055. [Google Scholar] [CrossRef]
  18. Ariyaratne, R.; Elangasinghe, M.A.; Zamora, M.L. Understanding the effect of temperature and relative humidity on sensor sensitivities in field environments and improving the calibration models of multiple electrochemical carbon monoxide (CO) sensors in a tropical environment. Sens. Actuators B Chem. 2023, 390, 133935. [Google Scholar] [CrossRef]
  19. Tran, A.V.; Zhang, X.; Zhu, B. Effects of temperature and residual stresses on the output characteristics of a piezoresistive pressure sensor. IEEE Access 2019, 7, 27668–27676. [Google Scholar] [CrossRef]
  20. Cervera, G.A.; Paiva, S.A.S.; Gálvez, P.S. An Inertial Uni-axial Interferometer-Based Accelerometer for harsh environments. IEEE Sens. J. 2022, 22, 21540–21549. [Google Scholar] [CrossRef]
  21. Li, Y.; Li, J.; Liu, Z. Theoretical and experimental investigation of magnet and coil arrays optimization for power density improvement in electromagnetic vibration energy harvesters. Energy Convers. Manag. 2023, 293, 117411. [Google Scholar] [CrossRef]
  22. Aabid, A.; Raheman, M.A.; Ibrahim, Y.E. A systematic review of piezoelectric materials and energy harvesters for industrial applications. Sensors 2021, 21, 4145. [Google Scholar] [CrossRef] [PubMed]
  23. Akhter, F.; Funabiki, N.; Htet, E.E. An Interface Setup Optimization Method Using a Throughput Estimation Model for Concurrently Communicating Access Points in a Wireless Local Area Network. Sensors 2023, 23, 6367. [Google Scholar] [CrossRef]
  24. Arachchige, K.G.; Branch, P.; But, J. Evaluation of Correlation between Temperature of IoT Microcontroller Devices and Blockchain Energy Consumption in Wireless Sensor Networks. Sensors 2023, 23, 6265. [Google Scholar] [CrossRef] [PubMed]
  25. Liang, R.; Zhao, L.; Wang, P. Performance evaluations of LoRa wireless communication in building environments. Sensors 2020, 20, 3828. [Google Scholar] [CrossRef]
  26. Rivero-Iglesias, J.M.; Puente, J.; Fernandez, I. Integrated model for the assessment of power generation alternatives through analytic hierarchy process and a fuzzy inference system. Case study of Spain. Renew. Energy 2023, 211, 563–581. [Google Scholar] [CrossRef]
  27. Wang, G.; Wang, J.S.; Wang, H.Y. Component-wise design method of fuzzy C-means clustering validity function based on CRITIC combination weighting. J. Supercomput. 2023, 79, 14571–14601. [Google Scholar] [CrossRef]
  28. Wang, M.; Li, C.; Wang, X. Research on Comprehensive Evaluation and Early Warning of Transmission Lines’ Operation Status Based on Dynamic Cloud Computing. Sensors 2023, 23, 1469. [Google Scholar] [CrossRef]
  29. Li, C.; Chen, X.; Li, Z. Comprehensive evaluation method of transmission line operating status based on improved combination weighting evaluation model. Energy Rep. 2022, 8, 387–397. [Google Scholar] [CrossRef]
  30. Pang, N.; Luo, W.; Wu, R. Safety Evaluation of Commercial Vehicle Driving Behavior Using the AHP—CRITIC Algorithm. J. Shanghai Jiaotong Univ. Sci. 2023, 28, 126–135. [Google Scholar] [CrossRef]
  31. Ayan, B.; Abacıoğlu, S.; Basilio, M.P. A Comprehensive Review of the Novel Weighting Methods for Multi-Criteria Decision-Making. Information 2023, 14, 285. [Google Scholar] [CrossRef]
  32. Wang, J.; Ni, H. Path loss modeling and performance evaluation of double IRSs-aided wireless communication systems based on spatial scattering channel model. Sci. Rep. 2023, 13, 8400. [Google Scholar] [CrossRef] [PubMed]
  33. Hu, X.; Pedrycz, W.; Wang, X. Granular fuzzy rule-based models: A study in a comprehensive evaluation and construction of fuzzy models. IEEE Trans. Fuzzy Syst. 2016, 25, 1342–1355. [Google Scholar] [CrossRef]
Figure 1. Frame diagram of the FE-SPS evaluation method.
Sensors 23 09267 g001
Figure 2. Vibration energy harvester.
Sensors 23 09267 g002
Figure 3. Frame diagram of a self-powered wireless sensor.
Sensors 23 09267 g003
Figure 4. Experimental platform.
Sensors 23 09267 g004
Figure 5. Equivalent circuit diagram of the vibration energy harvester.
Sensors 23 09267 g005
Figure 6. The construction of the index system.
Sensors 23 09267 g006
Figure 7. Subjective weight values of indexes at various levels.
Sensors 23 09267 g007
Figure 8. Flow chart of the fuzzy comprehensive evaluation.
Sensors 23 09267 g008
Figure 9. Model 1: Smaller is a better-type function curve.
Sensors 23 09267 g009
Figure 10. Model 2: Bigger is a better-type function curve.
Sensors 23 09267 g010
Table 1. Comparison of common subjective and objective weighting methods.
Weight Assignment MethodSubjective/
Objective
AdvantageDisadvantage
Expert scoring methodSubjectiveSimple and fastHighly influenced by expert experience
AHPSubjectiveSimple and practical, systematic, less quantitative data information requiredHighly influenced by expert experience, more complex eigenvalue method
Entropy weight methodObjectiveAbility to consider uncertainty and information, does not rely on expert judgmentHigh vulnerability to data errors, correlations between indicators cannot be considered
CRITIC methodObjectiveIt can simultaneously take into account the variability of indicators and the correlation between indicators, multiple attributes and decision scenarios can be handledNeed a lot of comparative data, professional software support may be required
Variation coefficient methodObjectiveSimple and easy to implement, each indicator can be effectively distinguishedThere are certain restrictions on the selection of indicators
Table 2. Santy1-9 scale method.
ScaleMeaning
1It means that two elements are of equal importance compared to each other
3It means that the former is slightly more important than the latter
5It means that the former is significantly more important than the latter
7It means that the former is more important than the latter
9It means that the former is more important than the latter
2, 4, 6, 8It means the middle value of the above neighboring judgments
The reciprocal of 1 to 9It means the importance of the exchange order of two factors
Table 3. Average random consistency RI values.
Order (n)1234567
RI000.520.891.121.261.36
Table 4. CRITIC weight calculation results.
ItemIndex VariabilityIndex ConflictAmount of InformationWeight (%)
Open-circuit voltage deviation rate1.70312.09320.59410.43
Short-circuit current deviation rate2.53512.89032.68116.56
Equivalent impedance deviation rate0.61412.2577.5223.81
Output power stability1.49112.44418.5599.40
Output voltage stability1.68412.08320.34610.31
Circuit output power stability0.70111.9468.3704.24
Energy conversion efficiency1.43212.30217.6218.93
Communication distance attenuation rate0.17512.1622.1291.08
Packet loss rate0.60211.6577.0183.56
Data validation0.69412.1048.3964.25
Timeliness2.85112.70636.22118.35
Measurement accuracy0.49912.4396.2063.14
Measurement specifications0.96512.14711.7225.94
Table 5. Weight of the subjective and objective fusion.
Parameter TypeParametersWeight (%)
Energy harvester index X1Open-circuit voltage deviation rate X115.68
Short-circuit current deviation rate X128.81
Equivalent resistance deviation rate X132.17
Energy management circuit index X2Output power stabilityX146.69
Output voltage stability X217.52
Output power stability X2221.39
Wireless communication index X3Energy conversion efficiency X239.70
Communication distance attenuation rate X310.86
Packet loss rate X322.44
Data packet efficiencyX334.12
Sensor unit index X4Timeliness X3411.09
Measurement accuracy X4114.09
Table 6. Specific parameters of sensors.
Evaluation IndexParameter
Open-circuit voltage deviation rate13.82%
Short-circuit current deviation rate10.40%
Equivalent impedance deviation rate3.13%
Output power stability8.17%
Output voltage stability5.57%
Circuit output power stability1.59%
Energy conversion efficiency77.75%
Communication distance attenuation rate0.60%
Packet loss rate1.7%
Data packet efficiency98%
Timeliness85.26%
Measurement accuracy2 °C
Measurement accuracy159 °C
Table 7. Standard values of the evaluation indexes.
Evaluation IndexV1V2V3V4
X11 (%)11.4122.8334.2445.65
X12 (%)17.7635.5253.2871.04
X13 (%)10.7121.4332.1442.85
X14 (%)18.2536.554.7573
X21 (%)11.3622.7334.0945.45
X22 (%)5101520
X23 (%)80.3567.3454.8542.25
X31 (%)10304060
X32 (%)2.557.510
X33 (%)98969492
X34 (%)9585.5576.1166.66
X41 (°C)136.59
X42 (°C)160150140130
Table 8. Membership model of each index.
Type LayerFactor LayerSelected Membership Model
Energy harvesterOpen-circuit voltage deviation rateModel 1
Short-circuit current deviation rateModel 1
Equivalent resistance deviation rateModel 2
Output power stability rateModel 2
Energy management circuitOutput voltage stabilityModel 2
Output power stabilityModel 2
Energy conversion efficiencyModel 2
Wireless communication unitCommunication distance attenuation rateModel 1
Packet loss rateModel 1
Data packet efficiencyModel 2
TimelinessModel 2
Sensing unitMeasurement accuracyModel 2
Measurement rangeModel 2
Disclaimer/Publisher’s Note: The statements, opinions and data contained in all publications are solely those of the individual author(s) and contributor(s) and not of MDPI and/or the editor(s). MDPI and/or the editor(s) disclaim responsibility for any injury to people or property resulting from any ideas, methods, instructions or products referred to in the content.

