1. Introduction
A surge arrester is a widely used piece of equipment in an electrical power system, due to its capability of suppressing lightning or switching events [
1,
2,
3]. Its correct operation guarantees the reliability of the system [
4]. Until the end of the 1960s, the dominant technology in arresters was the use of a silicon carbide (SiC) varistor connected in series with a spark gap (whose function was to disconnect the varistor from the line after the surge). With the evolution of technology, the use of a zinc oxide (ZnO) varistor (with low impedance to the surge current) turned the use of the spark gap unnecessary. The ZnO varistor, actually, is the major component in the arrester, with other metal oxides used as minor additives in the intergranular spaces [
5]—hence, the more general term Metal Oxide Surge Arrester (MOSA).
According to [
6], moisture ingress was reported as the cause of 80% of outages in gapped arresters. In the case of sealed MOSAs, the humidity is usually low; although, after years of operation, the internal humidity can increase due to deterioration of the sealing. Hence, it is very important to monitor the condition of the arresters in service [
7] before a catastrophic failure. The literature presents several propositions and improvements in monitoring methods that are briefly discussed below.
Monitoring methods for arresters can be divided between offline methods (where the device under test is removed from its energized operation) and online methods (where the device under test is monitored while still connected to the grid). The offline methods usually present more reliable diagnosis, although these methods may result in significant expenses of disassembly, transport and laboratory testing [
8] (other than the cost of the interruption of service). According to [
8], despite being less reliable, the online methods can provide a preliminary picture of the arrester condition. The online methods can highlight the monitoring of leakage current, the evaluation of temperature of the device and the monitoring of partial discharges.
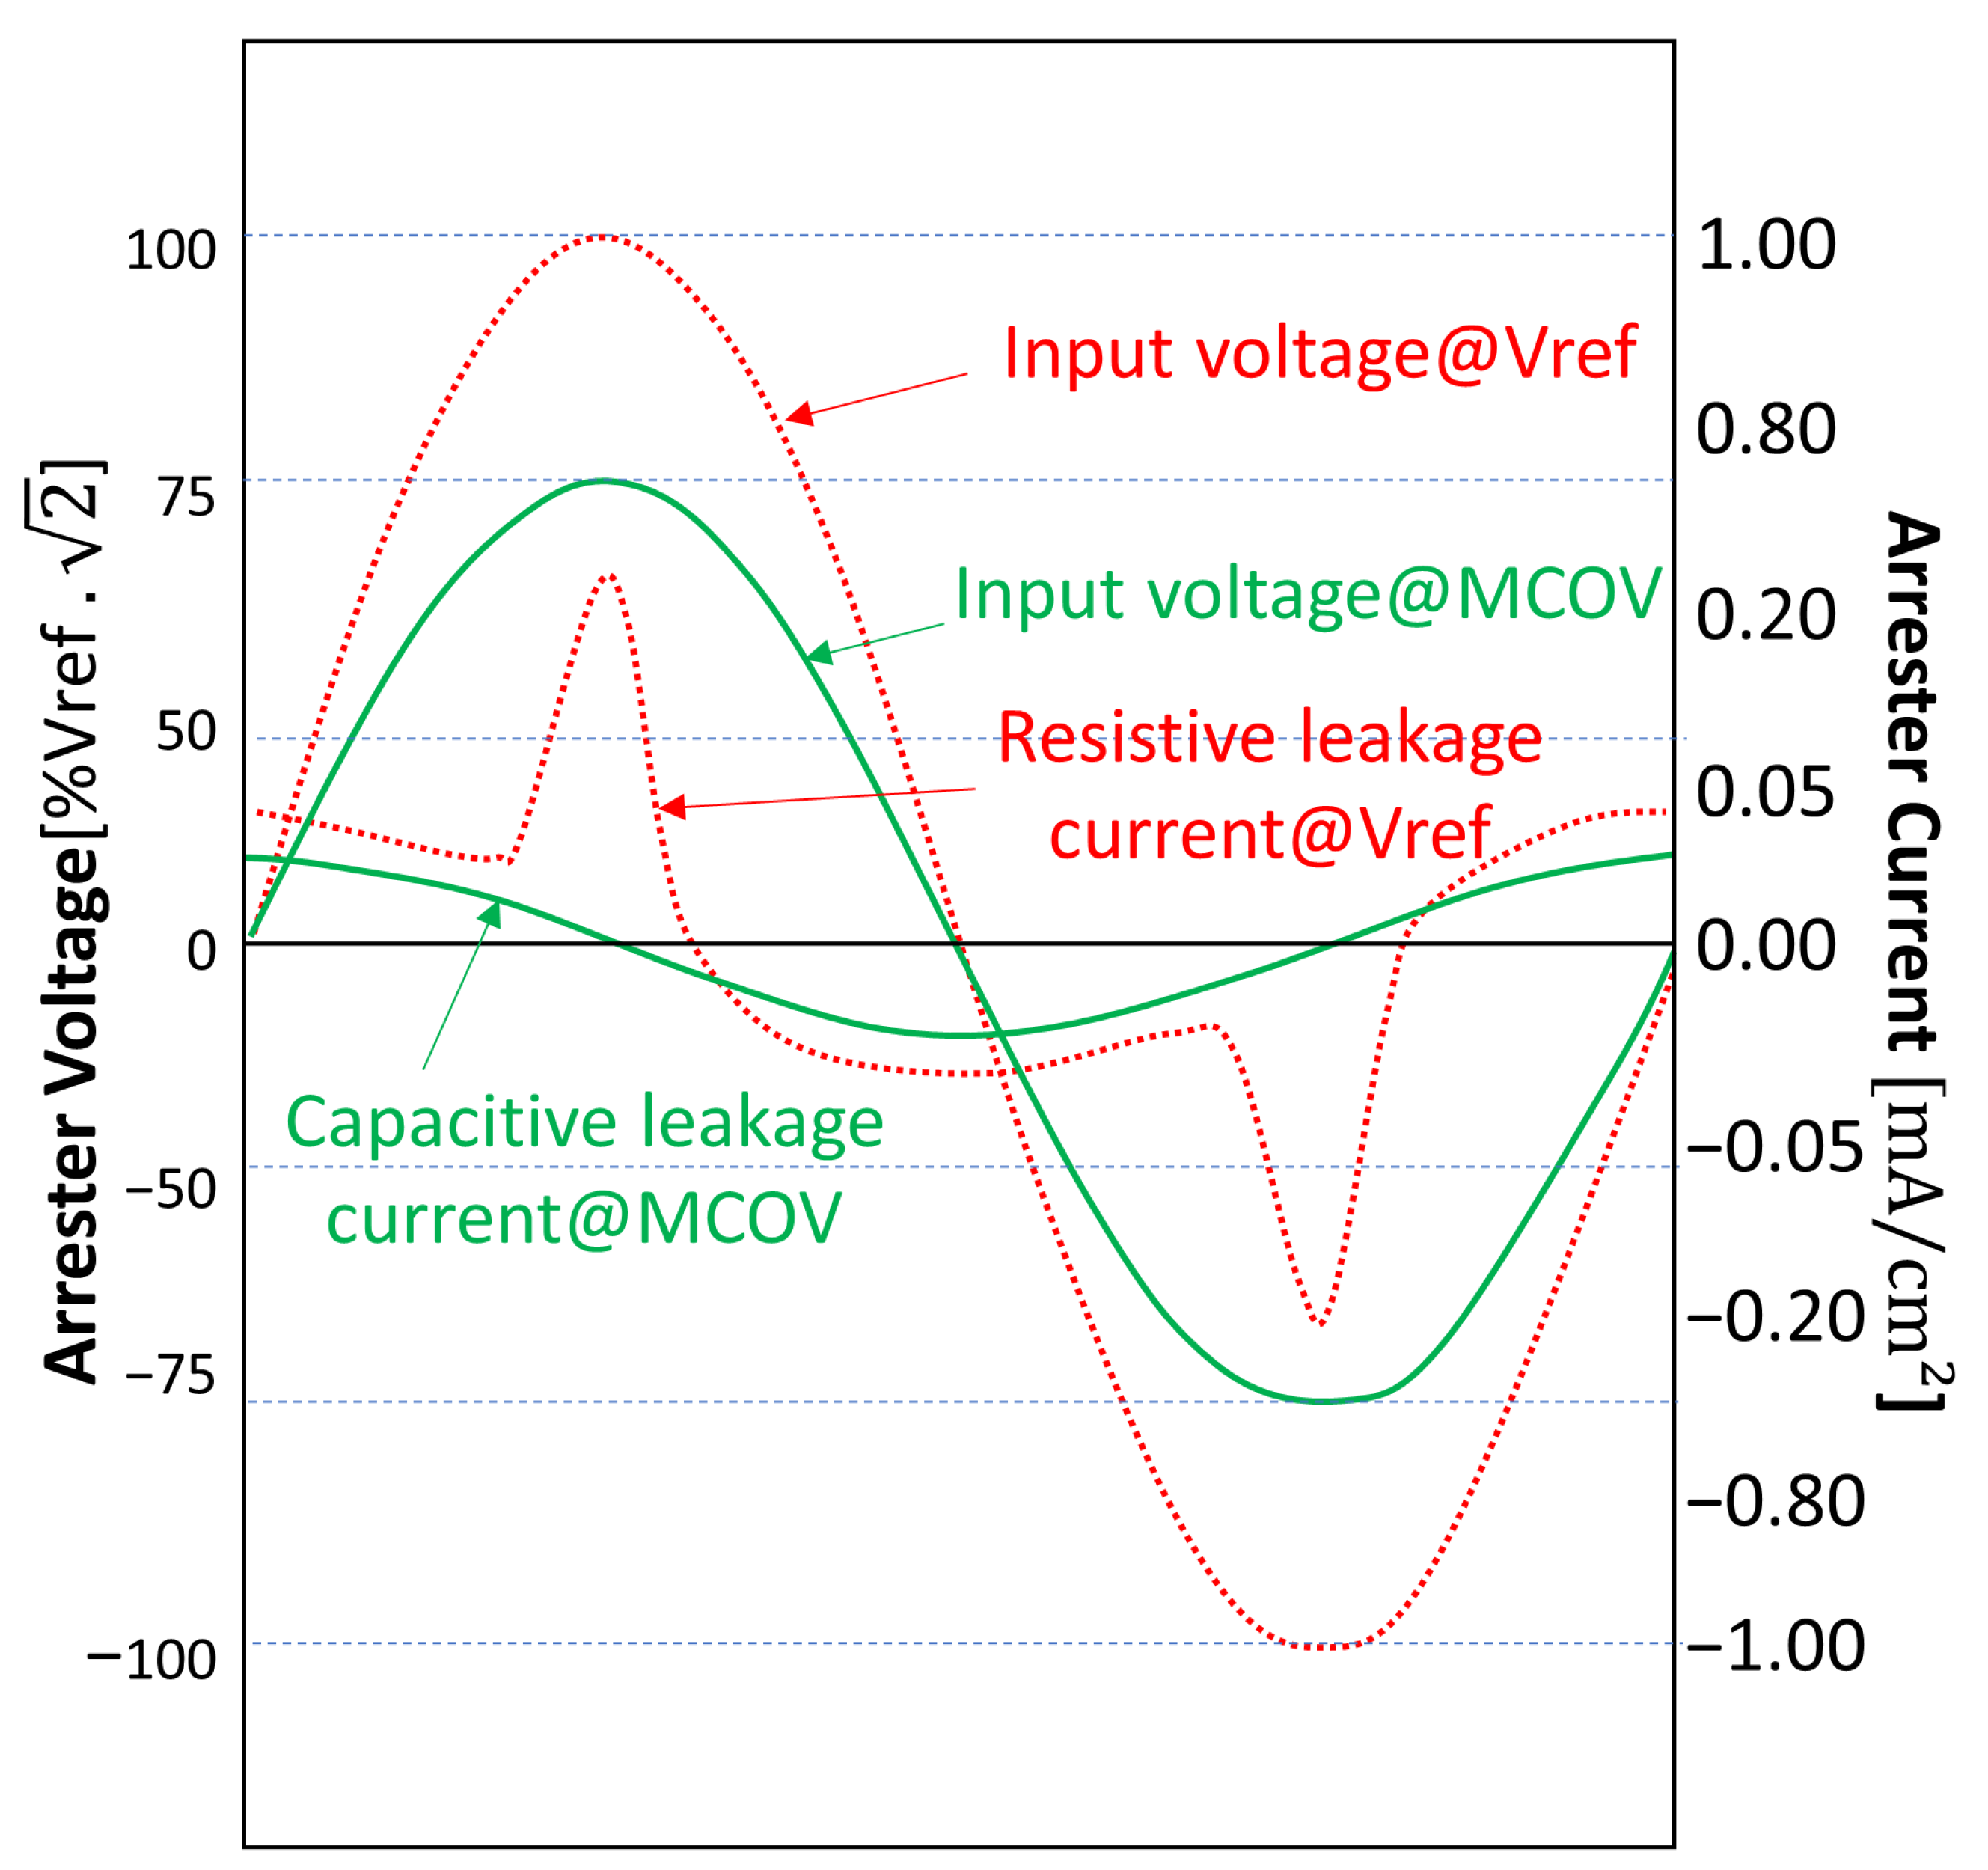
The monitoring of leakage current is the most widely used method and it is the method with the largest number of variations in the literature. However, it relies on the measurement of the system voltage, as this is required in order to decompose the total leakage current into its capacitive and resistive components [
9]. Reference [
8] studied the influence of voltage fluctuations and their harmonics (3rd, 5th and 7th) on indicators, based on the harmonic content of the resistive leakage current. Reference [
10] presents a methodology to extract the amplitude of the resistive leakage current without the use of the system voltage as a reference, based on statistics. Reference [
11] evaluates the effects of ultraviolet aging and pollution on the harmonic content of the leakage current. Reference [
9] presents the extraction of the harmonic contents of the total leakage current (without using the system voltage) based on a neural network.
Thermography is another popular method, due to its safe, easy and quick implementation. On the other hand, the elevated cost and the necessity for a specialist for the analysis are disadvantages [
12]. Monitoring of arresters by thermography allows the identification of a rise in temperature, which is a result of modifications in certain characteristics of the arrester. Reference [
13] presents a methodology of identification of the pollution degree on the arresters based on infrared thermography. The method of [
13] uses artificial intelligence techniques in order to extract some features and perform a classification (comparing the performance of four typse of classifiers: K-nearest neighbor, Suport Vector Machine, Naïve Bayes and Random Forest). Other approaches based on artificial intelligence are presented in [
14,
15]. Reference [
14] presents a system based on neuro-fuzzy networks (using input variables such as temperature, pollution index, constructive characteristics and some local measurements) in order to automatize the evaluation of thermographic pictures of arresters.
Some combinations of the previous methods have also been succesfully employed [
15,
16]. Reference [
15] proposes thermal image temperature correlation with the 3rd harmonic’s resistive leakage current, based on an MLP neural network, in order to perform a classification of the condition of the arrester. Reference [
16] also proposes a hybrid method, combining the leakage current with infrared imaging, based on a regression model.
As an alternative to the above online methods, one can highlight the methods which use the monitoring of partial discharges. According to [
17], partial discharges can be measured based on electrical variables (such as current pulses measured with a high frequency current transformer [
18]) or as non-electrical variables (such as sound [
19], light [
20] and electromagnetic waves [
21]).
According to [
8], offline methods (those which require interrupting operation) provide better insight into the arrester condition. The most-used offline methods are the reference voltage method, the power loss method and the insulation resistance method, which are briefly described bellow. These methods are commonly used in laboratories, due to limitations under operational conditions or other risks [
17].
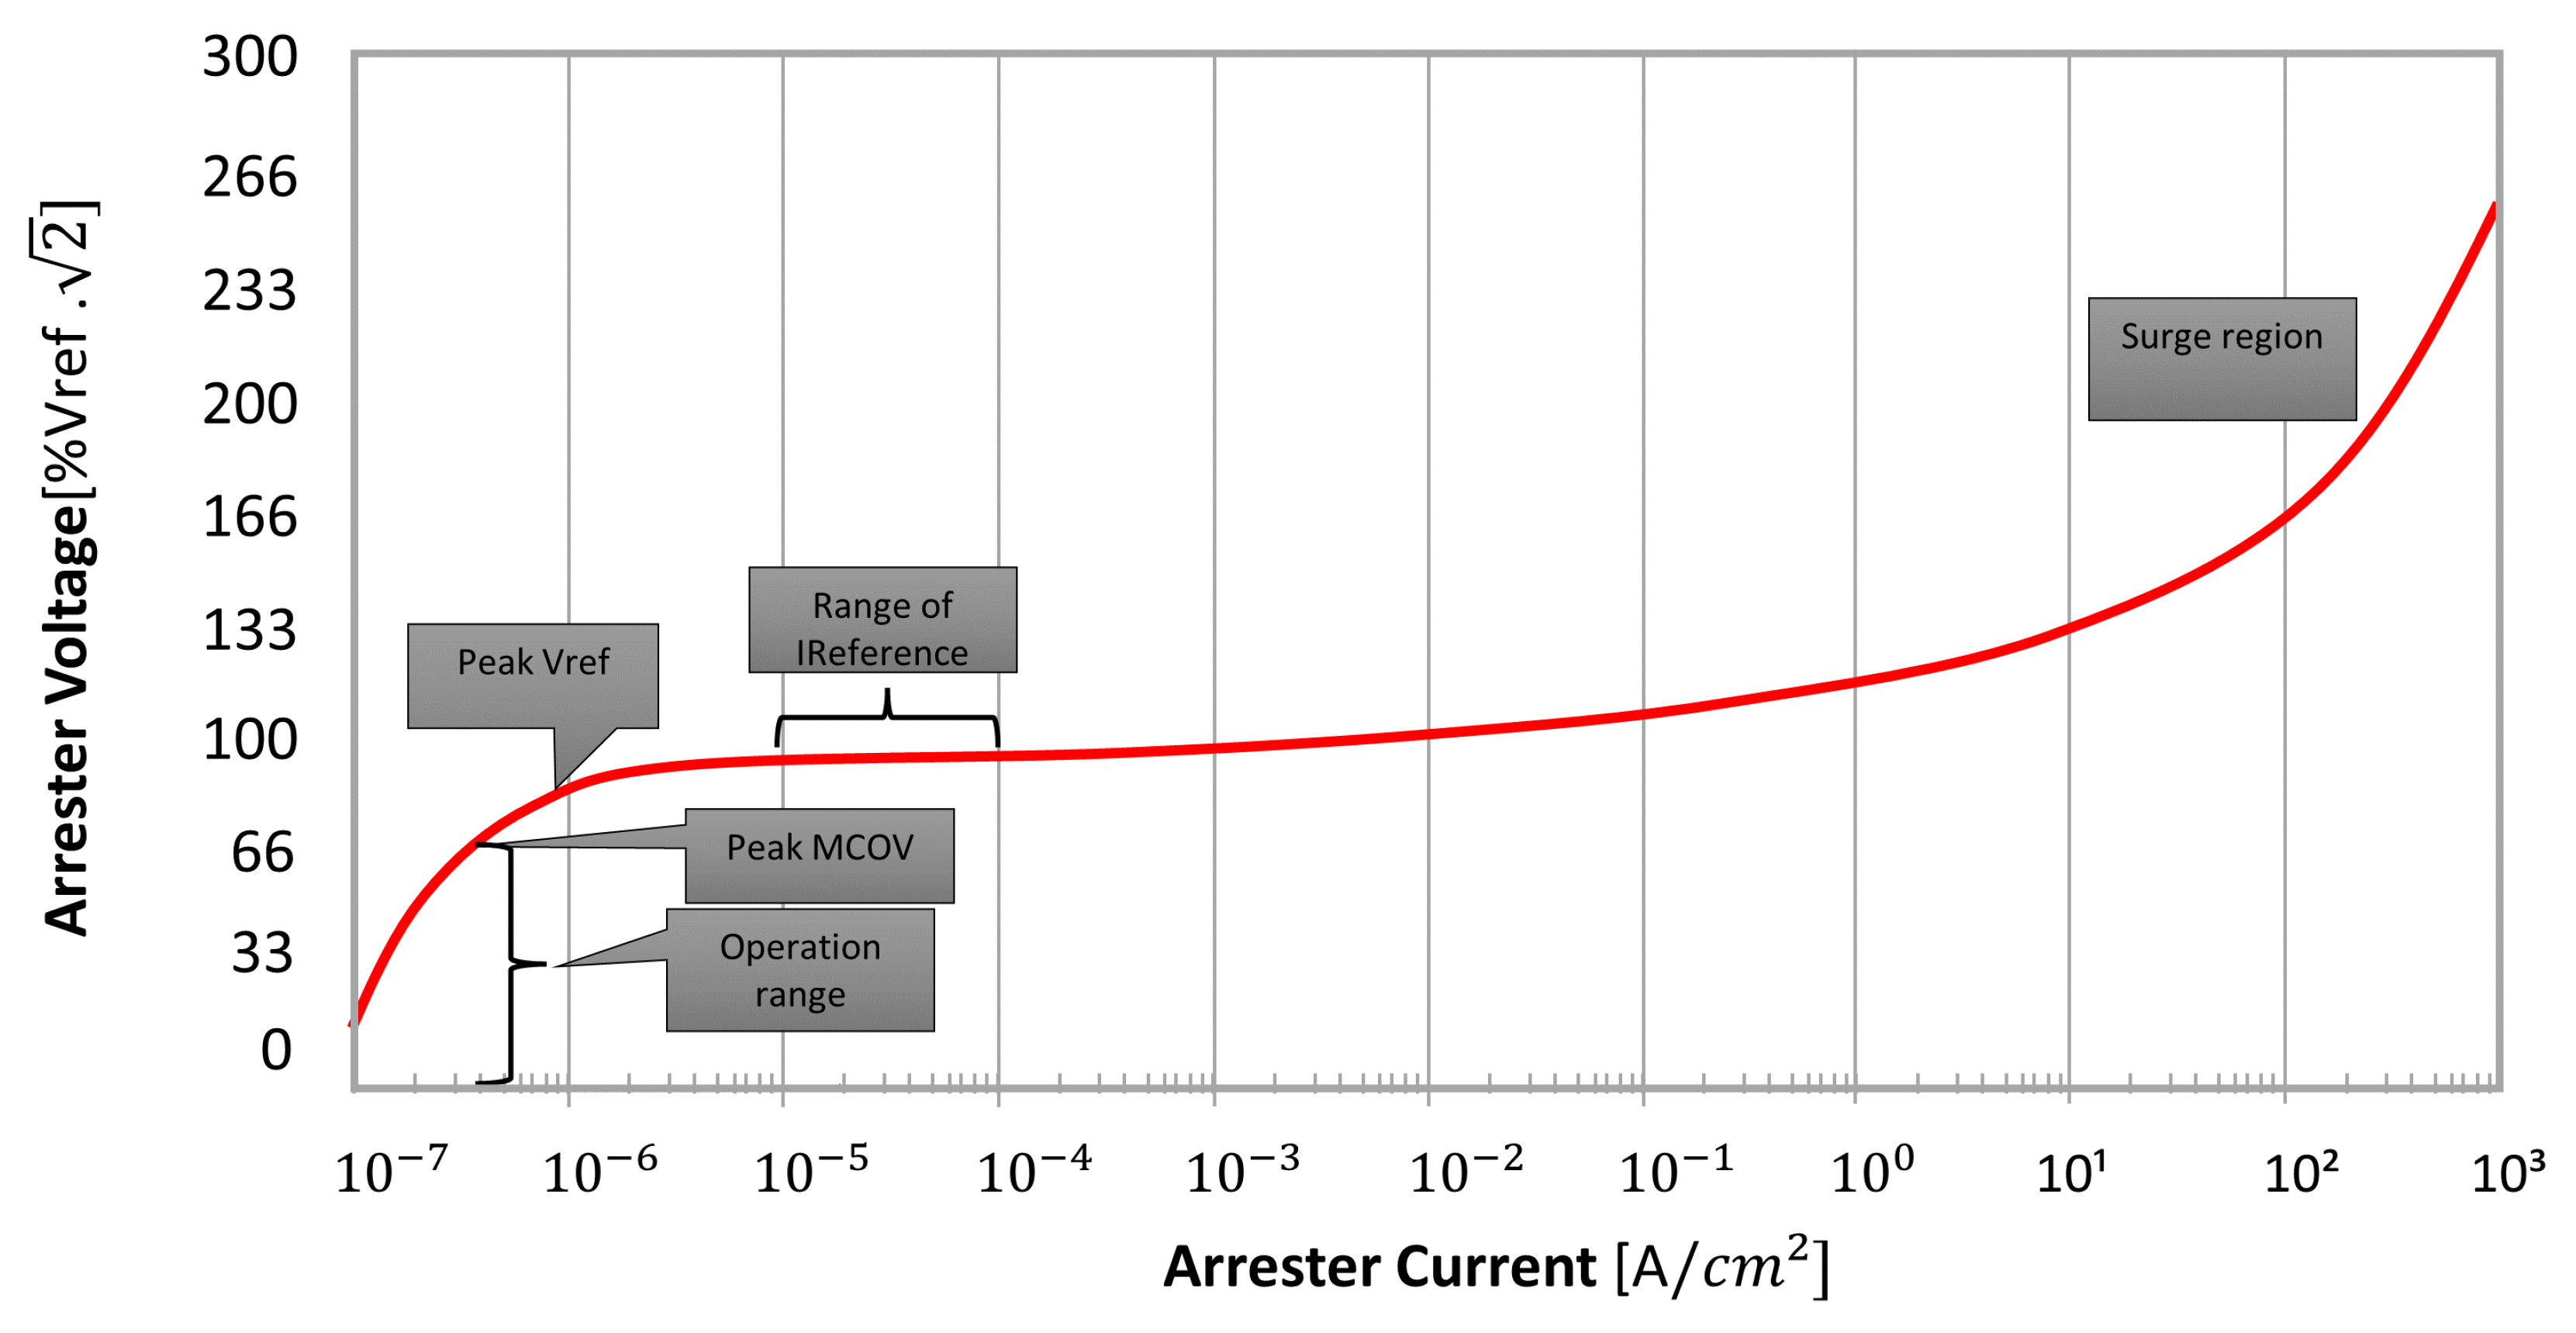
The reference voltage method is based on the application of a reference current (usually from 1 mA to 10 mA) and the measurement of the resulting voltage. Usually this test is performed before and after the application of a surge impulse (in the laboratory), as performed in [
22]. If the reference voltage is decreasing, this is an indication of degradation (as less voltage would be required to generate the same reference current [
23]).
The power loss method is based on the calculation of the dissipated power over the arrester [
24]; hence, the synchronous measurement of the applied voltage and the leakage current is required (which is considered to be a disadvantage of the method [
25]). The method, however, has been improved with the addition of an electrothermal model [
26] and the operating history [
27]. The use of the operating history allows the model to consider degradation caused by electrical and non-electrical factors observed in field operation.
The insulation resistance method is widely used in industry as a means to evaluate the condition of insulators. In normal operation, an arrester is an insulator; hence, the usual methods of insulation resistance can also be applied. These tests are performed with a megohmmeter, which applies a DC voltage (often elevated), and a small current is measured. In the case of arresters, the DC insulation test is considered to be a simple pass/fail test that produces results in only 60 s, though it is only suitable for low and medium voltage arresters [
28].
This paper proposes a new methodology for monitoring the degradation of surge arresters, based on Frequency Response Analysis (FRA)—a technique that is widely used for diagnostic of power transformers and is based on varying some electrical parameters of the device being tested. According to [
29], as a consequence of aging, there is a variation in several characteristic parameters of the ZnO varistor, including the dielectric parameters, which can, hence, be detected by FRA.
Section 2 presents the aspects of theory required to understand the experiments of
Section 3, including a brief description of the working principle of the zinc oxide surge arrester, its main parameters and the proposed method of diagnosis based on FRA.
Section 3 presents some preliminary results on the offline application of FRA in order to detect degradation in arresters.
3. Results and Discussion
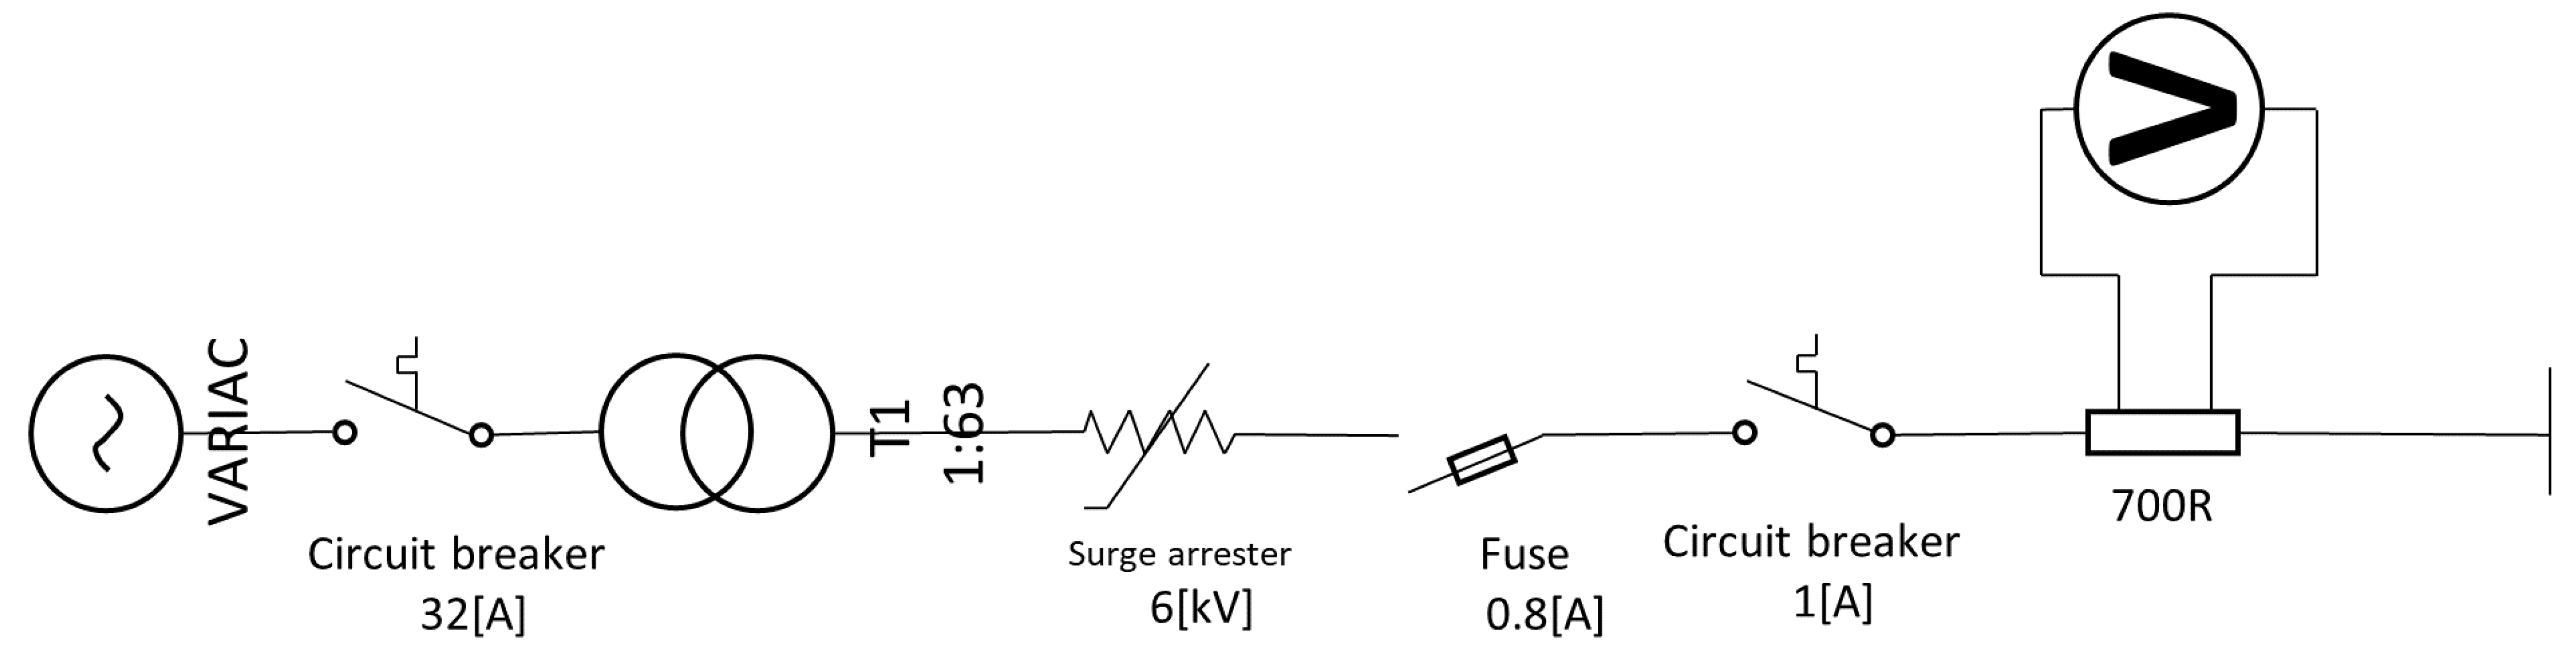
Figure 4 presents the schematic circuit used to perform the accelerated aging tests on the arrester samples. In order to increase the voltage above the MCOV of the arrester, a 220V VARIAC (of manufacturer JNG, Wenzhou, China) was connected at the low voltage windings of a 220 V:13.8 kV (1:63) transformer. The arrester was connected to the medium voltage windings, with a shunt resistor of 700
(in order to measure the leakage current with a voltmeter). Circuit breakers and a fuse were also included for protection, in case of accidental conduction of the arrester.
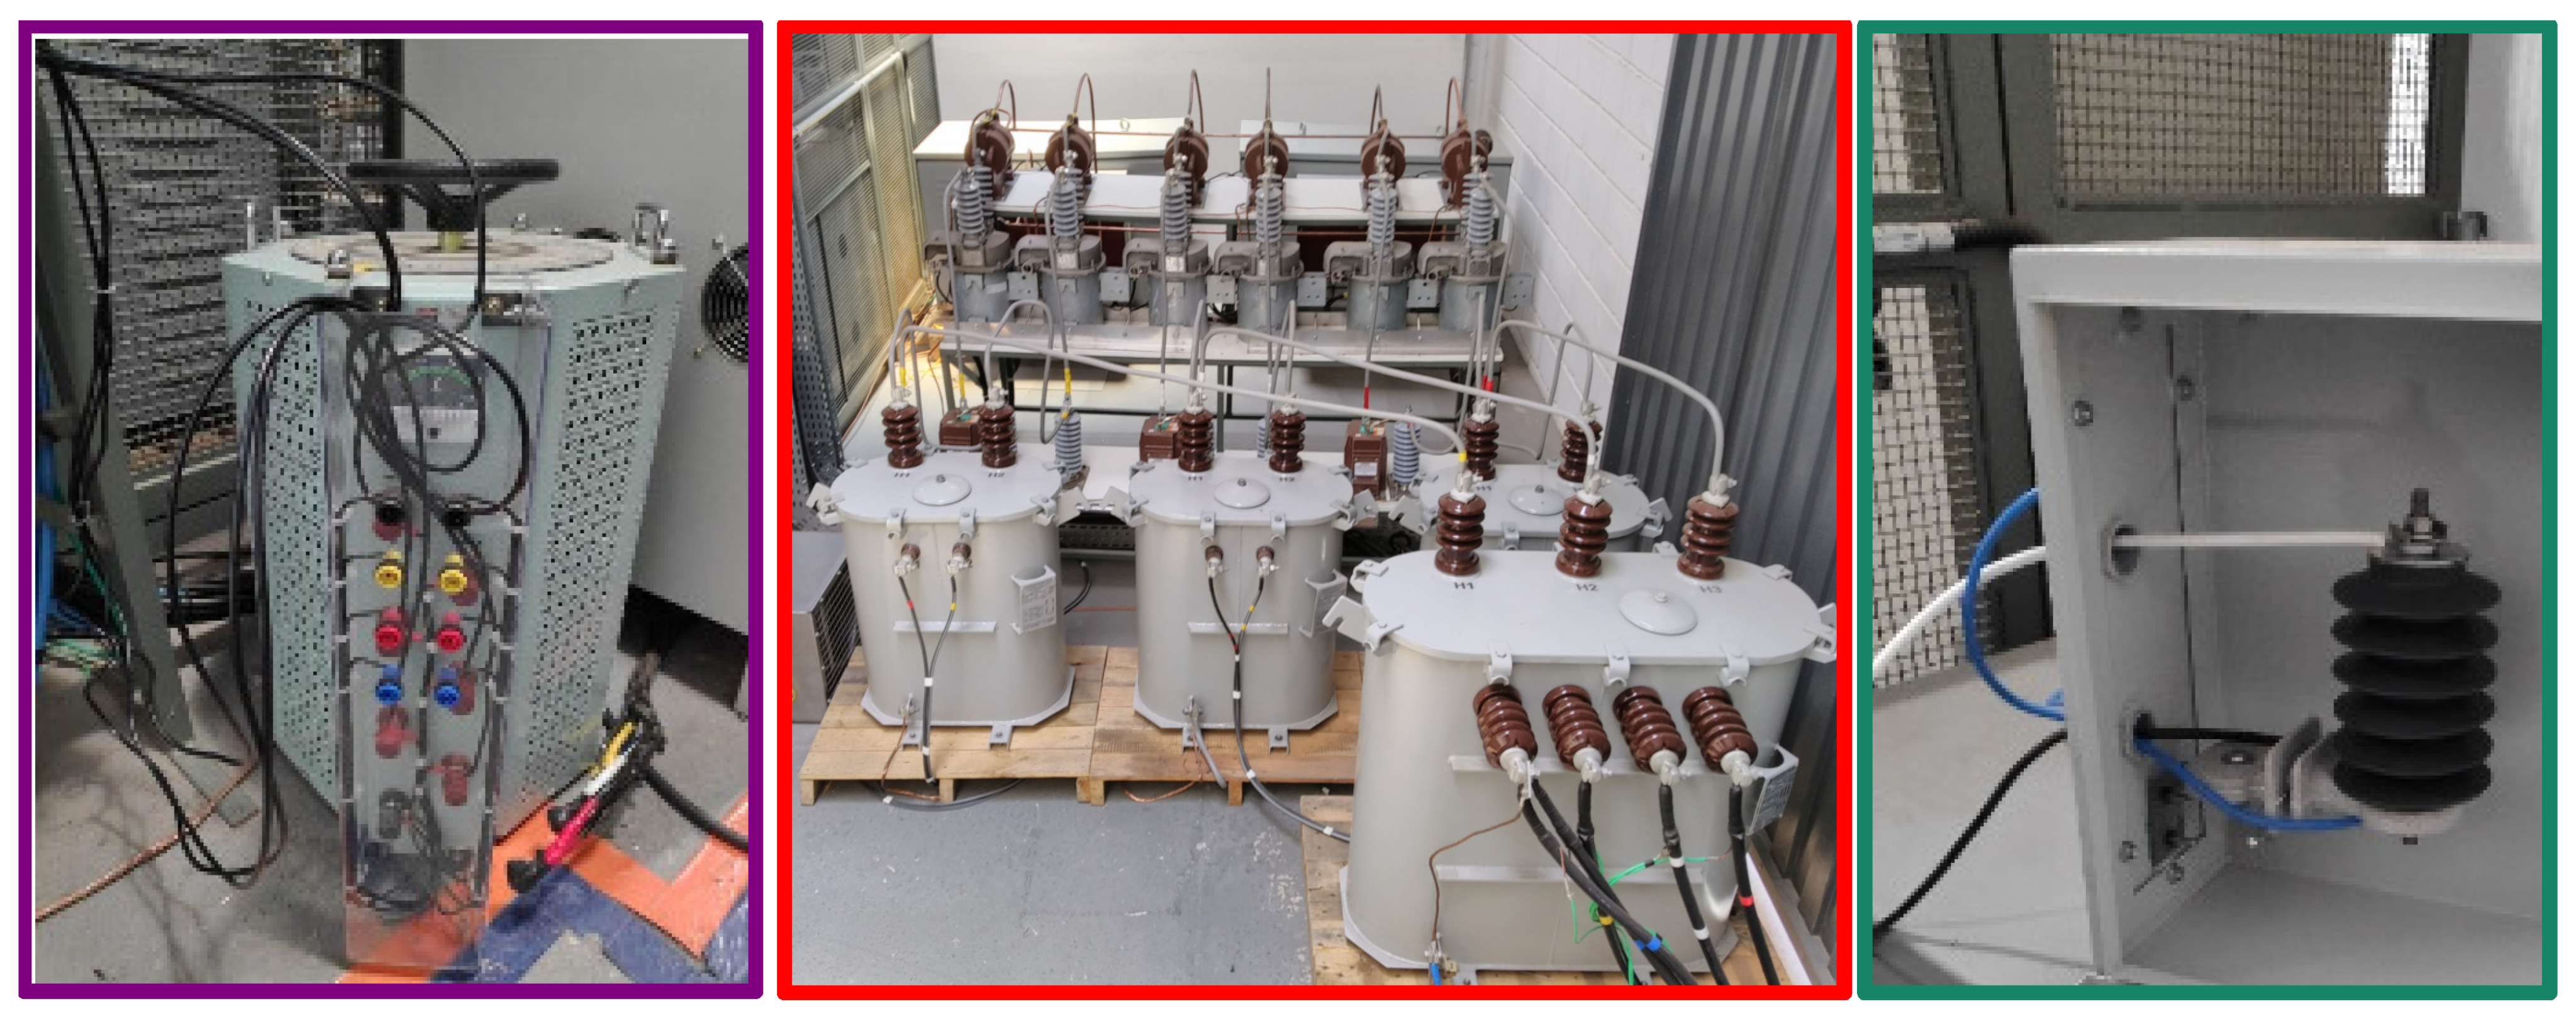
Figure 5 presents a photograph of the medium voltage test substation (previously presented in [
44]), illustrating where the 1:63 transformer was located and where the test could be conducted safely. The figure also presents the low voltage VARIAC (located outside the protective fence) and the arrester that was aged (located inside the fence).
Two groups of tests were performed. In the first group of tests (presented in
Section 3.1), the samples were brought to failure condition and some parameters were measured. In the second group of tests (presented in
Section 3.2), the degradation of the samples was slowly increased, in order to see the evolution of the measured parameters according to the degradation level. In both cases, through the VARIAC in
Figure 5, a voltage higher than the MCOV was applied (in order to force a leakage current). The difference was the duration of exposure to the leakage currents. After each exposure to leakage current, the arrester was tested using a megohmmeter (which is one of the offline tests described in the literature, and the easiest to be performed without complex laboratory equipment) and some frequency response methods (using an LCR meter and the FRA). In all tests, the results showed agreement with the damage level (presenting, simultaneously, a decrease in the insulation resistance and an increase in resistive losses as the impedance angle shifted from capacitive (
) towards resistive (
) behavior).
3.1. Analysis of Failure
The failure analysis consisted of evaluating changes in the physical and electrical characteristics of the internal disks of test samples of surge arresters. The test consisted of forcing a high leakage current through the samples for two cycles of 8 h (each cycle).
Two samples (identified as PR-4 and PR-5) were exposed to a voltage (7.4 kV) higher than the their MCOV (5.1 kV, in order to force a leakage current of around 10 to 15 mA. The prolonged permanence of the samples under this condition triggers a thermal avalanche, which culminates in the failure of the samples.
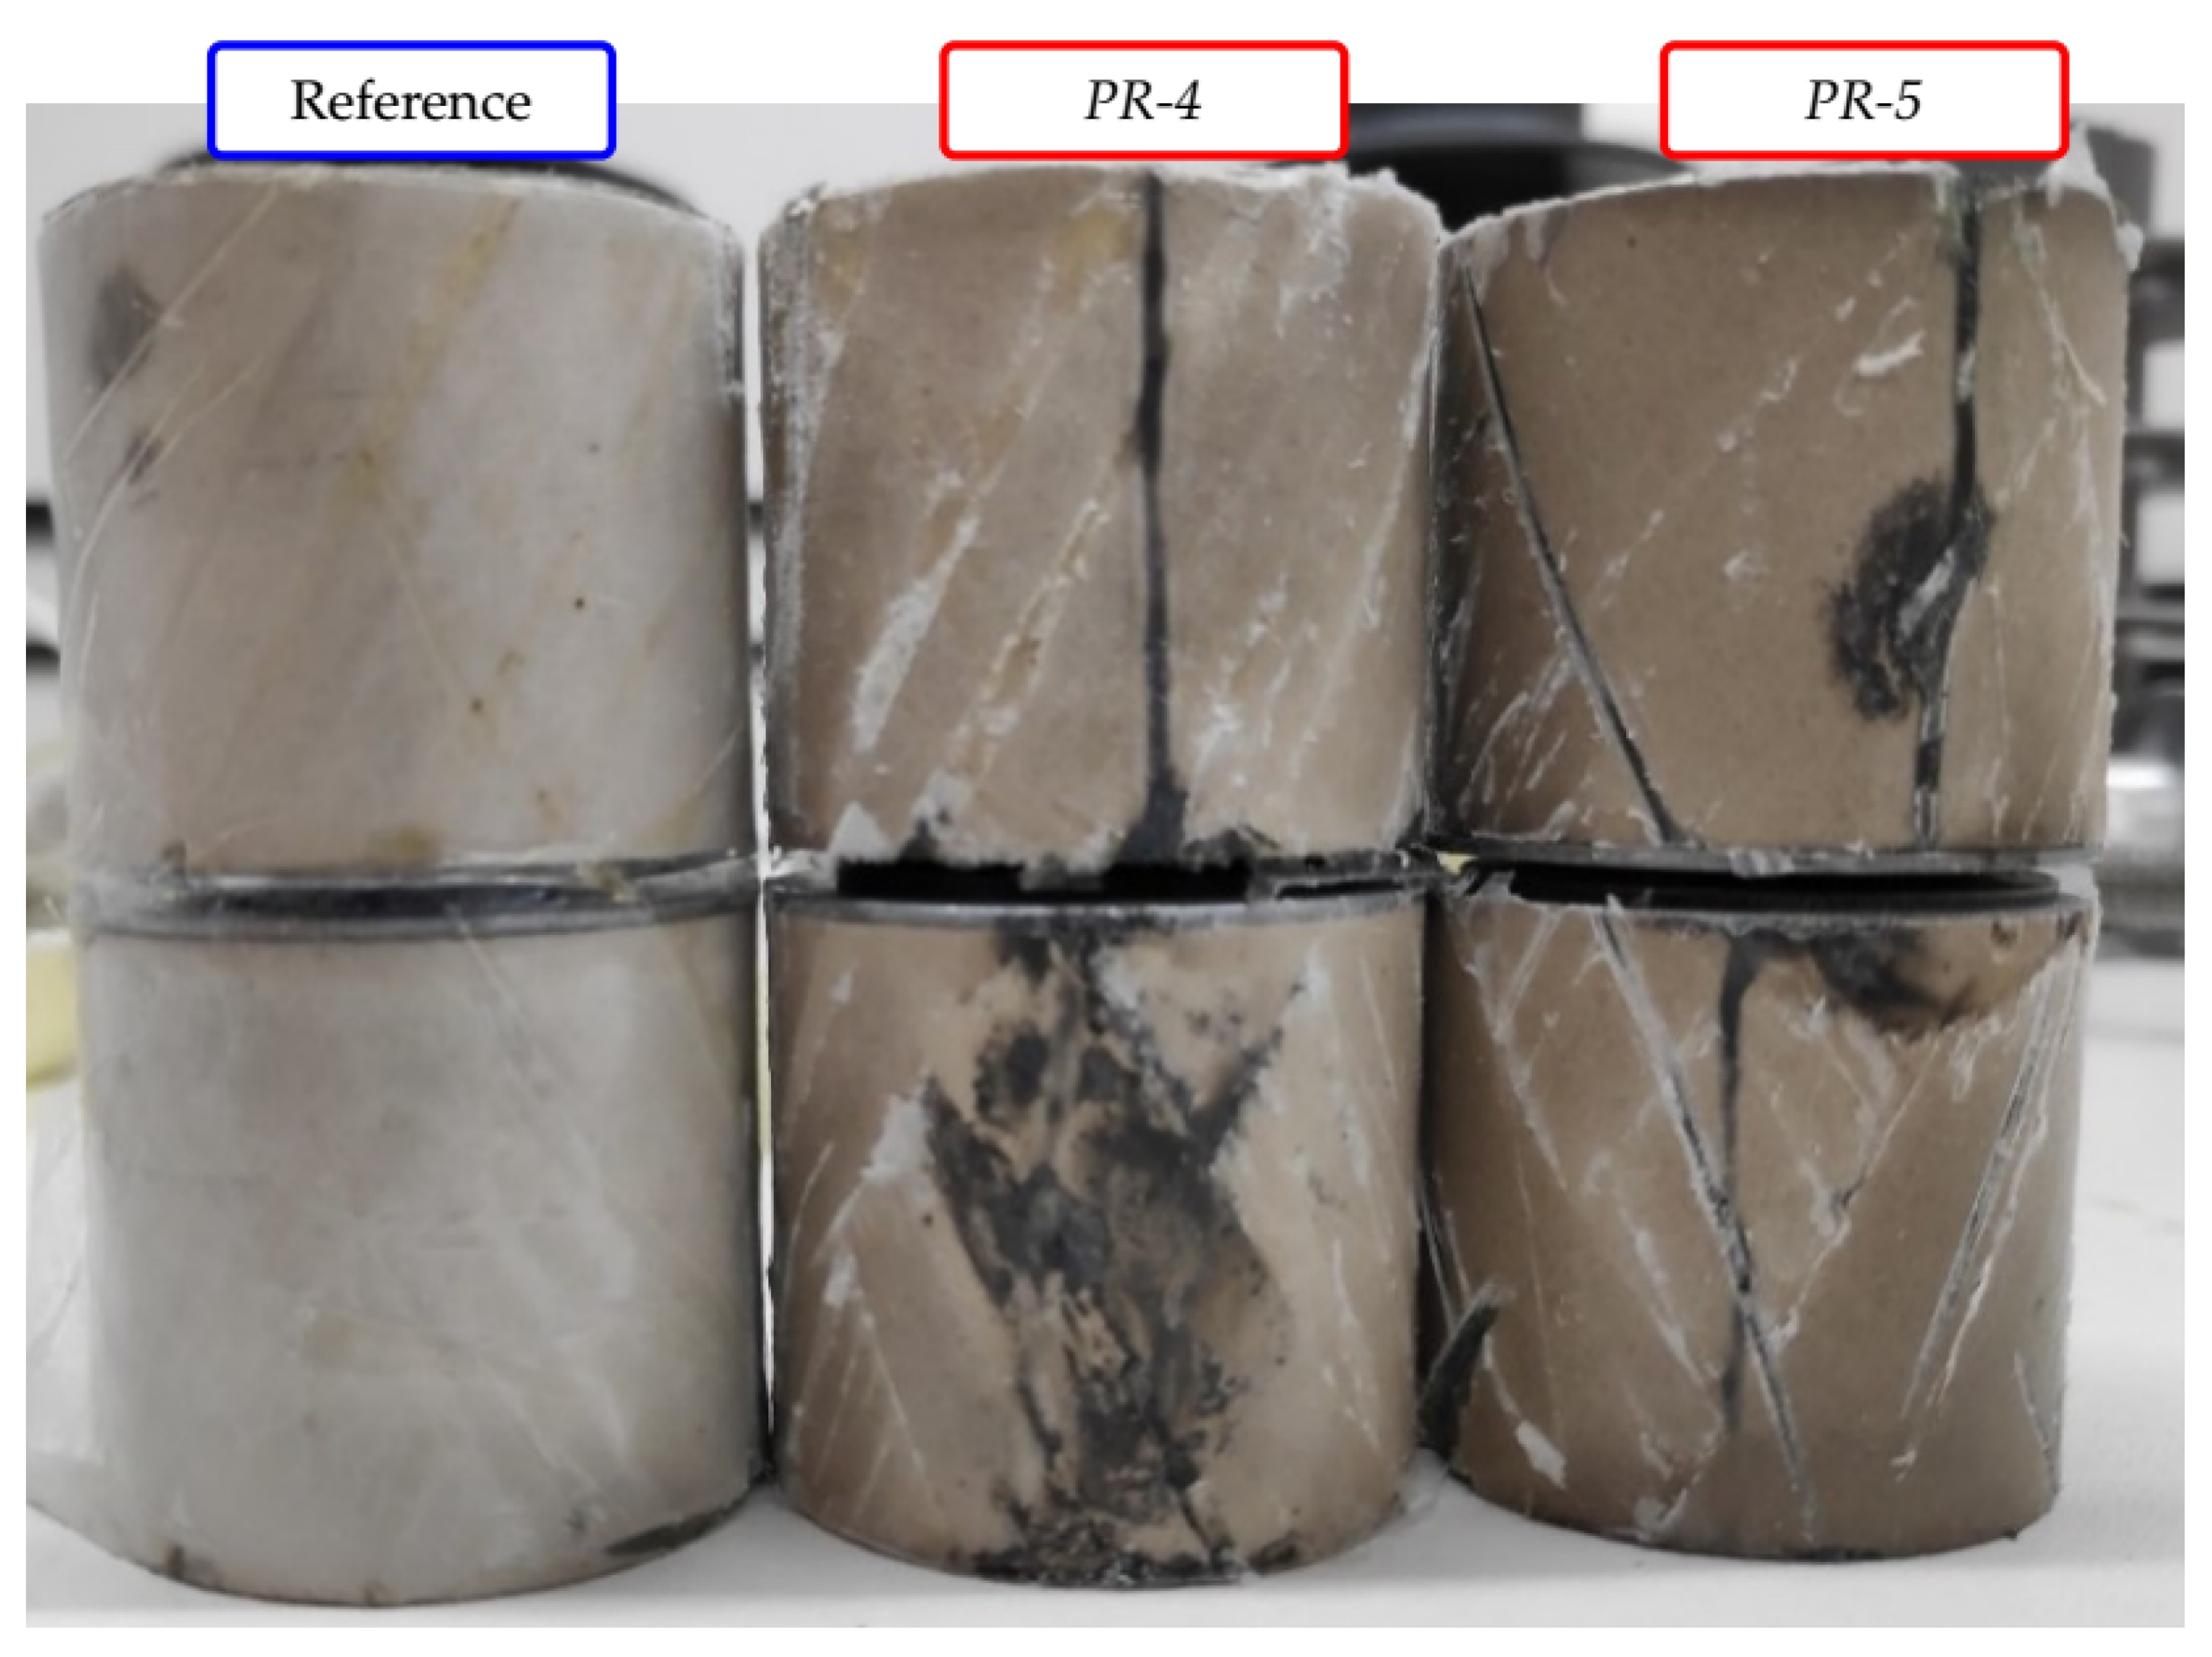
After the test, both samples were disassembled. Additionally, a brand new sample (which did not suffer any damage) was also disassembled, to serve as a visual reference.
Figure 6 presents the three disassembled samples. It can be noted that the thermal avalanche (combined with the high voltage in the test) caused some surface tracking and puncture at both
PR-4 and
PR-5. Sample
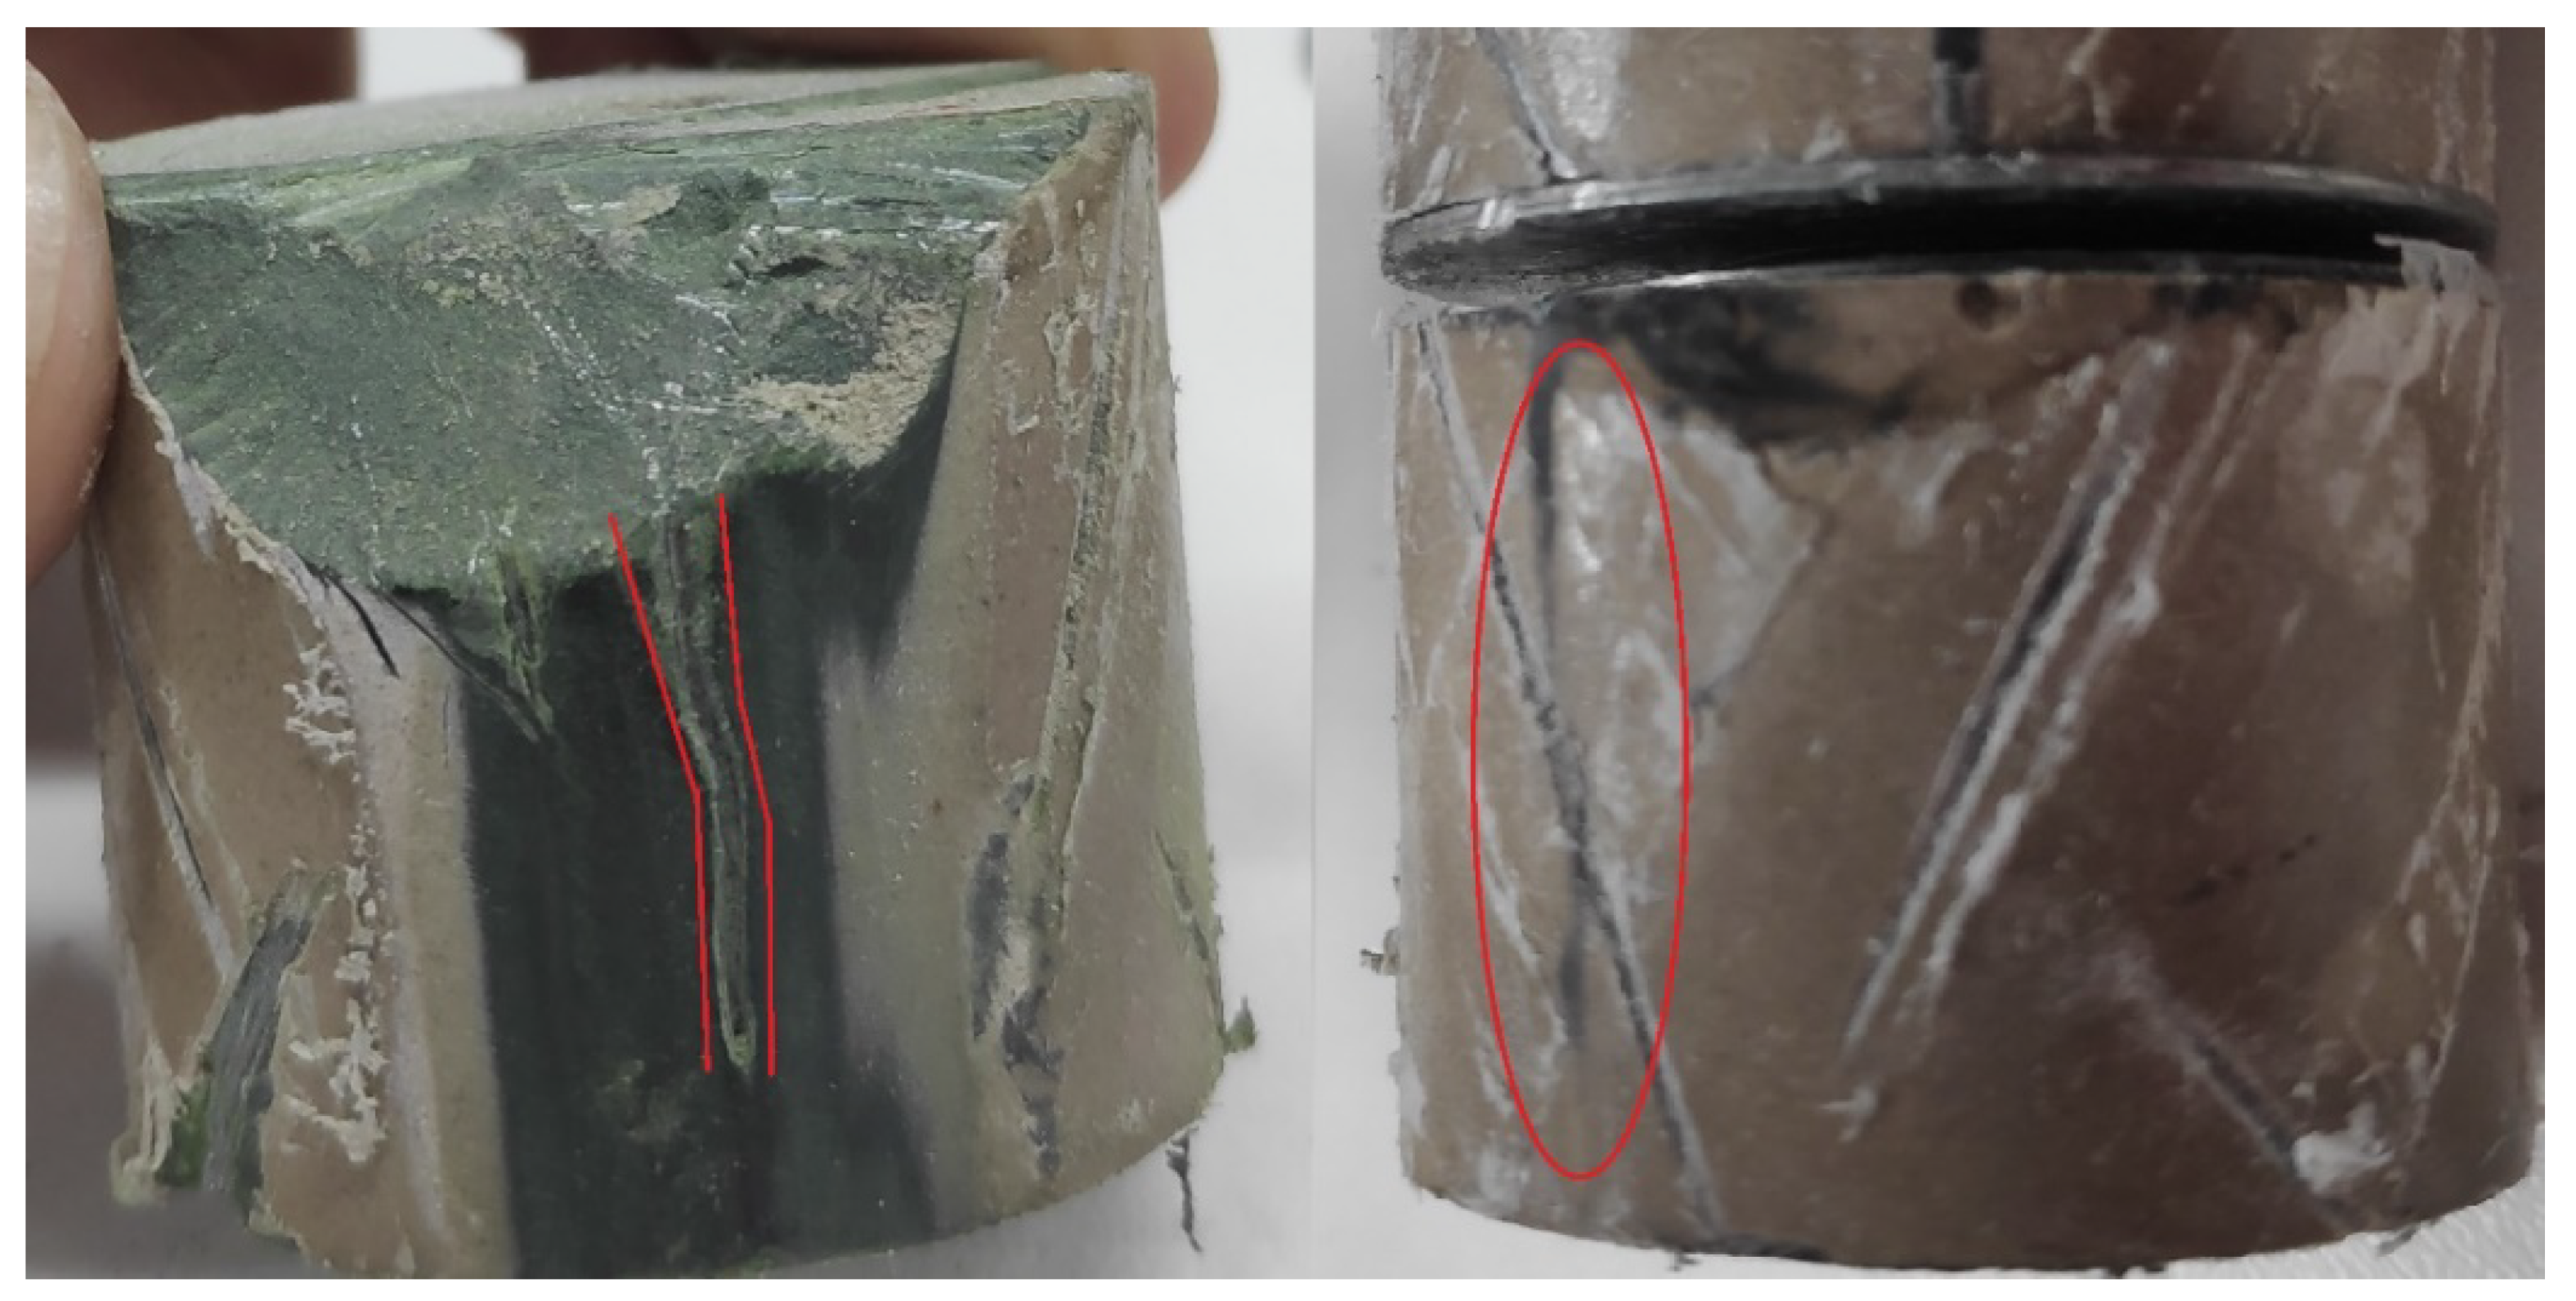
PR-5 was further disassembled, in order to better observe the surface tracking, as presented in
Figure 7.
The insulation resistances of the samples (before and after the failure) were measured (with a megohmmeter, under 2.5 kV and 5 kV), as presented in
Table 1. The low insulation resistance measured after the prolonged exposure to leakage current is an indication of failure of both samples.
An LCR meter was also used (before and after the test), in order to observe changes in some electrical parameters of the samples, as presented in
Table 2. It can be noted that the samples changed from a capacitive impedance (
, characteristic of an insulator material) before the failure towards a resistive impedance (
) after the failure.
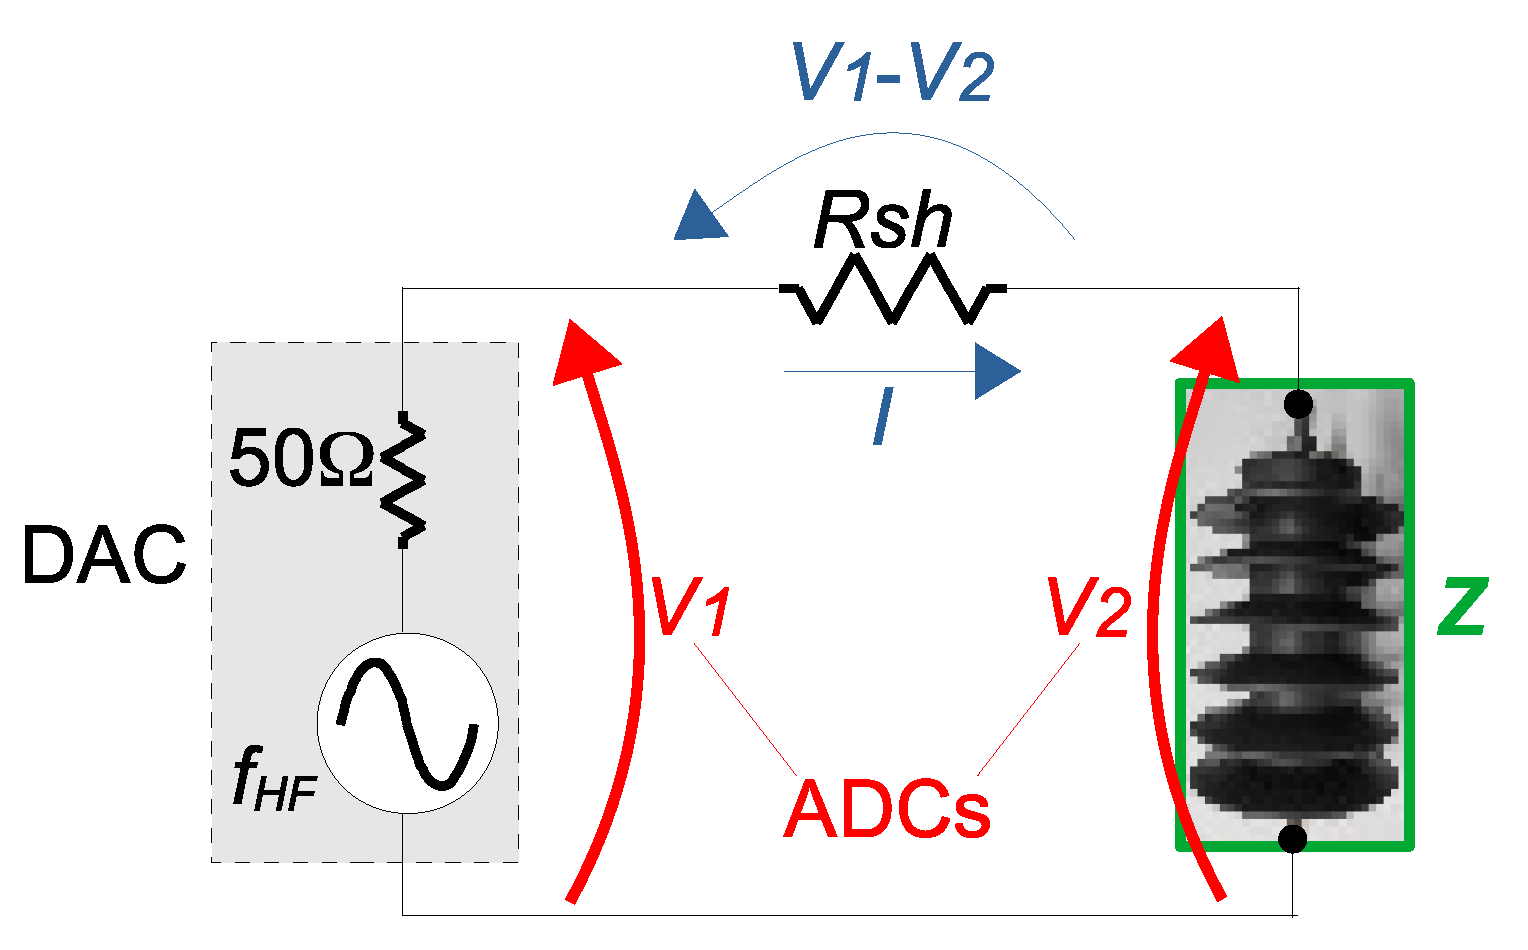
As well, an FRA sweep (obtained with the prototype described in [
40], with a shunt resistor
= 1 k
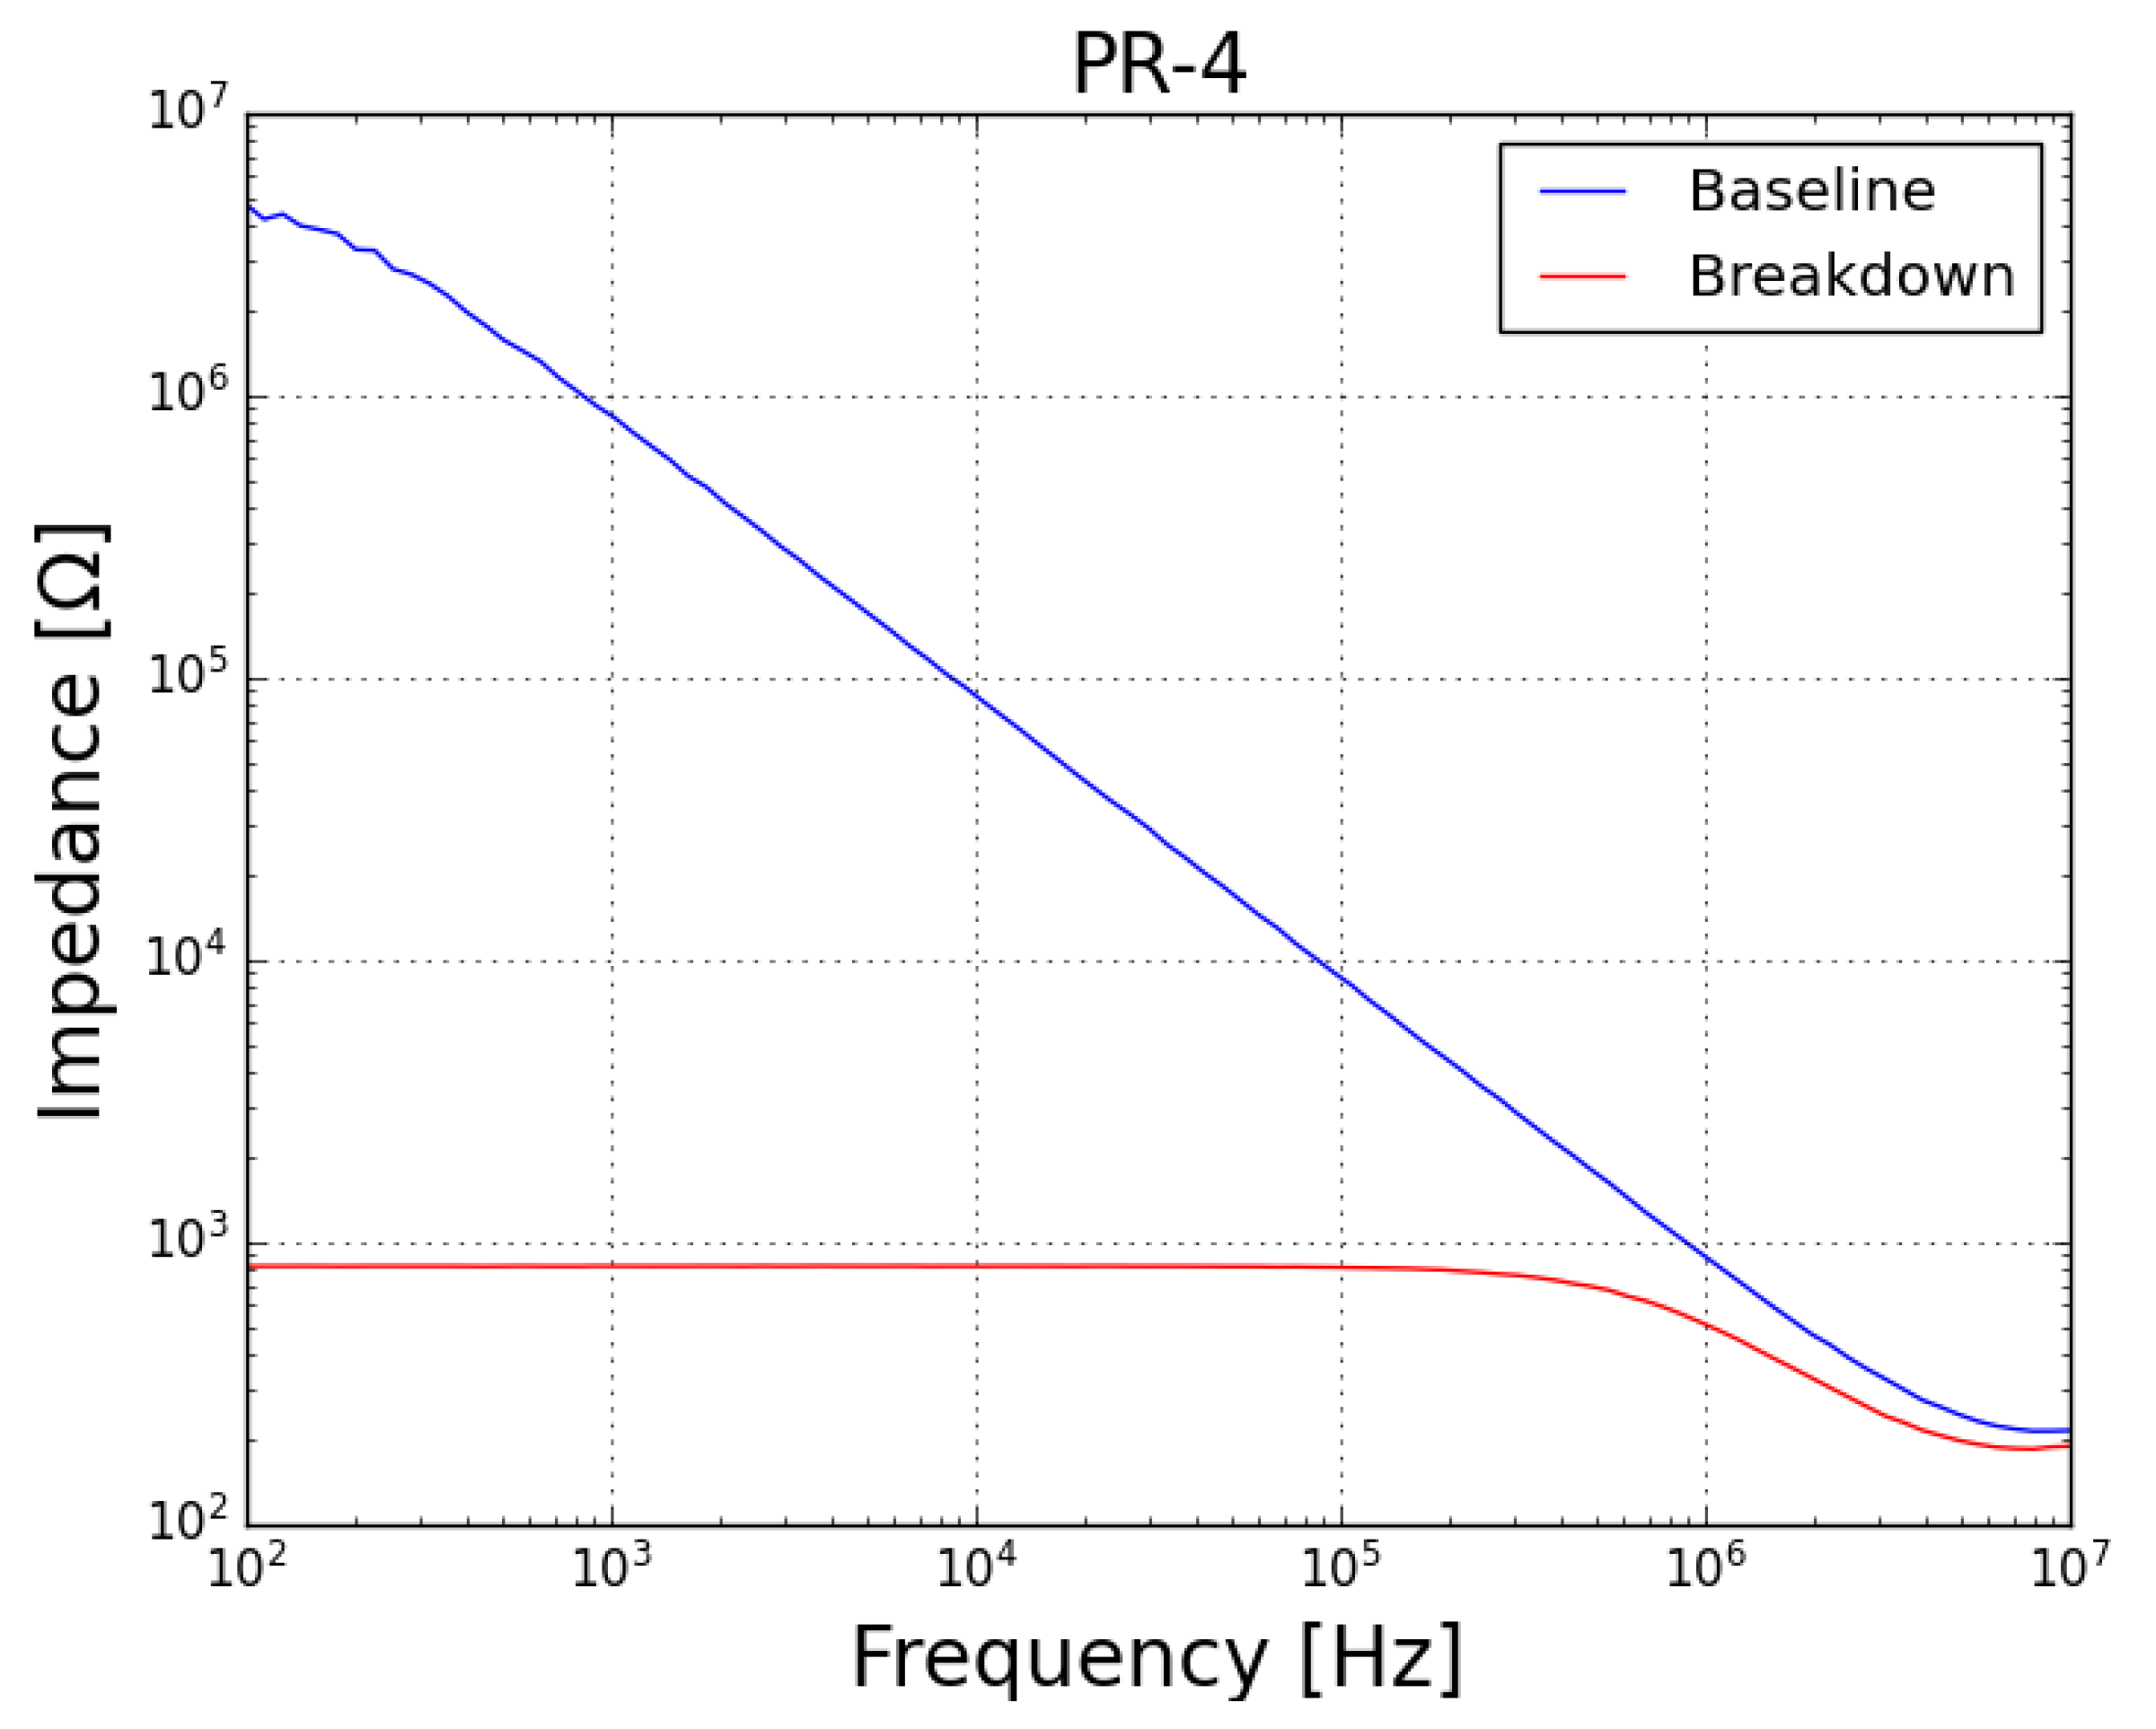
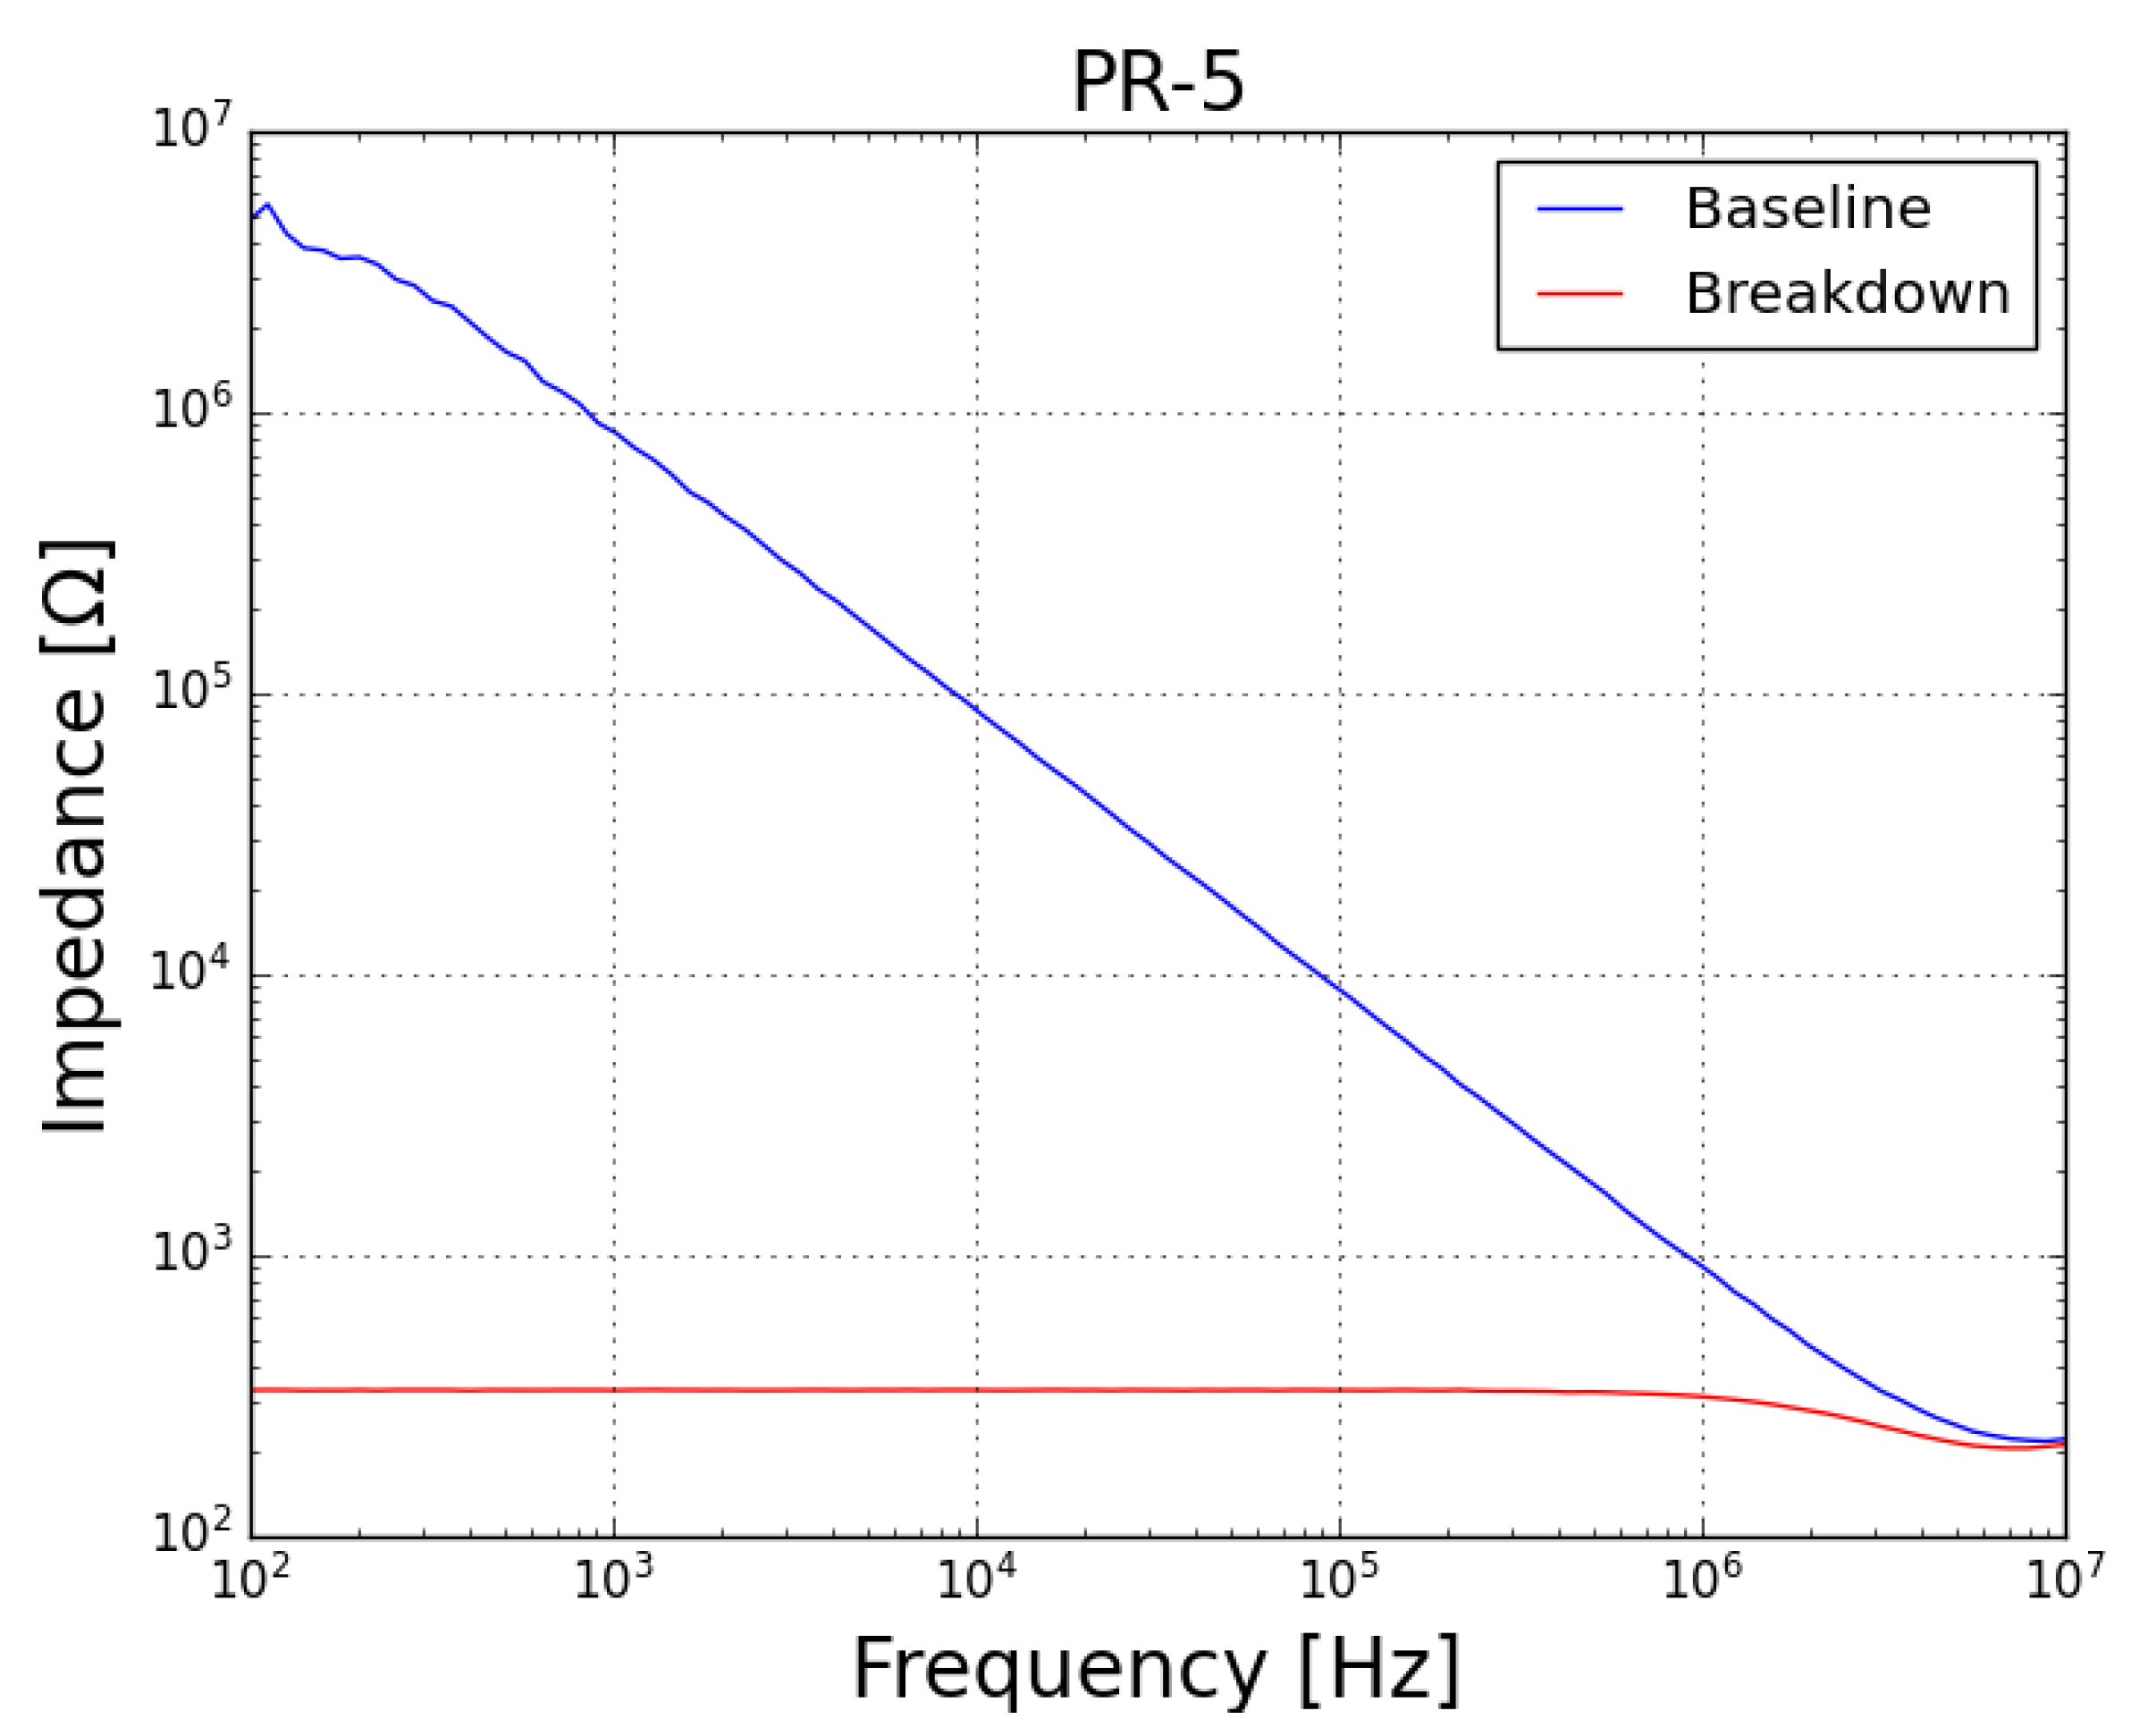
, amplification by a factor of 10 at the DAC and attenuation of 0.1 at the ADCs) was performed on the samples, both before (blue plots) and after (red plots) the test. Concerning the impedance (magnitude) spectra of both samples (
PR-4 presented in
Figure 8 and
PR-5 presented in
Figure 9), it can be noted that, before the test, the samples behaved as a capacitor (with reactance dropping with the increase in frequency, which is characteristic of a good insulator) and, after the failure, both samples behaved as a resisistor (constant reactance, independent of frequency).
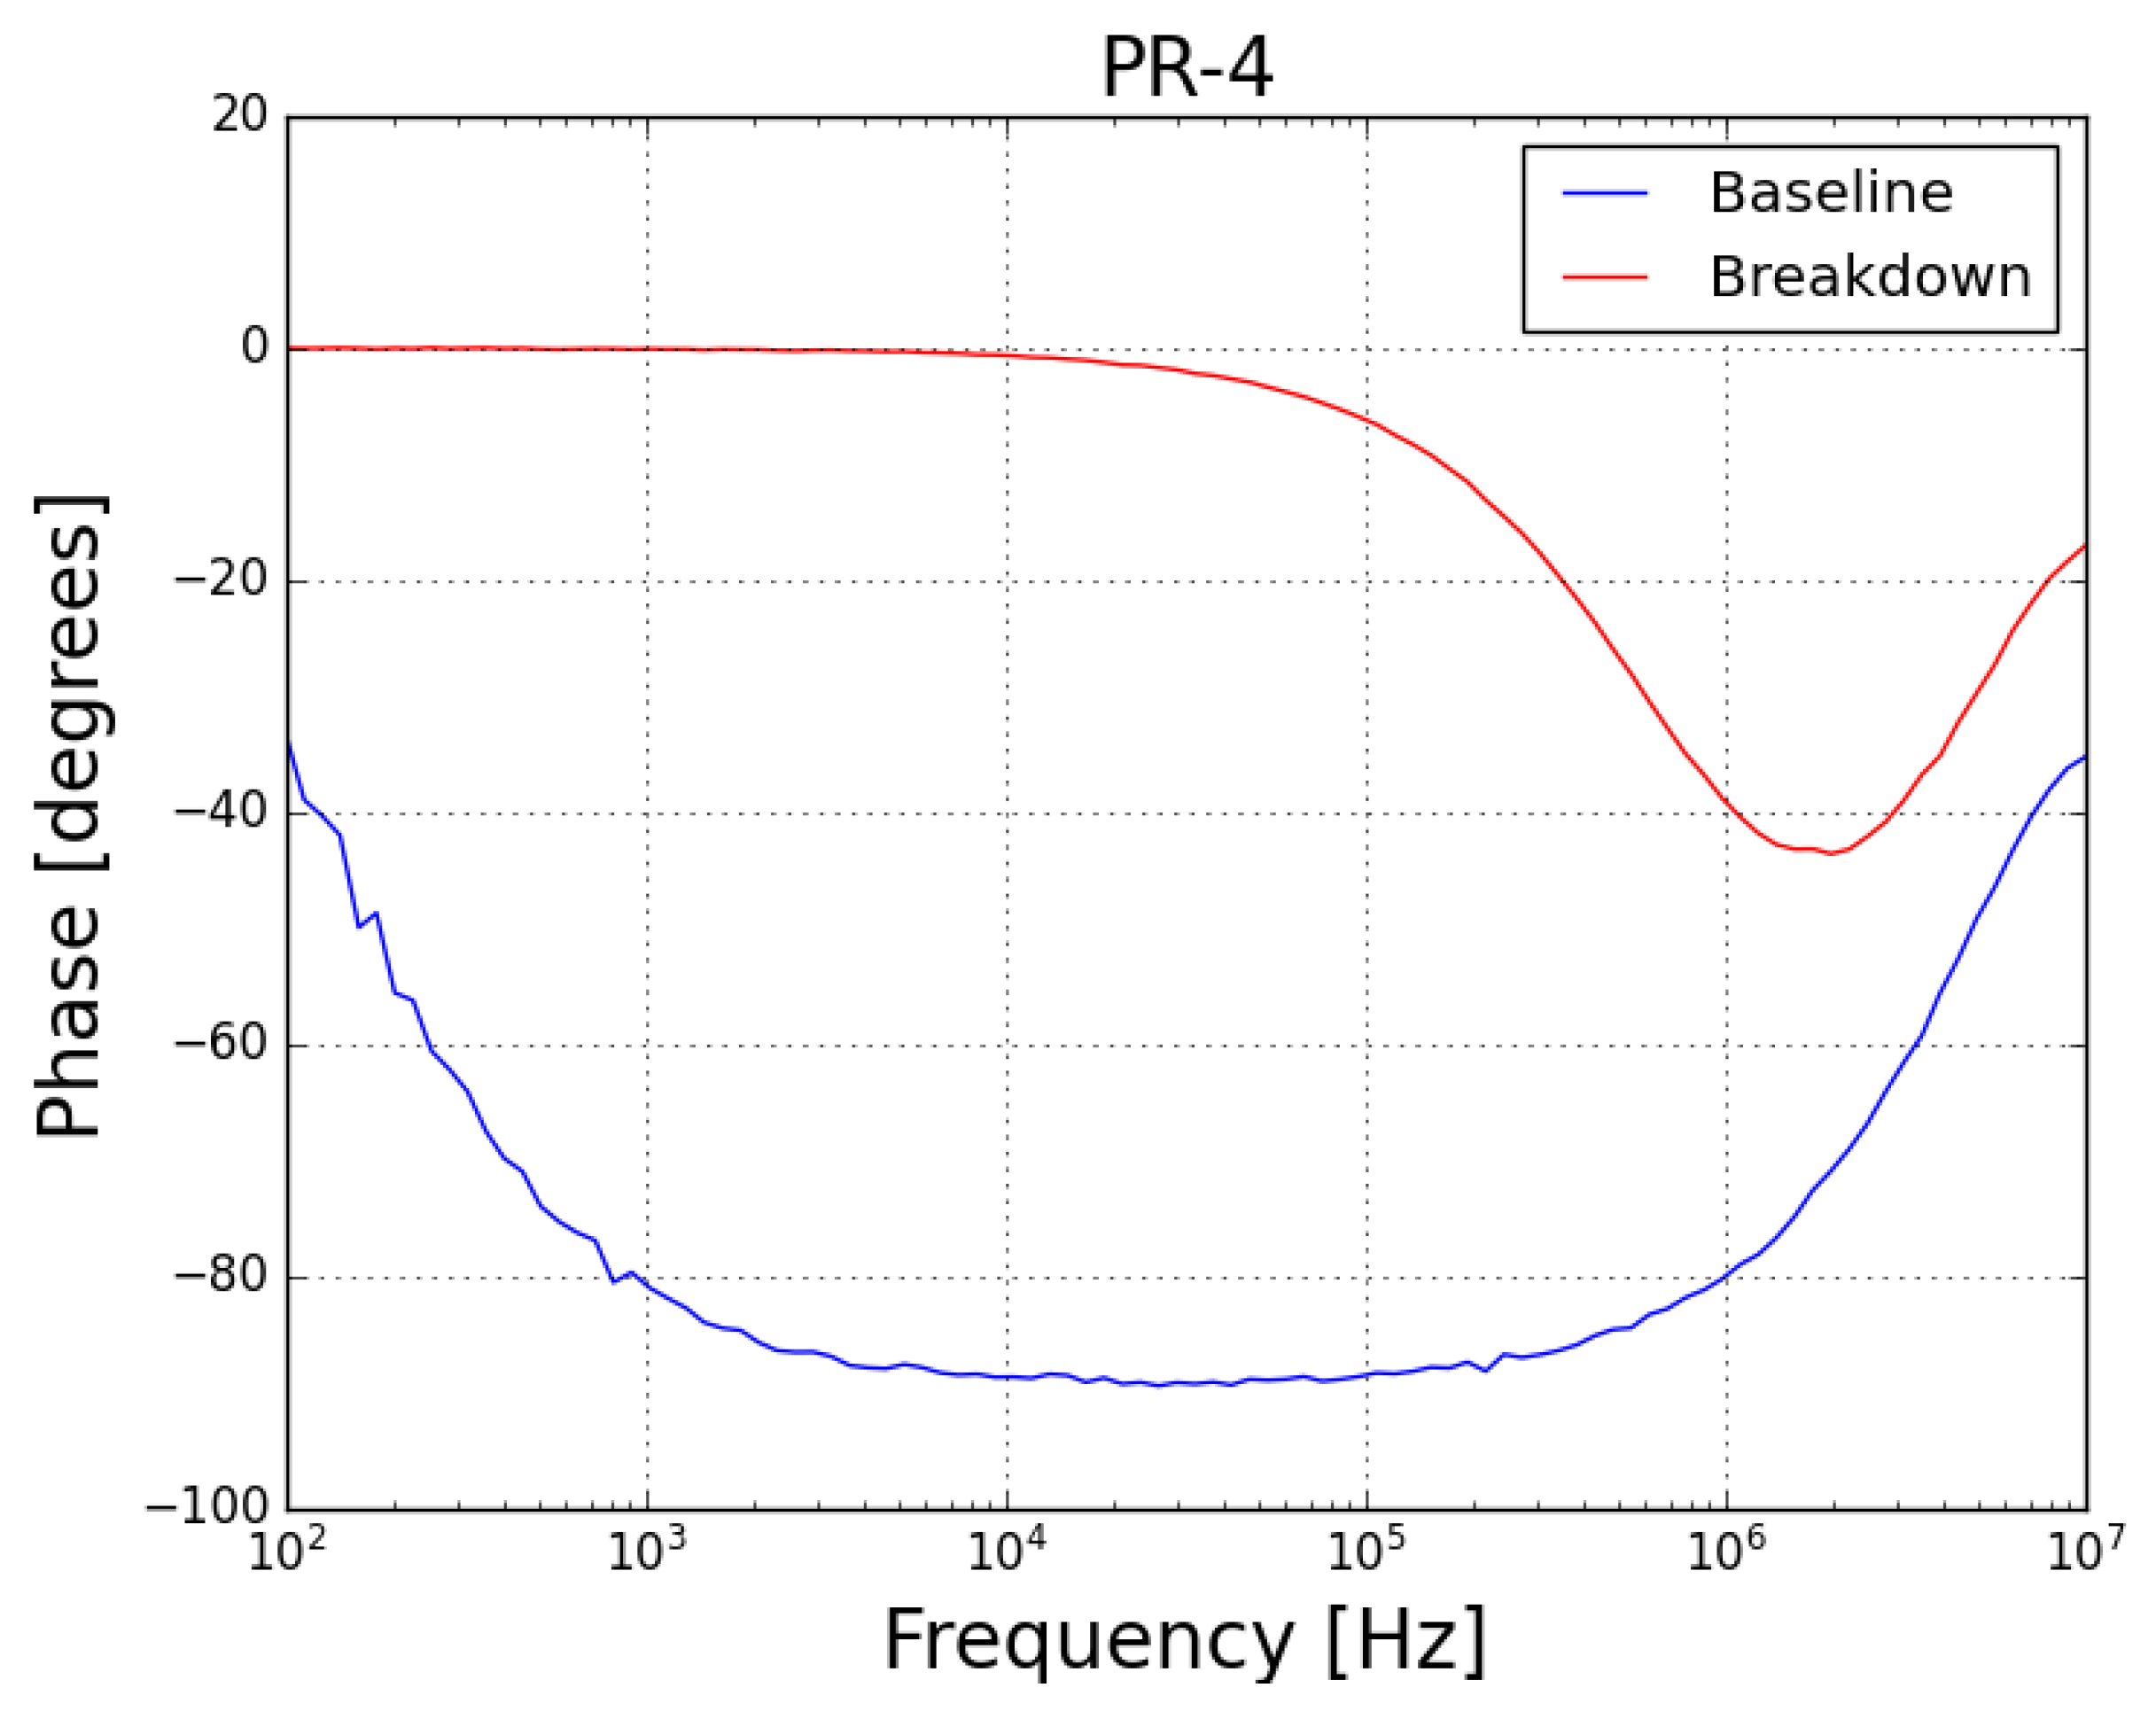
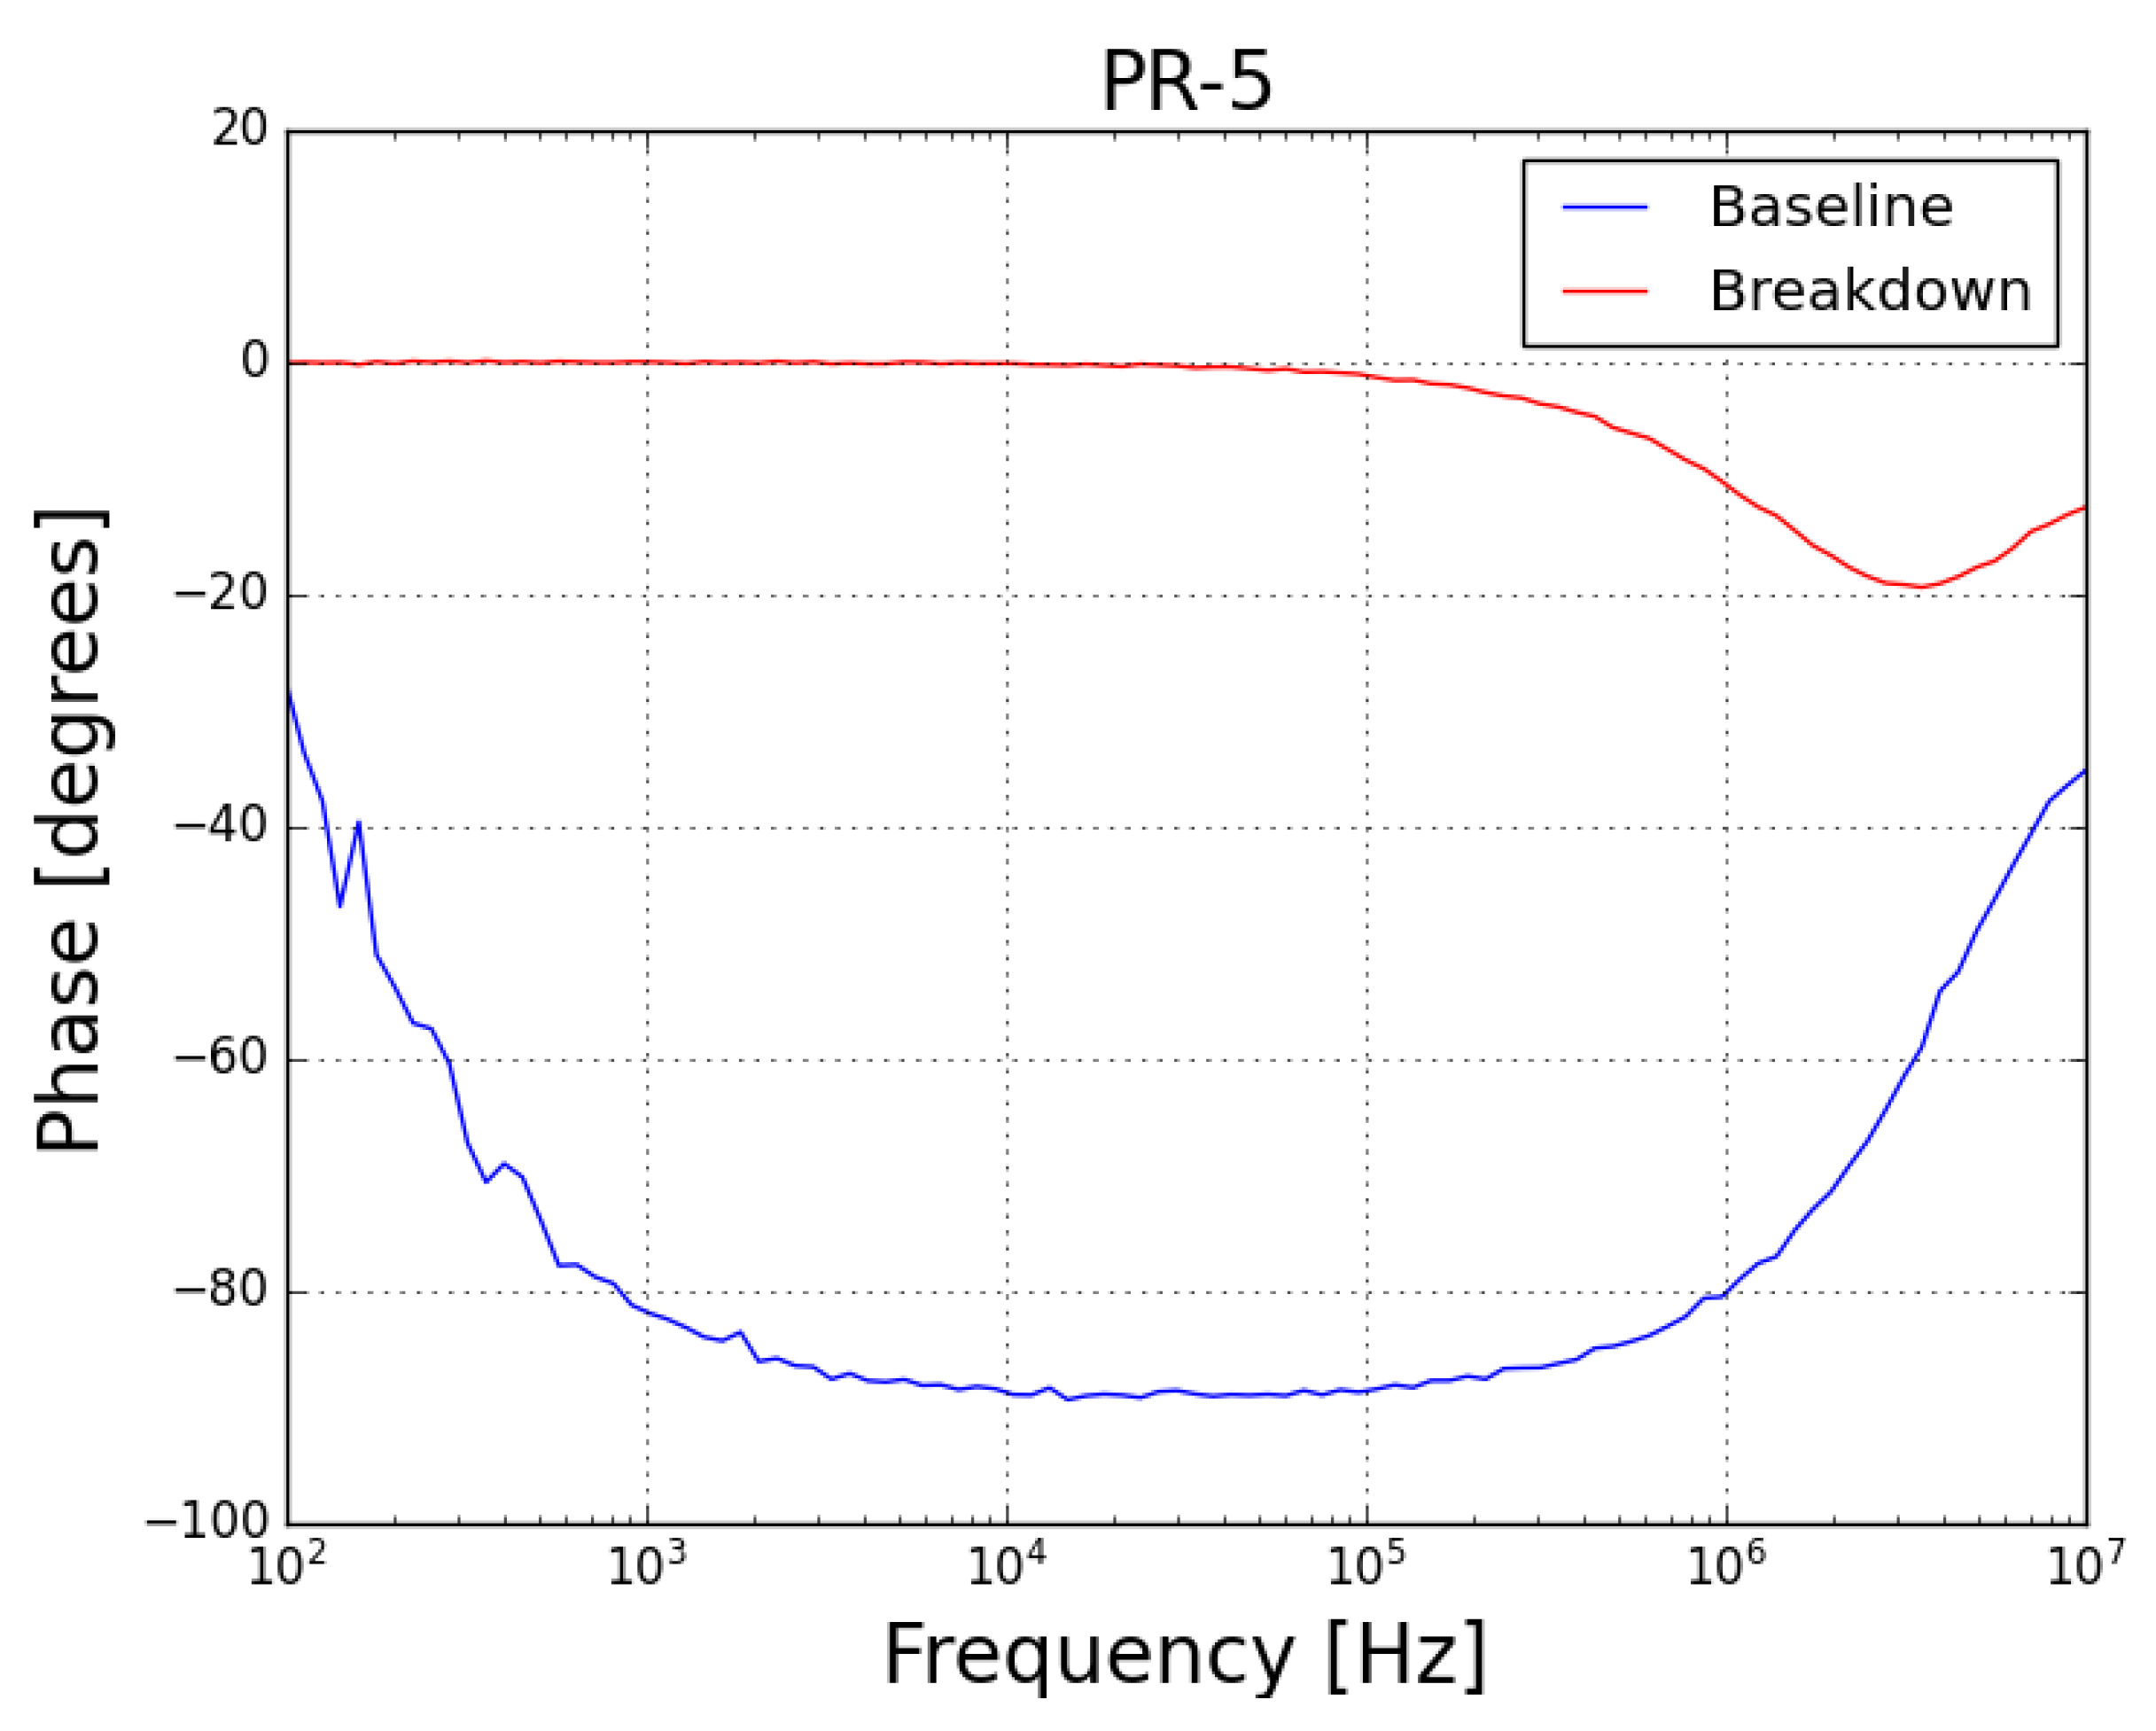
Concerning the phase spectra of both samples (
PR-4 presented in
Figure 10 and
PR-5 presented in
Figure 11), it can be noted that, before the test, the samples behaved as a capacitor (with phase angle near 90
, which is characteristic of a good insulator) and, after the failure, both samples behave as a resistor (with phase angle near 0
).
3.2. Analysis of Slow Degradation
Three samples (identified as
PR-1,
PR-2 and
PR-6) were exposed to a voltage (7.4
) higher than the their MCOV (5.1
), in order to force a leakage current of around 10 to 15 mA (justas in
Section 3.1). The permanence (for cycles with duration of around 60 min) of the samples under this condition triggers a thermal avalanche, which gradually produces a degradation of the samples.
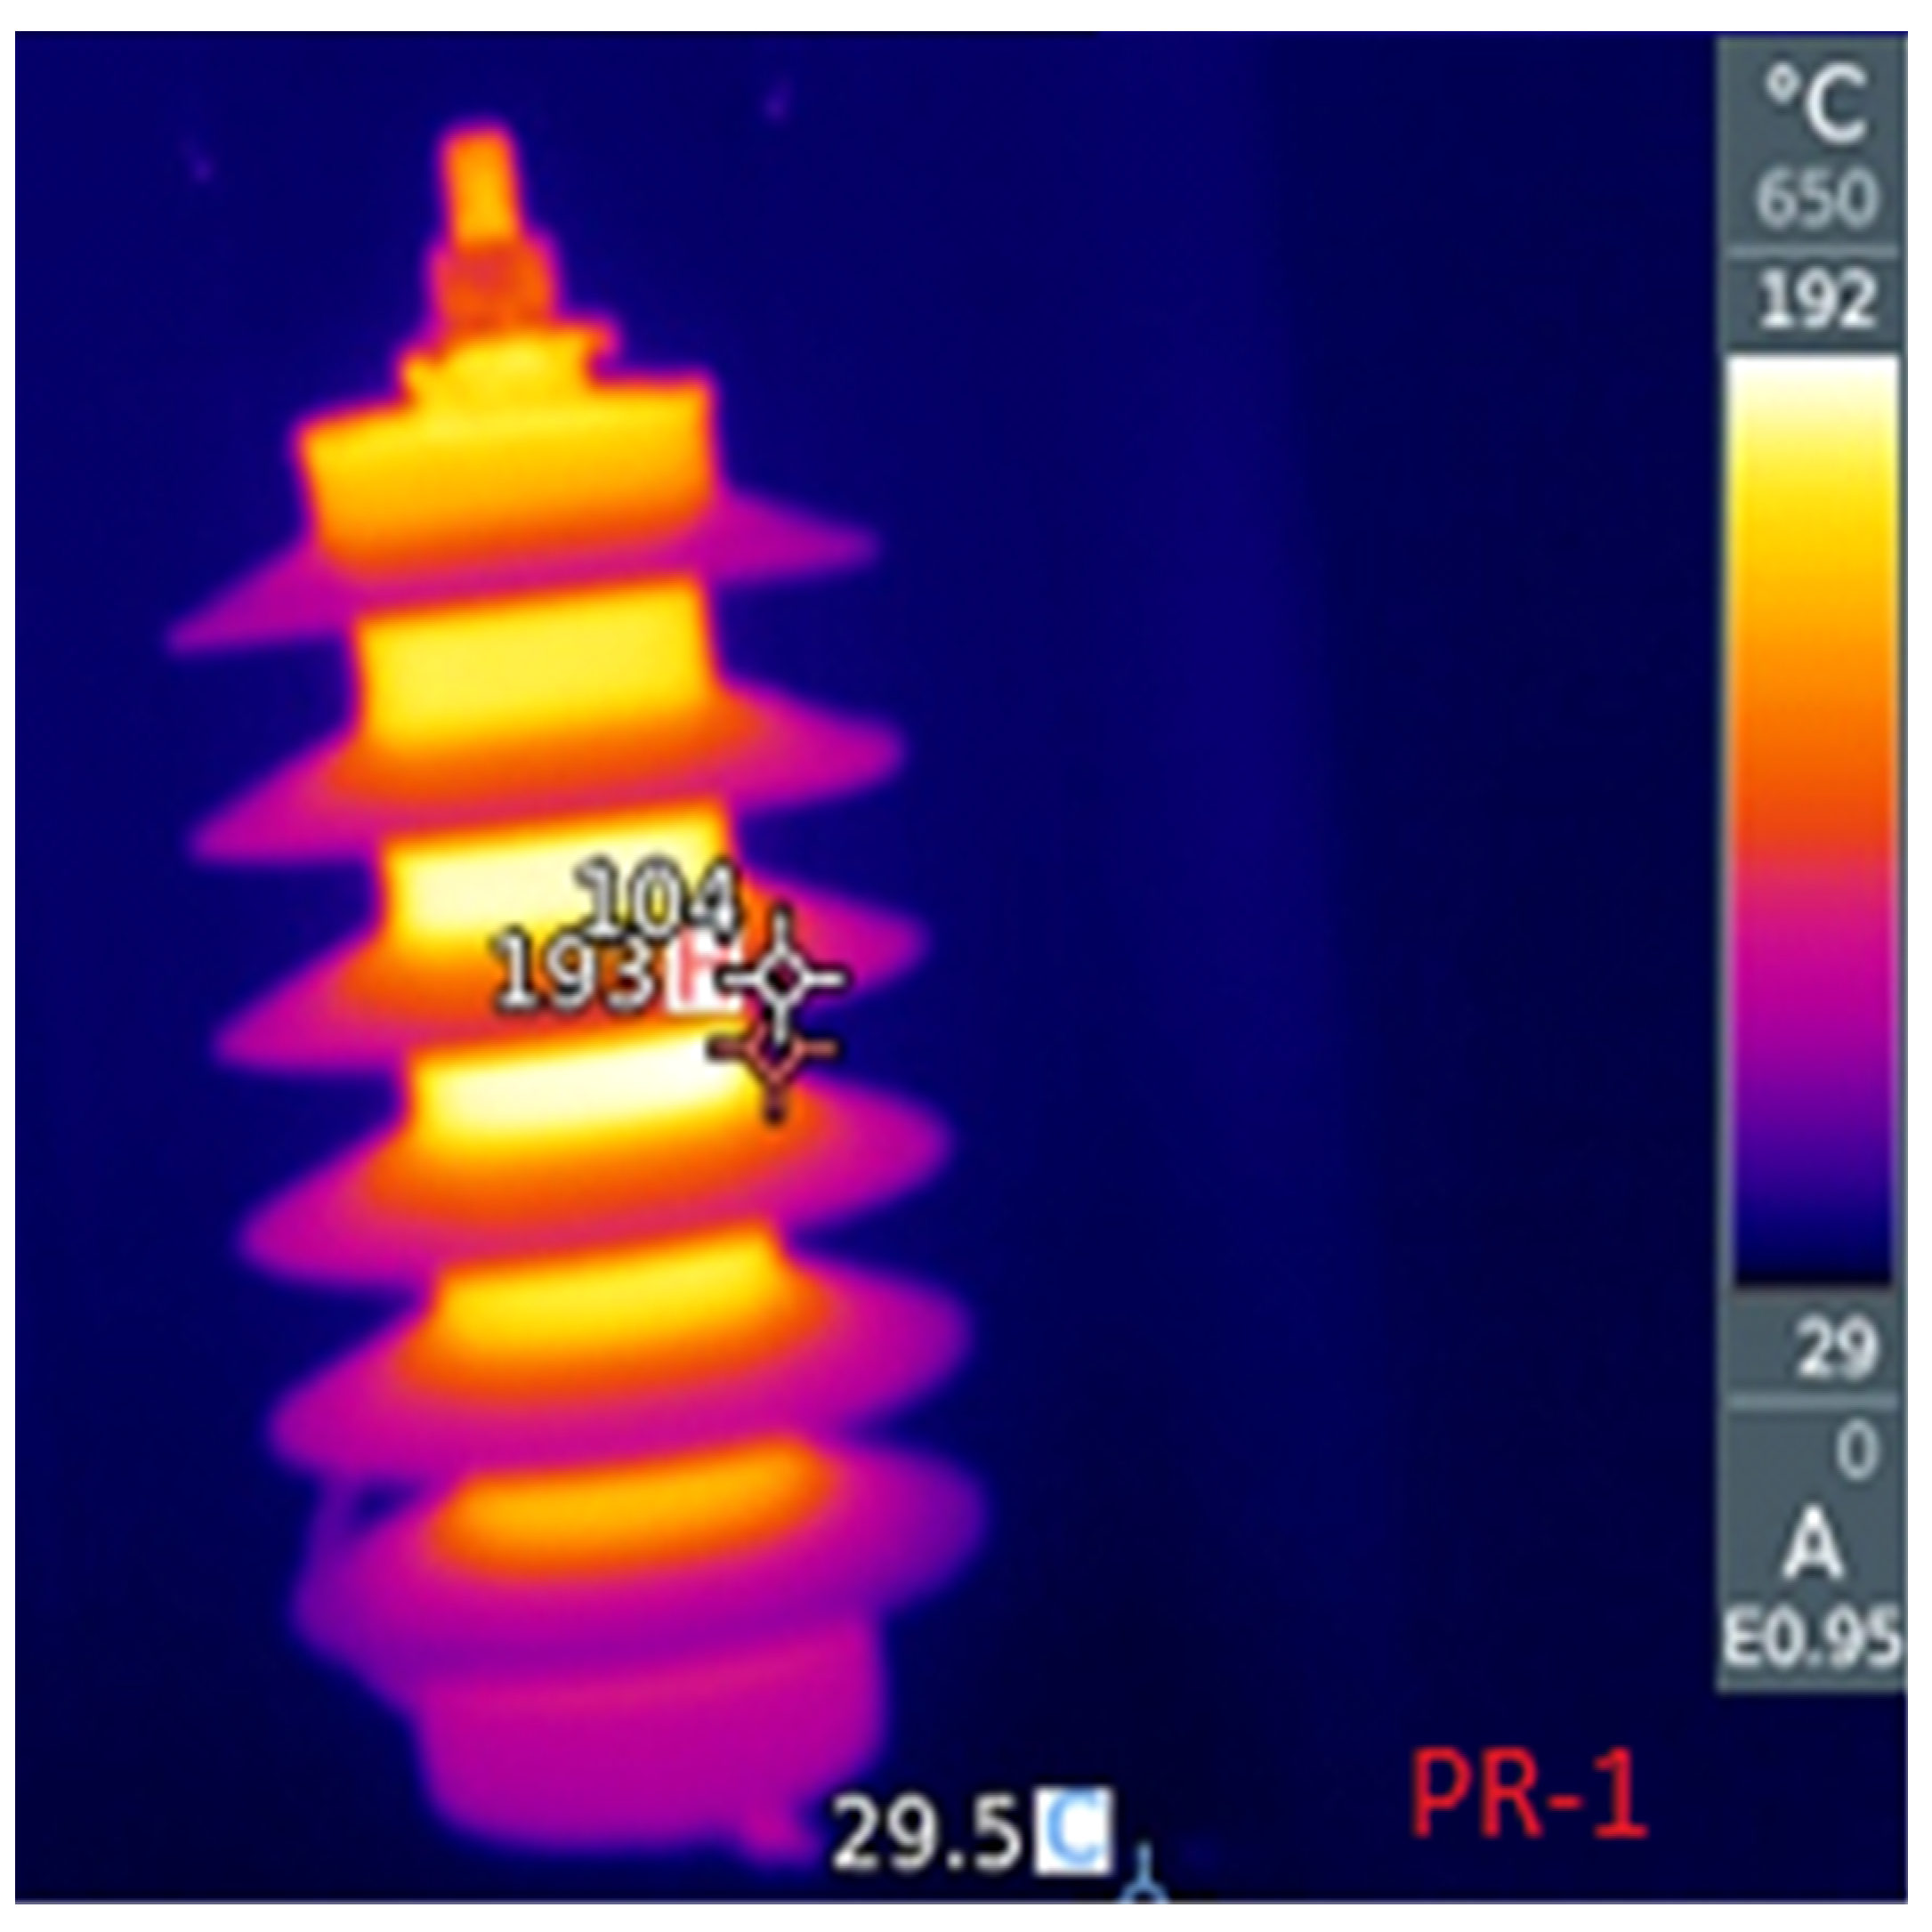
Figure 12 presents an infrared photograph of one of the samples during a cycle. During the cycles, the temperatures reached values superior to 170
C.
After the samples cooled, a series of electrical measurements were performed (for each cycle).
Table 3,
Table 4 and
Table 5 present the values of the measurements for each of the samples after three cycles of thermal degradation. The first line of each table presents the measurements for the unstressed samples, in order to serve as a baseline. In all cases, there were measurements of the insulation resistance (performed with a megohmmeter) and measurements of impedance (magnitude and phase at 100 Hz) performed with an LCR meter.
For the three samples, it can be noted that the impedances gradually changed from capacitive (, characteristic of an insulator material) towards a more resistive behavior (). Also, after each cycle, the insulation resistance decreased in value.
In addition to the measurements with the megohmmeter and the LCR meter, FRA sweeps (obtained using commercial equipment—OMICRON’s BODE100, in the “Series-Thru” configuration and with the 12 dB amplifier accessory) were performed after each cycle (and also at the unstressed baseline condition).
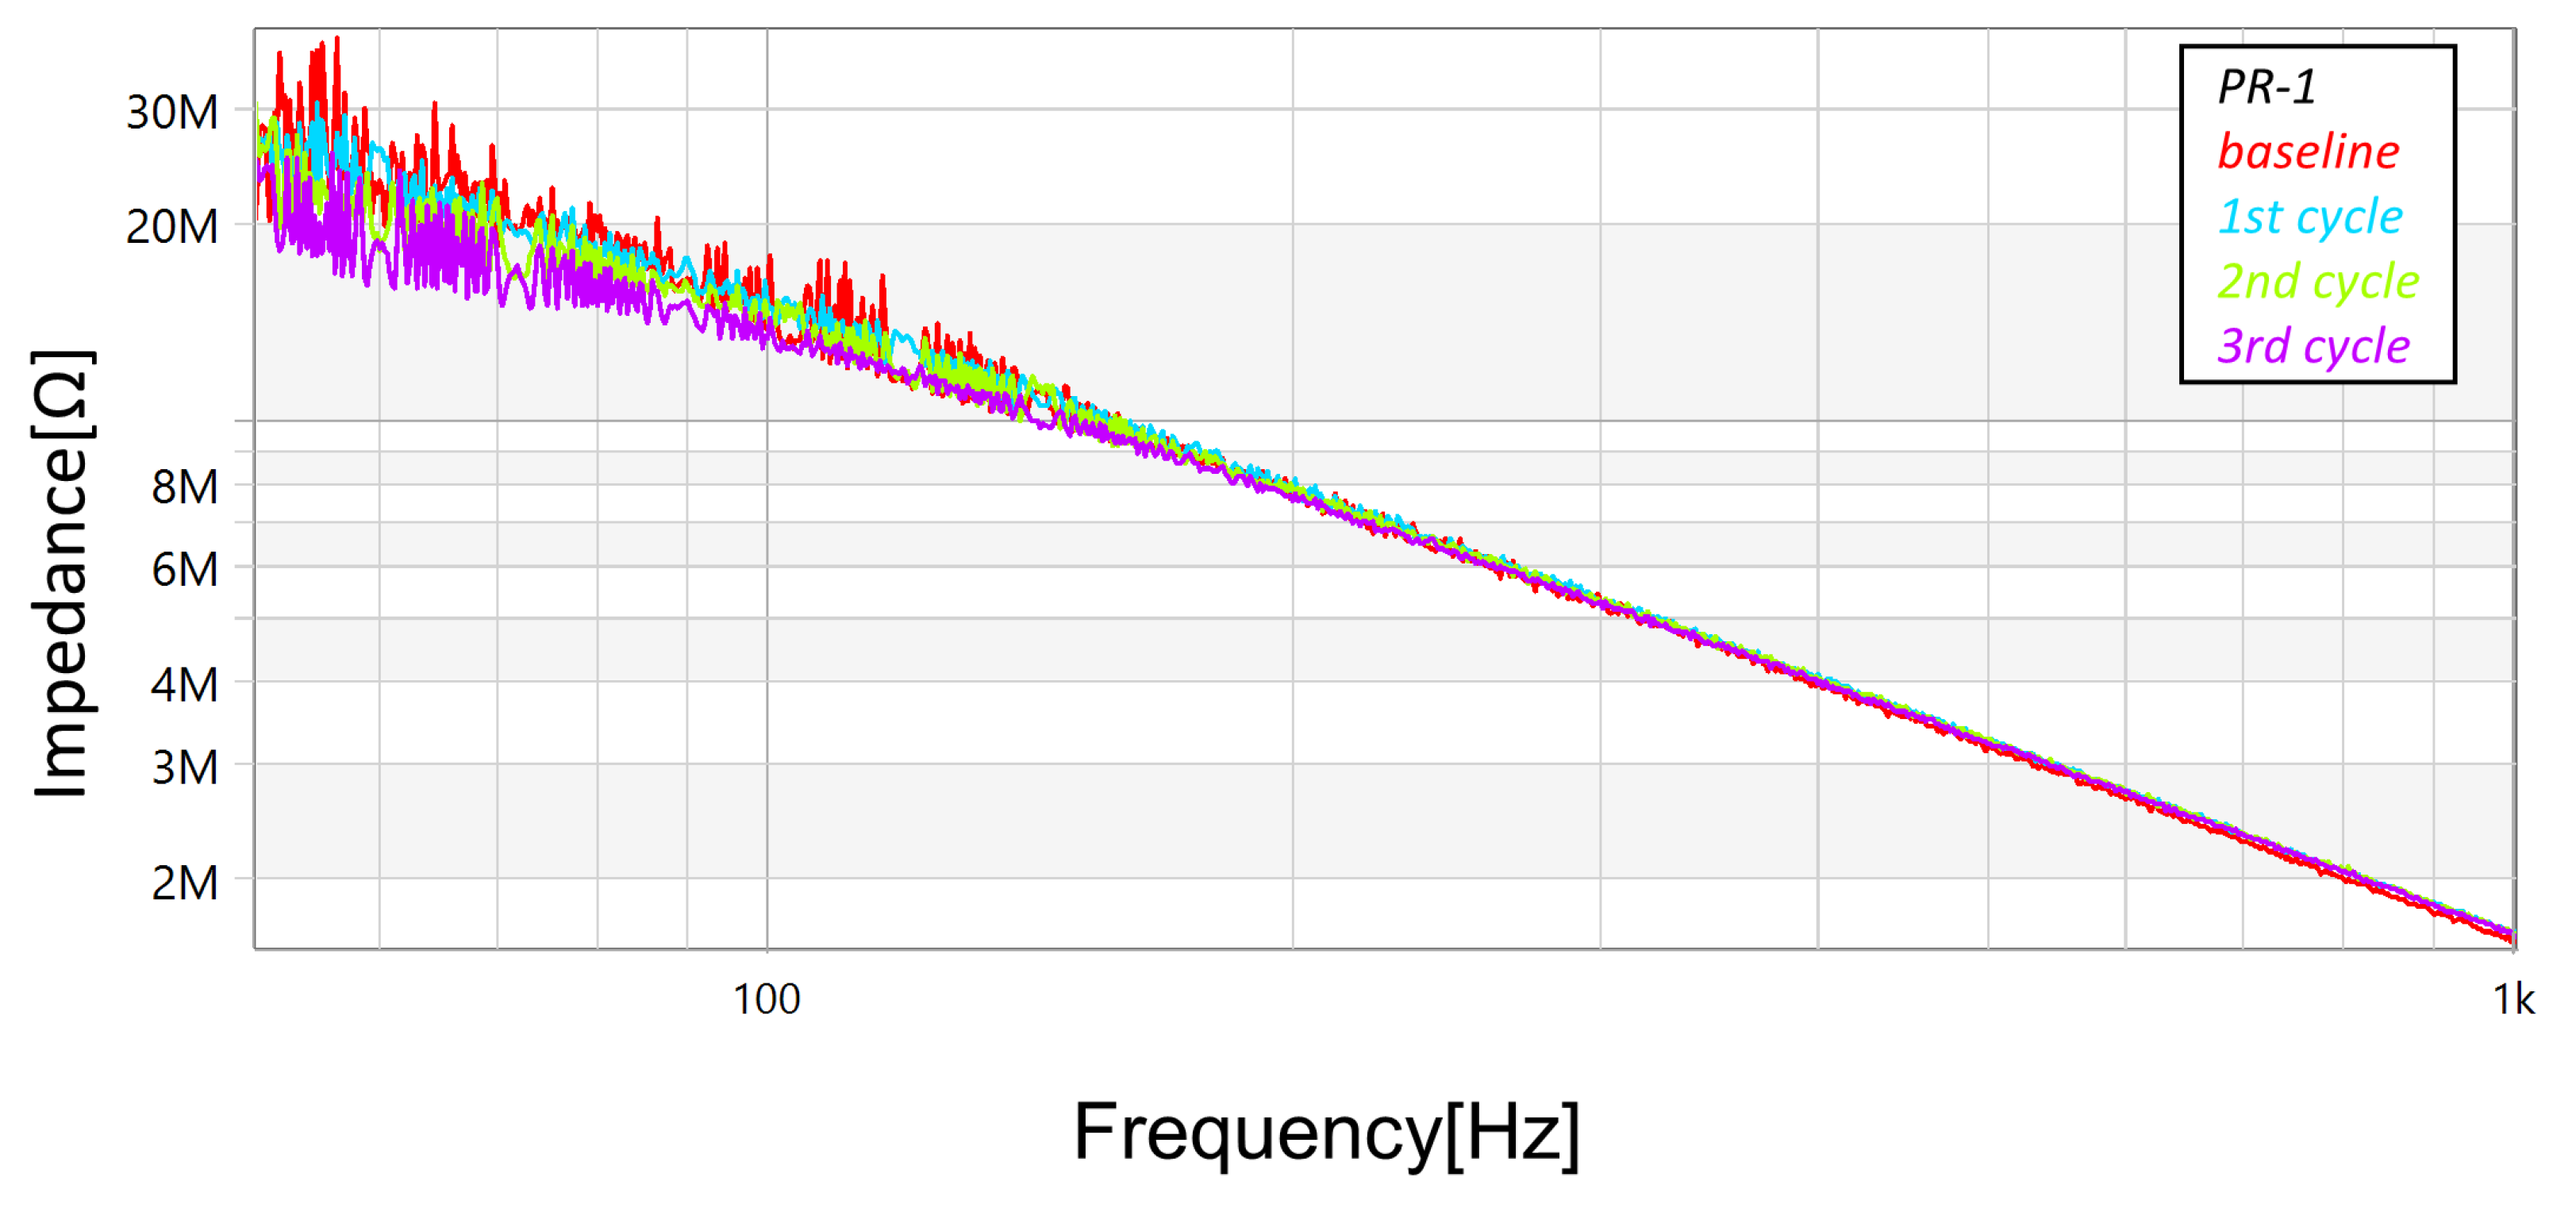
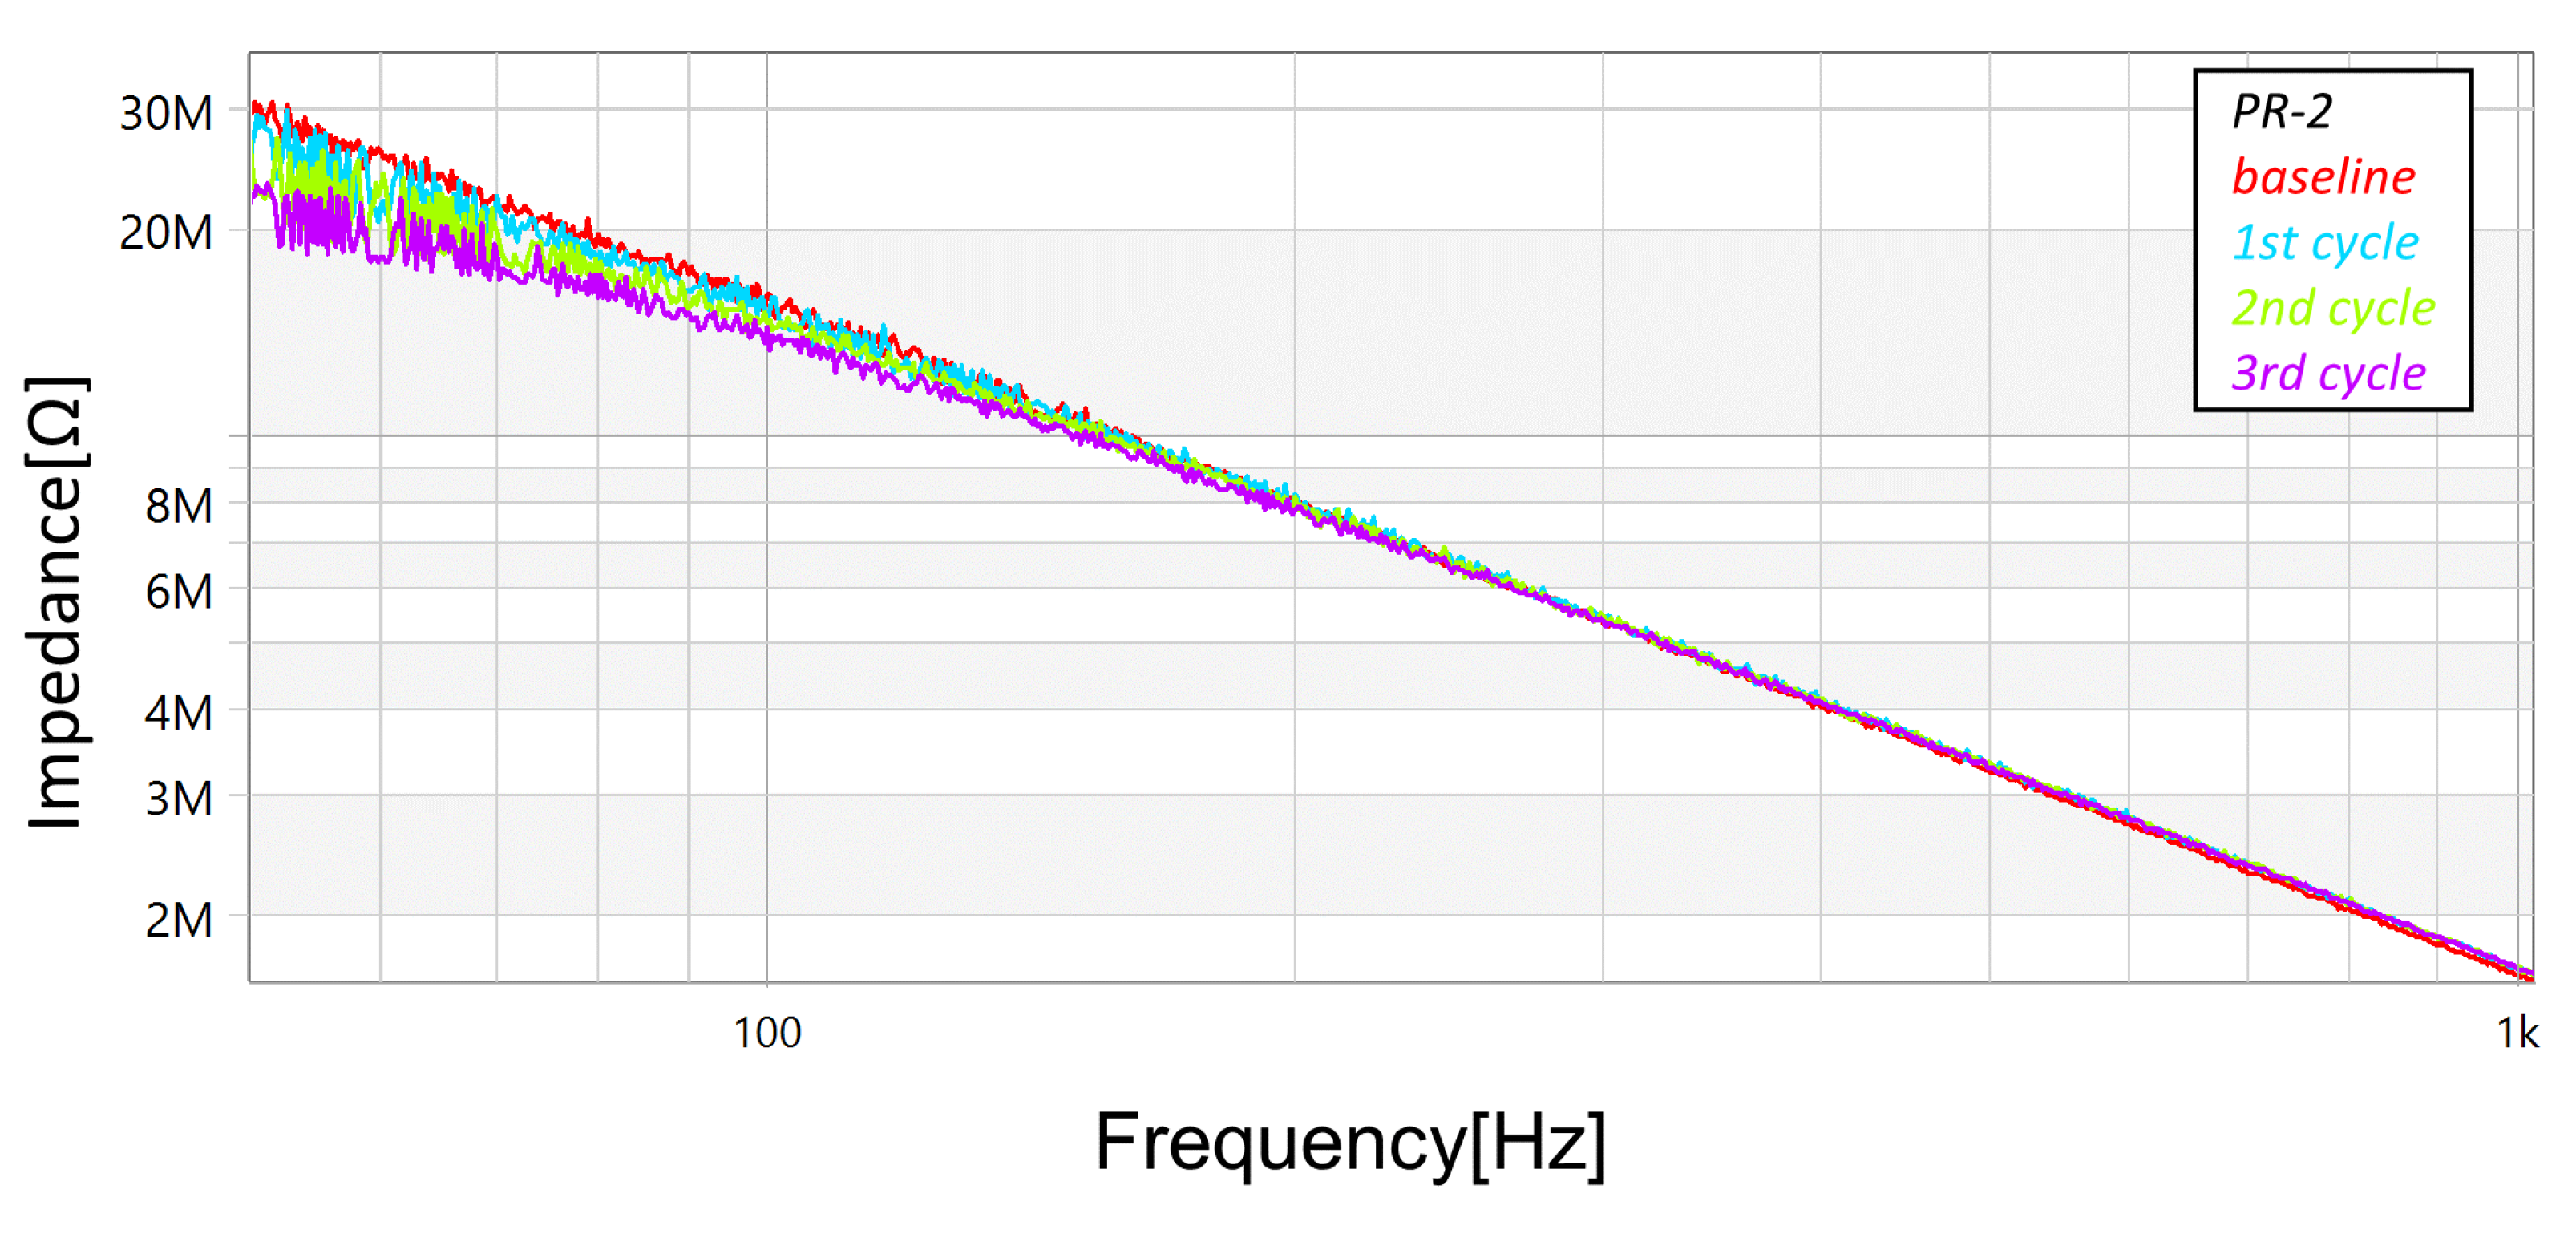
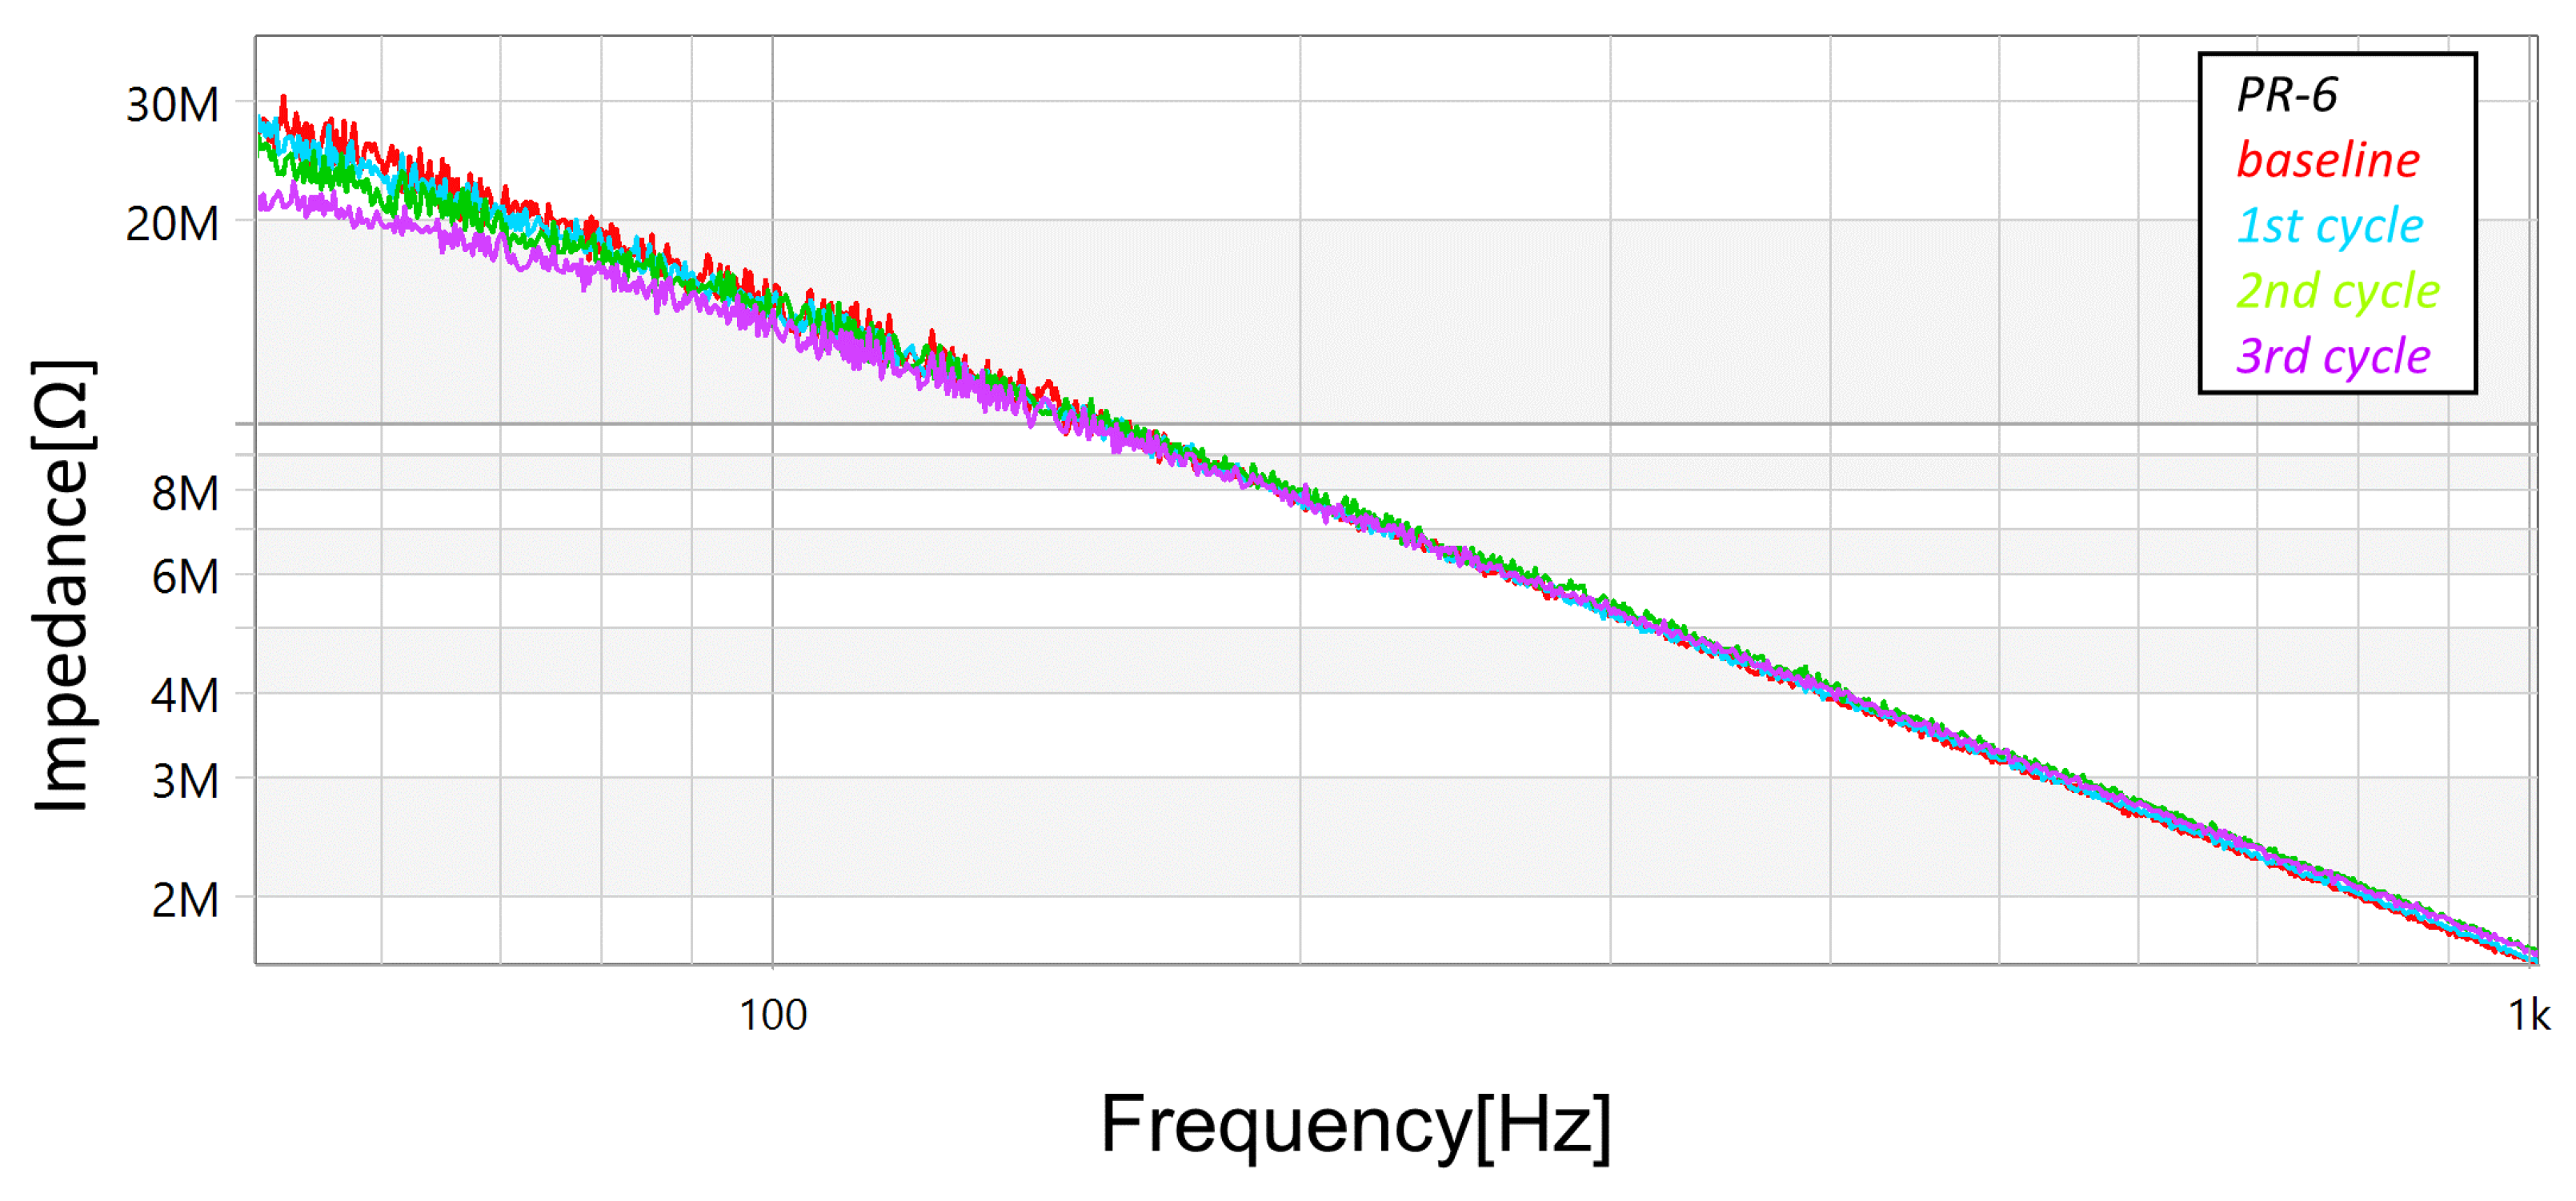
Figure 13,
Figure 14 and
Figure 15 present the magnitude responses of the FRA sweeps for the three samples. Over the whole range of frequencies, there is a visible a trend in the measurements—the gradual reduction in magnitude as the stresses progress—although, the trend is more evident in the frequency range below 100 Hz.
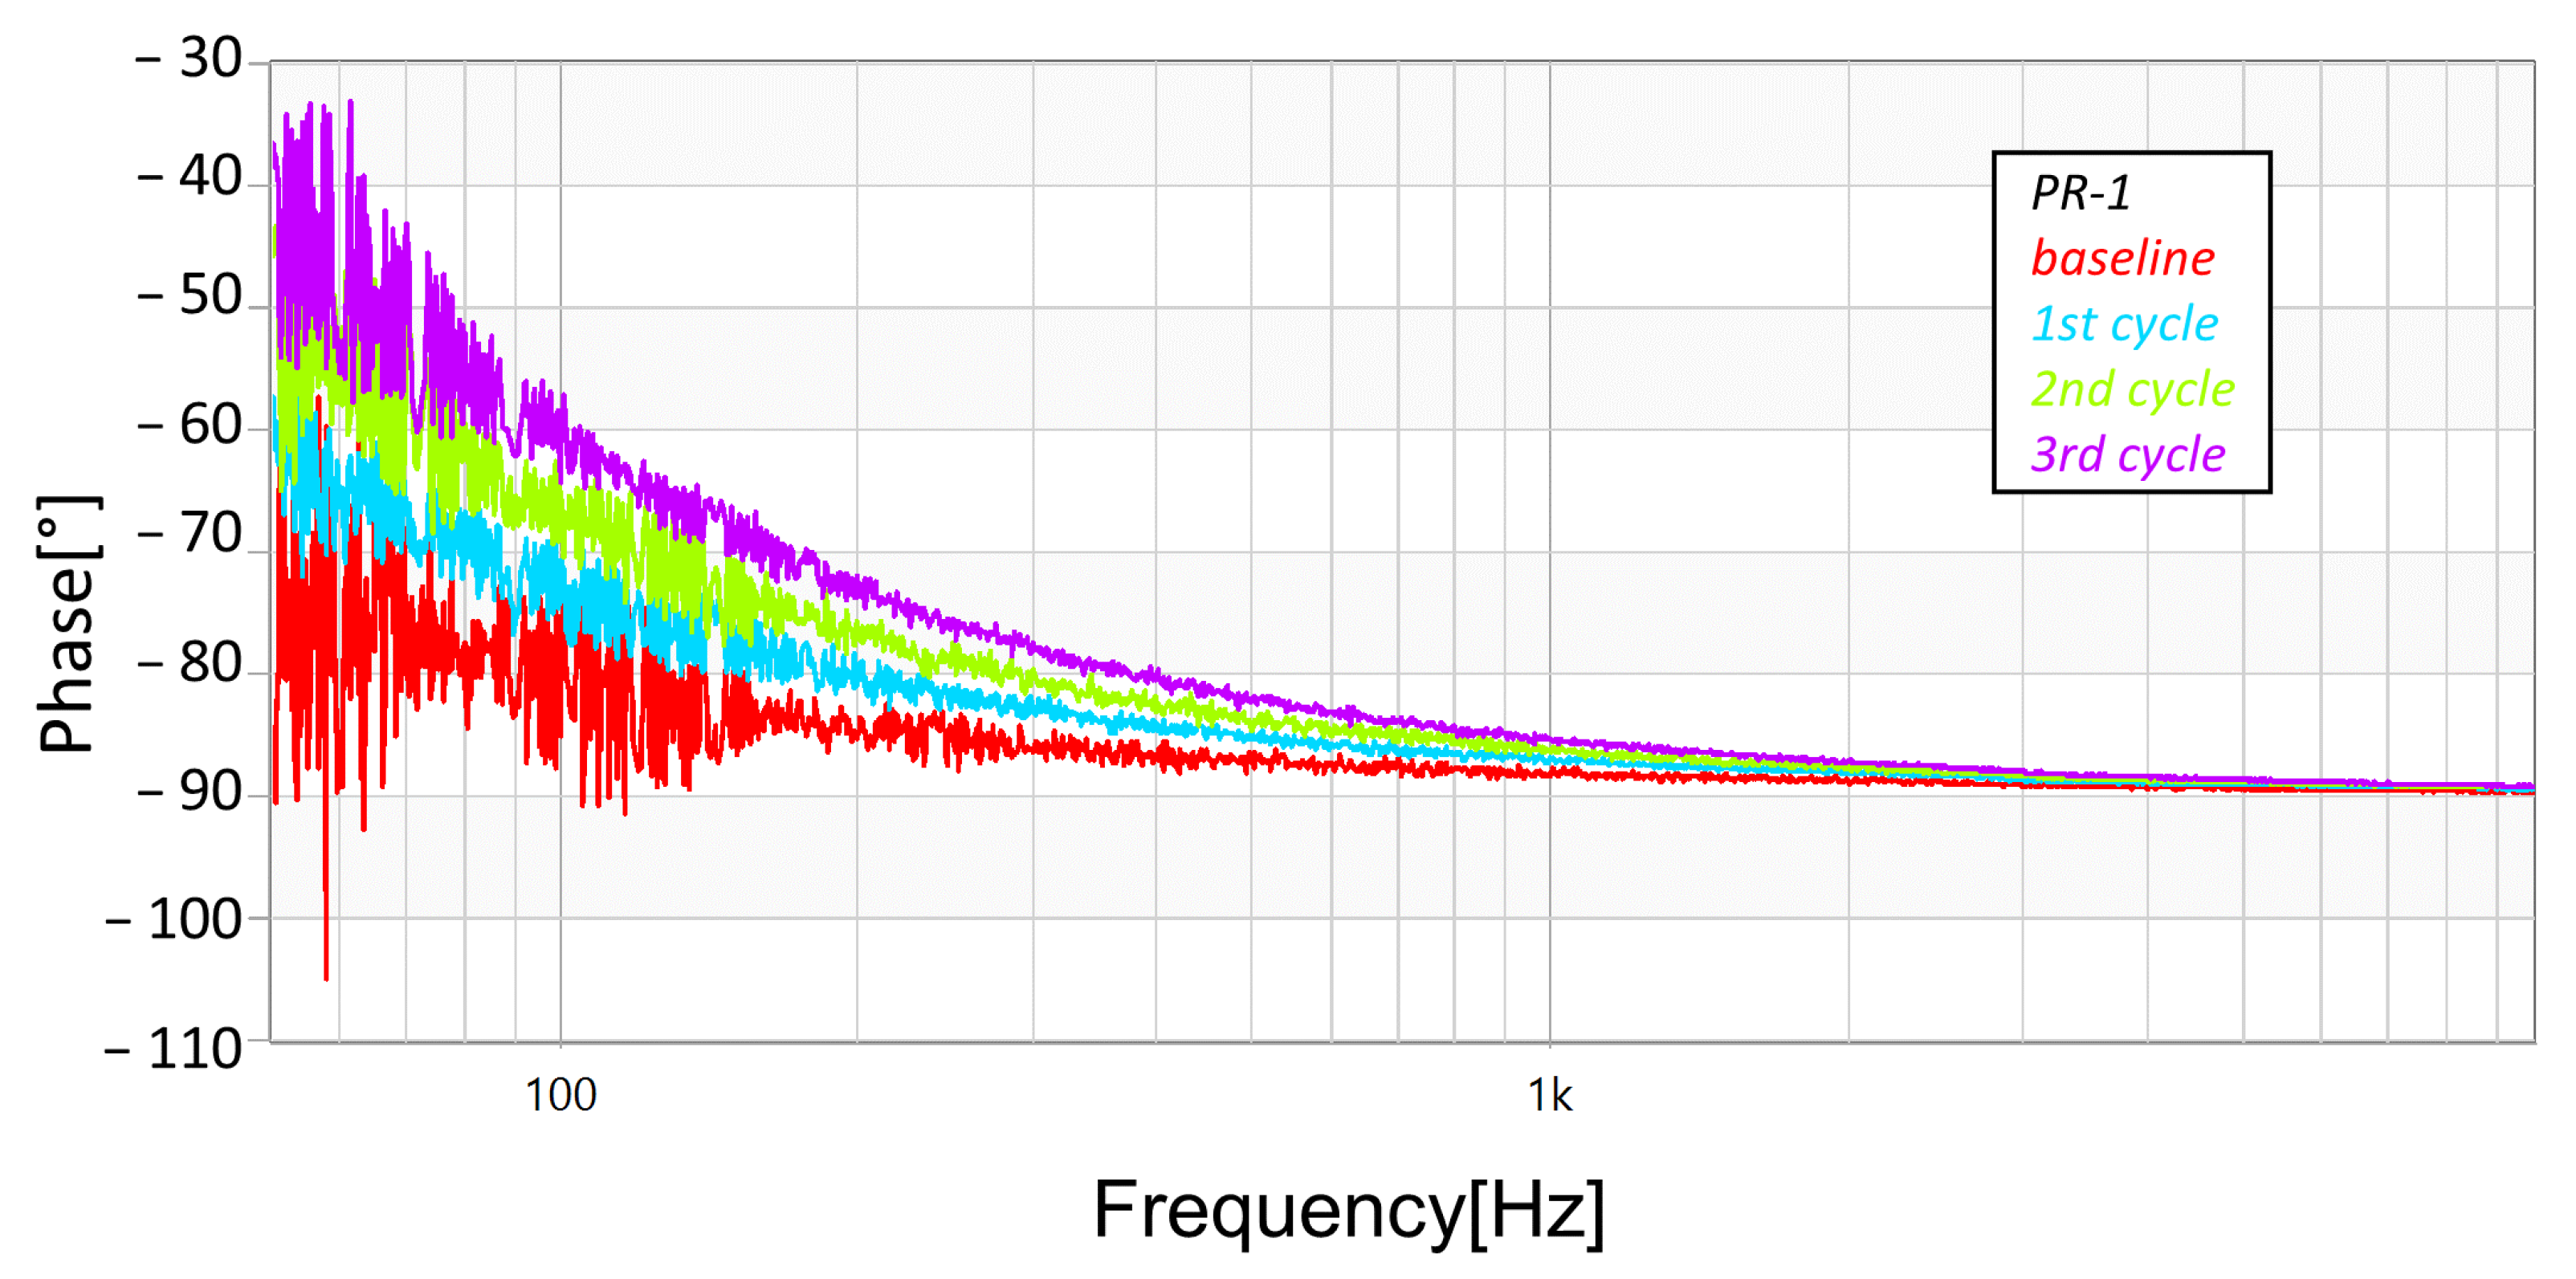
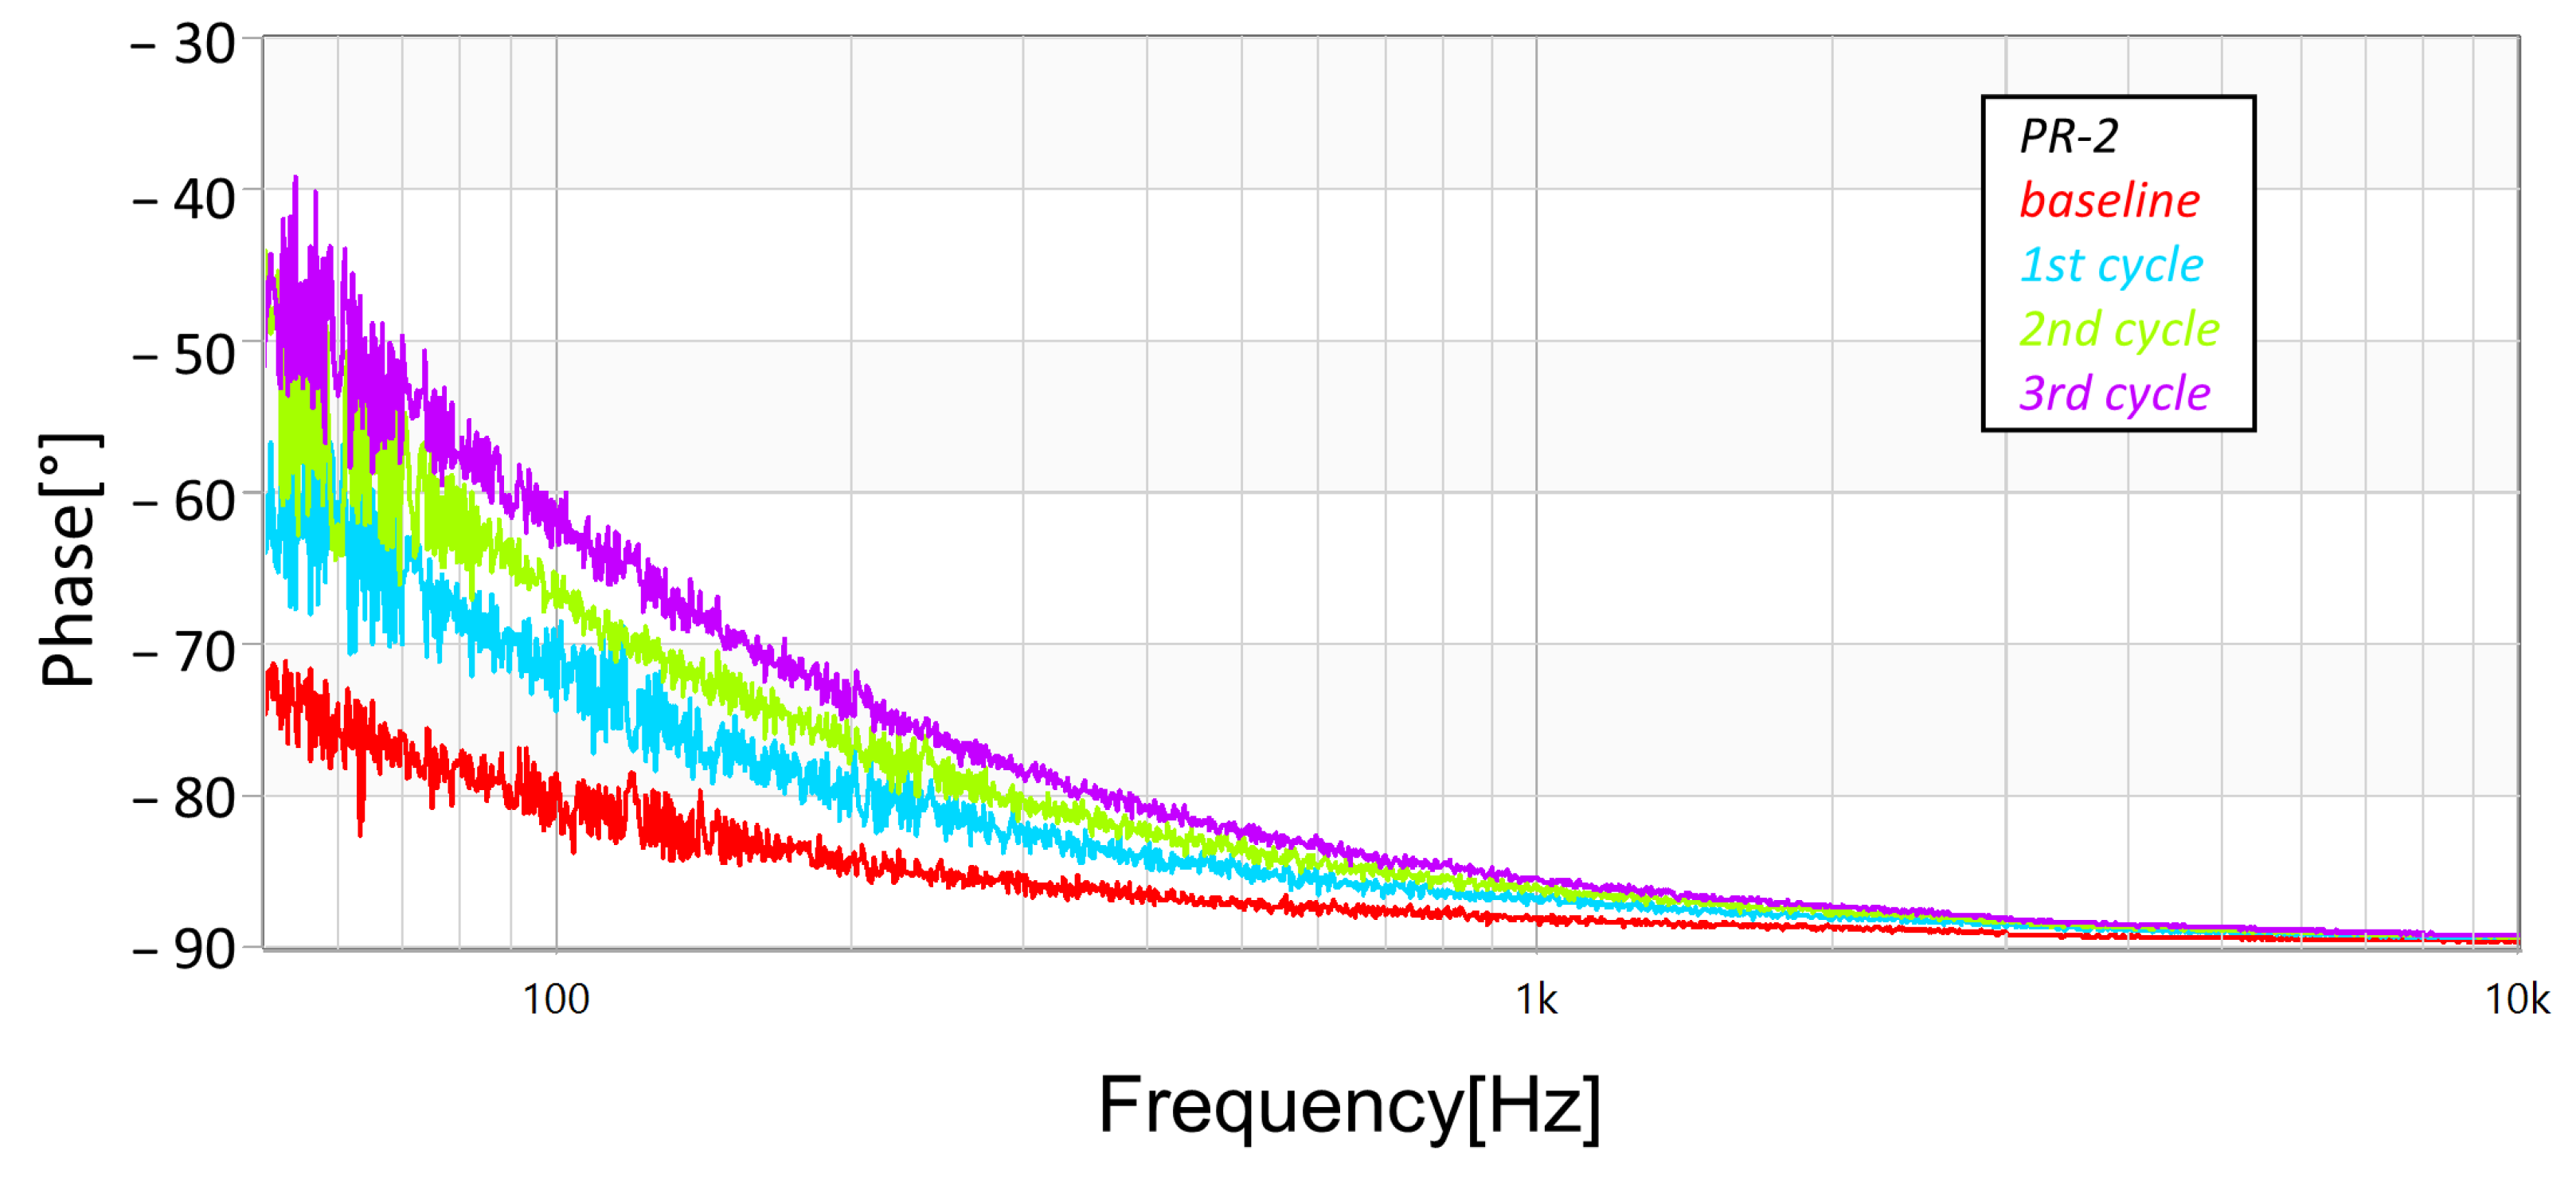
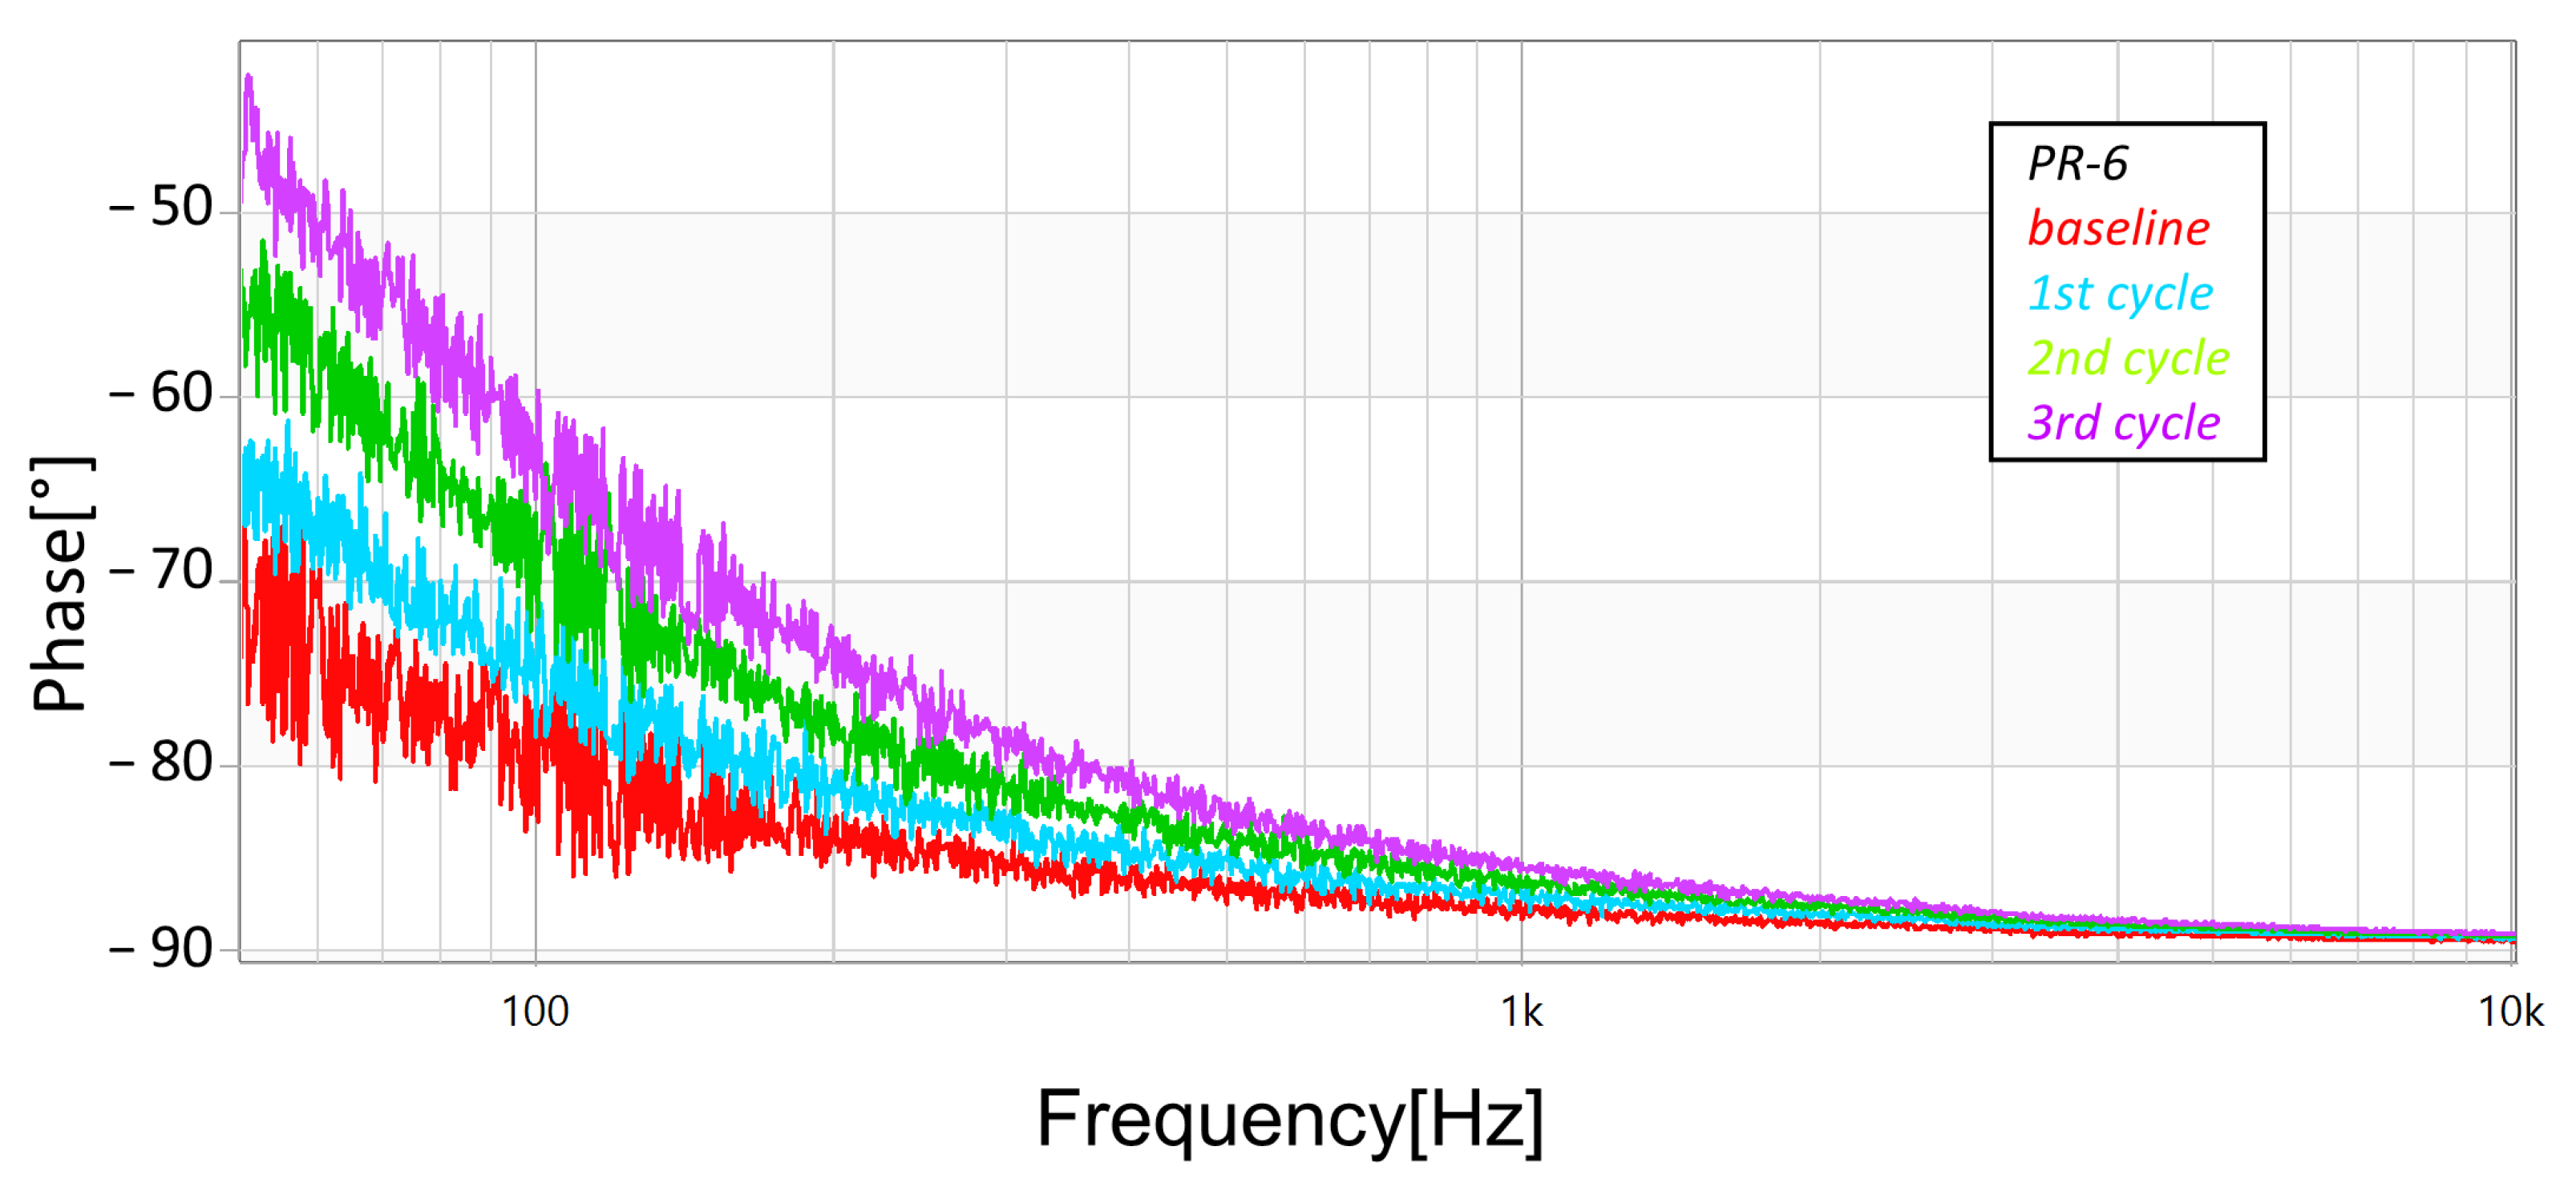
As well,
Figure 16,
Figure 17 and
Figure 18 present the phase responses of the same FRA sweeps of
Figure 13,
Figure 14 and
Figure 15. It is very interesting to note that the phase spectra are much more responsive than the magnitude spectra. This represents a high potential to detect more subtle damage on the arresters.
4. Conclusions
This paper presented the application of Frequency Response Analysis (FRA) in order to detect degradation in metal oxide surge arresters. The FRA technique is a widely used method for detection of damage in power transformers (with some other applications as well). This paper investigated its use in surge arresters—which constitutes an innovative use. The results presented in this paper (still preliminary) have shown that FRA is capable of detecting early damage on the arresters (caused by a controlled circulation of leakage current and the consequent power dissipation over them). Both magnitude and phase spectra were able to distinguish between the levels of degradation, although it was very interesting to notice that the phase spectra were more responsive to the levels of degradation than the magnitude spectra. This finding presents a high potential to detect more subtle degradation on the arresters, although more investigation needs to be performed in other cases.
It is important to note that the degradation tests performed were accelerated tests, where the arrester was stressed beyond some threshold in order to produce a degradation. It is reasonable to question if, under normal operation, a very incipient degradation could be detected. The sensitivity of the FRA to these incipient damages (as well as modeling a relationship between a certain type of failure with a deviation pattern in the FRA spectra) is a matter to be studied in future work. However, as the aging of the arrester results in variations in its electrical parameters [
29] and the FRA method is based on the detection of variations in electrical parameters, one can conclude that FRA is suitable for detection of aging in arresters. Along with the deterioration by leakage current, other types of deterioration tests, such as moisture ingress, contaminants, pollution, UV radiation, etc., have to be performed and tested with the FRA method.
Also, as future work, it is envisaged to adapt the FRA (which is essentially an offline method) in order to detect early damage online (without the necessity to remove the arrester from service). The main issue concerning online operation is the supply voltage, which may damage the electronics of the FRA equipment. The literature on the use of FRA on electric machinery (transformers, motors and generators) has presented some efforts related to this adaptation (using a coupling system, either passive [
45] or active [
33]). In both cases, the coupling system acts as a high pass filter, allowing the high frequency of the FRA to be injected into the device under test and, at the same time, blocking the supply voltage to avoid damage to FRA electronics. While these alternatives may be considered for medium voltage distribution systems, the application in high voltage transmission systems might require other solutions. Additionally, other limitations for online operation still have to be considered, such as the potential disconnection of the FRA equipment during a lightning or switching surge.

 ,
, 


