Article

Design of Fire Risk Estimation Method Based on Facility Data for Thermal Power Plants

Information Media Research Center, Korea Electronics Technology Institute, Seoul 03924, Republic of Korea
*
Author to whom correspondence should be addressed.
Sensors 2023, 23(21), 8967; https://doi.org/10.3390/s23218967
Submission received: 6 October 2023 / Revised: 30 October 2023 / Accepted: 1 November 2023 / Published: 4 November 2023

Abstract

:

Simple Summary

We provide a data classification and analysis method to estimate fire risk using facility data for thermal power plants. Experimental analysis is conducted on the data classified by the proposed method for 500 megawatt (MW) and 100 MW thermal power plants.

Abstract

In this paper, we propose a data classification and analysis method to estimate fire risk using facility data of thermal power plants. To estimate fire risk based on facility data, we divided facilities into three states—Steady, Transient, and Anomaly—categorized by their purposes and operational conditions. This method is designed to satisfy three requirements of fire protection systems for thermal power plants. For example, areas with fire risk must be identified, and fire risks should be classified and integrated into existing systems. We classified thermal power plants into turbine, boiler, and indoor coal shed zones. Each zone was subdivided into small pieces of equipment. The turbine, generator, oil-related equipment, hydrogen (H2), and boiler feed pump (BFP) were selected for the turbine zone, while the pulverizer and ignition oil were chosen for the boiler zone. We selected fire-related tags from Supervisory Control and Data Acquisition (SCADA) data and acquired sample data during a specific period for two thermal power plants based on inspection of fire and explosion scenarios in thermal power plants over many years. We focused on crucial fire cases such as pool fires, 3D fires, and jet fires and organized three fire hazard levels for each zone. Experimental analysis was conducted with these data set by the proposed method for 500 MW and 100 MW thermal power plants. The data classification and analysis methods presented in this paper can provide indirect experience for data analysts who do not have domain knowledge about power plant fires and can also offer good inspiration for data analysts who need to understand power plant facilities.

1. Introduction

Several types of power plants, including nuclear, thermal, and hydroelectric, produce electricity. Any issues arising in these power plants can significantly impact the national economy and regional safety. Due to their crucial role in infrastructure, most nations consider power plants as essential facilities and prioritize their management accordingly. Power generation companies employ advanced systems to detect and resolve potential problems to ensure a continuous and safe electricity supply. Since fire risk is one of the severe problems in power plants, all power plant buildings have fire prevention systems to respond to fires. However, these systems employ a static method that assesses whether firefighting equipment, such as fire extinguishers and smoke–flame detectors, is present in a specific location, assigns each piece of equipment a particular score, and then calculates an overall score. Risk Failure Mode Effect Analysis (RFMEA) is a representative method that performs various types of risk analysis and evaluates identified risks based on severity, consequences, and likelihood of occurrence during the risk resolution process [1,2]. This risk assessment provides limited accuracy due to the rare occurrence of fires and diverse factors affecting fire occurrence. This traditional and static approach must be revised to detect and respond to fire hazards proactively. It is essential to create a fire protection system that can adapt to changes in fire risks over time. To achieve this, we can leverage the existing SCADA system in many power plants to incorporate time-based variables. This approach will enable dynamic detection and response to potential fire hazards. SCADA systems have become essential to the automated control and monitoring of critical infrastructure. They serve various purposes, such as monitoring facility status, acquiring large amounts of real-time data, increasing power efficiency, and automatically detecting facility abnormalities [3]. Due to their advantages, SCADA systems have become increasingly popular in facility abnormality detection research. Most studies using power plant SCADA data concentrate on power efficiency and predictive maintenance [4,5,6,7,8,9]. In order to develop a dynamic fire protection system, it is necessary to detect any abnormalities in the facilities. SCADA systems process complex time-series data, so analyzing multivariate time-series data is crucial to identify anomalies. In recent years, there has been rapid development in the research of multivariate time-series anomaly detection. Several systematic reviews have been conducted using deep-learning-based anomaly detection for multivariate time-series data. Anomalies in multivariate time-series can be defined in various ways, such as contextual anomalies, point anomalies, and interval anomalies, and there are numerous examples of industrial field applications and performance comparisons of various methodologies for detecting these defined anomalies [10,11,12,13]. Most of the turbine facilities that are crucial power plant components have rotating machines. As such, detecting abnormalities in these machines is essential, and we will explore this topic in this paper using SCADA data. A rotating machine’s two most critical components are the shaft and bearings. Bearings, in particular, play a crucial role in machines that rotate at high speeds, as damaged bearings can lead to equipment damage, explosions, or fires. Various deep learning methods are available to detect abnormalities, bearing defects, and the causes of vibration, and there are many examples of vibration measurement technology in the time, frequency, and time–frequency domains [14,15,16,17,18,19]. The boiler feed pump (BFP) and pulverizer are subject to fire risk prediction among the boiler equipment, and related research cases exist [16,20,21]. Although many studies have been conducted, most have focused on detecting facility abnormalities. Only a few have attempted to predict fire risk by identifying abnormal detection in power plant facilities [22]. Many of the studies introduced above are primarily studies of some facilities of thermal power plants or small-scale facilities such as wind power plants. For data analysis for each facility, it is essential to utilize the SCADA system for the entire thermal power plant. Additionally, in-depth data analysis is overlooked in most deep-learning-based research using SCADA data [23]. In order to effectively utilize a SCADA system, it is crucial to precisely analyze data from multivariate time-series and review various facility structures based on their function and location. This paper presents how to use SCADA data to develop a dynamic fire protection system that responds to a facility’s specific fire hazards based on location and function. The core of this paper is to identify fire-related data from SCADA data and utilize them through feature analysis of multivariate time-series data linked to the location and function of the facility. We analyzed and used two data sets from thermal power plants with 500 MW and 100 MW capacities for the experiments.

1.1. Contributions

From a fire prevention perspective, not all data from SCADA systems are necessary; only data related to fire risk are needed. However, mathematical and statistical methods still need to be available. The best way to do this is through collaboration between experts in fire risk and data analysts who have extensive experience with facility operation knowledge. This process takes a lot of time and effort and requires experts from various fields to work together. Also, even if deep learning technology is utilized, domain knowledge of power plant facilities and data analysis is necessary for better results. The data selection and analysis method described in this paper can help data analysts who lack domain knowledge of power plants better understand relevant time-series data. Additionally, it will inspire researchers to use SCADA data in various fields, not just predictive maintenance and anomaly detection, as SCADA data are utilized for fire risk estimation.

1.2. Structure of the Paper

The paper is organized as follows: Section 2 describes the design of the fire risk estimation method for a thermal power plant based on SCADA data. In Section 3, we present the classification of zones and facilities and the selection of tags used to analyze data for fire risk estimation. Section 4 outlines the experiments and discussions based on the classification and selection data. Finally, in Section 5, we provide the conclusions and future works.

2. Fire Risk Estimation Method for Thermal Power Plant

Our approach starts from the assumption that fire protection systems for thermal power plants can be developed using SCADA data, as described in Figure 1 [8,24]. All facilities in a thermal power plant are designed to achieve a specific purpose and operate under these conditions. There is no direct way to determine whether the facility operates under these conditions during operation. Therefore, the facility’s state must be indirectly monitored by installing sensors to ensure it works according to its requirements. Considering this perspective, Figure 2 can model the facility state. Sensor values stabilize within a specific range when a facility is operated under certain conditions, and the state remains the same. As operating conditions change, the corresponding sensor data also changes. Over time, the data eventually stabilize within a particular range of values. Repetition of this routine is the normal state of facility operation. However, if the sensor values change while the operating conditions remain the same or if they follow a pattern not seen in a normal state, this can be assumed to be an abnormal state [6,10]. Therefore, the state of the facility can be defined in three ways as follows:
  • Steady State: This is when the operating condition remains constant, and the data are maintained within a specific range.
  • Transient State: This is when the data change rapidly due to changing operating conditions. This change is expected.
  • Anomaly State: This is when the operating conditions remain predefined, but the data change unexpectedly.
Figure 1. Approach for developing fire protection system.
Sensors 23 08967 g001
Figure 2. State modeling for facility data.
Sensors 23 08967 g002
A comparison between transient and anomaly states is presented in Table 1.

Fire Risk Estimation Method for Facilities

Generally, the causes of fires in thermal power plants can be classified into four categories: mechanical, electrical, chemical, and external reasons, such as carelessness during work. It is difficult to predict or prevent fires caused by carelessness at work through facility data analysis, and predicting fire risk from other factors is also challenging [2]. Although predicting fire risk directly from facility data is difficult, for fires caused by mechanical failure, it is possible to make some assumptions based on facility data.
  • There is no fire risk if the facility is in normal condition.
  • If the condition of the facility is abnormal, the probability of a fire occurring increases.
  • There is no direct relationship between the facility’s abnormal condition and a fire’s occurrence. In other words, facility failure does not directly lead to a fire.
Therefore, estimating the fire risk of a facility requires a two-step approach: first, detecting anomalies in the facility and then exploring their relationship with fire.

3. Classification of Zones, Facilities, and Selection of Tags

3.1. Subdivision of Zone and Equipment

Because power plants have many facilities distributed over a large area, it is necessary to distinguish between areas prone to fire and those not. When designing a fire protection system based on facility data and additional environmental information, the following three considerations must be satisfied:
  • Areas with a fire risk must be identified as much as possible to enable rapid response.
  • Fire risks should be classified according to facility, workplace, and fuel type.
  • Fire risk analysis should be integrated into existing and operational fire protection systems.
To meet these requirements, turbine and boiler areas containing critical equipment that can significantly impact plant facilities in the event of a fire were selected in consultation with plant officials. Turbines and boilers were classified as primary areas for fire risk prediction. An indoor coal shed area found only in coal-fired power plants was added. To subdivide the fire risk assessment for each facility in the turbine and boiler areas, the facility must be divided into smaller pieces of equipment. The types of equipment of the turbine and boiler zone were categorized by cooperating with fire experts based on analysis of power plant fire incidents over the years; it has been shown that much equipment in the turbine and boiler zones has been involved in severe fires. A turbine, a generator, oil, H2, and BFP were selected for the turbine zone, while the pulverizer and ignition oil were chosen for the boiler zone. The boiler system of a thermal power plant is very complex, consisting of various equipment such as burners, superheaters, reheaters, furnaces, air heaters, crushers, ignition oil, etc. Due to the nature of thermal power plants, much equipment used to handle steam and water poses a low and rare fire risk. The pulverizer is the equipment that causes most fires in the boiler zone. Additionally, with ignition oil, although the likelihood of a fire occurring is low, if a fire does occur, it can cause severe damage. So we selected only oil-related equipment and pulverizers and excluded the other equipment in the boiler zone. See Table 2.
We analyzed fire and explosion scenarios of thermal power plants over many years to classify the contents and ignition sources precisely and accurately. Fires in the turbine zone often were found in hydraulic oil and lubricant tanks, bearings, and oil supply pipes. These fires fall into three categories: pool fires, 3D fires, and jet fires. Extinguishing these fires can be challenging. At the same time, various types of fires were found in different equipment, including the pulverizer, lubricant oil, hydraulic oil tank, bearings, coal feeder, silos, feed piping, and air preheater in the boiler zone. Table 3 and Table 4 show ignition sources for fire scenarios in the turbine and boiler zones.
For coal-fired power plants, spontaneous combustion frequently occurs in coal supply devices and silos due to the nature of coal. However, these incidents have not been classified as severe fires. After carefully inspecting the turbine and boiler zones, we organized three fire hazard levels. Table 5 shows primary causes.

3.2. Tag Selection for Equipment

A 500 MW thermal power plant has more than 34,000 tags in the turbine and boiler areas, and a 100 MW has more than 20,000 tags. However, most of these tags are unrelated to fires, so selecting tags that may be related to fires is an essential process for more efficient estimation. No academic, mathematical, or statistical method can accurately identify fire-related data in SCADA data. Accordingly, we collaborated with field experts and collected opinions from facility operation experts to select appropriate tags in three stages. In the first stage, we excluded all tags not present in previous power plant fire cases, such as steam, air, various switches, and status indicators that detect conditions. This narrowed the selection to approximately 3000 and 1500 tags, respectively. In the second stage, tags related to minor fires that occurred in the past, such as water-related tags, tags related to abnormal internal temperatures of generators, and tags related to coal transportation at coal-fired power plants, were removed. Fewer than 1000 and 500 tags, respectively, were selected at this stage. Finally, based on the information summarized in Table 3, Table 4 and Table 5, we selected 183 tags in the turbine zone (Table 6) and 336 in the boiler zone for the 500 MW plant (Table 7) and 202 in the boiler zone for the 100 MW plant.

4. Experiments and Discussion

4.1. Data Set

The selected tags from the SCADA system were used to acquire data for a specific period corresponding to two power plants: one with a capacity of 500 MW and the other with 100 MW. Table 8 shows the data set description. The data contain 5%, 4%, and 3.5% missing values for each unit. Handling missing values in a data set is essential. Once power plant equipment begins operation, conditions typically remain the same until subsequent maintenance periods, which can last several months. As a result, sensor readings either do not change or follow the same pattern. Therefore, since the number of missing values in data sets is small, it is better to fill them with previous values rather than remove them. Using previously received values is also essential for algorithms that operate in real-time. The method of filling in missing values using the mean of the previous values of each sensor is as follows:
x n = k = 1 N x n k N
Here, x represents the data series, n represents the current point, k represents the past point, and N represents the number of past points.

4.2. Main Features of the Facilities

The tags selected for fires in the turbine and boiler zone are mostly related to rotating machinery and oil. In the turbine zone, there are many tags for representative rotating machines such as HP, IP, LP, and generators [16]. The boiler zone contains the ignition oil and pulverizer. These facilities consist of rotating machines and have one thing in common: they use a lot of oil. Rotating machines comprise shafts, rotating bodies, bearings, and gearboxes, and various lubricants are used to ensure smooth rotation. Therefore, the essential characteristics of a rotating machine are the vibration and temperature of the shaft and bearings, the rotor’s position, and the lubricating oil’s temperature and pressure. Oil-related tags mainly include pressure, leakage, flow, and temperature.
  • Oil-Related Features
Lubricants and hydraulic oils are commonly used in turbines and boilers. However, due to their flammability, conducting a fire risk assessment to monitor these oils is essential. To this end, the SCADA system monitors the lubricant’s and hydraulic oil’s temperature and pressure at various points. These points include inside the oil tank, before passing through the cooler, and after being filtered for bearing lubrication. All the equipment tags of the turbine and boiler have oil-related features.
  • Bearing-Related Features
Bearings are essential for ensuring smooth machine rotation and come in various types. They must adequately operate rotating machinery by stably supporting the shaft and reducing friction during equipment rotation [14,15]. However, monitoring their state can be challenging because they are inside the structured form. Their vibration and temperature are indicators to determine the bearings’ state. Bearing vibration is measured using a contact accelerometer [17,25,26]. Tags for equipment such as HP, IP, LP, Generator, BFP, and Pulverizer include bearing temperature and vibration features.
  • Shaft-Related Features
Observing the vibration of a rotating shaft is crucial for accurately estimating the state of a rotating object. Perfect coupling is impossible because the shaft is fixed to the center of the rotating body through bearings. As a result, the rotating body vibrates in the x- and y-directions while displacing in the z-direction. A non-contact displacement sensor measures the vibration and position of the shaft, which are the most essential features of the shaft. Monitoring the shaft’s vibration and position during rotation is necessary, as even a stably rotating body has small vibrations [19]. Therefore, tolerance limits are established to differentiate between normal and abnormal vibrations. The operation is automatically stopped if the vibration exceeds the tolerance limit due to abnormal conditions. The HP, IP, LP, Generator, and BFP tags contain shaft vibration and position features.
  • Shell-Related Features
A turbine is a structure that consists of a rotating body fixed to a shaft and enclosed by a shell. When high-temperature steam is injected into the turbine, the shaft and shell expand in opposite directions based on the supporting points. However, if the degree of expansion of the shell and shaft is significantly different, it may cause the rotating body’s wings to collide with the shell, resulting in damage. Therefore, monitoring the shell expansion and the difference between the shell and shaft expansion is crucial. The HP, IP, LP, and Generator tags include shell expansion features.
  • H2-Related Features
A high-speed rotating turbine generates heat inside the generator, which requires a cooling system. Cooling systems for generators commonly use air, hydrogen, or water. Hydrogen is the preferred option for cooling in most power plants due to its numerous benefits.
  • Due to its low density compared to air, H2 can flow easily in narrow gaps and experience minimal hydrodynamic loss.
  • Mitigating facility deterioration through oxygen reduction helps prolong facilities’ lifespans.
  • Its higher specific heat and heat transfer coefficient lead to a more significant cooling effect, resulting in higher output under the same conditions.
Although there are benefits to those above, there are also drawbacks.
  • The concentration of hydrogen for cooling must be maintained above 97% due to its explosion range of 4~75% purity level.
  • Installing additional facilities for leakage prevention and high-purity maintenance can prevent explosions but is costly.
Monitoring the H2 cooling system is essential for fire risk estimation due to its potential disadvantages. H2 tags include information on tank leakage, the collector, the cooler, purity, air temperature, pressure, and fan pressure difference.

4.3. Turbine Data

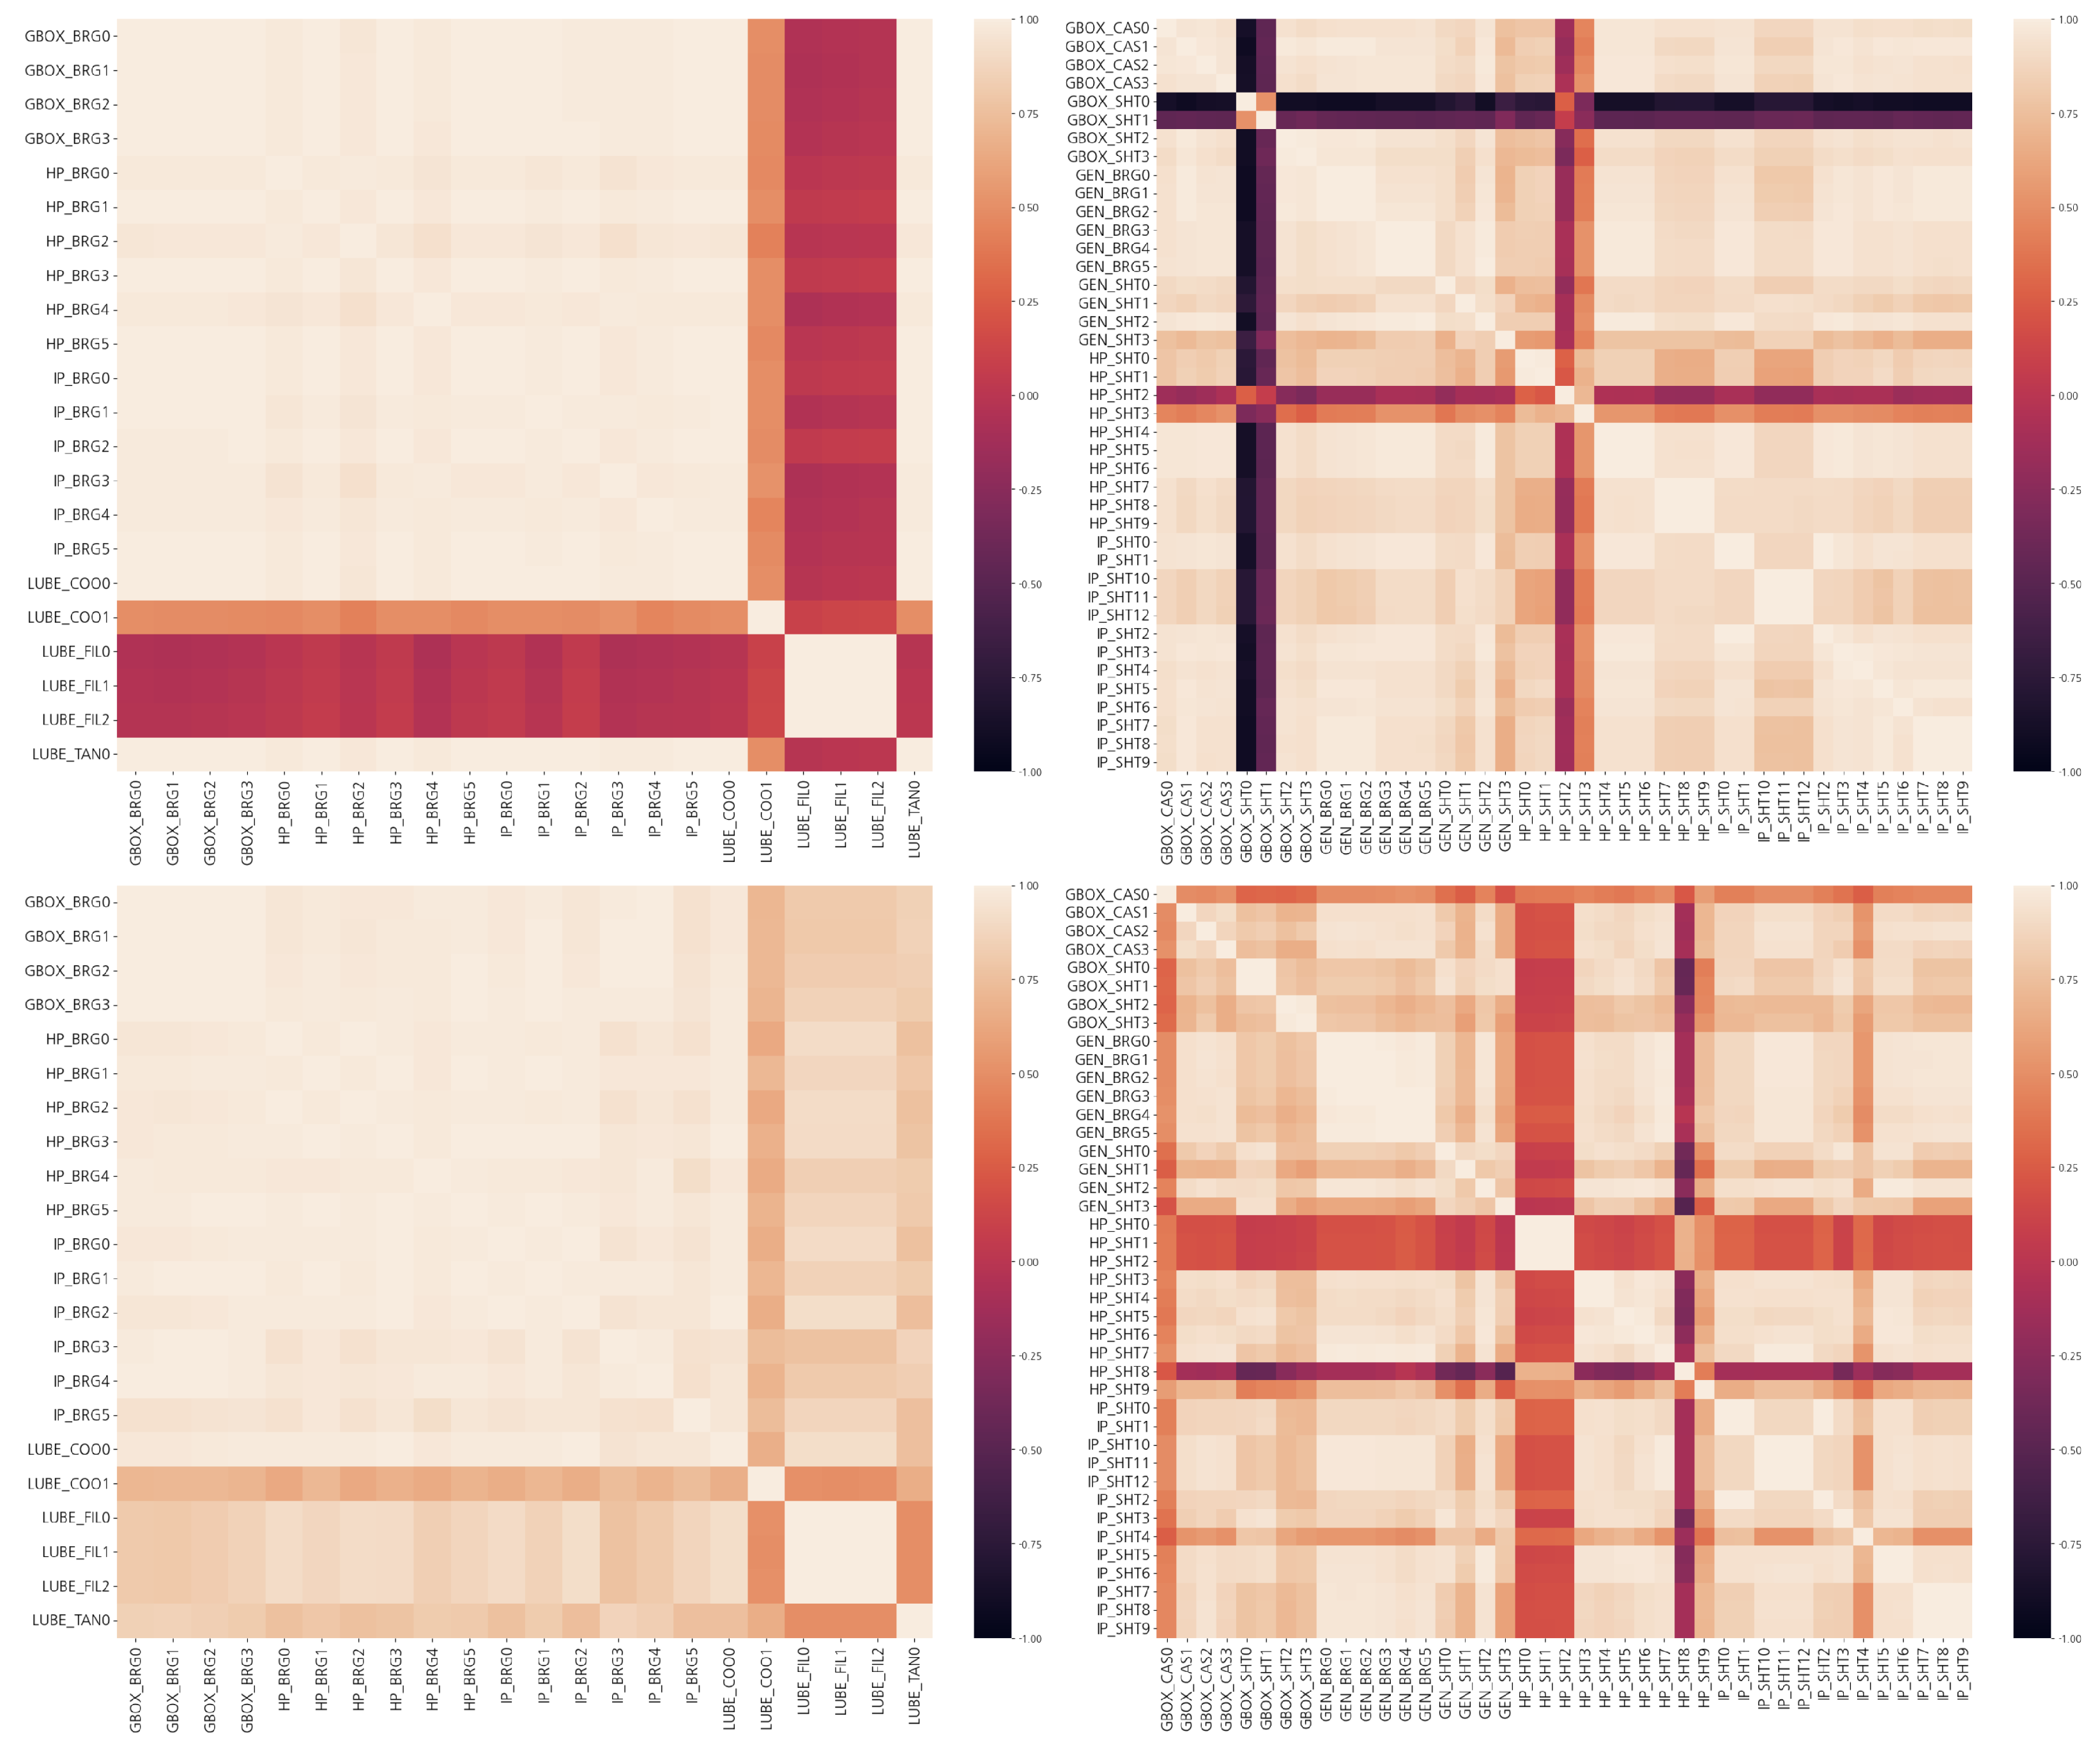
4.3.1. Distribution and Correlation Analysis

Figure 3 shows turbine temperature and vibration distribution data. The temperature data indicate that while the variation is slight in Unit 1, the overall variation is substantial in Unit 2. All states, except for variance, exhibit similar trends. The vibration data show identical patterns to the temperature data. The total variation in Unit 2 is more significant than that in Unit 1, which can be attributed to the unstable equipment condition of Unit 2, possibly due to its broader operating range or older age. However, IP_SHT3 and GEN_SHT2 in Unit 1 show a much wider vibration range than others. Furthermore, it is apparent that the vibration signals from HP_SHT0-6 are in different states from those of Unit 1 and Unit 2. This requires closer examination.
Figure 4 shows the correlation between each sensor in the temperature and vibration data. The Pearson correlation coefficients calculated for each pair of columns are shown in Figure 4.
r x y = i = 1 n ( x i x ¯ ) ( y i y ¯ ) i = 1 n ( x i x ¯ ) 2 i = 1 n ( y i y ¯ ) 2 x ¯ = 1 n i = 1 n x i y ¯ = 1 n i = 1 n y i
where n is the sample size, x i , y i are the individual sample points, and i is the index. The temperature patterns of Units 1 and 2 are similar, but the vibrations show significantly different patterns between the two units. In Unit 1, there is a strong correlation between the temperatures of the bearings. However, there is no direct relationship between the temperature of the lubricant and the temperature of the bearings. The temperature of the lubricant filter signal (LUBE_FIL), which is the temperature after passing through the cooler, is constant regardless of the turbine’s operating conditions. It is clear that the temperature of the lubricant positioned before the cooler shows significant correlation with the bearing temperature based on the operating conditions. In such cases, it would be beneficial to monitor the temperatures of the lubricating oil and bearings separately based on their locations. The relationship between the lubricant and bearing temperature in Unit 2 is more complex than in Unit 1. Specifically, the relationship is similar before and after the lubricant passes through the cooler. This suggests that the two facilities are operating in different operational conditions. The vibration data show a slightly different pattern compared to the temperature data. Specifically, only about four vibration sensors in Unit 1 operate independently, whereas in Unit 2, many sensors operate independently. This indicates that Units 1 and 2 might be functioning under different conditions.

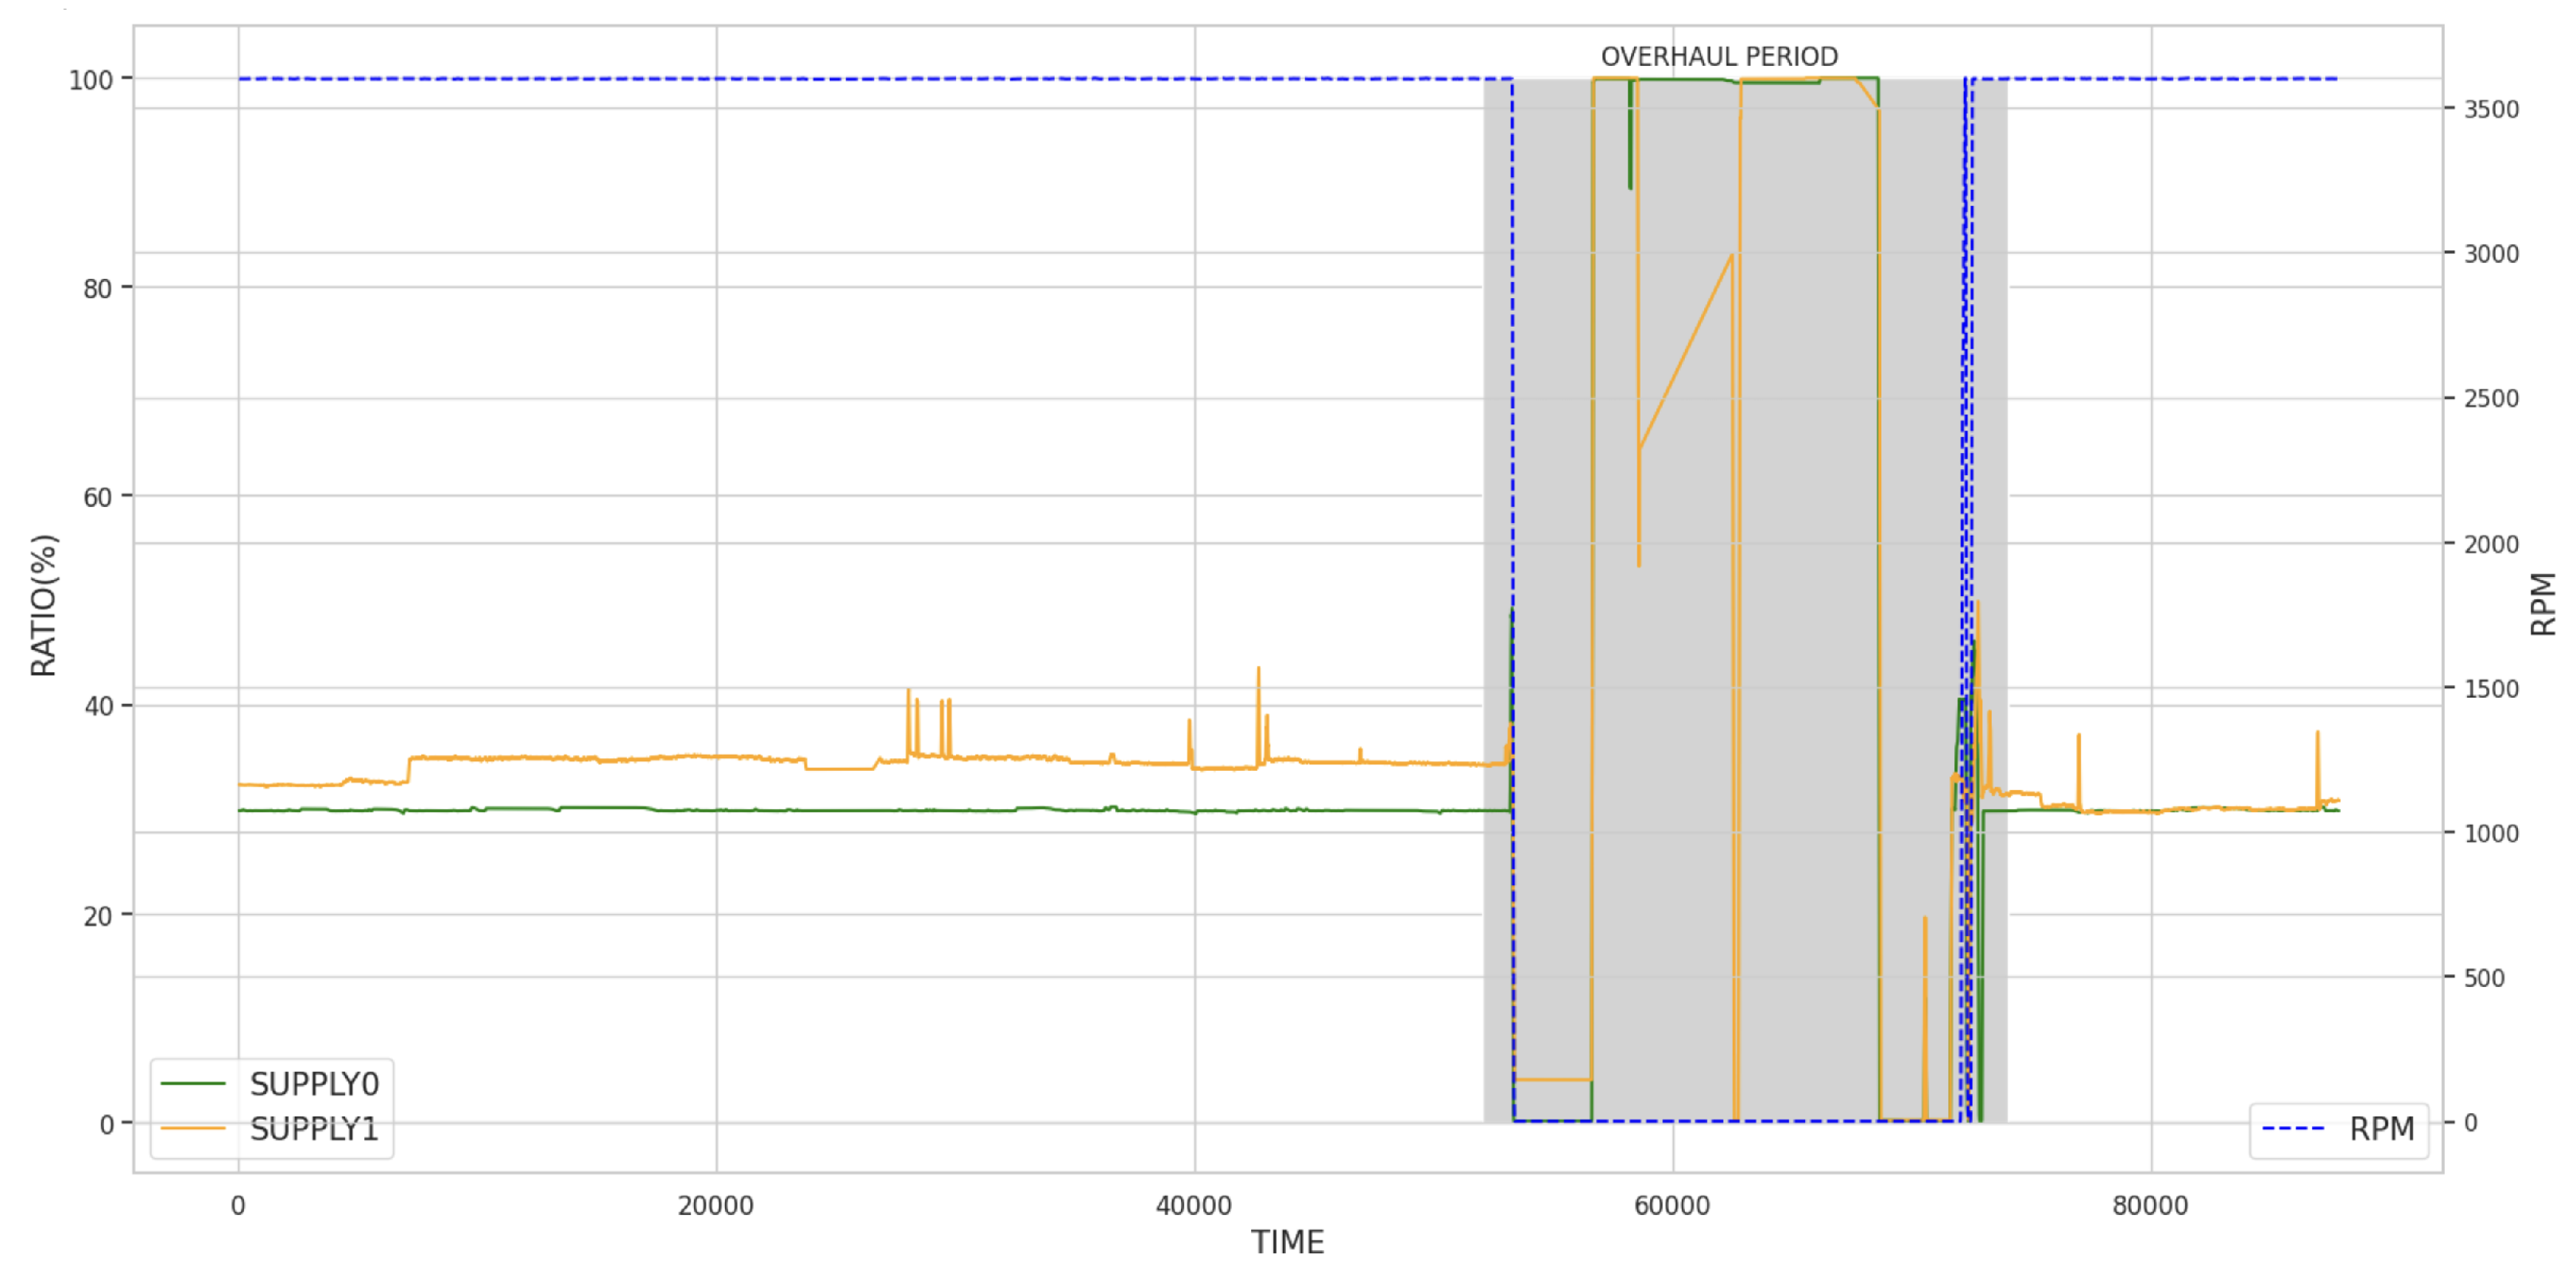
4.3.2. Characteristic Analysis

Figure 5 shows vibration data for shafts POS-1 and POS-2. The positions of POS-1 and POS-2 overlap, but POS-1 spreads in the X–Y-direction when the vibration is slight and gathers in one place when the vibration is significant. The vibration of POS-1 is distributed widely from 20 to 60 mm in the X- and Y-axes. On the other hand, the vibration of POS-2 is stably distributed below 40 mm. Observing and analyzing the details of the vibrations on a 3D rather than a 2D plot is easier.
Figure 6 depicts the different bearing vibration patterns compared to shaft vibration. Although there are similar vibration ranges on the X- and Y-axes for POS-1 and POS-2, POS-2 has a more extensive vibration distribution than POS-1 during normal turbine operation. Furthermore, more data than shaft vibration are observed, even when turbine operating conditions change during the transition phase. The bearing vibration condition varies relatively slowly compared to changes in operating conditions. The 3D plot also shows that the X-axis data are widely scattered, while the Y-axis data are concentrated in one place.
The remaining facilities, such as IP, LP, Generators, Lubricant Oil, H2, Hydraulic Oil, and BFP, were explored using the same procedure as HP.

Unusual Patterns

The SCADA system is designed to automatically shutdown the turbine components when they exceed the preset alarm and trip values, which include vibration, temperature, position, and other factors [3,6]. However, as thermal power plants operate under stable conditions, it can be challenging for the SCADA system to detect abnormal patterns if sensor values do not exceed the preset thresholds [7]. Therefore, it is essential to carefully examine the data for any unusual patterns, even if the alarm and trip values are not reached. This helps to identify risk trends. Figure 7 shows the time-series data for HP turbine shaft vibration over a specific duration. We noticed a periodic increase in shaft vibration, which is an unusual pattern. This periodically increasing signal must be monitored, but no action is needed as it remains below the alarm threshold. It is believed that an action was taken during the overhaul period, as the signal disappeared afterward. As the area is enlarged to check the periodically occurring signal, it lasts about 2 h and then disappears. It is unclear why these signals occur periodically, but it is clear that they are unexpected.

4.4. Boiler Data

4.4.1. Distribution and Correlation Analysis

Figure 8 shows the BFP distribution data [20]. Units 1B and 2A have a more extensive range than Units 1A and 2B. It can be estimated that Units 1A and 2B do not undergo as many state transitions as Units 1B and 2A, and they are more stable. Unit 1A’s temperature distribution changes by 50% from 25 to 40 degrees. In Unit 2A, some sensors maintain their intermediate states for a considerable period. It can be confirmed that the MOT_TEMP0,1 and PUM_VIB2,3 sensors maintain a tri-state. This indicates that the BFP is operating at a medium level. In Unit 2B, the PUP_VIB3 vibrated over 200 mm, significantly higher than other sensors. Furthermore, MOT_VIB2,3 exhibited abnormally higher vibrations than all the other sensors. The operation of the BFP depends on the turbine’s condition and is not limited to the highest or minimum level.
  • Different facilities show similar patterns under the same conditions but vary widely depending on their conditions.
  • Two temperature states can be observed at identical locations, even if only a tri-state is observed by the vibration sensor.
Figure 9 shows the correlation between temperature, vibration, and position of the BFP. It can be seen that a similar pattern is observed overall for each BFP. The correlation is relatively high for the same type of sensor in all facilities. It can be seen that the correlation between temperature and vibration is relatively high, while MOT_VIB0,1 has a high inverse relationship. Although the correlation between temperature sensors in Unit 1A is not observed as strongly as in Unit 1B, it can be confirmed that it is more than 70% overall. On the other hand, a more complex pattern is observed in Unit 2. A similar pattern is observed for each BFP. The correlation between the same type of sensor is relatively high in all units. Additionally, there is a relatively high correlation between temperature and vibration, while MOT_VIB0,1 shows a high inverse relationship. Although the correlation between temperature sensors in Unit 1A is not as strong as in Unit 1B, it can be confirmed that it is more than 70% overall. However, a more complex pattern is observed in Unit 2. Unit 2A’s overall correlation between vibration and temperature is robust. Unit 2B shows a slightly different pattern from Unit 2A. SHT_VIB0 correlates very highly with other sensors, while SHT_VIB1 does not correlate highly with other sensors. The remaining characteristics overall show similar correlation between Units 1A and B.

4.4.2. Characteristic Analysis

As mentioned above, most of the equipment in the boiler zone was excepted except oil-related equipment and the pulverizer. Therefore, we focus on ignition oil and pulverizers among various equipment with high fire risk.

Ignition Oil

When the boiler starts, the ignition oil is only used once to ignite the burner. However, ignition oil has low density, which poses a high fire risk when it leaks, unlike lubrication or hydraulic oil with high viscosity. The data for ignition oil include supply and return path oil flow rates, temperatures, ratios, and pressures. During turbine operation, the oil temperatures in the supply and return paths show regular intervals. There is almost no temperature difference when the turbine stops. The supply path values are significantly different depending on the turbine operation conditions. However, the oil pressure fluctuates while the turbine is stopped, as shown in Figure 10. Operational experts acknowledged that the reason is related to equipment maintenance during the overhaul period. The sensor may detect unusual patterns when the facilities are dismantled and maintained. For these reasons, it is more reasonable to pause the monitoring of fire risk estimated from SCADA data during the overhaul period.

Pulverizer

The pulverizer grinds coal into fine particles, which are used to fuel the boiler burners in thermal power plants. However, the pulverizer is one of the facilities in the boiler zone that often causes fires. The system comprises various components, including the bunker, feeder, gearbox, motor, primary air, seal air, lubricant oil, hydraulic oil, and others, each monitored by numerous sensors. Due to the system’s complexity, nonlinearity, and high dimensionality, developing an accurate mathematical model for anomaly detection in the coal pulverizer system is challenging [21]. Therefore, pre-processing must be cautiously approached due to the large and diverse data. The bunkers, motors, lubricant oil, and gearboxes are the main objects that must be observed in the fire monitoring system. Grinding coal requires a lot of current caused by using a roller and motor. The pulverizer data strongly correlate with the motor’s current consumption, as shown in Figure 11. This is because the motor operation increases its load as current consumption rises regardless of the turbine’s state.

4.5. Discussion

After analyzing the data provided, we can gather the following information:
  • The associated features are not altered if the RPM stays the same.
  • Regarding the facility data for which we have not been provided with allowable ranges, the data of a single item cannot be meaningful because the permissible range is unknown.
  • Observing the RPM can help us estimate how much the turbine-related features change. If there is a change to the RPM, we can predict the corresponding changes to turbine-related features. We then compare the expected and actual values. On the other hand, by observing the turbine-related features, we can estimate the current state of the turbine.
  • Using RPM as a reference feature is appropriate due to its strong correlation with turbine-related features.
  • Oil-related features exhibit diverse patterns and cannot be generalized. A deep learning model efficiently detects abnormalities.
The following items require additional discussion:
  • What are the primary causes of data fluctuations compared to other units? Should these fluctuations be considered when designing the model if they fall within the normal range?
  • Should different models be designed for each unit, even in identical facility types where different patterns may be observed?
  • It is reasonable to assume that sensor data will have similar patterns. Therefore, is it appropriate to use one model to make predictions for the same facility?
  • If abnormal sensor data are detected during the overhaul period, should the model automatically stop predicting for that period?
  • When sensor data show an abnormal pattern, can a model distinguish between sensor malfunctions and equipment issues?
  • How do we respond to facility abnormalities or deterioration based on the operating period, even under the same conditions?
We can design an algorithm for real-time fire risk estimation through the data analysis, as illustrated in Figure 12. The algorithm determines whether the equipment is being operated based on RPM sensor data. Statistical analysis can be conducted by extracting statistical features and checking the upper and lower limits when the system is operational. Along with statistical analysis, we also perform deep-learning-based analysis simultaneously. The deep-learning-based analysis is practical, but statistical analysis is used to explain anomalies. Fire risk is estimated by combining statistical analysis and deep-learning-based analysis.

5. Conclusions

In this paper, we proposed using facility data to estimate fire risk to develop a dynamic fire protection system for thermal power plants. Firstly, we considered that facilities are designed and manufactured with a specific purpose in mind and are operated within the scope of design conditions to achieve that purpose. Therefore, we presented a method for estimating fire risk using facility data. Since a facility’s operating conditions can determine its exact state, we assume it has normal, transient, and abnormal states and model fire risk estimation based on them. In order to ensure that the requirements for a dynamic fire protection system were met, the power plant’s facilities were categorized based on their functions, zones, and fuels. The corresponding data for each facility were classified accordingly. Furthermore, the selection of fire-related data from the SCADA data was explained to estimate the fire risk. In order to develop a fire risk estimation algorithm, the selected data were analyzed for their distribution, correlation, and characteristics of individual data for each facility. This helped us estimate the status and operation of the facility and understand the characteristics of the thermal power plant data. The data analysis was conducted using data sets from 500 MW and 100 MW power plants based on the described approach. The data classification and analysis method proposed in this paper can provide indirect experience to data analysts who need domain knowledge about power plant fires. It can also inspire data analysts who require knowledge of power plant facilities.

6. Future Works

In this paper, we proposed a method to select fire-related tags from the thermal power plant SCADA system and analyzed two plants’ data. Based on the analyzed results, research on machine learning and deep learning models that can estimate fire risk by facility and area should be conducted. Additionally, a framework that can store, process, and manage data in real-time based on classified tags should be developed. Since estimating fire risk based on facility data is very limited, better results can be produced when combined with image-based prediction, which is the most-actively researched method recently in deep learning.

Author Contributions

C.-J.S. conceived and designed the experiments; J.-Y.P. classified and acquired the data; C.-J.S. and J.-Y.P. analyzed the data; C.-J.S. wrote the paper. All authors have read and agreed to the published version of the manuscript.

Funding

This research was granted financial resources from the Ministry of Trade, Industry, and Energy (MOTIE, Korea)—Project Name: Development of visualized fire protection system to Thermal Power Plant through IIoT & Digital Twin technology/Project Number: 20206610100060.

Institutional Review Board Statement

Not applicable.

Informed Consent Statement

Not applicable.

Data Availability Statement

Sample data sets are not available because of the NDAs of the thermal power plant companies.

Acknowledgments

This work was supported by Energy Technology Development of the Korea Institute of Energy Technology Evaluation and Planning (KETEP).

Conflicts of Interest

The authors declare no conflict of interest.

Abbreviations

The following abbreviations are used in this manuscript:
SCADASupervisory Control And Data Acquisition
AEAutoEncoder
VAEVariational AutoEncoder
LSTMLong-Short Term Memory
OCSVMOne Class Support Vector Machine
IoTInternet of Things
SVDDSupport Vector Data Description
SADSemi-Supervised Anomaly Detection
SVRSupport Vector Regression
AutoMLAutomated Machine Learning
ECGElectrocardiogram
MWMegawatt
HPHigh-Pressure
IPIntermediate-Pressure
LPLow-Pressure
BFPBoiler Feed Pump
H2Hydrogen
RPMRevolutions Per Minute
UVCEUnconfined Vapor Cloud Explosion
BOPBalance of Plant

References

  1. Nugroho, M.J.; Bahartyan, E.; Raymond, R.; Hidayat, B.; Irawan, M.I. Root Cause Analysis of Fires in Coal Power Plants Using RFMEA Methods. IOP Conf. Ser. Mater. Sci. Eng. 2021, 1096, 012100. [Google Scholar] [CrossRef]
  2. Rathod, R.; Gidwani, G.D.; Solanky, P. Hazard Analysis and Risk Assessment in Thermal Power Plant. Int. J. Eng. Sci. Res. Technol. 2017, 6, 177–185. [Google Scholar]
  3. Yadav, G.; Paul, K. Architecture and security of SCADA systems: A review. Int. J. Crit. Infrastruct. Prot. 2021, 34, 100433. [Google Scholar] [CrossRef]
  4. Suryadarma, E.; Ai, T. Predictive Maintenance in SCADA-Based Industries: A literature review. Int. J. Ind. Eng. Eng. Manag. 2020, 2, 57–70. [Google Scholar] [CrossRef]
  5. Roscher, B.; Schelenz, R. Usability of SCADA as predictive maintenance for wind turbines. Forsch. Ing. 2021, 85, 173–180. [Google Scholar] [CrossRef]
  6. Maseda, F.J.; López, I.; Martija, I.; Alkorta, P.; Garrido, A.J.; Garrido, I. Sensors Data Analysis in Supervisory Control and Data Acquisition (SCADA) Systems to Foresee Failures with an Undetermined Origin. Sensors 2021, 21, 2762. [Google Scholar] [CrossRef]
  7. Santolamazza, A.; Dadi, D.; Introna, V. A Data-Mining Approach for Wind Turbine Fault Detection Based on SCADA Data Analysis Using Artificial Neural Networks. Energies 2021, 14, 1845. [Google Scholar] [CrossRef]
  8. Butler, S.; Ringwood, J.; O’Connor, F. Exploiting SCADA system data for wind turbine performance monitoring. In Proceedings of the 2013 Conference on Control and Fault-Tolerant Systems (SysTol), Nice, France, 9–11 October 2013; pp. 389–394. [Google Scholar] [CrossRef]
  9. Lebranchu, A.; Charbonnier, S.; Bérenguer, C.; Prévost, F. A combined mono- and multi-turbine approach for fault indicator synthesis and wind turbine monitoring using SCADA data. ISA Trans. 2019, 87, 272–281. [Google Scholar] [CrossRef]
  10. Choi, K.; Yi, J.; Park, C.; Yoon, S. Deep Learning for Anomaly Detection in Time-Series Data: Review, Analysis, and Guidelines. IEEE Access 2021, 9, 120043–120065. [Google Scholar] [CrossRef]
  11. Li, G.; Jung, J.J. Deep learning for anomaly detection in multivariate time series: Approaches, applications, and challenges. Inf. Fusion 2023, 91, 93–102. [Google Scholar] [CrossRef]
  12. Audibert, J.; Michiardi, P.; Guyard, F.; Marti, S.; Zuluaga, M.A. Do deep neural networks contribute to multivariate time series anomaly detection? Pattern Recognit. 2022, 132, 108945. [Google Scholar] [CrossRef]
  13. Samariya, D.; Thakkar, A. A Comprehensive Survey of Anomaly Detection Algorithms. Ann. Data Sci. 2021, 10, 829–850. [Google Scholar] [CrossRef]
  14. Hakim, M.; Omran, A.A.B.; Ahmed, A.N.; Al-Waily, M.; Abdellatif, A. A systematic review of rolling bearing fault diagnoses based on deep learning and transfer learning: Taxonomy, overview, application, open challenges, weaknesses and recommendations. Ain Shams Eng. J. 2023, 14, 101945. [Google Scholar] [CrossRef]
  15. Gupta, P.; Pradhan, M. Fault detection analysis in rolling element bearing: A review. Mater. Today Proc. 2017, 4, 2085–2094. [Google Scholar] [CrossRef]
  16. Khalid, S.; Song, J.; Raouf, I.; Kim, H.S. Advances in Fault Detection and Diagnosis for Thermal Power Plants: A Review of Intelligent Techniques. Mathematics 2023, 11, 1767. [Google Scholar] [CrossRef]
  17. Wu, G.; Yan, T.; Yang, G.; Chai, H.; Cao, C. A Review on Rolling Bearing Fault Signal Detection Methods Based on Different Sensors. Sensors 2022, 22, 8330. [Google Scholar] [CrossRef] [PubMed]
  18. Nicoletti, R.; Burda, E.A.; Zusman, G.V.; Kudryavtseva, I.S.; Naumenko, A.P. An Overview of Vibration Analysis Techniques for the Fault Diagnostics of Rolling Bearings in Machinery. Shock. Vib. 2022, 2022, 6136231. [Google Scholar] [CrossRef]
  19. Kuo, C.H.; Chuang, Y.F.; Liang, S.H. Failure Mode Detection and Validation of a Shaft-Bearing System with Common Sensors. Sensors 2022, 22, 6167. [Google Scholar] [CrossRef]
  20. Moleda, M.; Momot, A.; Mrozek, D. Predictive Maintenance of Boiler Feed Water Pumps Using SCADA Data. Sensors 2020, 20, 571. [Google Scholar] [CrossRef]
  21. Chen, Z.; Yan, Z.; Jiang, H.; Que, Z.; Gao, G.; Xu, Z. Detecting Coal Pulverizing System Anomaly Using a Gated Recurrent Unit and Clustering. Sensors 2020, 20, 3271. [Google Scholar] [CrossRef]
  22. Choi, M.Y.; Jun, S. Fire Risk Assessment Models Using Statistical Machine Learning and Optimized Risk Indexing. Appl. Sci. 2020, 10, 4199. [Google Scholar] [CrossRef]
  23. Ciaburro, G.; Iannace, G. Machine Learning-Based Algorithms to Knowledge Extraction from Time Series Data: A Review. Data 2021, 6, 55. [Google Scholar] [CrossRef]
  24. Chen, H.; Liu, H.; Chu, X.; Liu, Q.; Xue, D. Anomaly detection and critical SCADA parameters identification for wind turbines based on LSTM-AE neural network. Renew. Energy 2021, 172, 829–840. [Google Scholar] [CrossRef]
  25. Nabhan, A.; Ghazaly, N.; Samy, A.; Mousa, O.M. Bearing Fault Detection Techniques—A Review. Turk. J. Eng. Sci. Technol. 2015, 3, 1–18. [Google Scholar]
  26. Boudiaf, A.; Djebala, A.; Bendjma, H.; Balaska, A.; Dahane, A. A summary of vibration analysis techniques for fault detection and diagnosis in bearing. In Proceedings of the 2016 8th International Conference on Modelling, Identification and Control (ICMIC), Algiers, Algeria, 15–17 November 2016; pp. 37–42. [Google Scholar] [CrossRef]
Figure 3. Distribution of turbine temperature and vibration: (Upper Left) temperature of Unit 1, (Upper Right) vibration of Unit 1, (Lower Left) temperature of Unit 2, and (Lower Right) vibration of Unit 2.
Sensors 23 08967 g003
Figure 4. Correlation between turbines: (Upper Left) temperature of Unit 1, (Upper Right) vibration of Unit 1, (Lower Left) temperature of Unit 2, and (Lower Right) vibration for Unit 2.
Sensors 23 08967 g004
Figure 5. HP Shaft vibration of X- and Y-axes at Positions 1 and 2: (Left) scatter plot and (Right) 3D plot.
Sensors 23 08967 g005
Figure 6. HP bearing vibration of X- and Y-axes at Positions 1 and 2: (Left) scatter plot and (Right) 3D plot.
Sensors 23 08967 g006
Figure 7. Unusual pattern of HP shaft vibration: (Upper Left) X- and Y-axes at Position 1, (Upper Right) zoom in on shaded areas of the left figure, (Lower Left) X- and Y-axes at Position 2, and (Lower Right) zoom in on shaded areas of the left figure.
Sensors 23 08967 g007
Figure 8. Distribution of BFP temperatures and vibrations: (Upper Left) Unit 1A, (Upper Right) Unit 1B, (Lower Left) Unit 2A, and (Lower Right) Unit 2B.
Sensors 23 08967 g008
Figure 9. Correlation between BFPs: (Upper Left) Unit 1A, (Upper Right) Unit 1B, (Lower Left) Unit 2A, and (Lower Right) Unit 2B.
Sensors 23 08967 g009
Figure 10. Supply path pressure values of ignition oil.
Sensors 23 08967 g010
Figure 11. Pulverizer motor signals: (Upper) temperatures vs. current of motor and (Lower) vibrations of motor vs. turbine RPM.
Sensors 23 08967 g011
Figure 12. Fire risk estimation diagram.
Sensors 23 08967 g012
Table 1. Comparison between transient and anomaly states.
Transient StateAbnormal StateRemarks
Data changedData changedBy changing conditions or by remaining conditions
Repeated patternUnusual patternChange-point selection; change-pattern analysis
Changed in acceptable rangeChanged in unacceptable rangeRelative change according to operating conditions
Table 2. Subdivision of facility.
ZoneFacilitiesCount
TurbineHigh-Pressure (HP) Turbine, Intermediate-Pressure (IP) Turbine, Low-Pressure (LP) Turbine, Generator, H2, Hydraulic Oil, Lubricant Oil, BFP8
BoilerIgnition Oil, Pulverizer2
Table 3. Fire and explosion scenarios and ignition sources in the turbine zone.
EquipmentFire and Explosion ScenariosSource of Ignition
Turbine Hydraulic Oil TankPool fire due to oil leakageHigh-temperature parts, Electrical cause, Hot work, Other
Overheating due to low oil level in the tank
Oil overpressure
Oil overtemperature
Turbine Lubricant Oil TankPool fire due to oil leakageHigh-temperature parts, Electrical cause, Hot work, Other
Overheating due to low oil level in the tank
Oil overpressure
Oil overtemperature
Turbine Bearing3D fire caused by oil leakageHigh-temperature parts, Electrical cause, Hot work, Other
Oil oversupply
Oil overpressure
Oil overtemperature
Generator BodyUnconfined Vapor Cloud Explosion (UVCE) due to H2 leakageHigh-temperature parts, Electrical cause, Hot work, Other
Jet fire due to H2 leakage
H2 overpressure
H2 oversupply
H2 Supply EquipmentUVCE due to H2 leakage
Jet fire due to H2 leakage
H2 overpressure
Lubricant and Hydraulic Oil Supply Piping3D fire due to oil leakage
Pool fire due to oil leakage
Oil overpressure
Fire due to contact with high-temperature parts when oil is scattered
CableFire due to overheating cables
Other cable fires
Poor insulation due to water leakage
FloorFire due to hot workWelding, Cutting
Table 4. Fire and explosion scenarios and ignition sources in the boiler zone.
EquipmentFire and Explosion ScenariosSource of Ignition
Pulverizer Lubricant Oil TankPool fire due to oil leakage
Oil level drop in tank
Oil overpressure
Pulverizer Hydraulic Oil TankPool fire due to oil leakage
Oil level drop in tank
Oil overpressure
Fire due to contact with high-temperature parts when oil is scattered
Pulverizer Lubricant Oil TankPool fire due to oil leakage
Oil level drop in tank
Oil overpressure
Pulverizer BodyPulverizer abnormal temperatureHigh-temperature part, Electrical cause hot work, Spontaneous ignition, etc.
Sparks and fires in pulverizer
Dust explosion during initial start-up of the pulverizer
Spontaneous ignition during prolonged non-operation
Coal FeederAbnormal temperature in the feederHigh-temperature part, Electrical cause hot work, Spontaneous ignition, etc.
Spontaneous ignition in feeders
Fires in other feeders
SiloAbnormal temperature in siloHigh-temperature parts, Electrical causes, Static electricity hot work, Spontaneous ignition, etc.
Spontaneous fire in upper silo
Spontaneous fire of lower silo
Dust explosion by floating dust during coal loading
Other fires in silo
Vacuum Refined Oil Supply FacilityPool fire due to oil leakage
3D fire due to oil leakage
Boiler Hydraulic Valve for Hydraulic Power UnitPool fire due to oil leakage
Fire due to contact with high-temperature parts when oil is scattered
Oil level drop in tank
Oil overpressure
Lubricant and Hydraulic Oil Supply Piping3D Fire due to oil leakage
Pool fire due to oil leakage
Oil overpressure
Fire due to contact with high-temperature parts when oil is scattered
Air Preheater Reducer and BearingPool fire due to oil leakage
Fire due to contact with high-temperature parts when oil is scattered
Anomaly caused by oil shortage
Air Preheater Lubricant Oil TankPool fire due to oil leakage
Overheating due to low oil level in the tank
Oil overpressure
Boiler Ventilation LubricatorPool fire due to oil leakage
Fire due to contact with high-temperature parts when oil is scattered
Anomaly caused by oil shortage
FloorFire caused by hot workWelding, Cutting
Table 5. Primary causes of severe fires in thermal power plants.
Zone1st Rank2nd Rank3rd Rank
TurbineLubricant Oil LeakageLubricant Oil LeakageH2 Leakage
BoilerFuel Oil LeakageLubricant Oil LeakageLubricant Oil Leakage
Indoor Coal StorageSpontaneous CombustionDust ExplosionGeneral Fire
Table 6. Number of tags in turbine zone for 500 MW plant.
ZoneEquipmentNumber of TagsFeatures
TurbineTurbine (Common)9Rotor position, number of revolutions, bearing oil pressure, hydraulic oil pressure
HP12Shaft vibration and position, bearing temperature
IP12Shaft vibration and position, bearing temperature
LP-A~B11 × 2Shaft vibration and position, bearing temperature
Generator15Shaft vibration, bearing temperature, air temperature
H216Cooler gas temperature, air temperature, H2 pressure, leakage rate
Lubricant Oil38Bearing temperature, oil pressure, oil temperature
Hydraulic Oil7Oil pressure, temperature, level
BFP-A~B30 × 2Shaft position, oil and bearing temperature, speed
Table 7. Number of tags in boiler zone for 500 MW plant.
ZoneEquipmentNumber of TagsFeatures
BoilerIgnition Oil14Pressure, flow, temperature
Pulverizer (Common)7Pressure, valve position
Pulverizer-A~F53 × 6Temperature, vibration, coal flow rate, number of revolutions, air flow rate, air pressure, hydraulic pressure, metal temperature, etc.
Table 8. Data set.
Table 8. Data set.
Generation CapacityZoneNumber of TagsPeriodInterval
500 MWTurbine1833 months10 min
500 MWBoiler3363 months10 min
100 MWTurbine2027 months30 min
Disclaimer/Publisher’s Note: The statements, opinions and data contained in all publications are solely those of the individual author(s) and contributor(s) and not of MDPI and/or the editor(s). MDPI and/or the editor(s) disclaim responsibility for any injury to people or property resulting from any ideas, methods, instructions or products referred to in the content.

