
Detection of Human Gait Phases Using Textile Pressure Sensors: A Low Cost and Pervasive Approach

 , , , and
Abstract
:1. Introduction
2. Materials and Methods
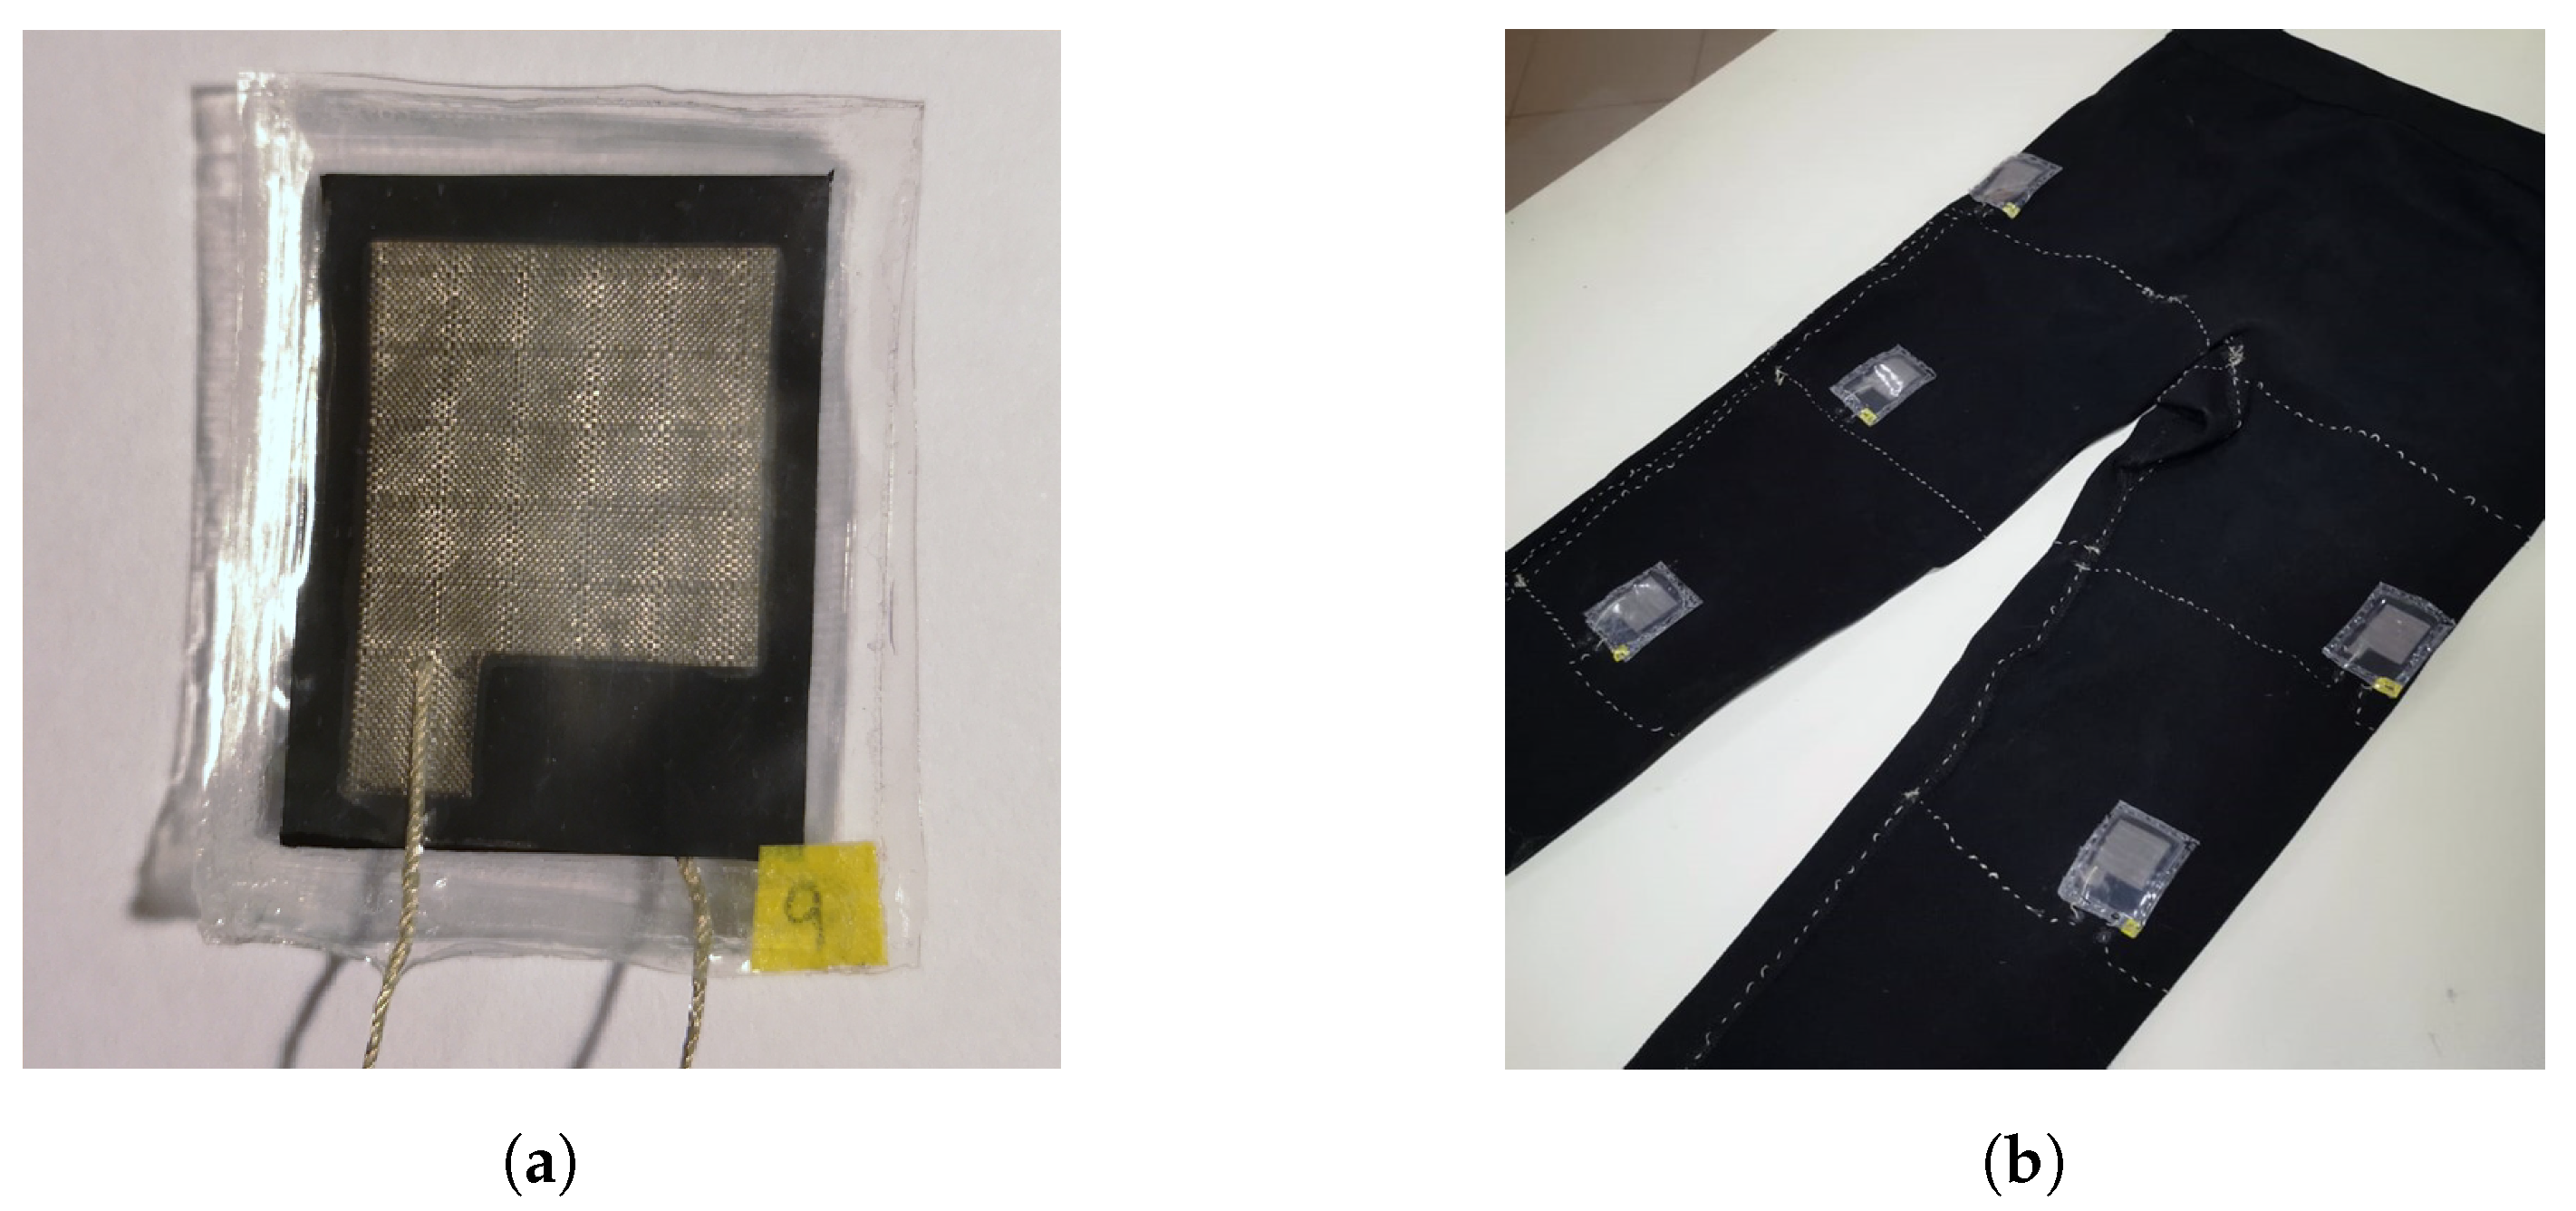
2.1. Textile Pressure Sensor
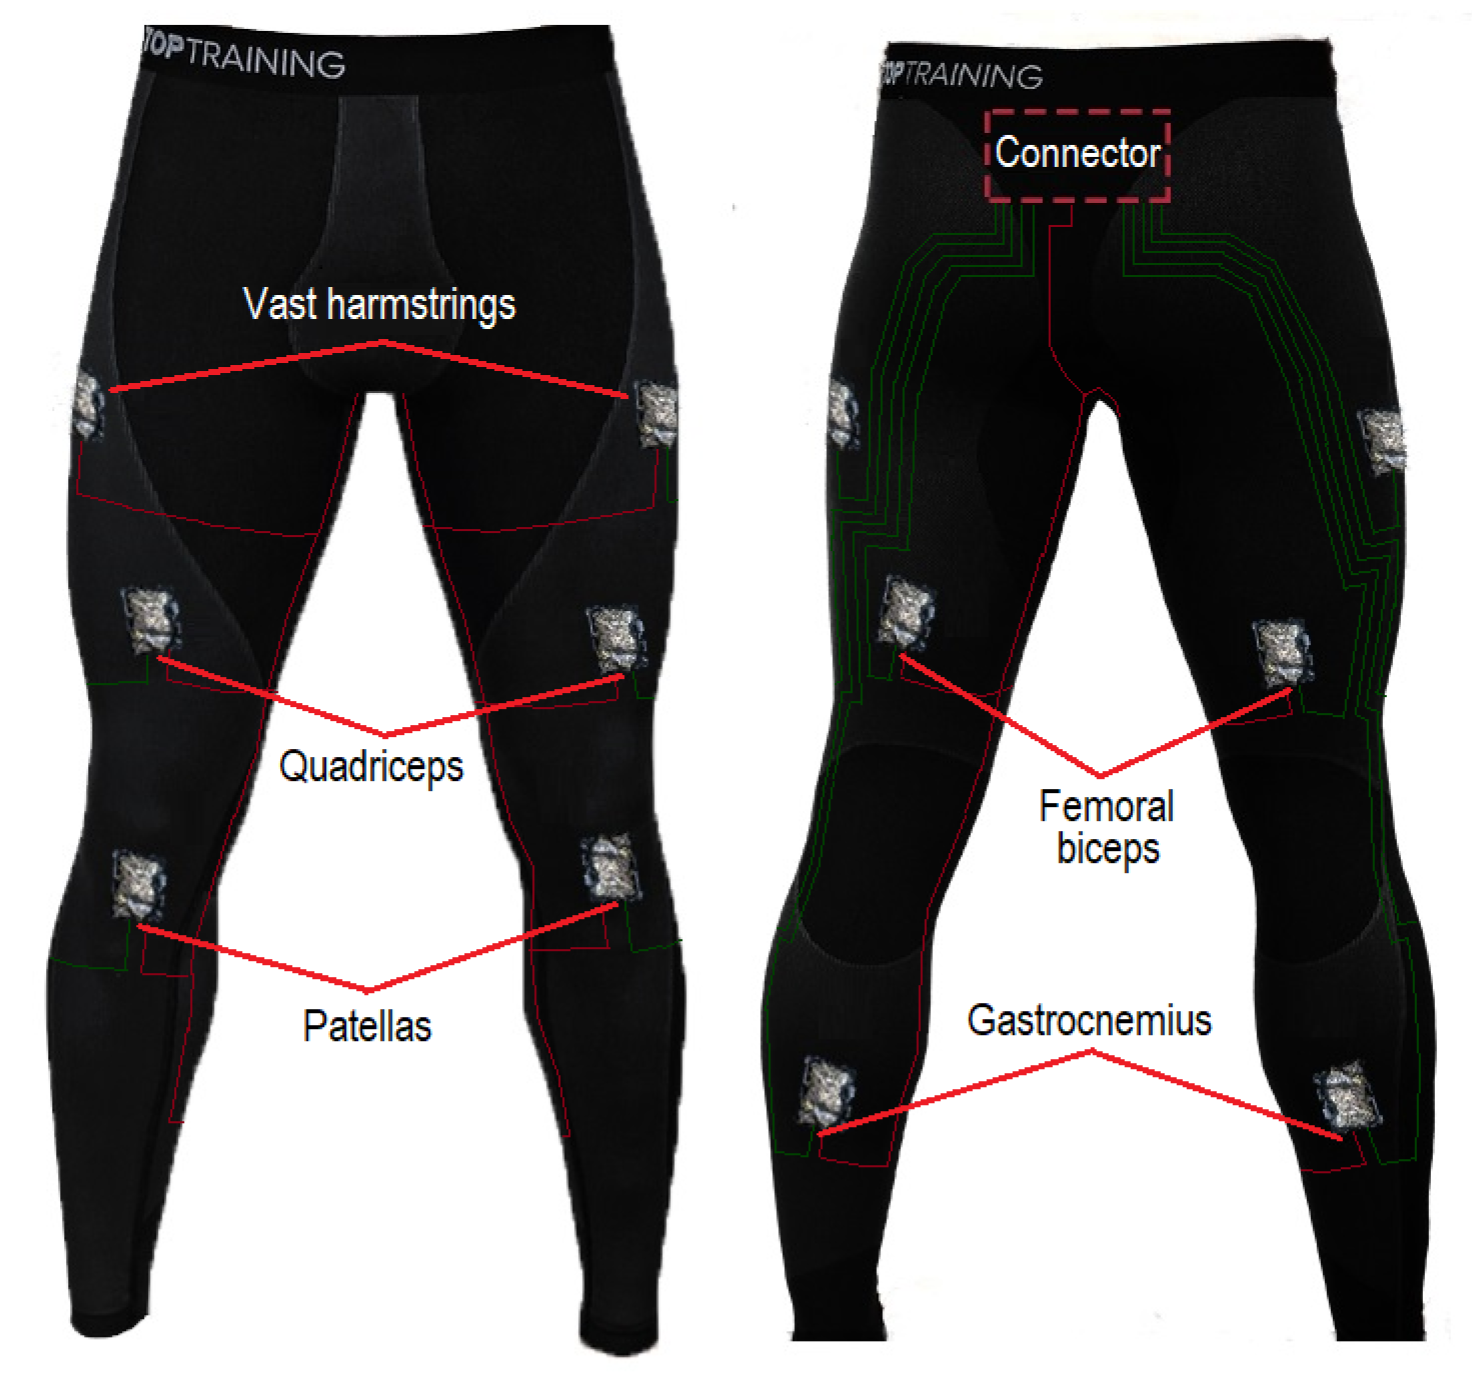
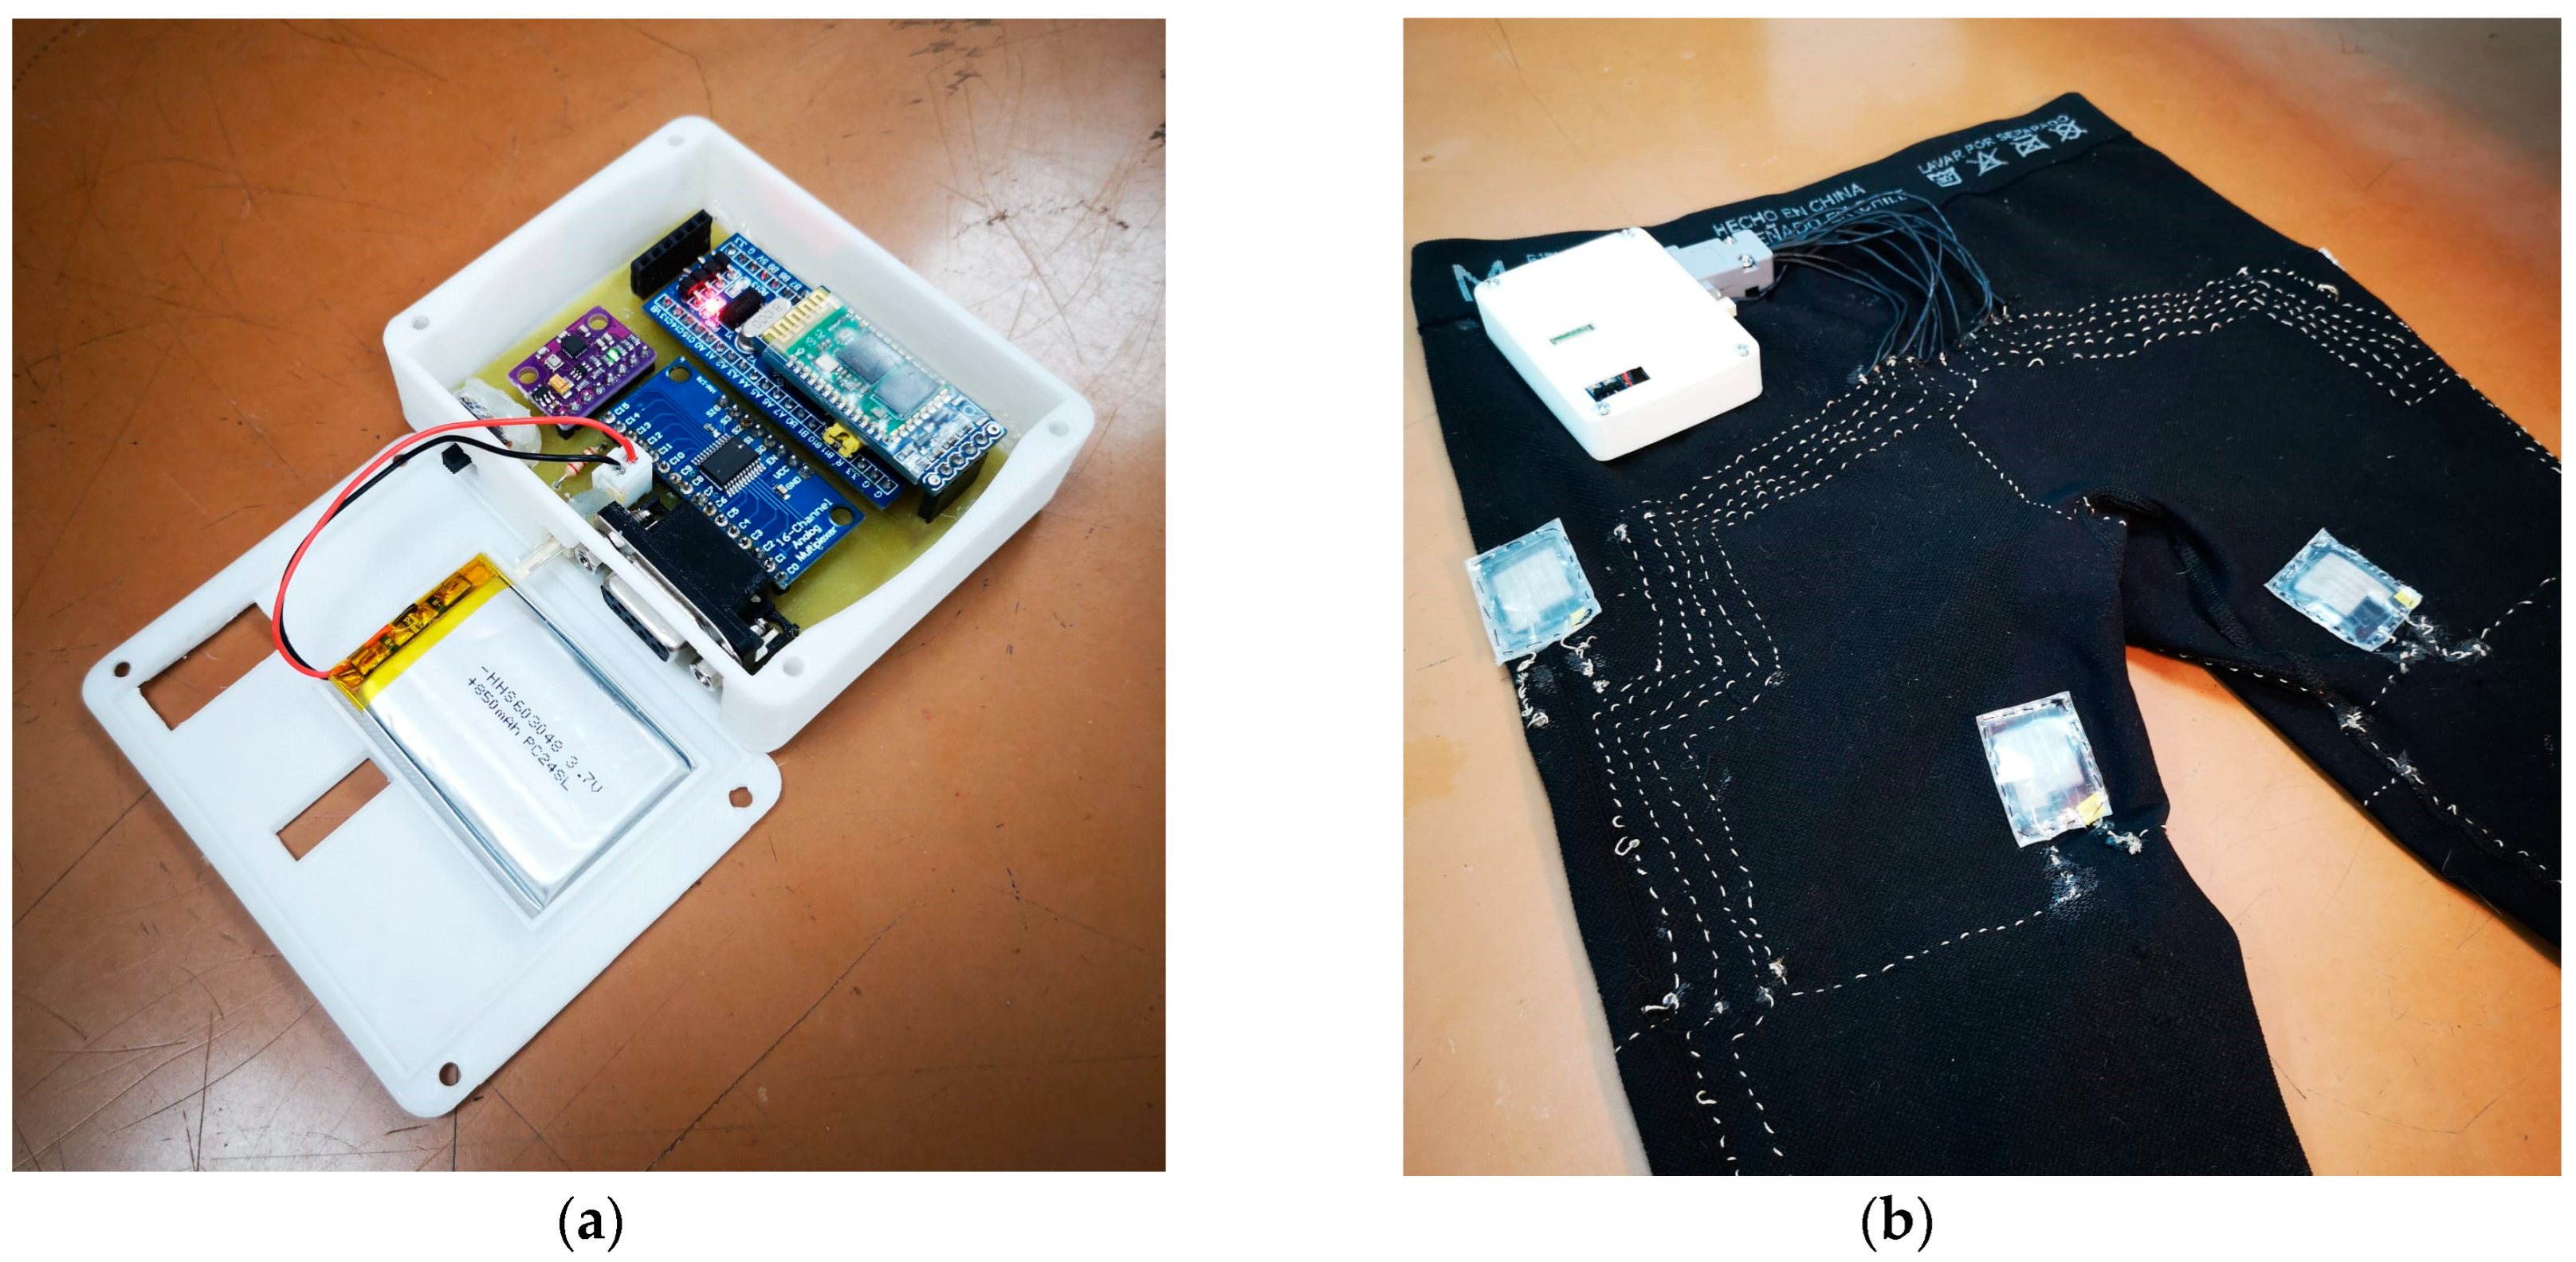
2.2. Experimental Setup
2.3. Participants
2.4. Study Protocol
2.5. Workflow
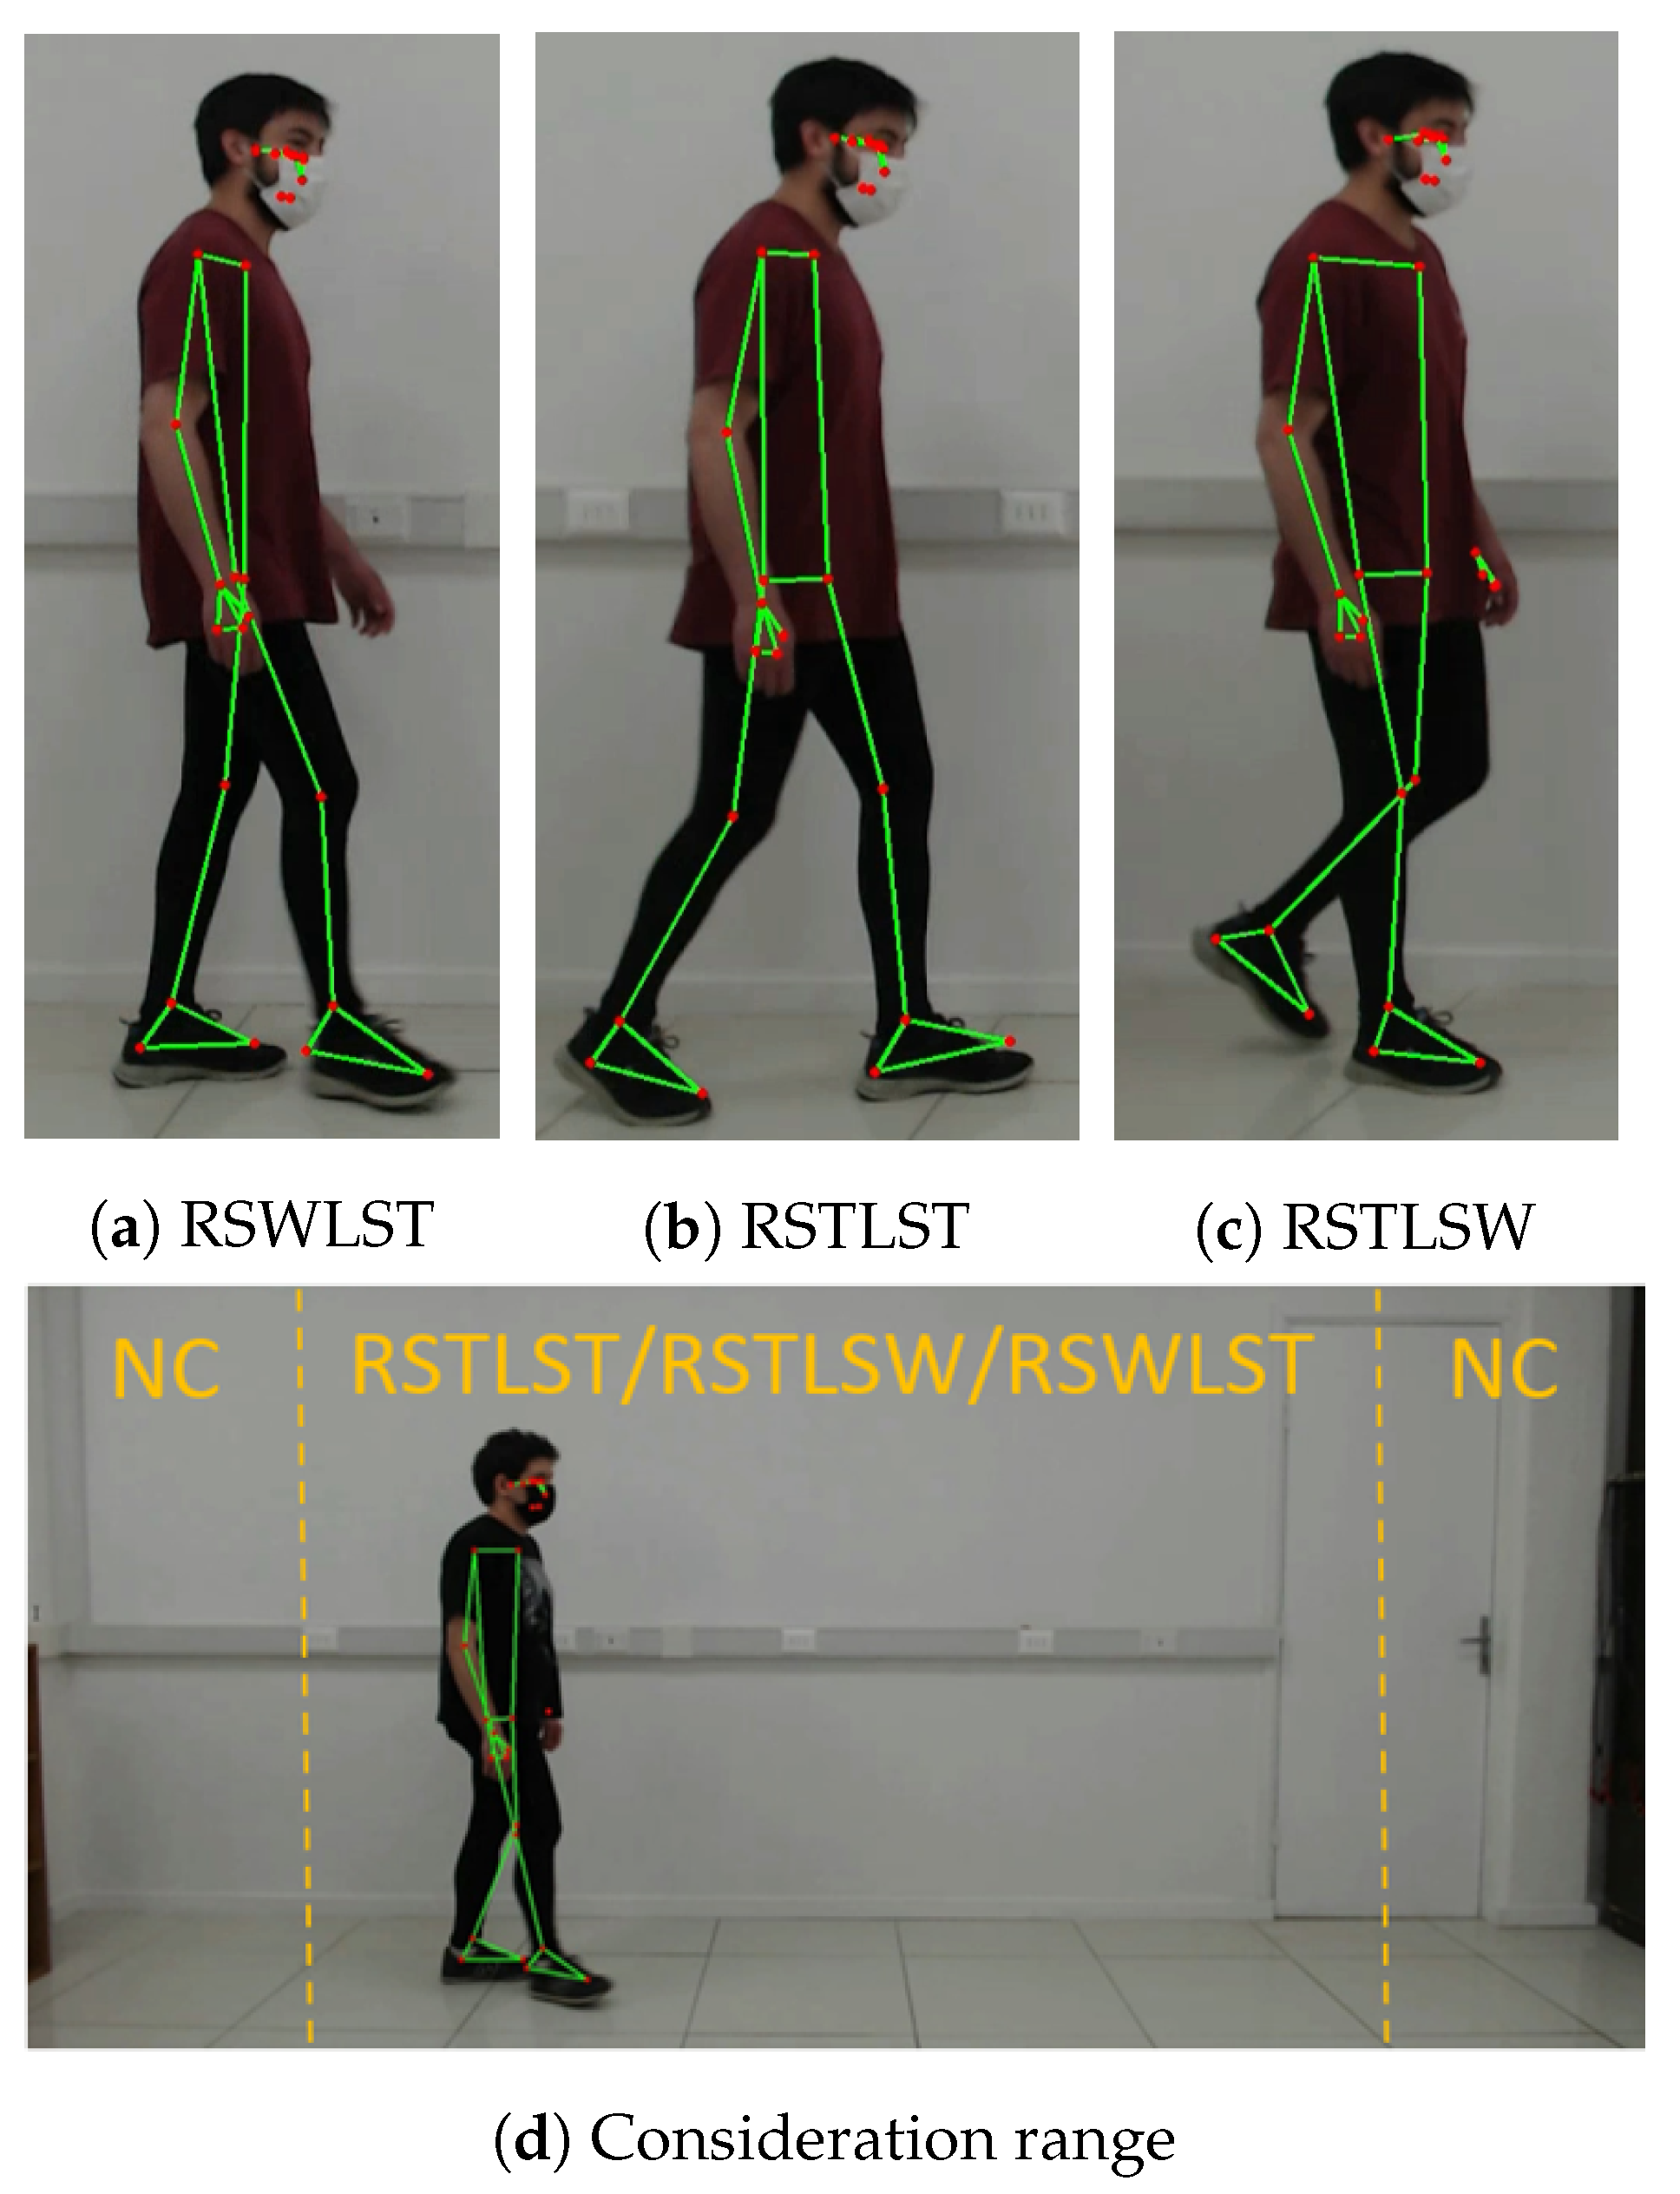
2.5.1. Data Labeling
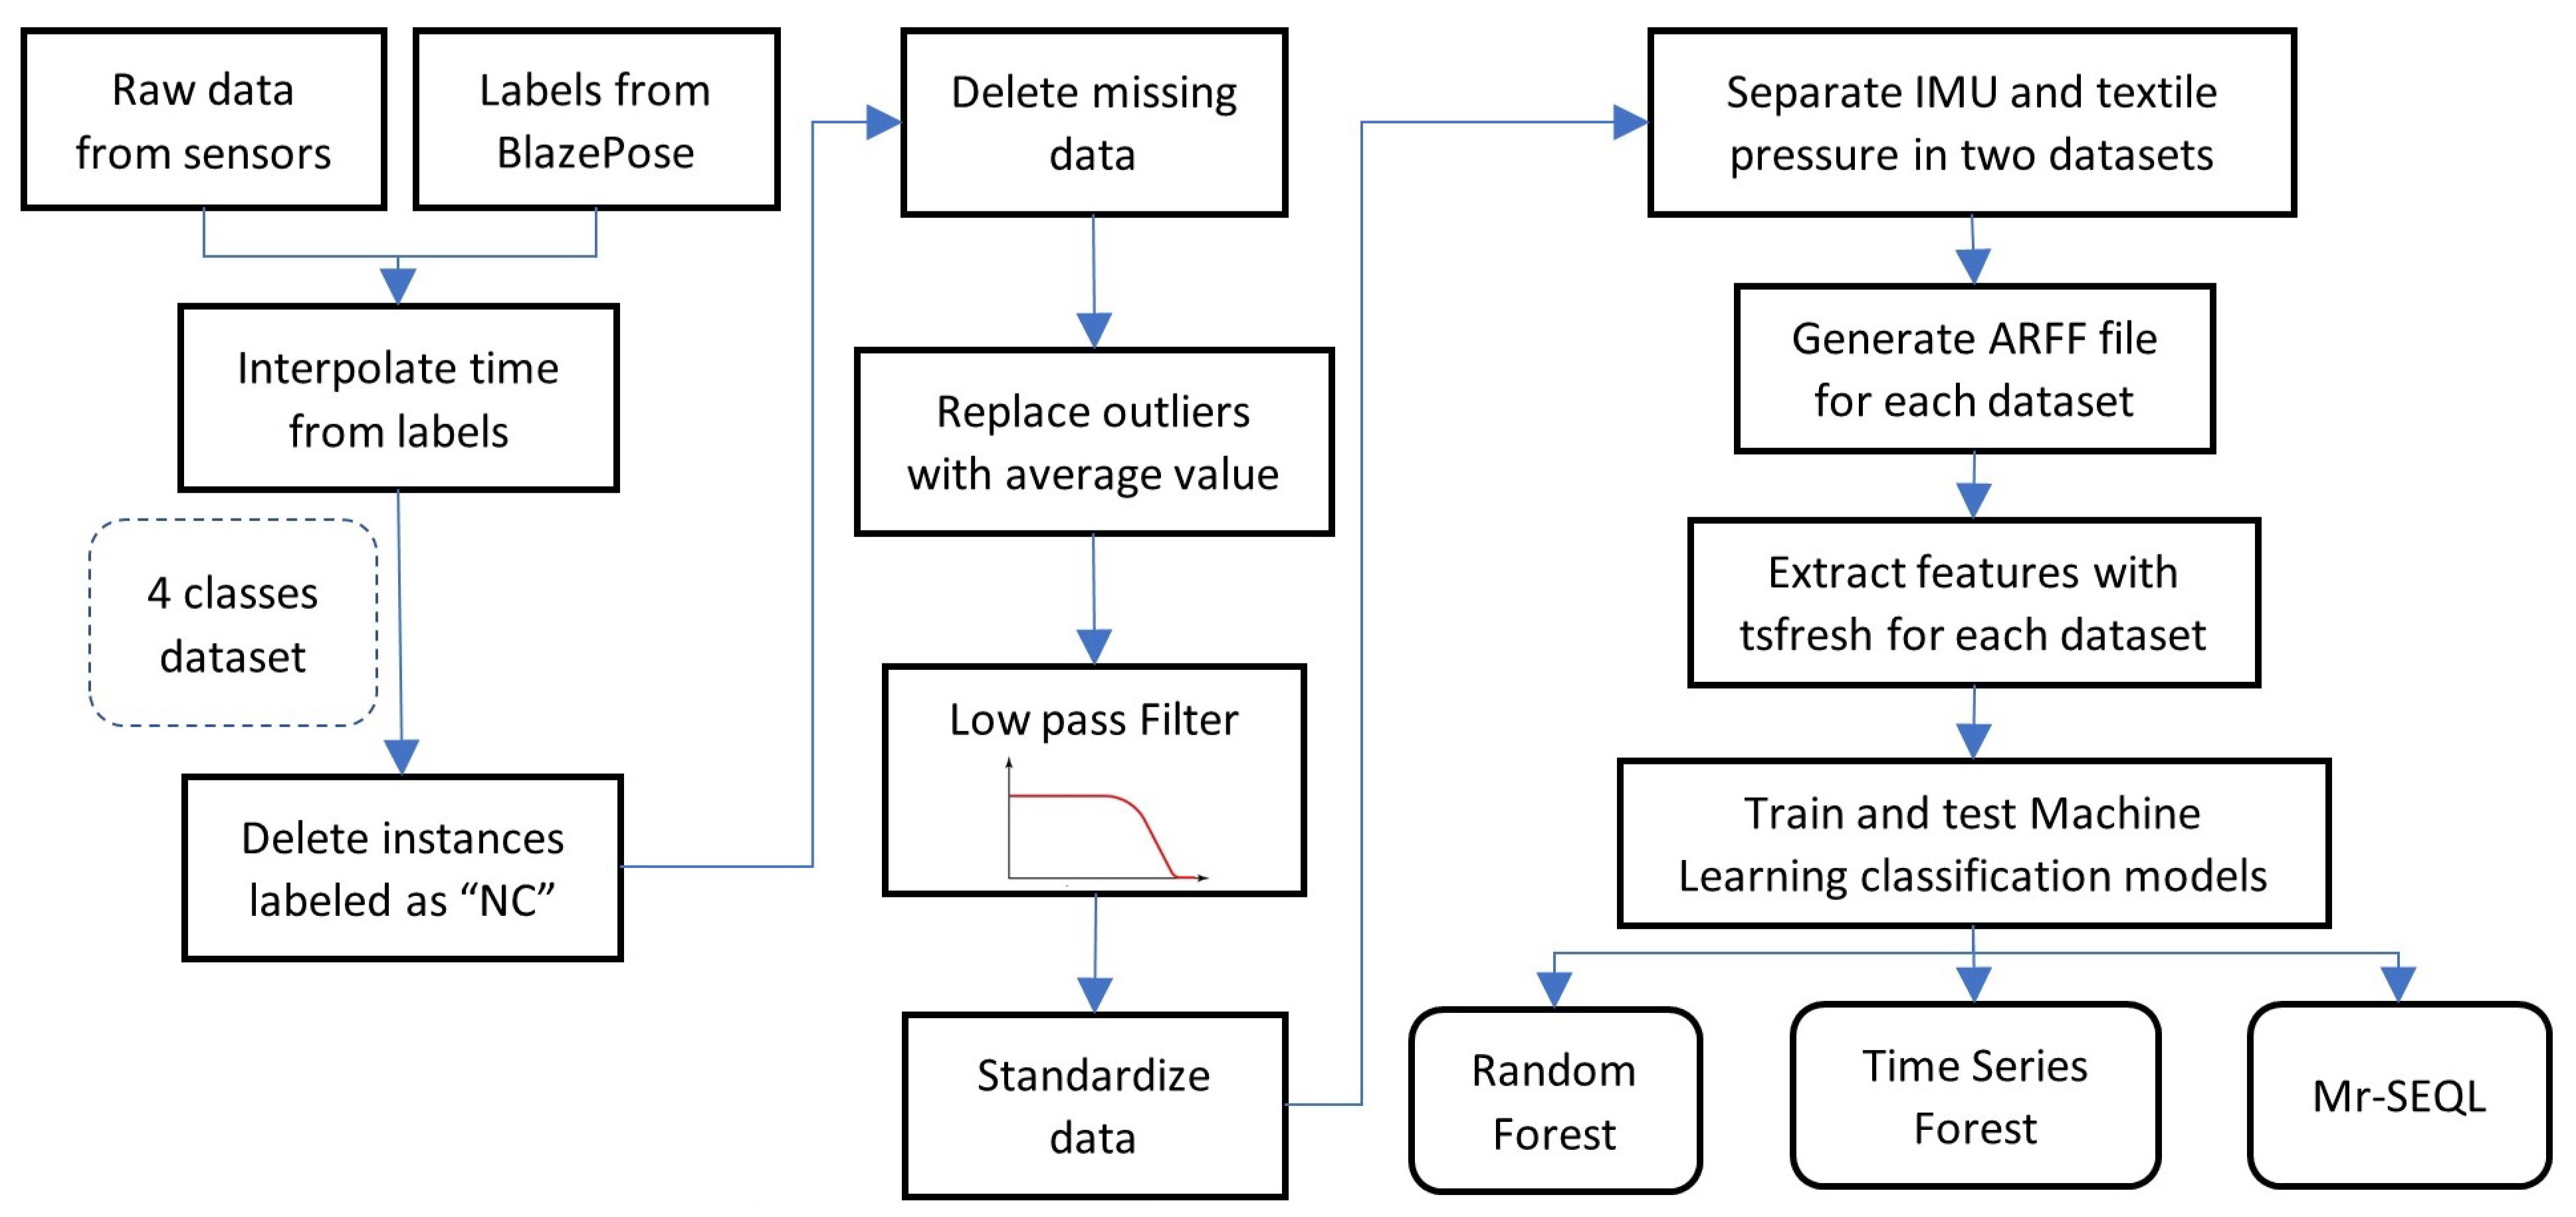
2.5.2. Data Pre-Processing
- Every data instance labeled as “NC” was removed from the dataset since they did not represent a regular walk in the participants’ gait cycles;
- Any instance that had missing or incomplete data due to transmission failures during the acquisition was deleted;
- The outliers of each signal were identified using the isoutlier function of MATLAB. This value was replaced with the average plus the standard deviation;
- A fifth-order low-pass Butterworth filter with a cutoff frequency of 20 Hz was applied to filter out the high-frequency noise in each signal;
- The signals from each sensor were individually normalized using the MATLAB function normalize, which centers the data vector at = 0 and a standard deviation = 1.
2.5.3. Feature Extraction and Selection
2.5.4. Machine Learning Algorithms
- Random forest: this algorithm is characterized by deciding which class an entry corresponds to when evaluating a set of randomly generated and trained decision trees [42];
- Time series forest (TSF): this classification algorithm is a meta-estimator and variant of the random forest algorithm for time series data. The data fit several decision tree classifiers on various sub-samples of a transformed dataset. It uses averages to improve predictive accuracy and control overfitting. For this algorithm, the sub-sample size is always the same as the original input sample size, but samples are drawn with replacements [43];
- Mr-SEQL: this algorithm is used to classify the univariate time series to train classification models (logistic regression) with characteristics extracted from multiple symbolic representations of time series (SAX), extracting features through the use of SEQL [44]. This method can be used for multivariate, such as ours, using a column assembly method.
2.5.5. Performance Evaluation
3. Results
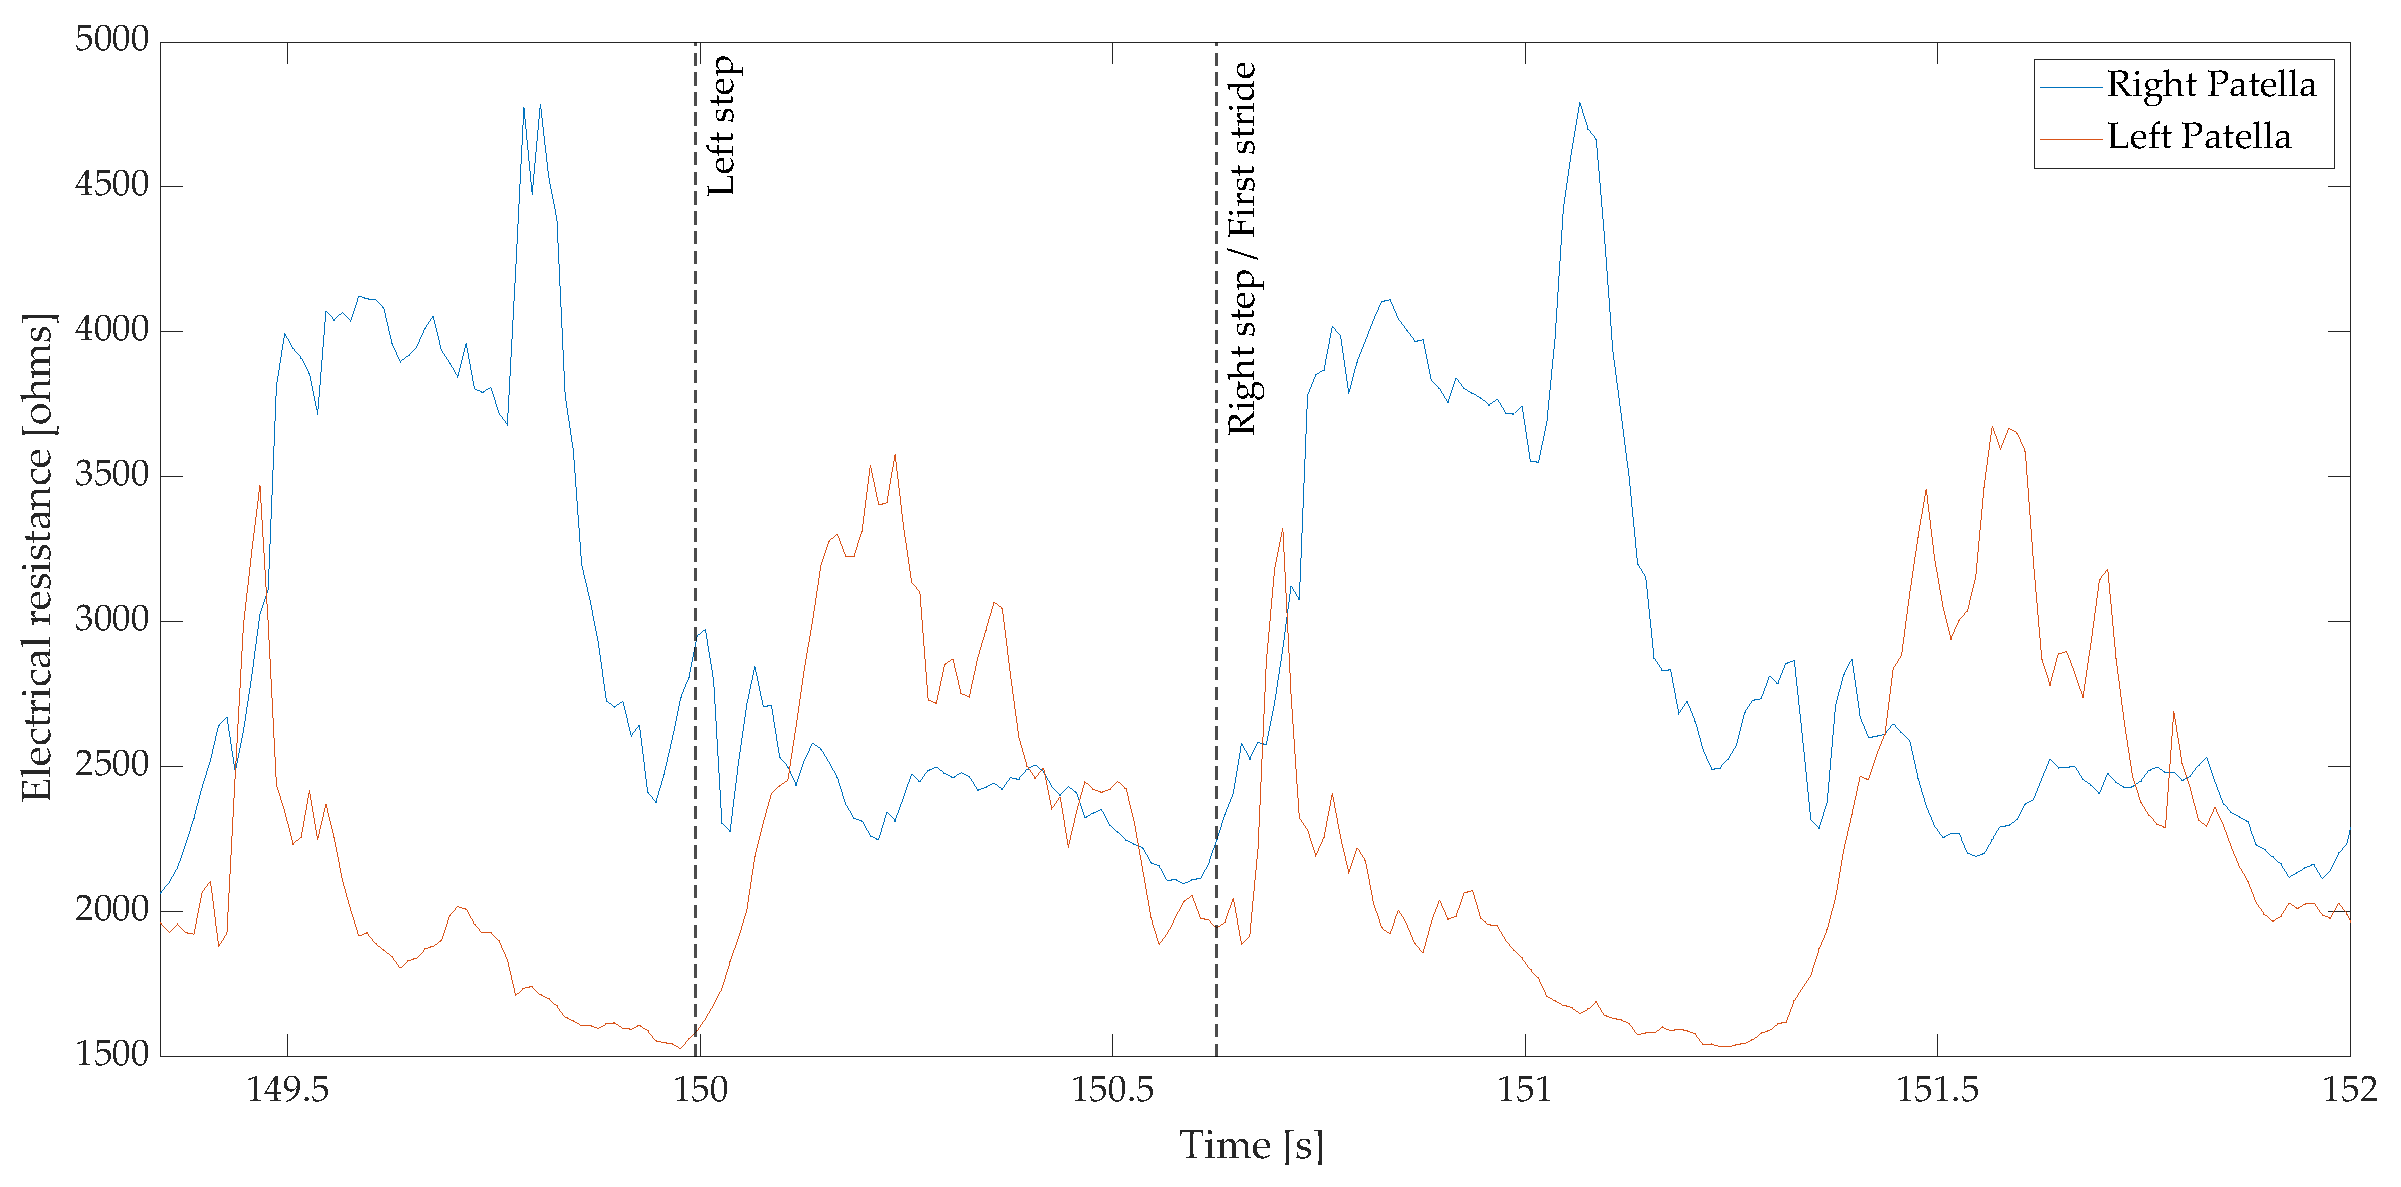
3.1. Measured Data
3.2. Labeling Method
3.3. Classification of Gait Phases
3.3.1. Precision
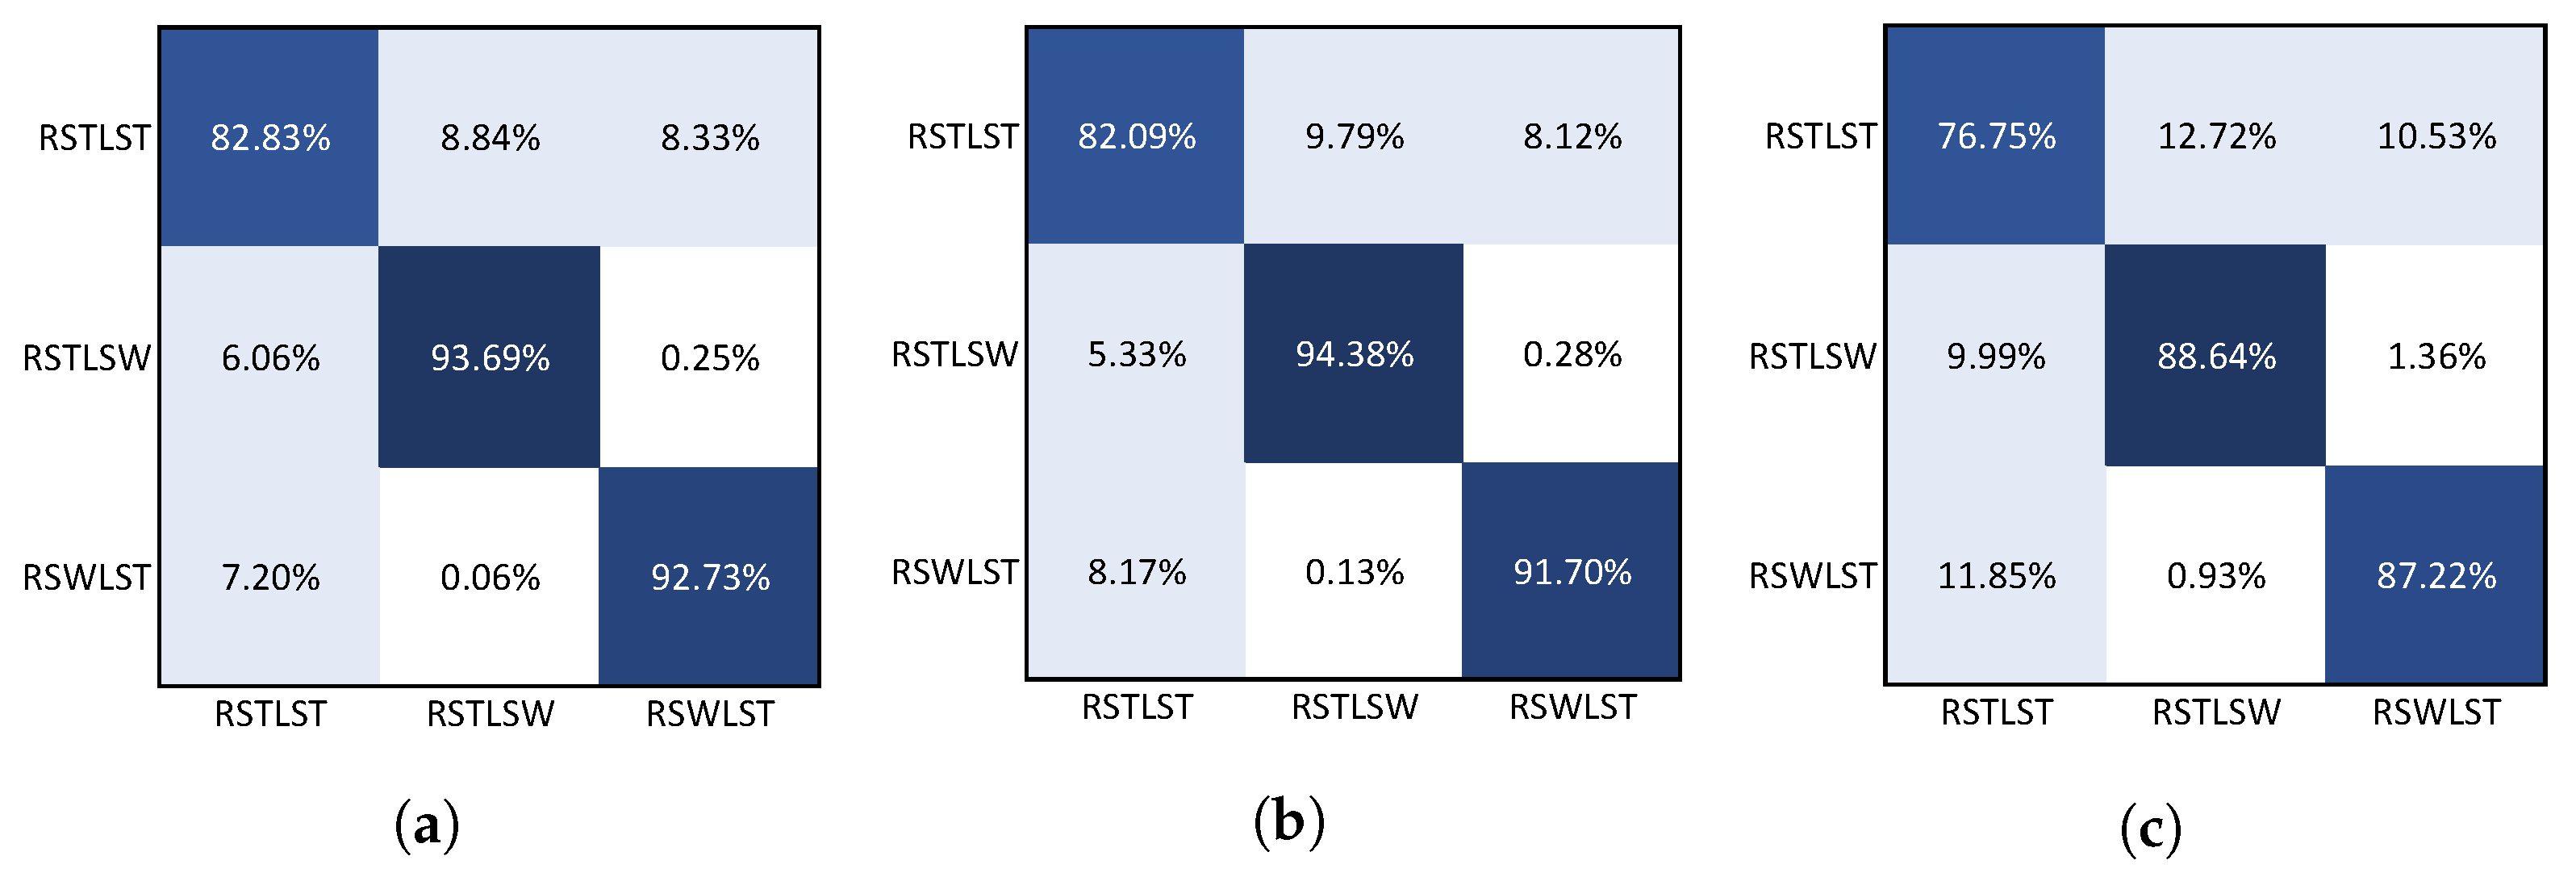
3.3.2. Confusion Matrix
4. Discussion
4.1. Results
4.2. Study Limitations
4.3. Future Work
Author Contributions
Funding
Institutional Review Board Statement
Informed Consent Statement
Data Availability Statement
Conflicts of Interest
Abbreviations
| MEMs | microelectromechanical systems |
| IMU | inertial measurement unit |
| RF | random forest |
| TSF | time series forest |
| Mr-SEQL | multi-representation sequence learner |
References
- Chambers, H.G.; Sutherland, D.H. A practical guide to gait analysis. J. Am. Acad. Orthop. Surg. 2002, 10, 222–231. [Google Scholar] [CrossRef] [PubMed] [Green Version]
- Lofterød, B.; Terjesen, T.; Skaaret, I.; Huse, A.B.; Jahnsen, R. Preoperative gait analysis has a substantial effect on orthopedic decision making in children with cerebral palsy: Comparison between clinical evaluation and gait analysis in 60 patients. Acta Orthop. 2007, 78, 74–80. [Google Scholar] [CrossRef] [PubMed]
- Baker, R.; Hart, H.M. Measuring Walking: A Handbook of Clinical Gait Analysis; Mac Keith Press: London, UK, 2013; Volume 1. [Google Scholar]
- Baker, R. Gait analysis methods in rehabilitation. J. Neuroeng. Rehabil. 2006, 3, 4. [Google Scholar] [CrossRef] [PubMed] [Green Version]
- Baker, R.; Esquenazi, A.; Benedetti, M.G.; Desloovere, K. Gait analysis: Clinical facts. Eur. J. Phys. Rehabil. Med. 2016, 52, 560–574. [Google Scholar] [PubMed]
- Hodgins, D. The importance of measuring human gait. Med. Device Technol. 2008, 19, 42–44. [Google Scholar] [PubMed]
- Simon, S.R. Quantification of human motion: Gait analysis—Benefits and limitations to its application to clinical problems. J. Biomech. 2004, 37, 1869–1880. [Google Scholar] [CrossRef]
- Silva, L.M.; Stergiou, N. The basics of gait analysis. Biomech. Gait Anal. 2020, 164, 231. [Google Scholar]
- Scataglini, S.; Verwulgen, S.; Roosens, E.; Haelterman, R.; Van Tiggelen, D. Measuring Spatiotemporal Parameters on Treadmill Walking Using Wearable Inertial System. Sensors 2021, 21, 4441. [Google Scholar] [CrossRef]
- Cimolin, V.; Galli, M. Summary measures for clinical gait analysis: A literature review. Gait Posture 2014, 39, 1005–1010. [Google Scholar] [CrossRef] [PubMed]
- Park, J. Quantitative Analysis of Gait and Balance. J. Korean Neurol. Assoc. 2017, 35, 5–9. [Google Scholar] [CrossRef]
- Song, K.W.; Song, Y.E.; Jung, H. IMU Based Walking Position Tracking Using Kinematic Model of Lower Body and Walking Cycle Analysis. J. Korean Soc. Precis. Eng. 2018, 35, 965–972. [Google Scholar] [CrossRef]
- Chen, S.; Lach, J.; Lo, B.; Yang, G.Z. Toward pervasive gait analysis with wearable sensors: A systematic review. IEEE J. Biomed. Health Inform. 2016, 20, 1521–1537. [Google Scholar] [CrossRef] [PubMed]
- Chen, D.; Cai, Y.; Qian, X.; Ansari, R.; Xu, W.; Chu, K.C.; Huang, M.C. Bring gait lab to everyday life: Gait analysis in terms of activities of daily living. IEEE Internet Things J. 2019, 7, 1298–1312. [Google Scholar] [CrossRef]
- Napier, C.; Esculier, J.F.; Hunt, M.A. Gait retraining: Out of the lab and onto the streets with the benefit of wearables. Br. J. Sport. Med. 2017, 51, 1642–1643. [Google Scholar] [CrossRef] [PubMed] [Green Version]
- Benson, L.C.; Clermont, C.A.; Bošnjak, E.; Ferber, R. The use of wearable devices for walking and running gait analysis outside of the lab: A systematic review. Gait Posture 2018, 63, 124–138. [Google Scholar] [CrossRef] [PubMed]
- Chen, S.; Cunningham, C.L.; Lach, J.; Bennett, B.C. Extracting spatio-temporal information from inertial body sensor networks for gait speed estimation. In Proceedings of the 2011 International Conference on Body Sensor Networks, Dallas, TX, USA, 23–25 May 2011; pp. 71–76. [Google Scholar]
- Muro-De-La-Herran, A.; Garcia-Zapirain, B.; Mendez-Zorrilla, A. Gait analysis methods: An overview of wearable and non-wearable systems, highlighting clinical applications. Sensors 2014, 14, 3362–3394. [Google Scholar] [CrossRef] [PubMed] [Green Version]
- Tao, W.; Liu, T.; Zheng, R.; Feng, H. Gait analysis using wearable sensors. Sensors 2012, 12, 2255–2283. [Google Scholar] [CrossRef]
- Cho, Y.S.; Jang, S.H.; Cho, J.S.; Kim, M.J.; Lee, H.D.; Lee, S.Y.; Moon, S.B. Evaluation of validity and reliability of inertial measurement unit-based gait analysis systems. Ann. Rehabil. Med. 2018, 42, 872. [Google Scholar] [CrossRef] [PubMed] [Green Version]
- Celik, Y.; Stuart, S.; Woo, W.L.; Godfrey, A. Gait analysis in neurological populations: Progression in the use of wearables. Med. Eng. Phys. 2021, 87, 9–29. [Google Scholar] [CrossRef]
- Siciliano, B.; Khatib, O. Springer Handbook of Robotics; Springer: Berlin/Heidelberg, Germany, 2016. [Google Scholar]
- Xenoma. E-Skin MEVA. 2022. Available online: https://www.xenoma.com (accessed on 2 March 2022).
- Steele, R.; Lo, A.; Secombe, C.; Wong, Y.K. Elderly persons’ perception and acceptance of using wireless sensor networks to assist healthcare. Int. J. Med. Inform. 2009, 78, 788–801. [Google Scholar] [CrossRef]
- Ziagkas, E.; Loukovitis, A.; Zekakos, D.X.; Chau, T.D.P.; Petrelis, A.; Grouios, G. A Novel Tool for Gait Analysis: Validation Study of the Smart Insole PODOSmart®. Sensors 2021, 21, 5972. [Google Scholar] [CrossRef] [PubMed]
- Akhtaruzzaman, M.; Shafie, A.A.; Khan, M.R. Gait analysis: Systems, technologies, and importance. J. Mech. Med. Biol. 2016, 16, 1630003. [Google Scholar] [CrossRef]
- Klopfer-Kramer, I.; Brand, A.; Wackerle, H.; Mußig, J.; Kroger, I.; Augat, P. Gait analysis—Available platforms for outcome assessment. Injury 2020, 51, S90–S96. [Google Scholar] [CrossRef] [PubMed]
- Kim, D.; Kwon, J.; Han, S.; Park, Y.L.; Jo, S. Deep full-body motion network for a soft wearable motion sensing suit. IEEE/ASME Trans. Mechatron. 2018, 24, 56–66. [Google Scholar] [CrossRef]
- Nie, B.; Huang, R.; Yao, T.; Zhang, Y.; Miao, Y.; Liu, C.; Liu, J.; Chen, X. Textile-based wireless pressure sensor array for human-interactive sensing. Adv. Funct. Mater. 2019, 29, 1808786. [Google Scholar] [CrossRef]
- Aqueveque, P.; Germany, E.; Osorio, R.; Pastene, F. Gait segmentation method using a plantar pressure measurement system with custom-made capacitive sensors. Sensors 2020, 20, 656. [Google Scholar] [CrossRef] [PubMed] [Green Version]
- Lou, C.; Wang, S.; Liang, T.; Pang, C.; Huang, L.; Run, M.; Liu, X. A graphene-based flexible pressure sensor with applications to plantar pressure measurement and gait analysis. Materials 2017, 10, 1068. [Google Scholar] [CrossRef]
- Zhou, B.; Sundholm, M.; Cheng, J.; Cruz, H.; Lukowicz, P. Measuring muscle activities during gym exercises with textile pressure mapping sensors. Pervasive Mob. Comput. 2017, 38, 331–345. [Google Scholar] [CrossRef]
- Meyer, J.; Lukowicz, P.; Troster, G. Textile pressure sensor for muscle activity and motion detection. In Proceedings of the 2006 10th IEEE International Symposium on Wearable Computers, Montreux, Switzerland, 11–14 October 2006; pp. 69–72. [Google Scholar]
- Stretchsense. Full Hand Motion Capture Solution. 2022. Available online: https://www.stretchsense.com/ (accessed on 17 February 2022).
- Bazarevsky, V.; Grishchenko, I.; Raveendran, K.; Zhu, T.; Zhang, F.; Grundmann, M. BlazePose: On-device Real-time Body Pose tracking. arXiv 2020, arXiv:2006.10204. [Google Scholar]
- Textile Sensors for Gait Analysis Project Github Repository. Available online: https://github.com/labsei/gait_textile (accessed on 18 January 2021).
- Pizarro, F.; Villavicencio, P.; Yunge, D.; Rodríguez, M.; Hermosilla, G.; Leiva, A. Easy-to-build textile pressure sensor. Sensors 2018, 18, 1190. [Google Scholar] [CrossRef] [Green Version]
- Korzeniewska, E.; Szczęsny, A.; Józwik, J.; Tofil, A. Computer measurement of the friction of thin metal structure created in PVD technology on the flexible substrate. MATEC Web Conf. 2019, 252, 09005. [Google Scholar] [CrossRef] [Green Version]
- Christ, M.; Braun, N.; Neuffer, J.; Kempa-Liehr, A.W. Time series feature extraction on basis of scalable hypothesis tests (tsfresh—A python package). Neurocomputing 2018, 307, 72–77. [Google Scholar] [CrossRef]
- Loning, M.; Bagnall, A.; Ganesh, S.; Kazakov, V.; Lines, J.; Király, F.J. sktime: A unified interface for machine learning with time series. arXiv 2019, arXiv:1909.07872. [Google Scholar]
- Ruiz, A.P.; Flynn, M.; Large, J.; Middlehurst, M.; Bagnall, A. The great multivariate time series classification bake off: A review and experimental evaluation of recent algorithmic advances. Data Min. Knowl. Discov. 2021, 35, 401–449. [Google Scholar] [CrossRef] [PubMed]
- Liaw, A.; Wiener, M. Classification and regression by randomForest. R News 2002, 2, 18–22. [Google Scholar]
- Deng, H.; Runger, G.; Tuv, E.; Vladimir, M. A time series forest for classification and feature extraction. Inf. Sci. 2013, 239, 142–153. [Google Scholar] [CrossRef] [Green Version]
- Le Nguyen, T.; Gsponer, S.; Ilie, I.; O’Reilly, M.; Ifrim, G. Interpretable time series classification using linear models and multi-resolution multi-domain symbolic representations. Data Min. Knowl. Discov. 2019, 33, 1183–1222. [Google Scholar] [CrossRef]


| Participant 1 | Participant 2 | Participant 3 | All Participants | |
|---|---|---|---|---|
| Age | 27 | 29 | 24 | 27 |
| Height | 1.61 m | 1.76 m | 1.74 m | 1.70 m |
| Weight | 66 kg | 75 kg | 83 kg | 75 kg |
| BMI | 25.3 | 24.3 | 27.4 | 25.7 |
| Participant 1 | Participant 2 | Participant 3 | |
|---|---|---|---|
| Raw data | 90,455 | 92,201 | 94,092 |
| Data without NC | 46,357 | 47,170 | 47,272 |
| Pre-processed data | 46,192 | 47,151 | 47,244 |
| Percentage used | 51.06% | 51.16% | 50.21% |
| Class | Participant 1 | Participant 2 | Participant 3 |
|---|---|---|---|
| RSTLST | 99.53 | 99.79 | 99.39 |
| RSTLSW | 76.81 | 80.06 | 89.55 |
| RSWLST | 87.53 | 89.76 | 87.94 |
| Participant 1 | Participant 2 | Participant 3 | All Participants | |||||
|---|---|---|---|---|---|---|---|---|
| Algorithm | IMU | Textile | IMU | Textile | IMU | Textiles | IMU | Textile |
| Rand Forest | 92.77 | 89.91 | 93.29 | 92.72 | 93.24 | 89.84 | 92.00 | 91.22 |
| Time Series F. | 92.05 | 89.57 | 93.35 | 92.25 | 92.80 | 89.47 | 92.85 | 90.53 |
| Mr-SEQL | 36.62 | 84.34 | 38.05 | 81.87 | 40.70 | 78.11 | 36.80 | 78.97 |
Publisher’s Note: MDPI stays neutral with regard to jurisdictional claims in published maps and institutional affiliations. |
© 2022 by the authors. Licensee MDPI, Basel, Switzerland. This article is an open access article distributed under the terms and conditions of the Creative Commons Attribution (CC BY) license (https://creativecommons.org/licenses/by/4.0/).
Share and Cite
Milovic, M.; Farías, G.; Fingerhuth, S.; Pizarro, F.; Hermosilla, G.; Yunge, D. Detection of Human Gait Phases Using Textile Pressure Sensors: A Low Cost and Pervasive Approach. Sensors 2022, 22, 2825. https://doi.org/10.3390/s22082825
Milovic M, Farías G, Fingerhuth S, Pizarro F, Hermosilla G, Yunge D. Detection of Human Gait Phases Using Textile Pressure Sensors: A Low Cost and Pervasive Approach. Sensors. 2022; 22(8):2825. https://doi.org/10.3390/s22082825
Chicago/Turabian StyleMilovic, Matko, Gonzalo Farías, Sebastián Fingerhuth, Francisco Pizarro, Gabriel Hermosilla, and Daniel Yunge. 2022. "Detection of Human Gait Phases Using Textile Pressure Sensors: A Low Cost and Pervasive Approach" Sensors 22, no. 8: 2825. https://doi.org/10.3390/s22082825